Control a standardized CMYK Mediawedge range
The certificate obtained will guarantee your customers that your proof has been reproduced under the conditions defined by the Fogra or IDEAlliance standards.
In this tutorial, we will learn how to measure a Fogra Mediawedge v3.0 range and edit a measurement report to check a proof against the Fogra 39 standard.
To perform checks against other standards or other types of ranges, we will use the exact same method.
Coraye uses the Print Control .pctrl format to store measurements and range control.
The "Print Control .pctrl" file contains all the information concerning the control range and the data associated with it.
Reminder: during the step of creating the Print Control file, it is added to the left column of the Coraye interface
If this is not present, you will have to import it or create a new one.
In the chapter "Creating a Standard CMYK Proof Reference" you will learn how to create your own .pctrl files
For more information, see chapter: Creating a reference for Standard CMYK Proof.
How to import a Print Control File (.pctrl)
The first step is to import the .pctrl files
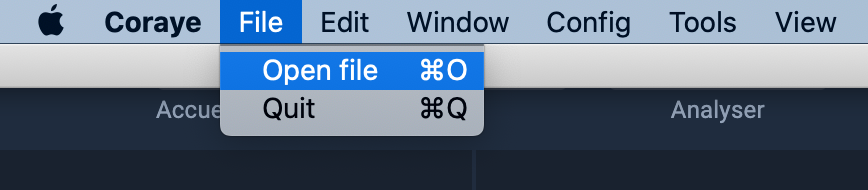
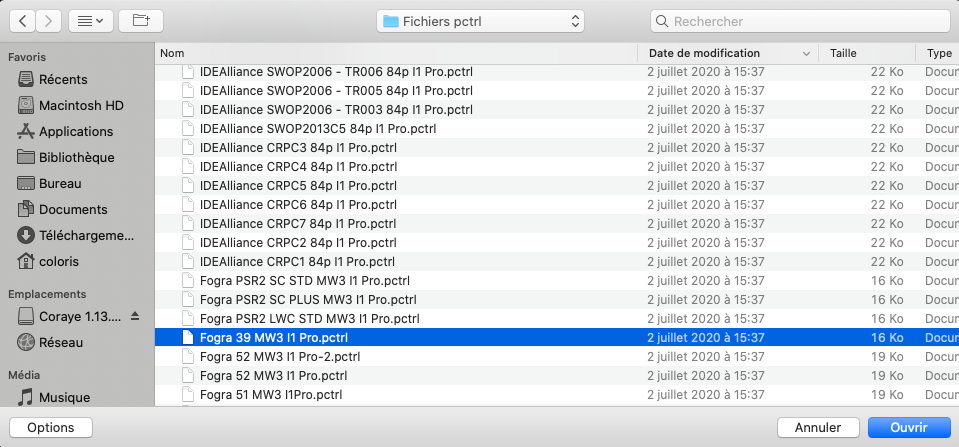
We will therefore start by importing the one from the Fogra 39 Mediawedge v3.0 measurable with the XRite I1 Pro2 spectrophotometer. From Coraye, File / Open file then select the .pctrl file to import.
Beginning of the measurement procedure of the Mediawedge range
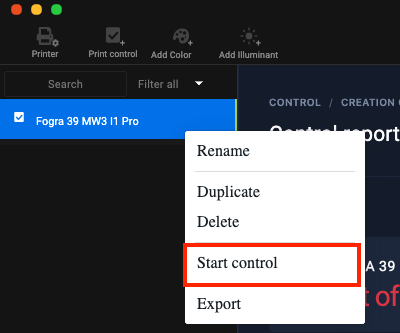
To start the measurement, select the " Start control " command by right-clicking on the .pctrl file located in the left column.
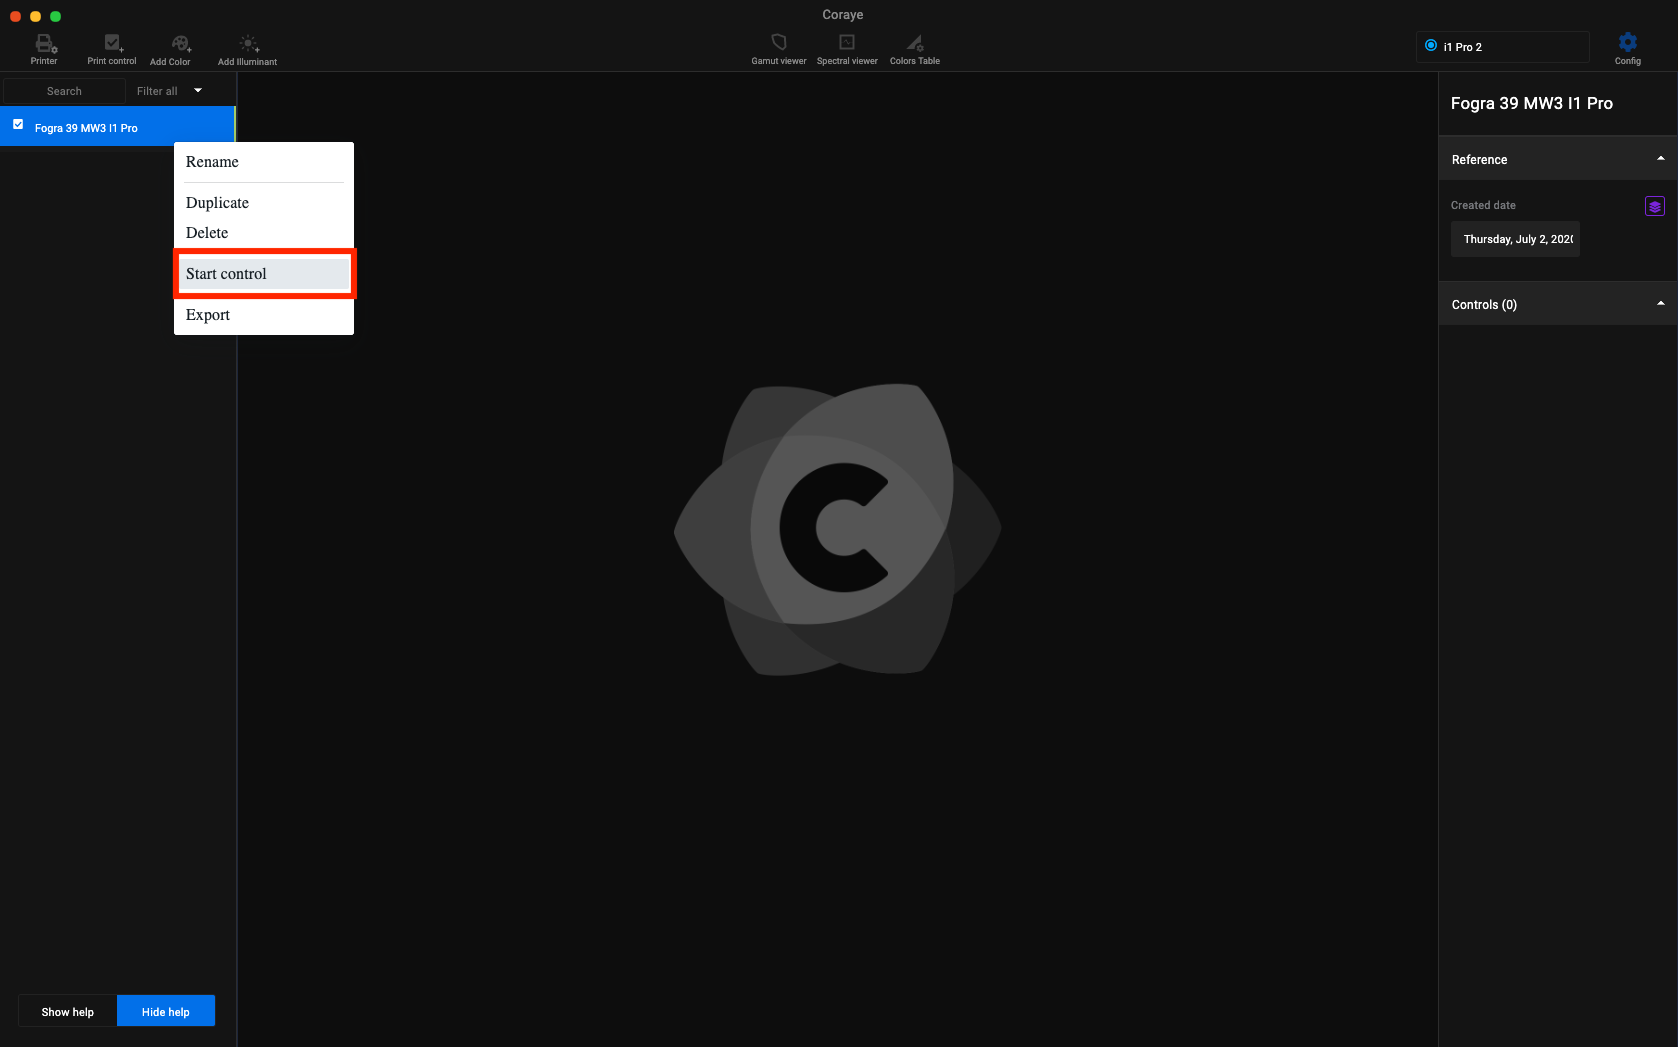
The test chart associated with the Print Control file appears
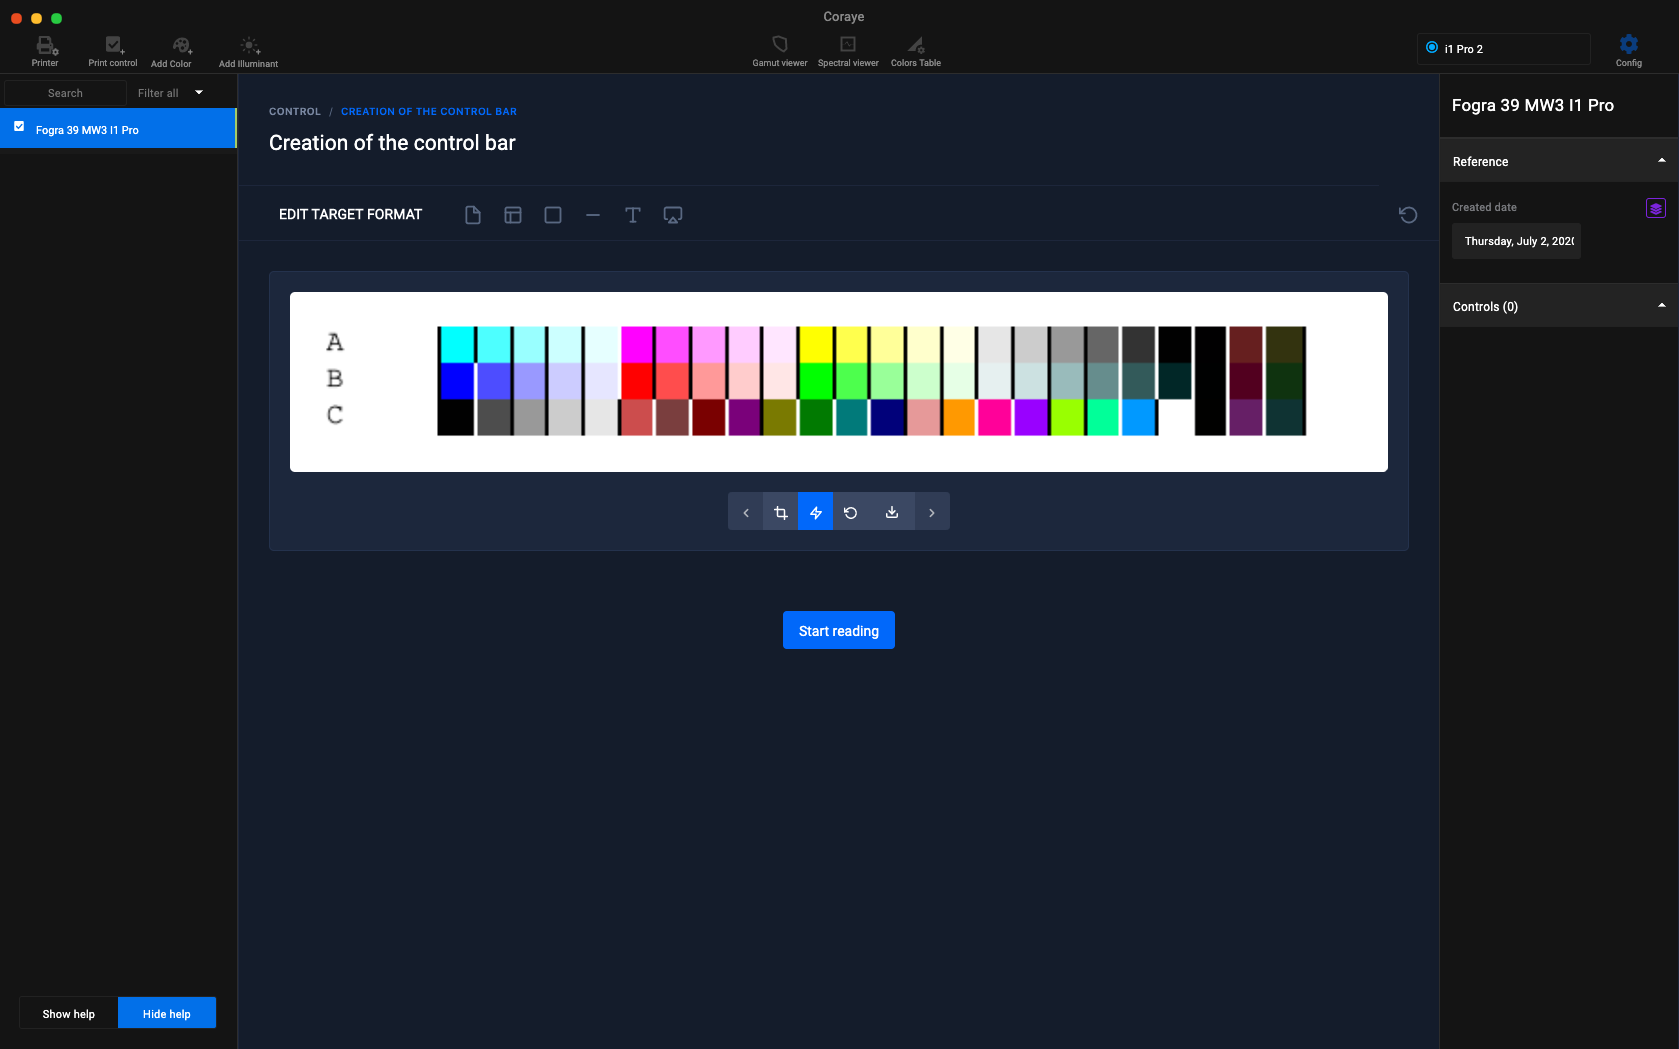
Printing the range
If the range you want to check is not already printed, you can save it in Tiff or Pdf format for printing in your proofing system.

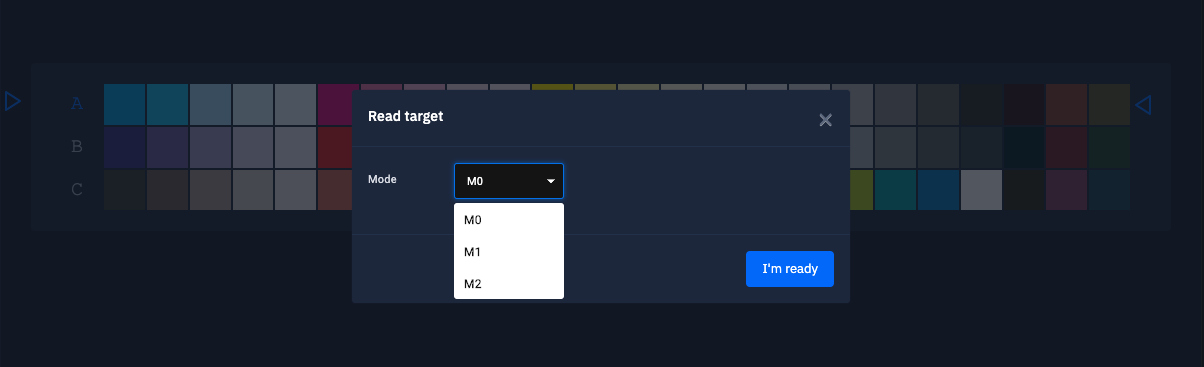
When you are ready to measure the printed range, click on the " Start reading " button. Then select the measurement mode according to the reference standard and the possibilities of your measuring instrument.
In our example, we will select the M0 mode corresponding to the Fogra 39 standard. Click on " I'm Ready " to start the measurement
Before starting the measurement, it is necessary to calibrate the spectrophotometer.
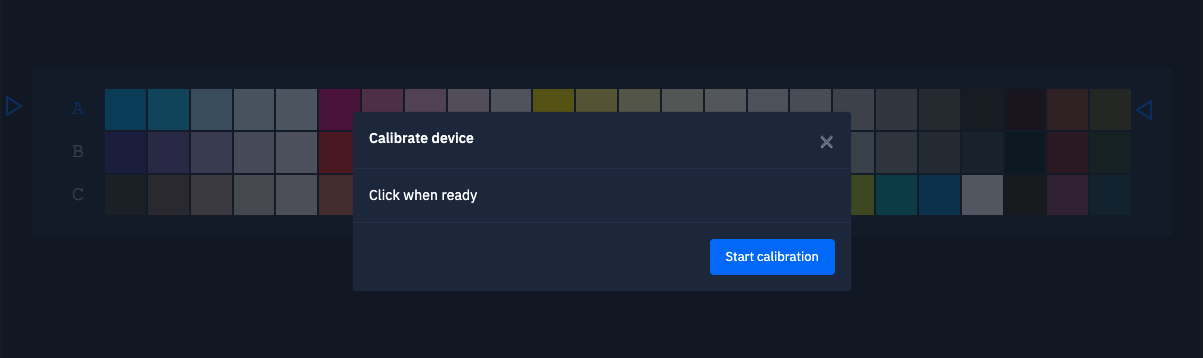
Position the spectrophotometer on its reference ceramic before clicking on the " Start Calibration " button

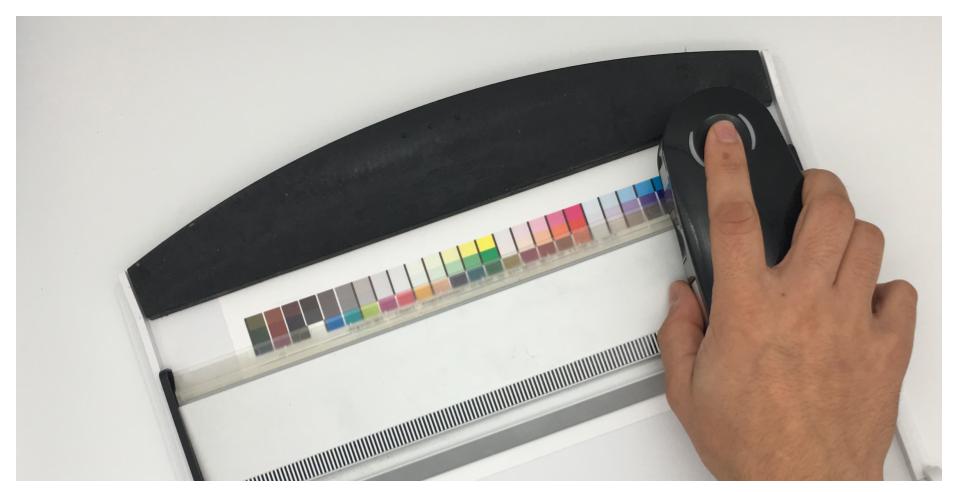
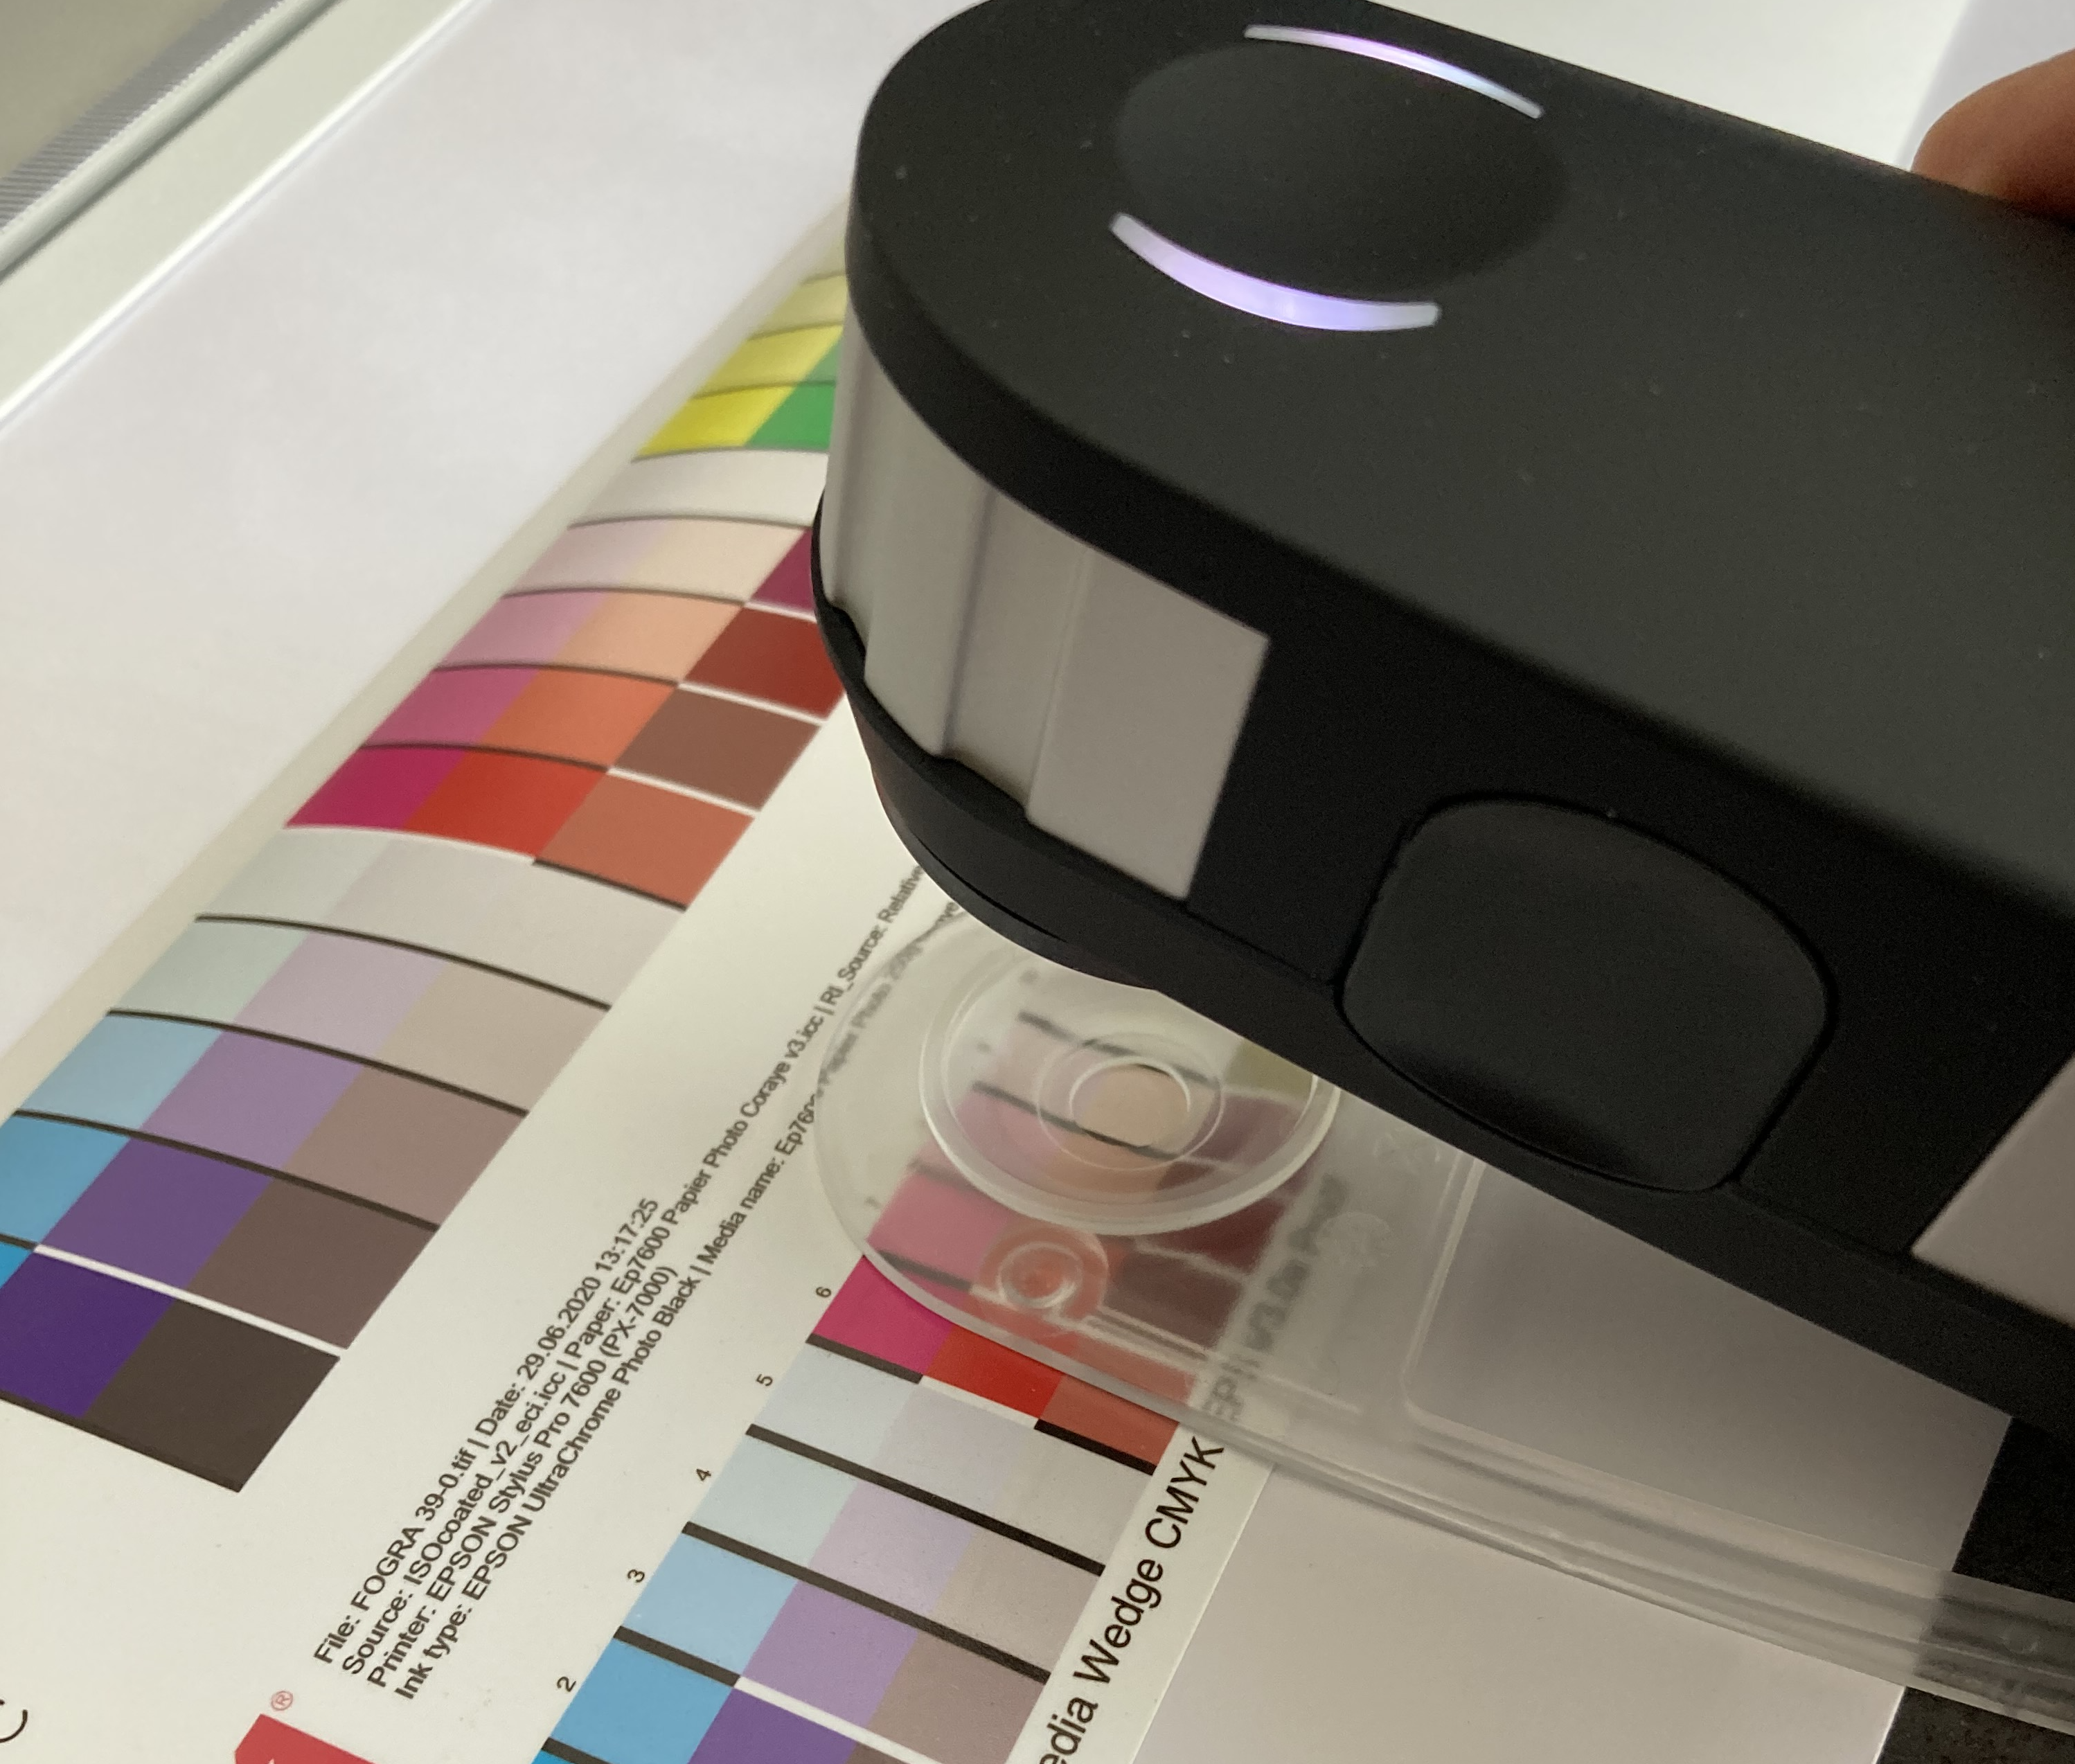
Start measuring the range
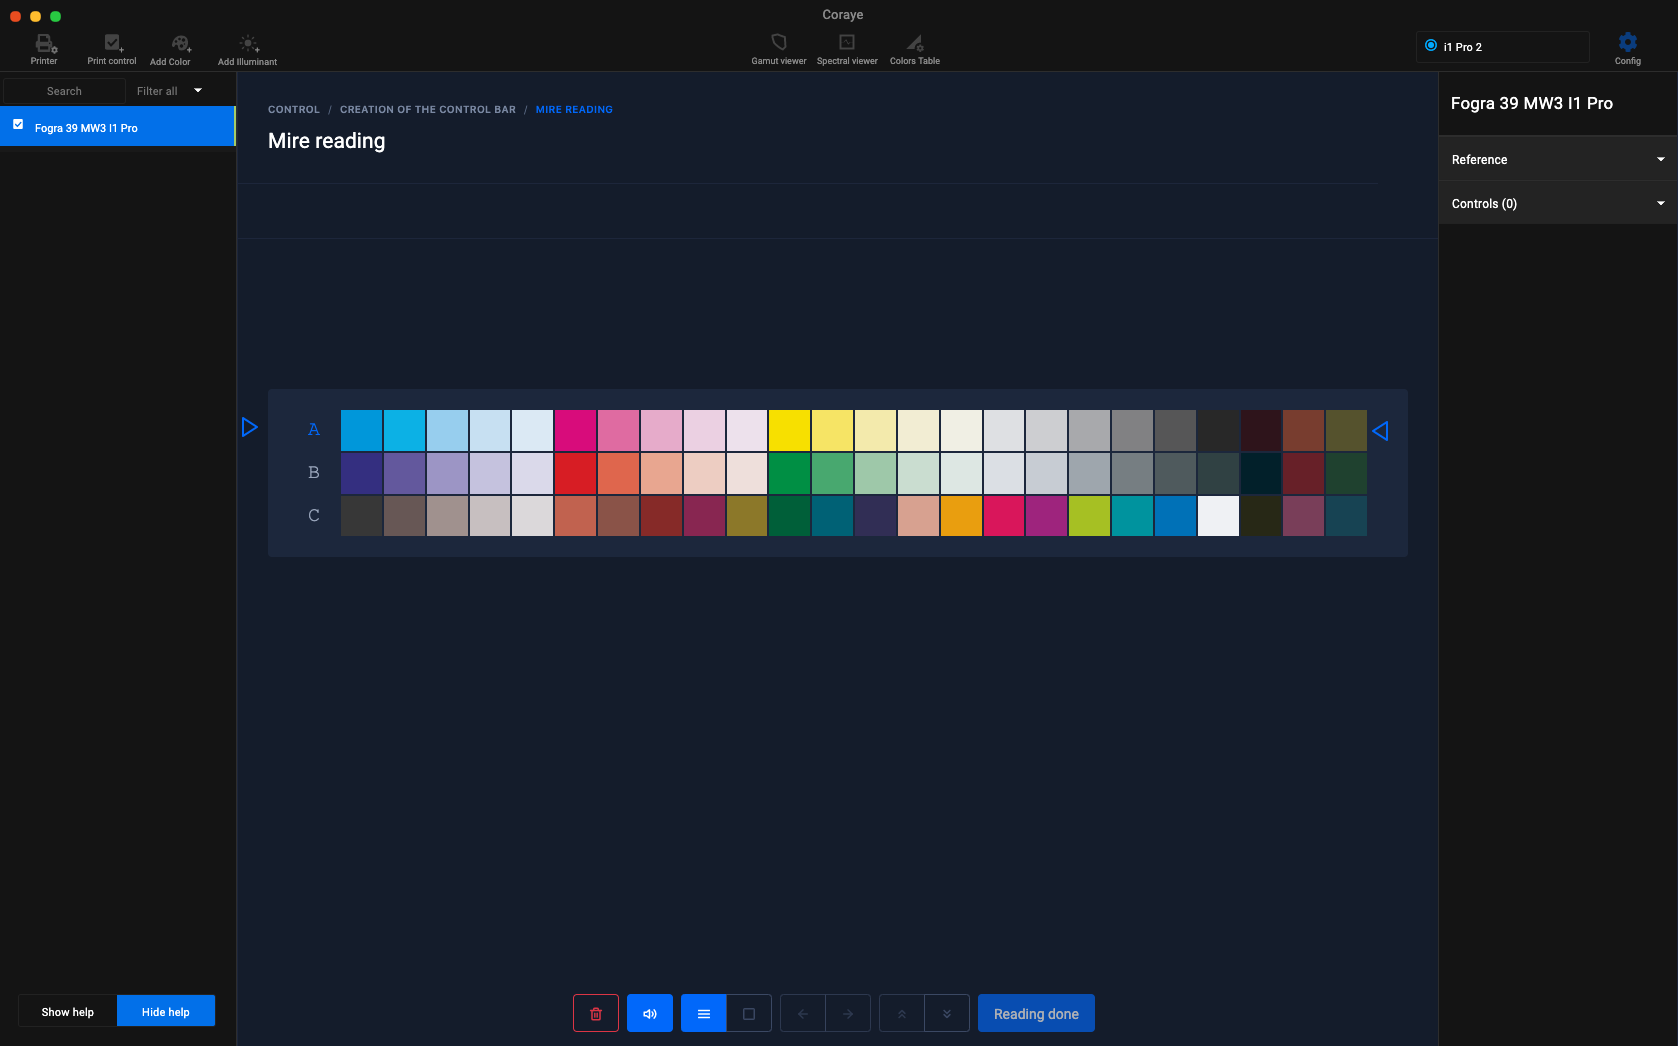
Position the spectrophotometer on its ruler so that the lines are measured one by one, starting and ending with the blank to the right and left of the range.
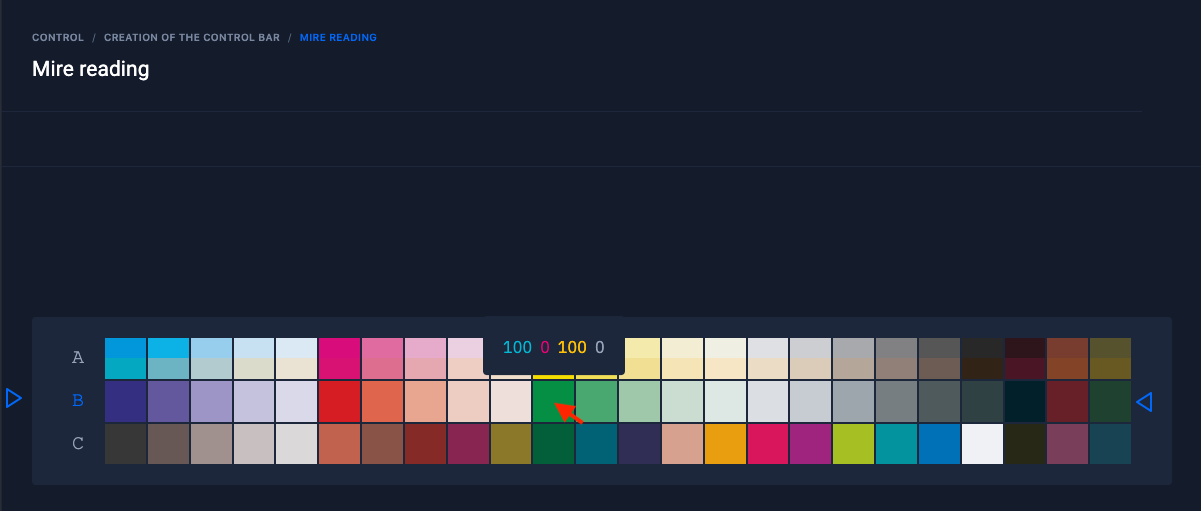
The line to be measured is indicated by the blue arrows on the left and right on the screen. By hovering over the patches already measured, the information on the Delta E, H and Ch as well as the CMYK values appear (For the RGB ranges, you will see the RGB values appear).

Regarding patches not yet measured, only CMYK (or RGB) values will appear when hovering over the patch.
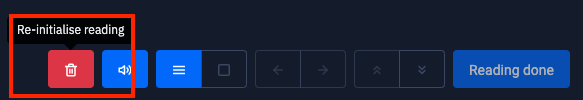
Icons located at the bottom of the measurement window
Resetting the measurement
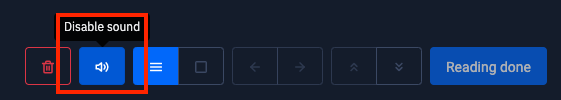
Enabling or disabling sound during measurement
Note that the strength of the beep depends on the sound setting of your computer.
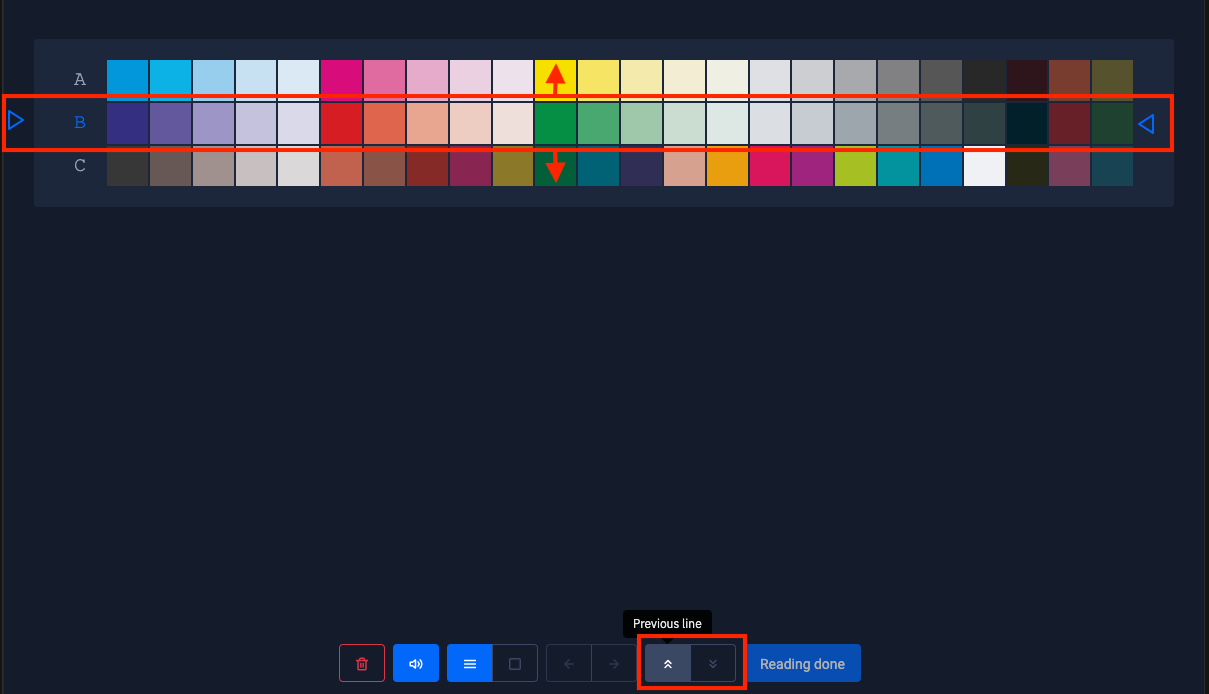
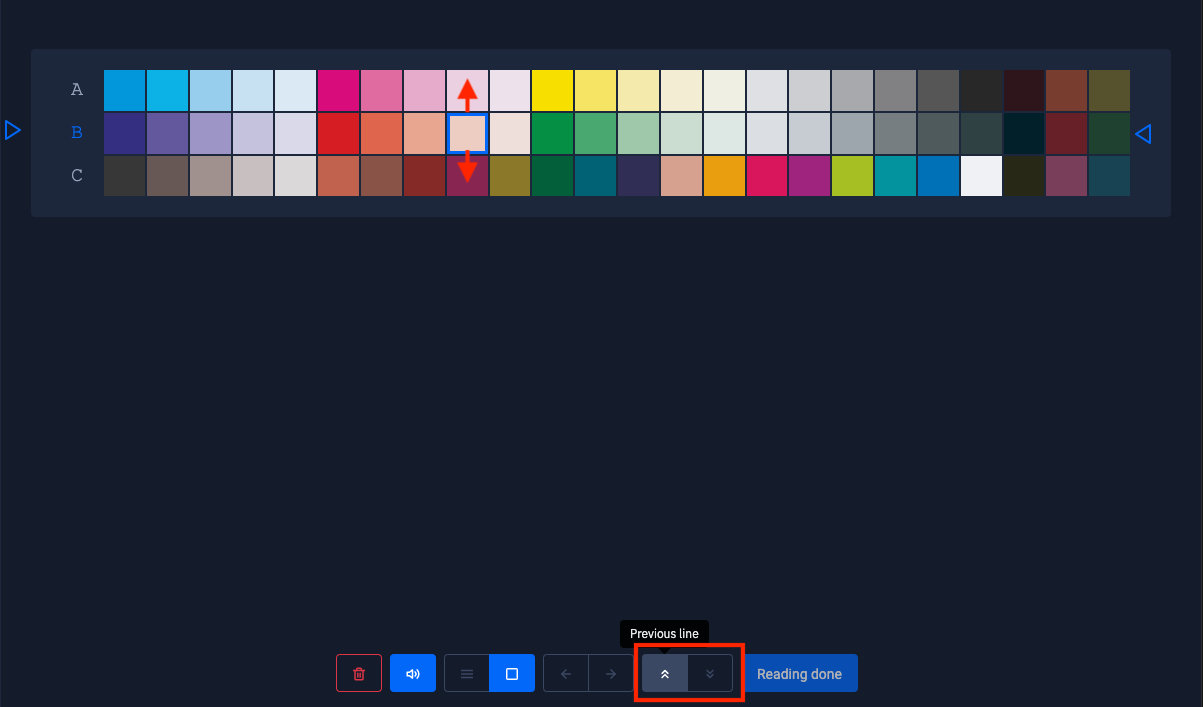
Row reading mode (default)

In this mode you can change line using the " Next line " or " Previous line " buttons. The "Up" and "Down" keys and clicking to the left of the letter associated with the line also allows you to change lines.
CAUTION: If you click in a patch, the software will go into patch reading mode and request a calibration.
Patch-by-patch playback mode
By clicking on the icon, " Patches reading mode " the software goes into patch by patch measurement mode and requests a calibration. This mode is useful if you cannot measure a line. You can enter and exit this mode at any time during the range measurement procedure.
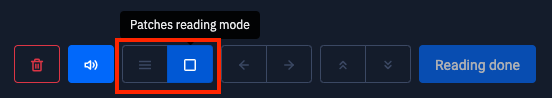
The " Patches reading mode " mode requires equipping the spectrophotometer with its measurement accessory used to measure the samples.
In this mode you can change the box by using the buttons " Next patch " to go to the right or " Previous patch " to return to the left. The "Right" and "Left" keys also allow you to move around in the staff.
CAUTION: Clicking to the left of the letter associated with the line exits "Patches reading mode" and returns you to "Line Mode" and requires a new calibration of the spectrophotometer.
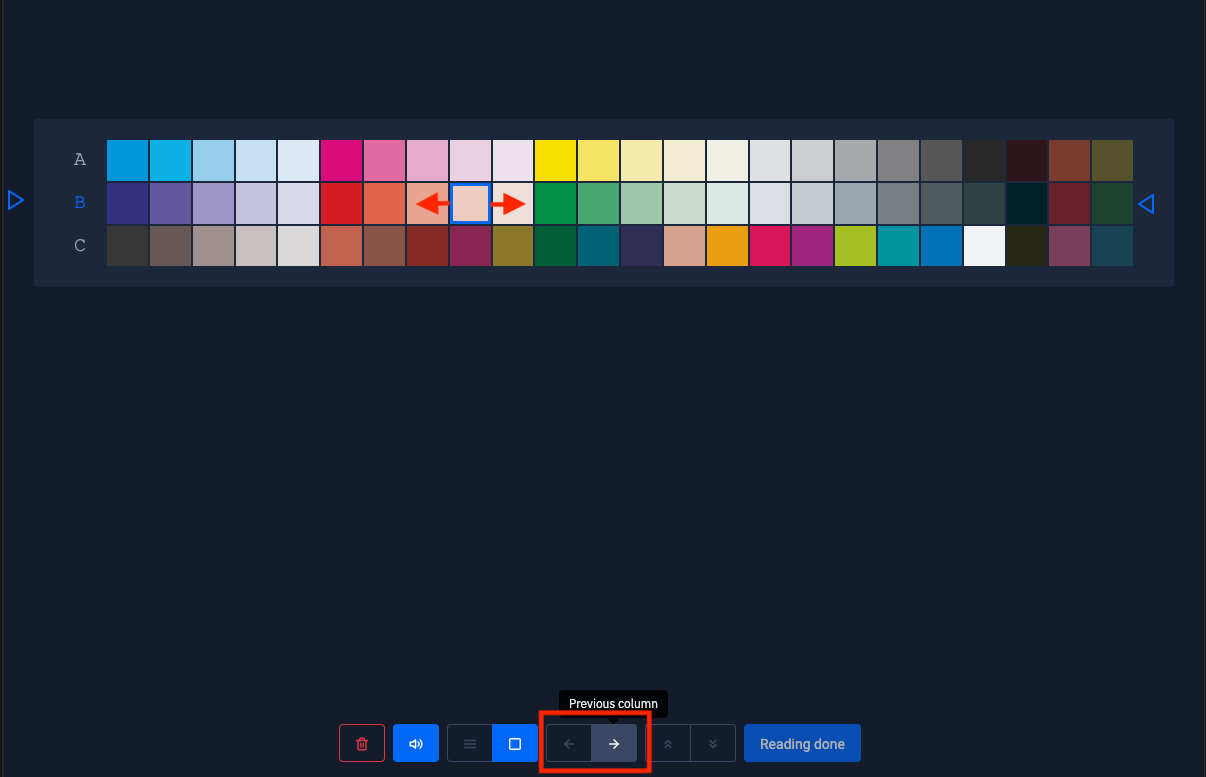
In this mode you can move up or down using the " Next line " buttons to go down, or " Previous line " to return up. The "Up" and "Down" keys also allow you to move around in the staff.
By clicking on a box with the mouse, you can directly access the selected patch.
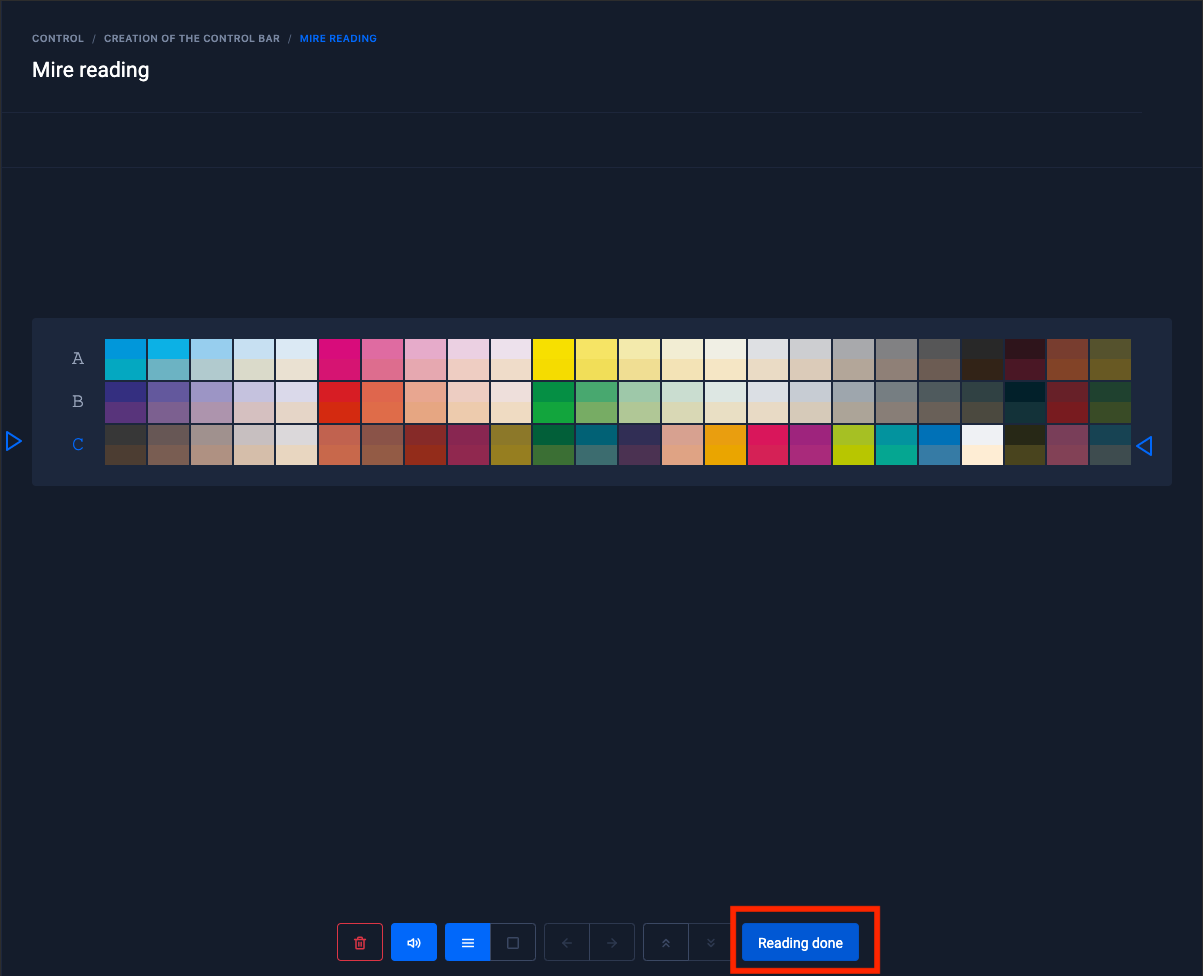
When the test pattern is finished, click on " Reading done " to go to the reading report.
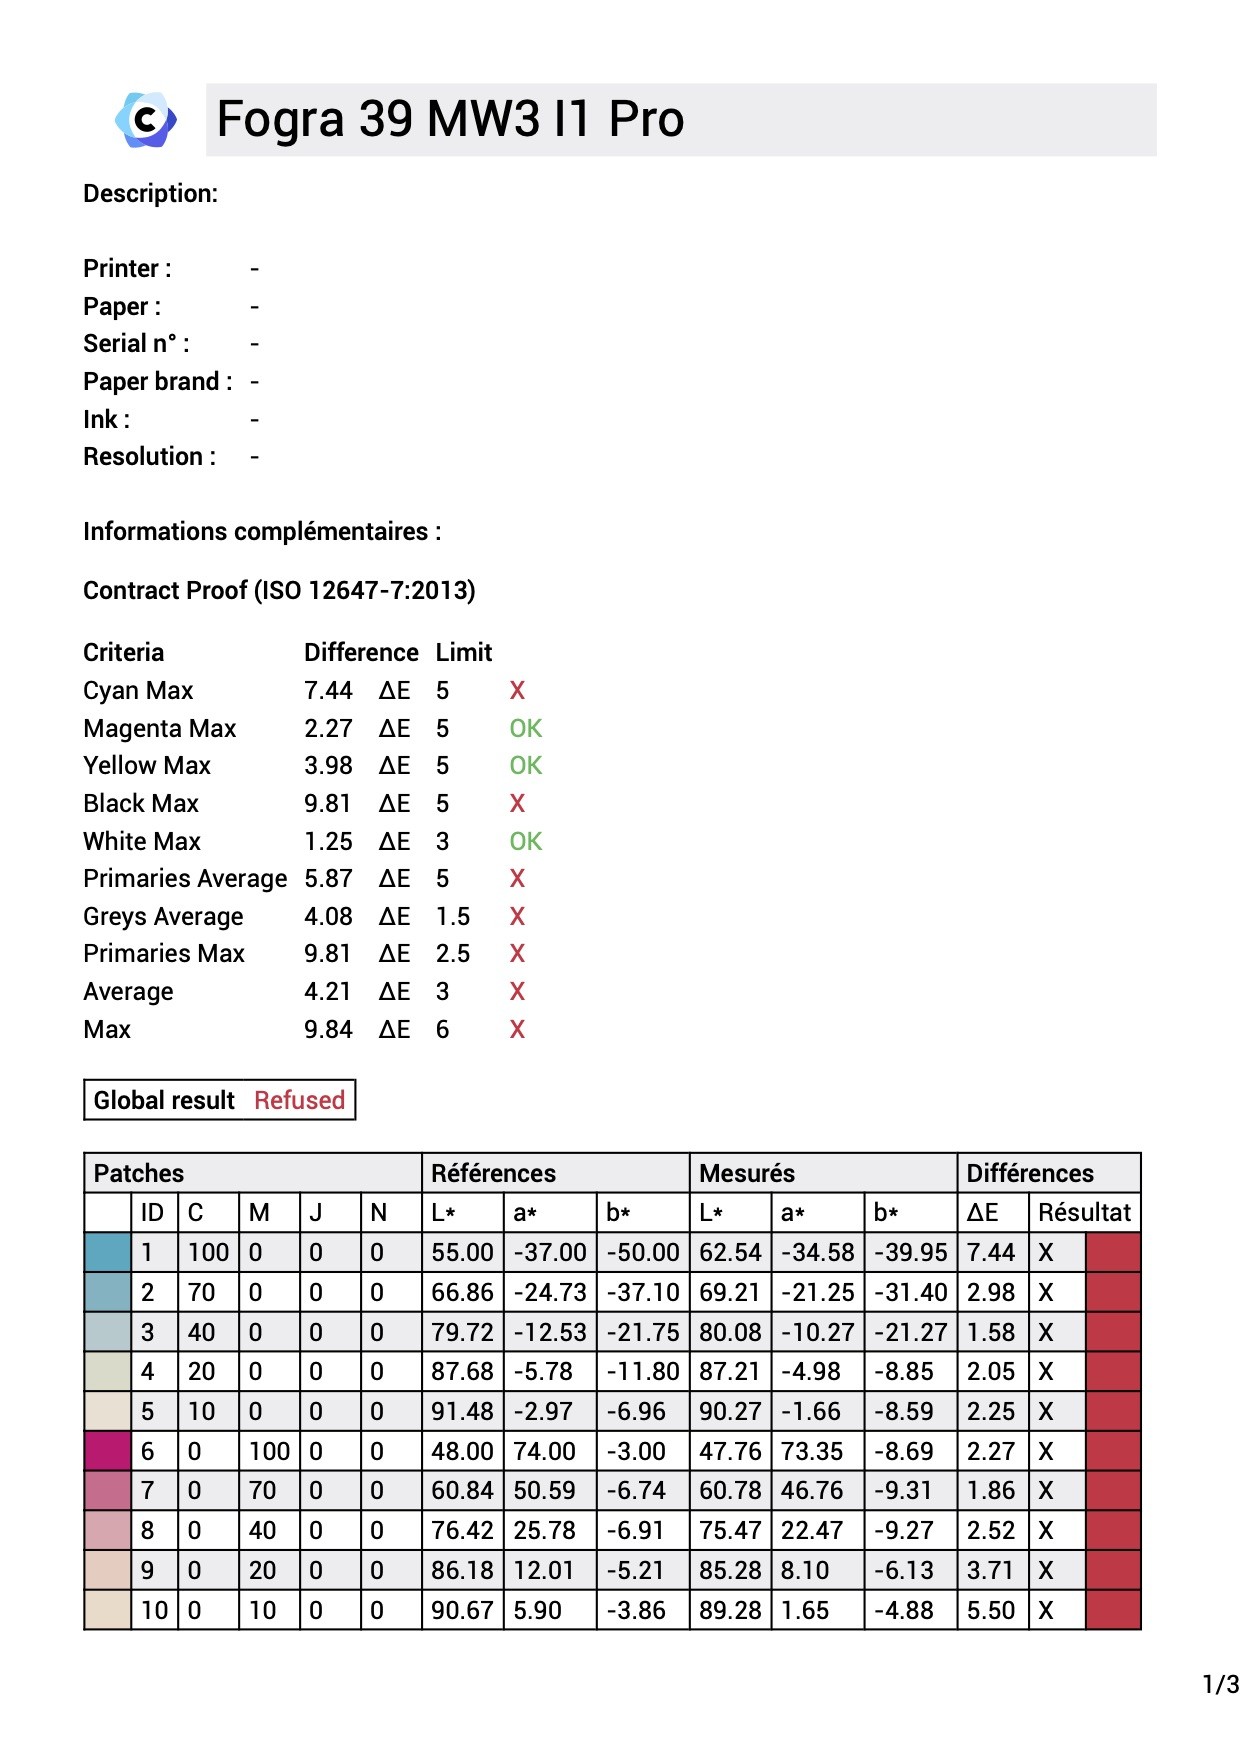
Reading report
The measurement report consists of two parts:
The upper part displays the short report
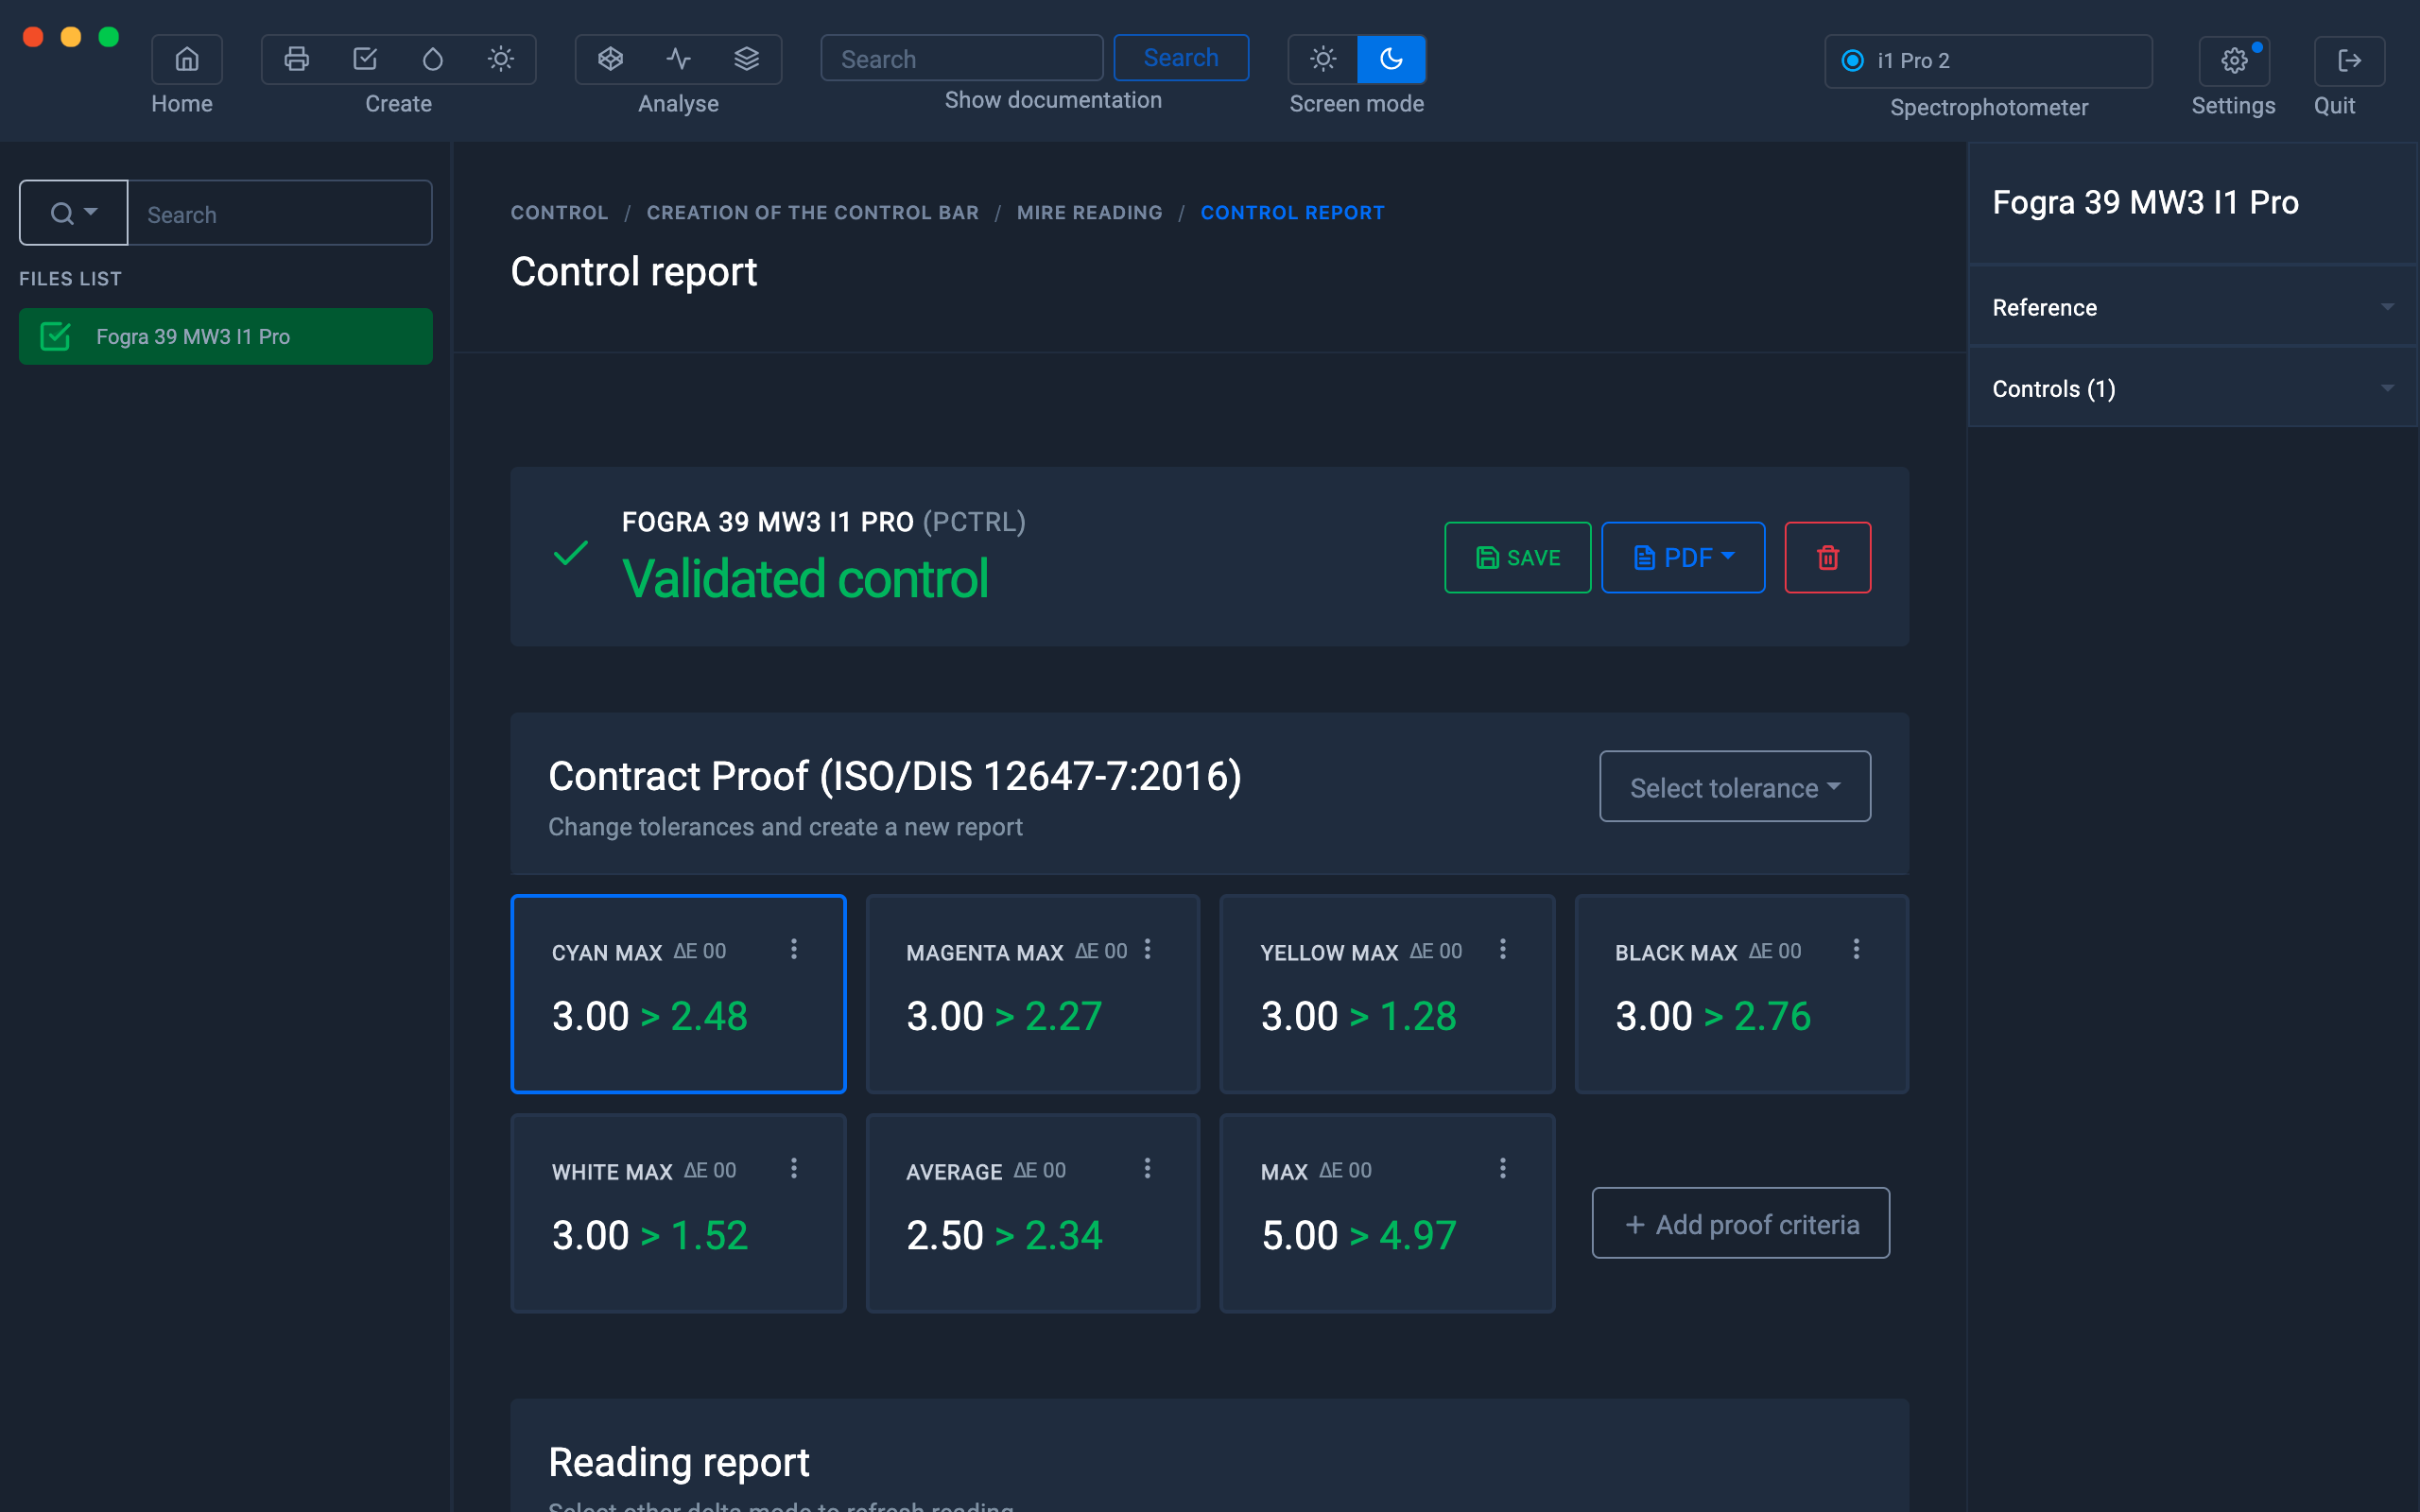
The lower part displays the long report

Whether for UGRA, Fogra or IDEAlliance, the tolerances associated with the different standards are automatically updated via our database.
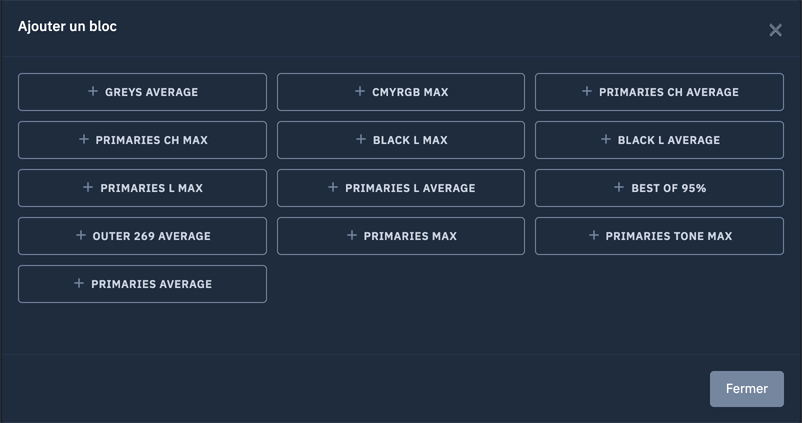
It is also possible to customize the report by adding controls. Just click on the " + Add block " button to access the available controls.
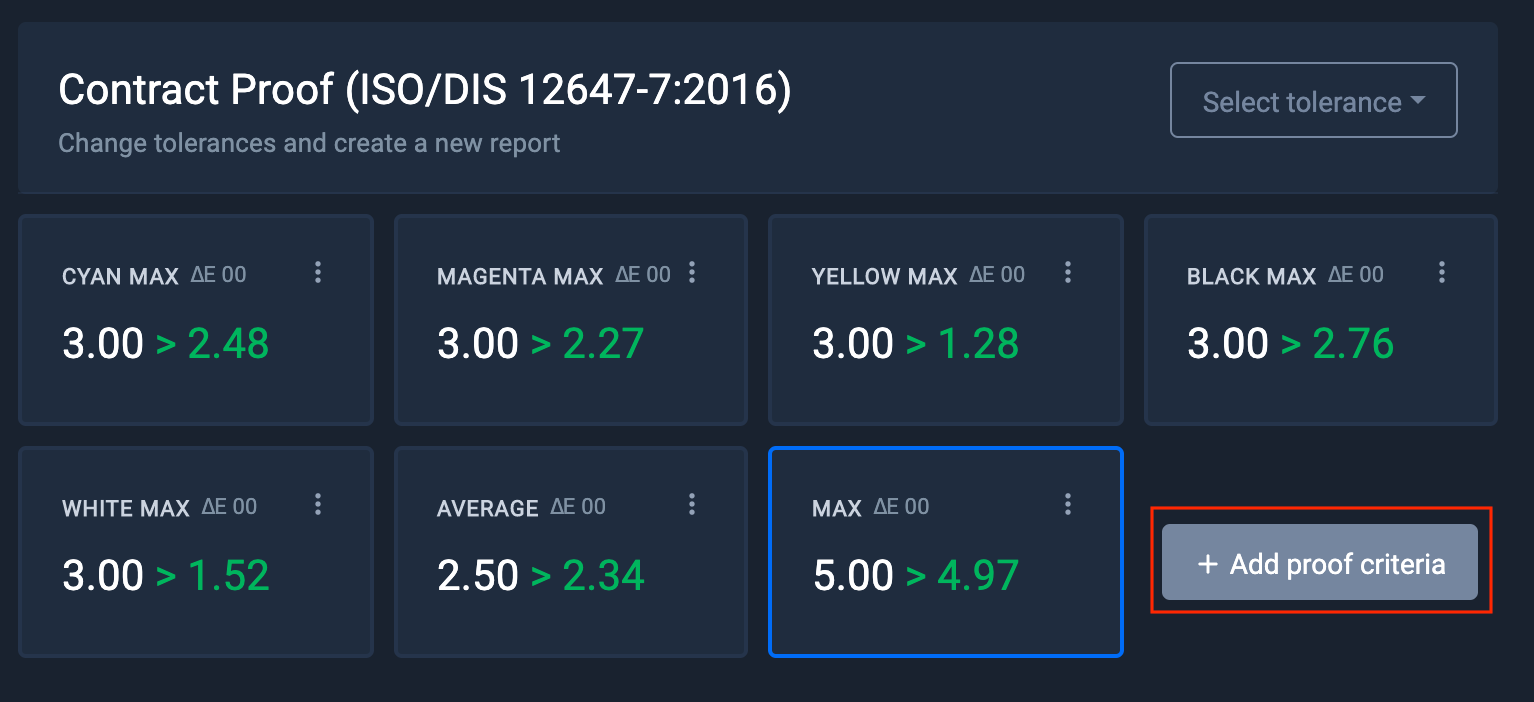
All unused controls are available to customize the Print Control. Just click on the blocks to add them to the list.
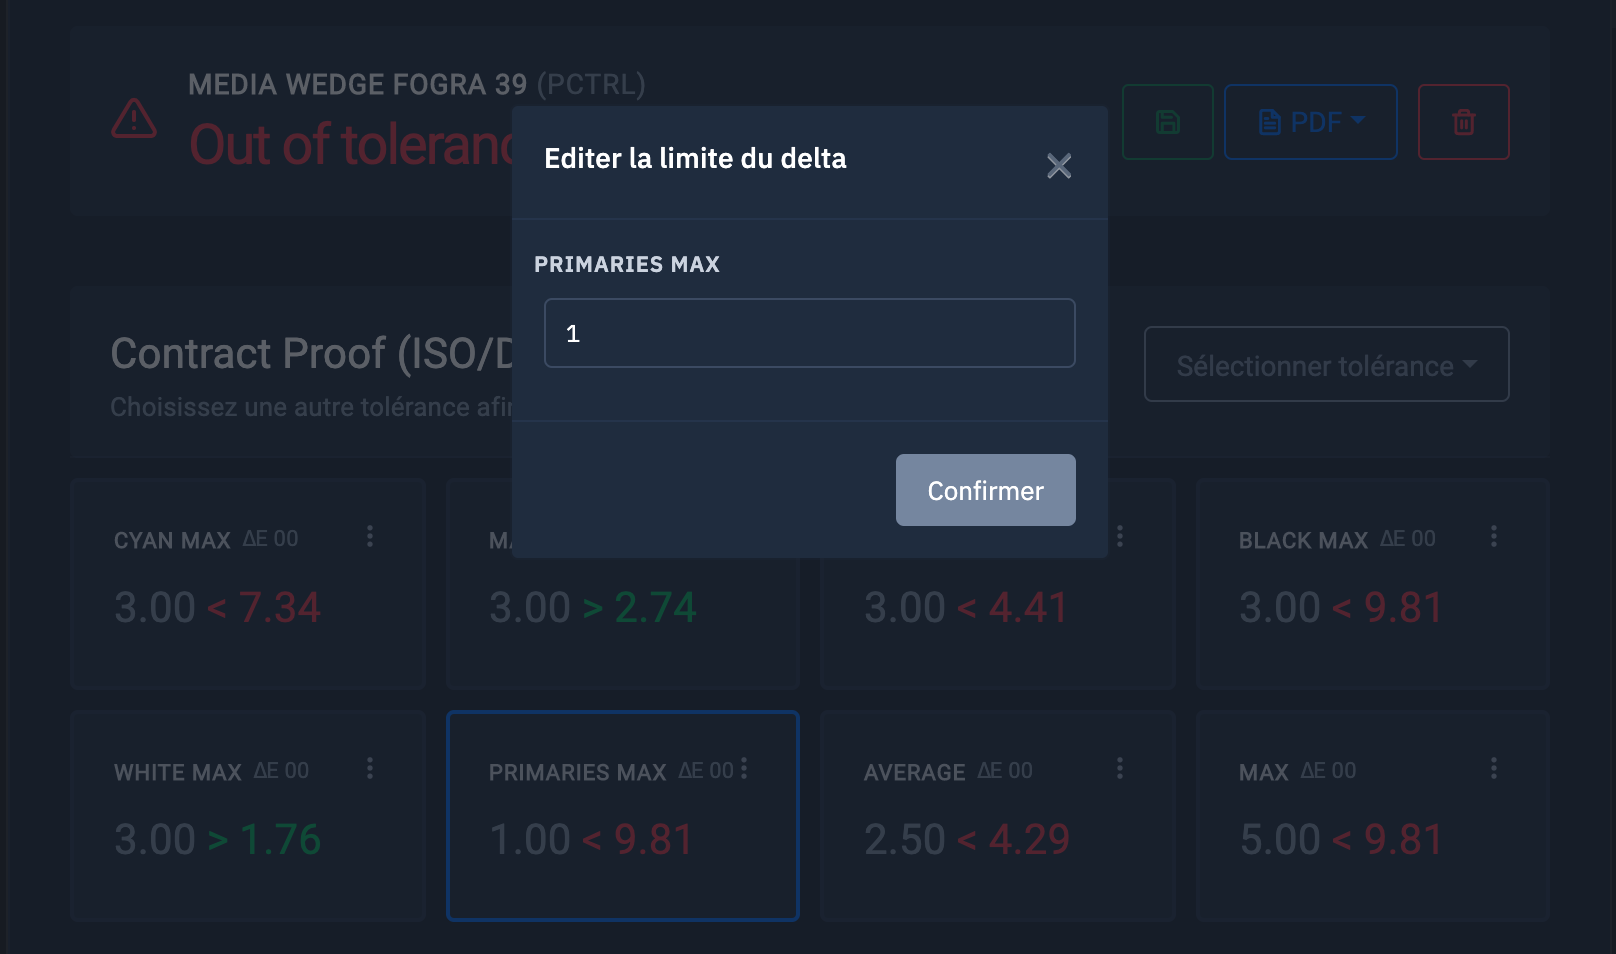
To edit or delete a block, click on the three small dots located at the top right of the block.
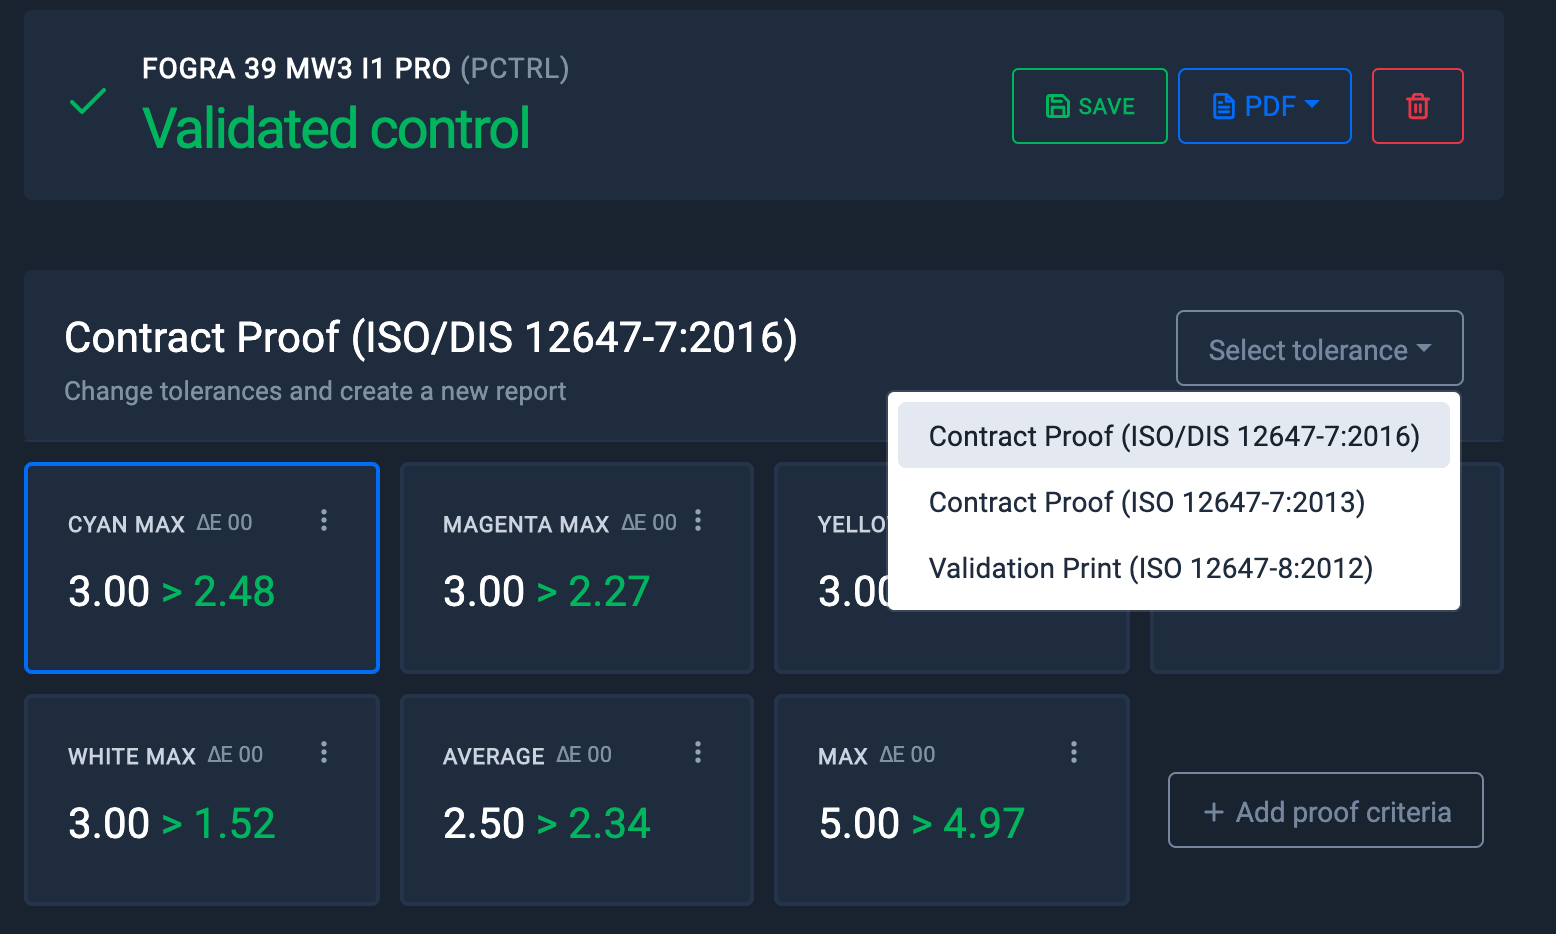
If you modify a standard tolerance set, "-Edited" is automatically added after the name of the tolerance.

When you edit a tolerance, a window appears to modify the value of the original tolerance.
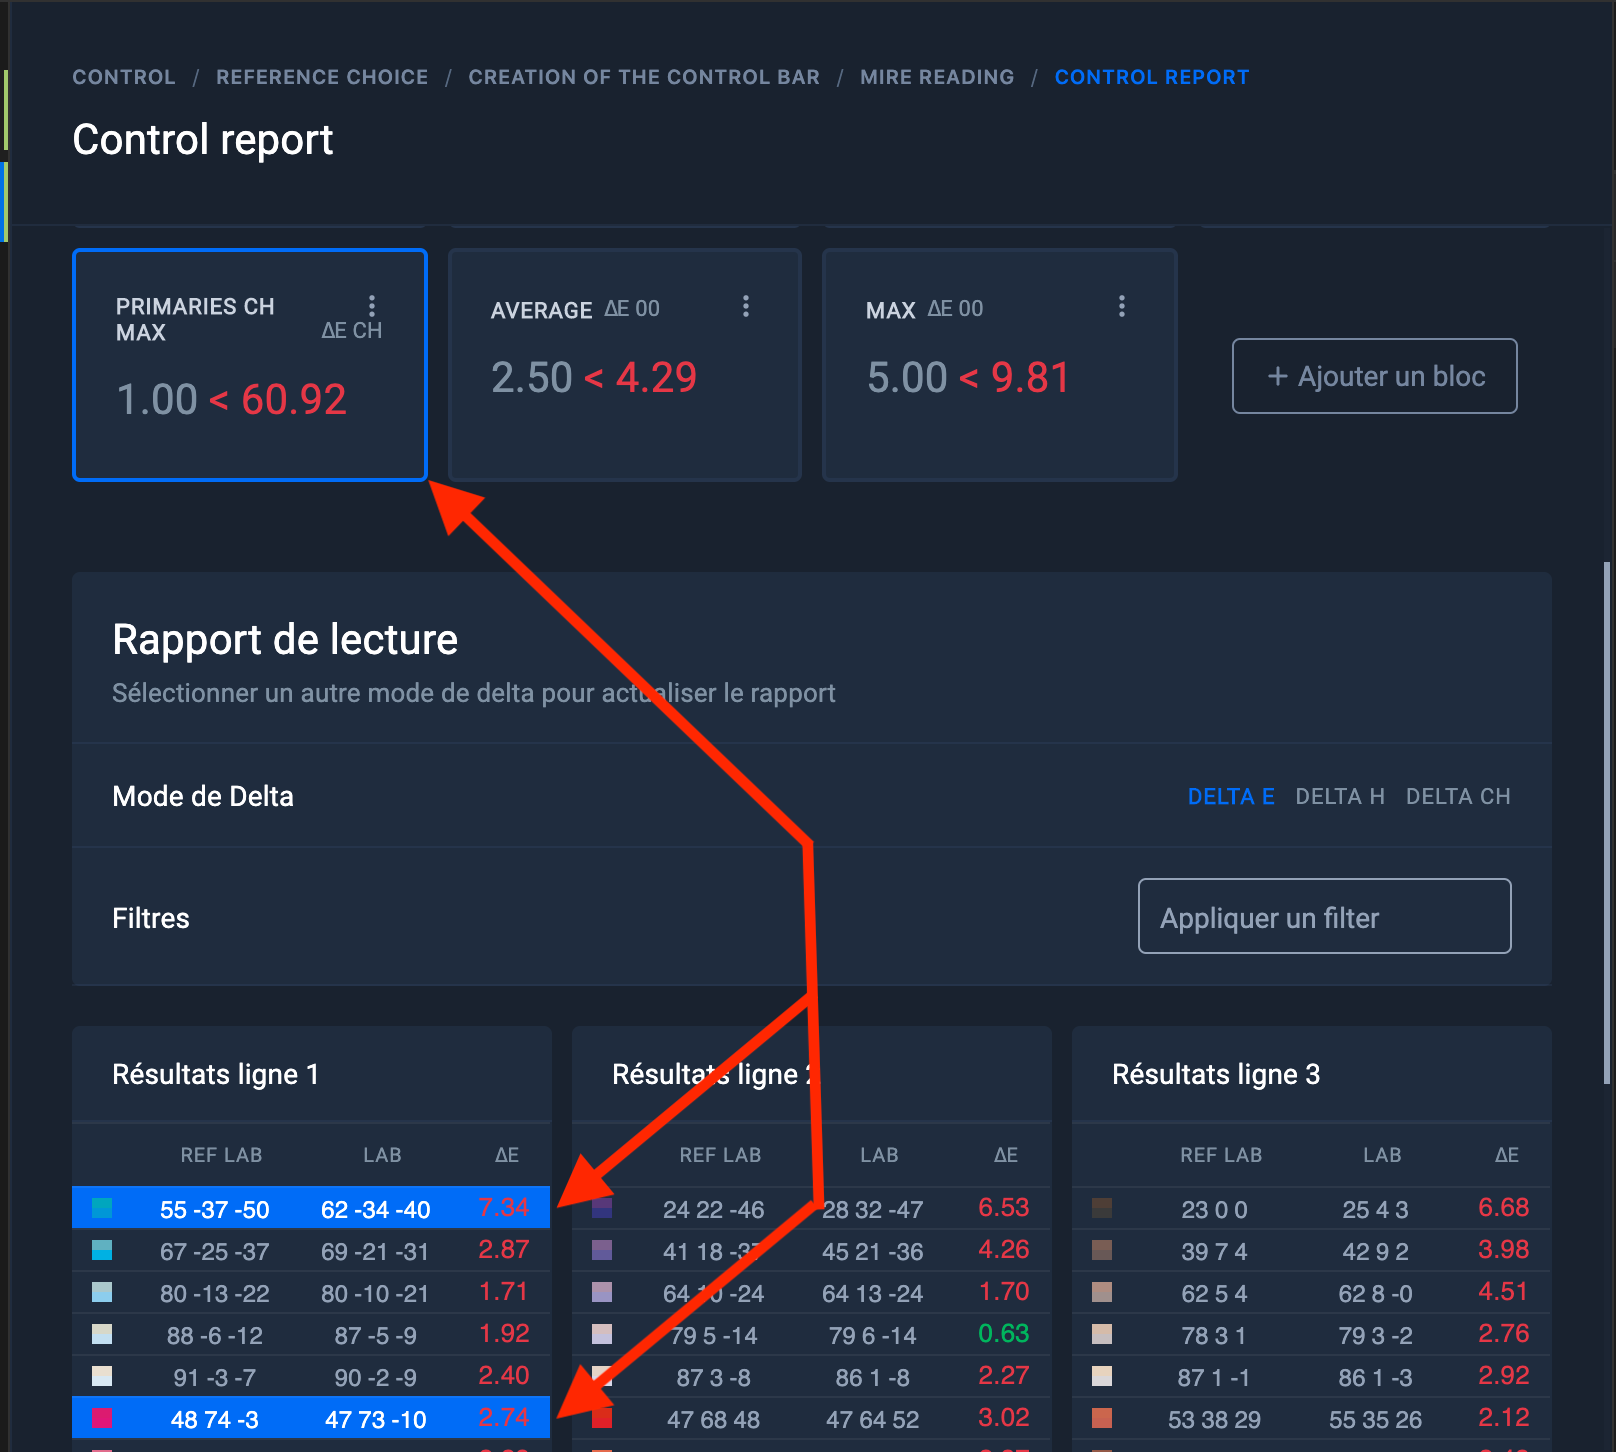
By clicking on one of the blocks, the colors associated with the tolerance calculation are highlighted in blue in the long report.
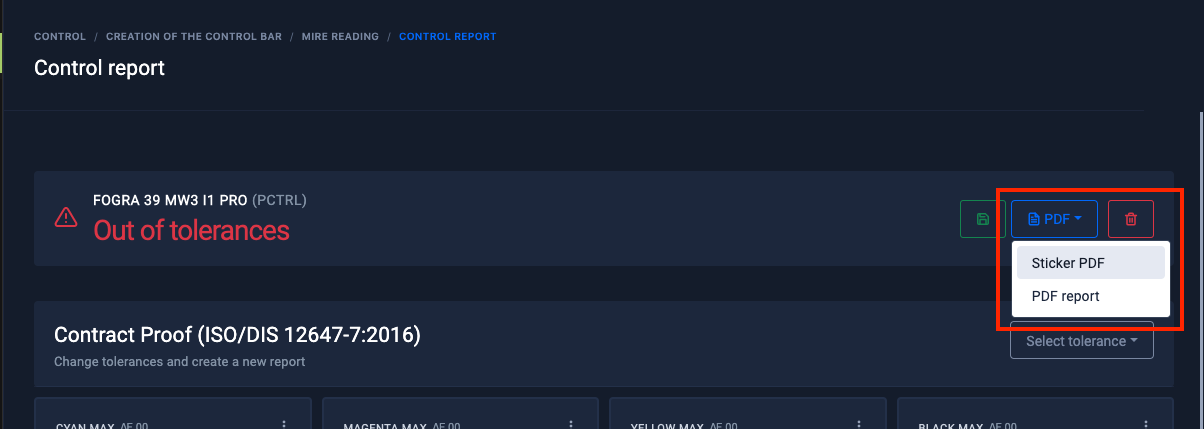
Printing the label and long report
Two types of report are available in pdf format:
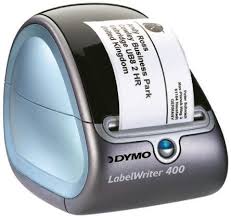
Label format , ready to print on a Dymo 400 or 450 type printer
Labels Type: LW Name Badge Labels, 54mm x 101mm SKU: S0722430
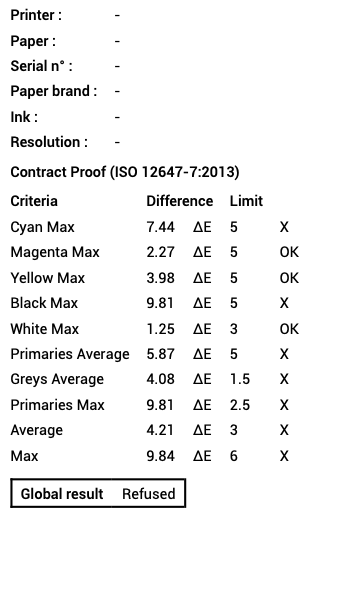
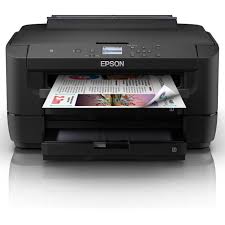
The Full Report , in A4 format, containing the short report and the long report.
This report in pdf format may contain several pages, depending on the number of patches measured.
It is recommended to print it on a color laser printer.
 |
|
Successive measurements
To start successive measurements, right-click on the " Print Control " file, then select " Start control "
The second measurement will be added to the history of the " Print Control " file. Information to quantify the difference with the previous measurement will be added in each of the blocks.
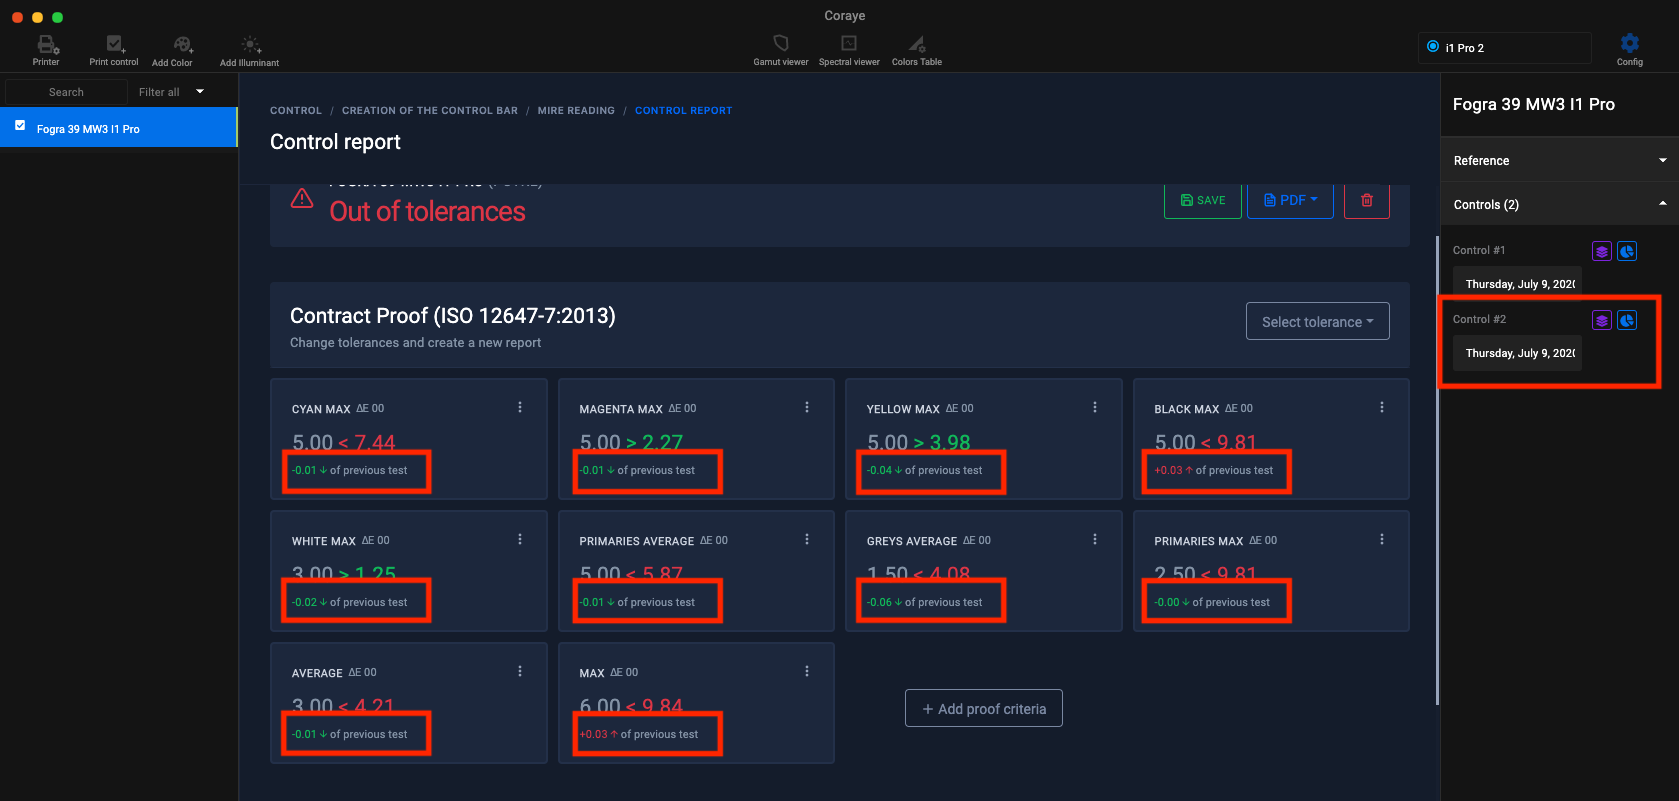
The history of reports can be viewed by clicking on the blue icon. It is possible to transform the measured values into a color table by clicking on the purple icon.

Trend curves
From version 1.23.0, an evolution curve is displayed under each parameter to monitor the evolution of your prints.

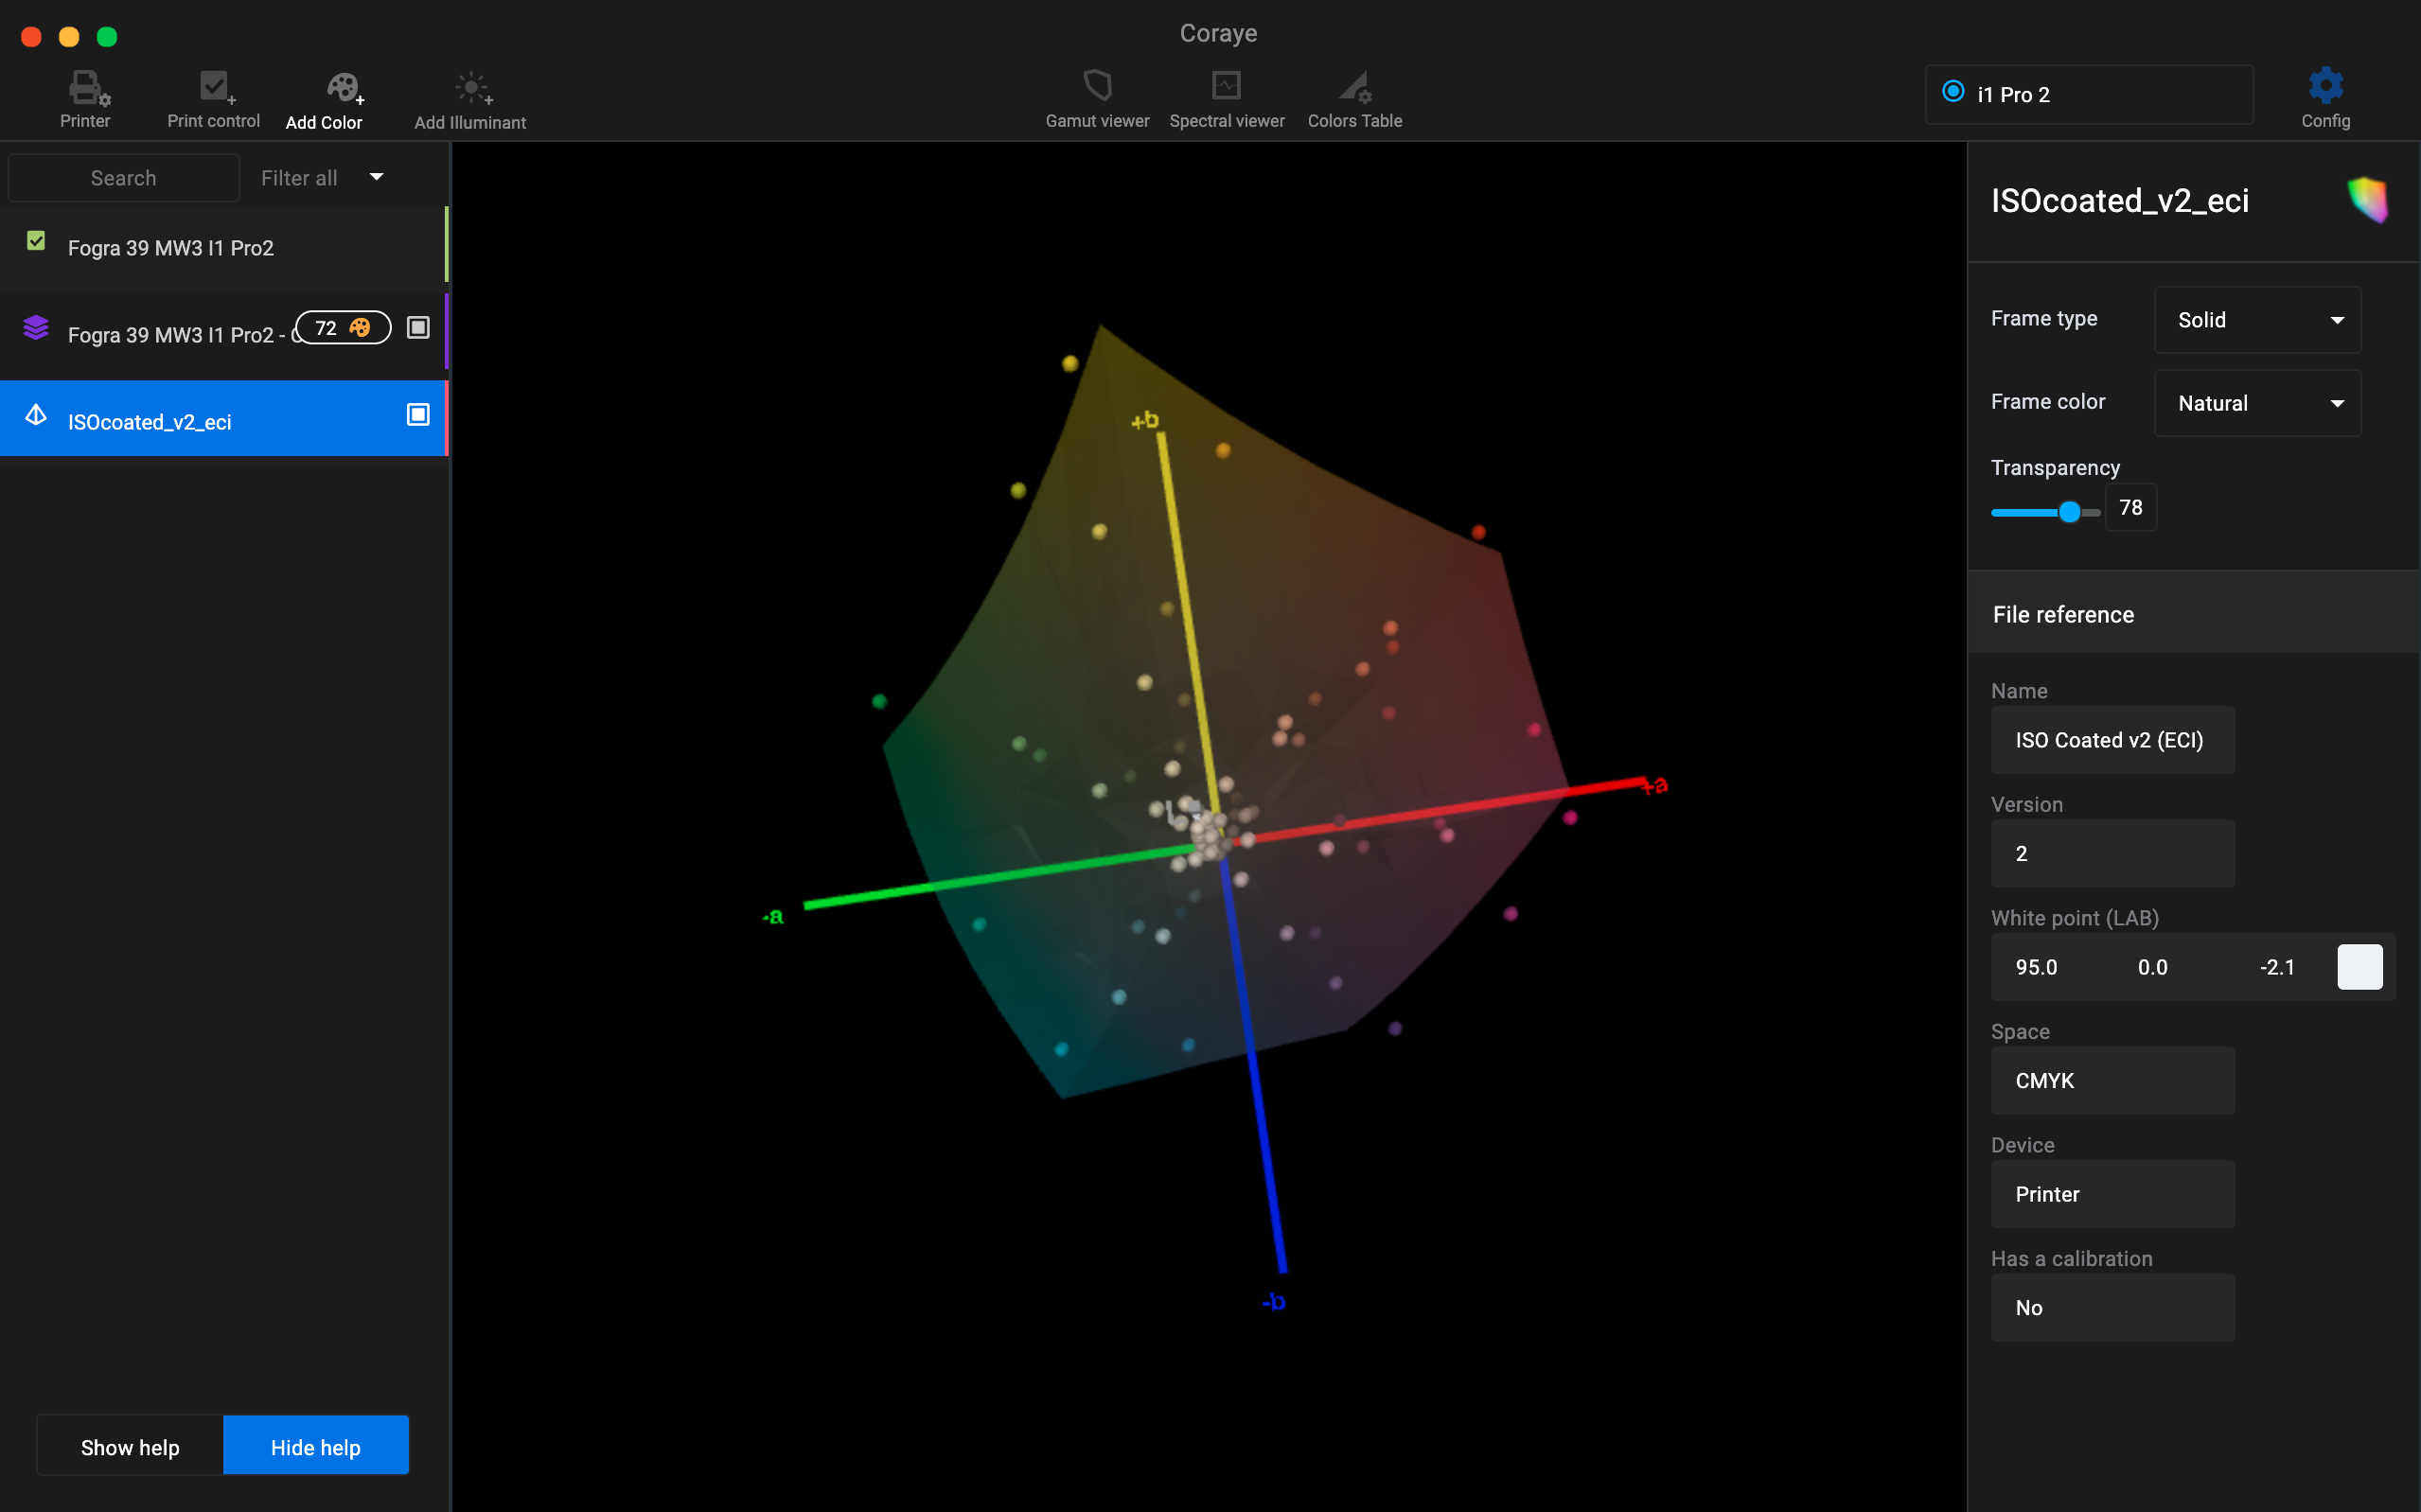
3D display of measurements from the Mediawedge range
The color table generated in the previous step can be displayed in the Gamut Viewer to view the measurement deviations in 3D or to compare the measurements with the reference profile for example.
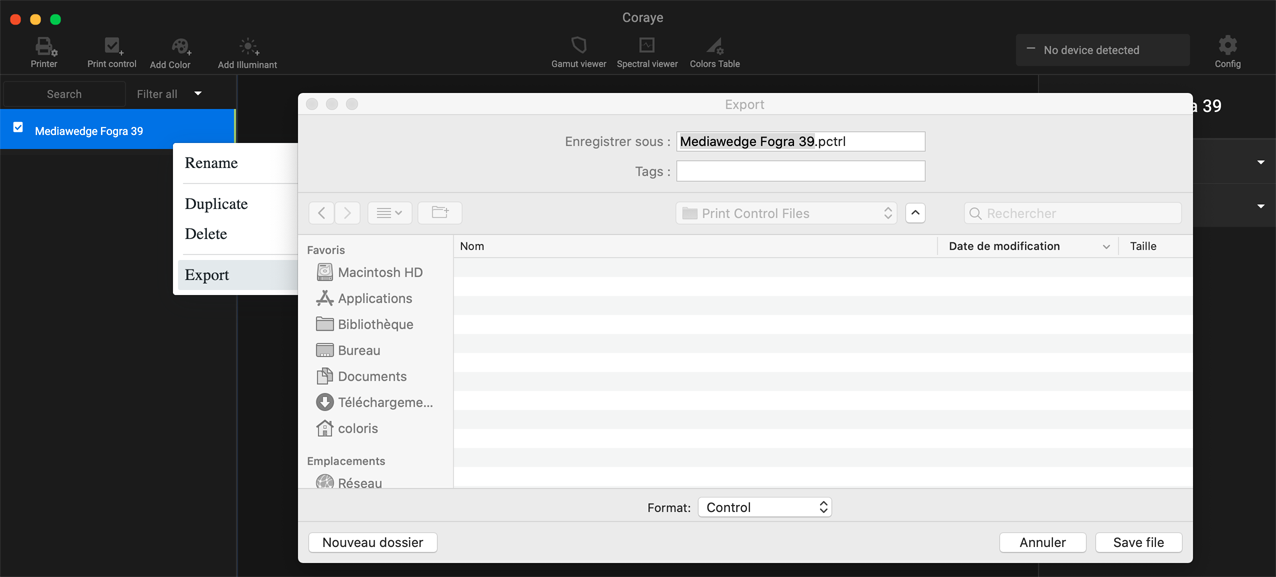
Saving measurements
Saving the " Print Control " file is simply done by right-clicking on the file, then selecting the " Export " function.