Control a grayscale
Checking the gray scale makes it possible to detect any drifts in your printers or to check the quality of a calibration.
Indeed, the grays, reproduced in RGB or CMYK mode, are not composed only of black, but are reproduced with all the inks of your printer.
To obtain perfect neutrality, it is therefore necessary that the dosage of these inks be controlled and balanced.
This should be the case if the printer is properly calibrated and stable.
The non-stability of a printer can be due to the following parameters:
- Material wear (print heads, pumps, etc.)
- Inks (expiry date, quality problem, etc.)
- Media
- Icc profile (Profile not corresponding to the printing medium, etc ...)
- Calibration problem.
It is therefore advisable to regularly check your prints as part of a quality control in order to guarantee your customers the consistency and quality of your prints.
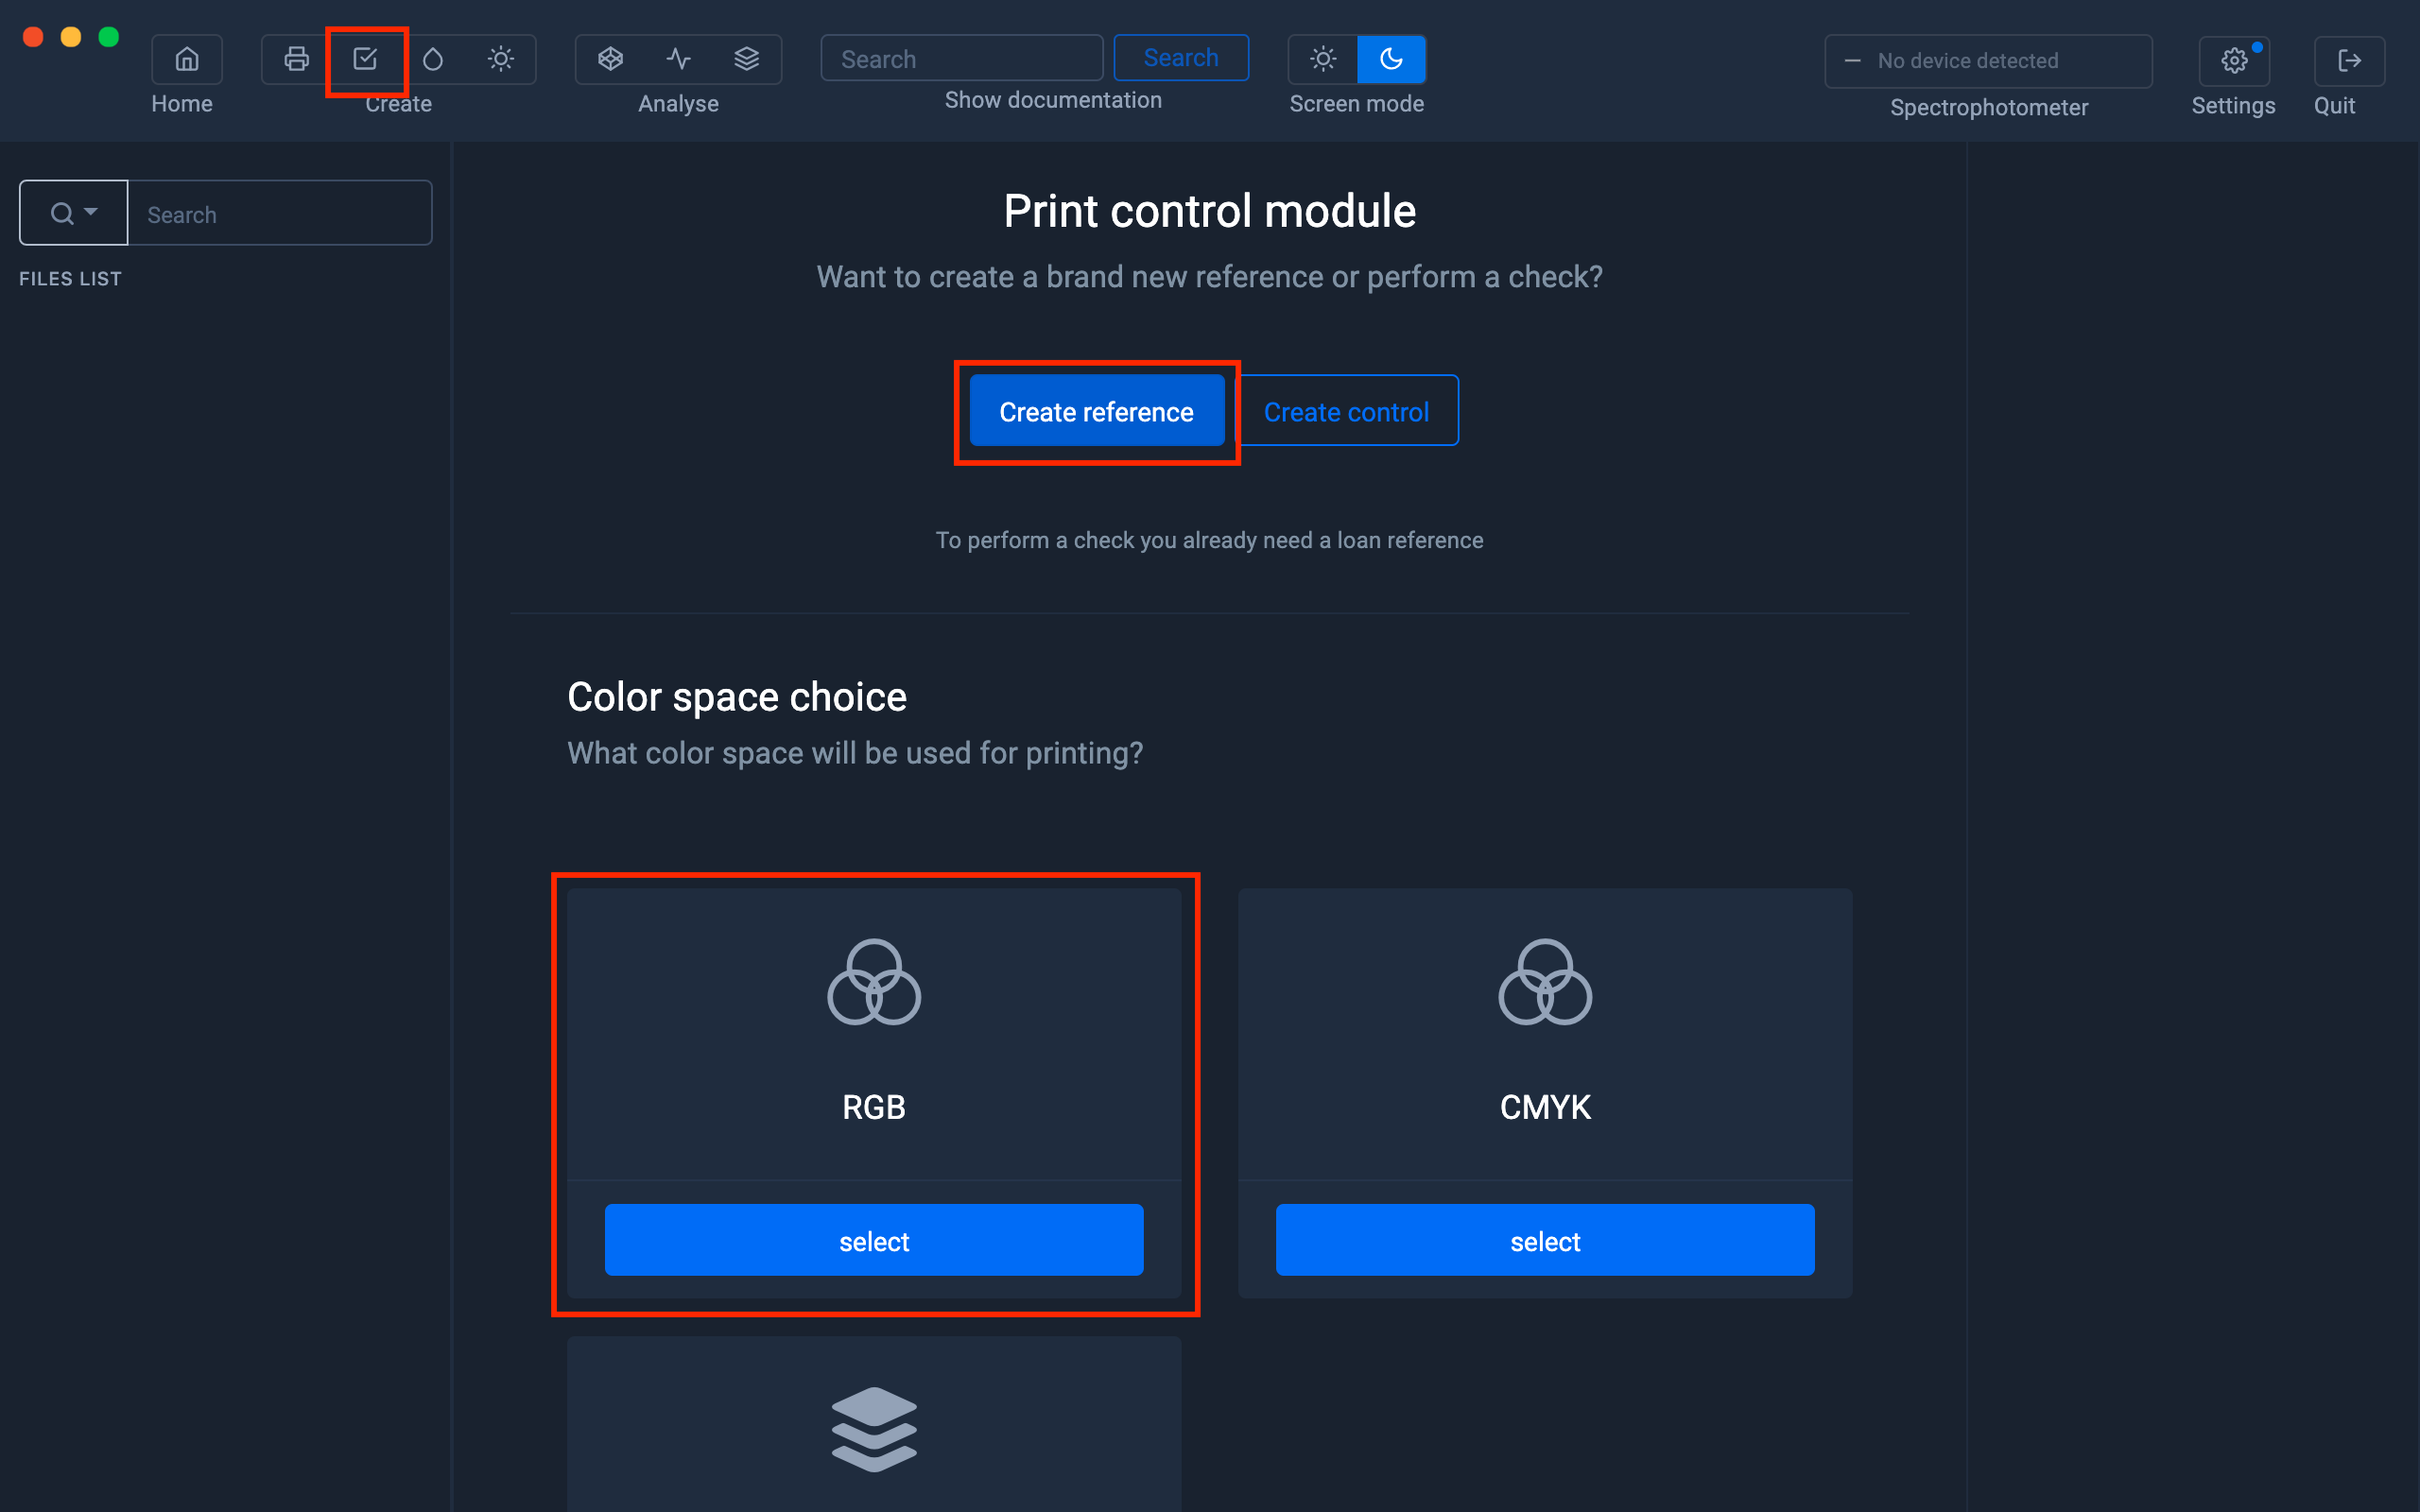
Creating an RGB Gray Reference
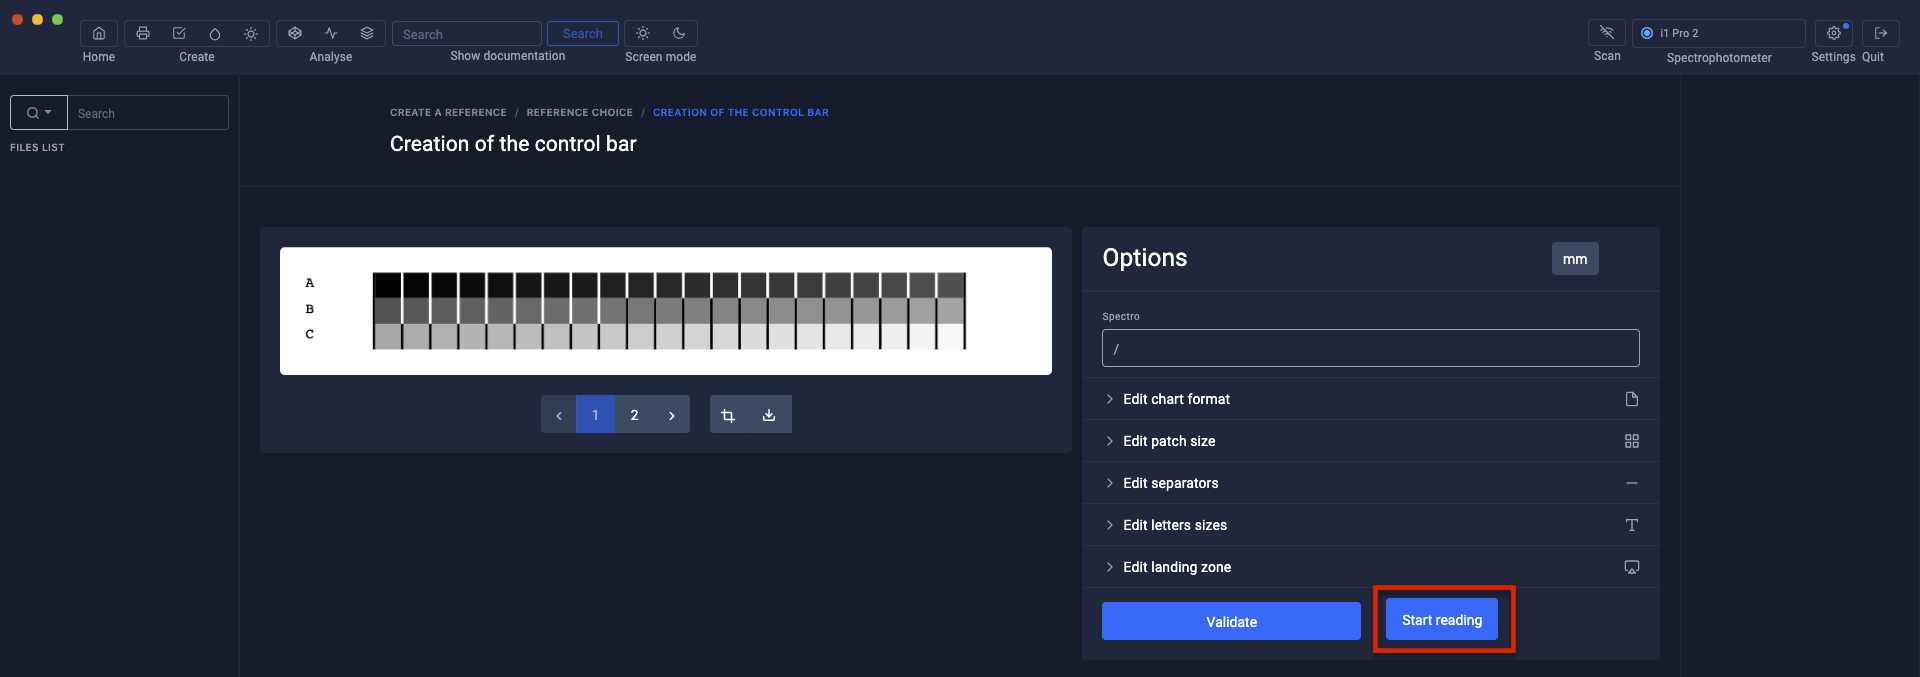
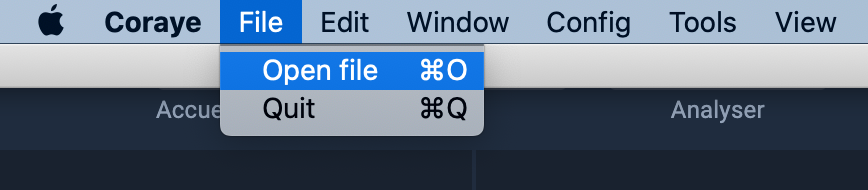
Click on the " Print Control " icon, then on the " Create reference " button and select " RGB " mode.
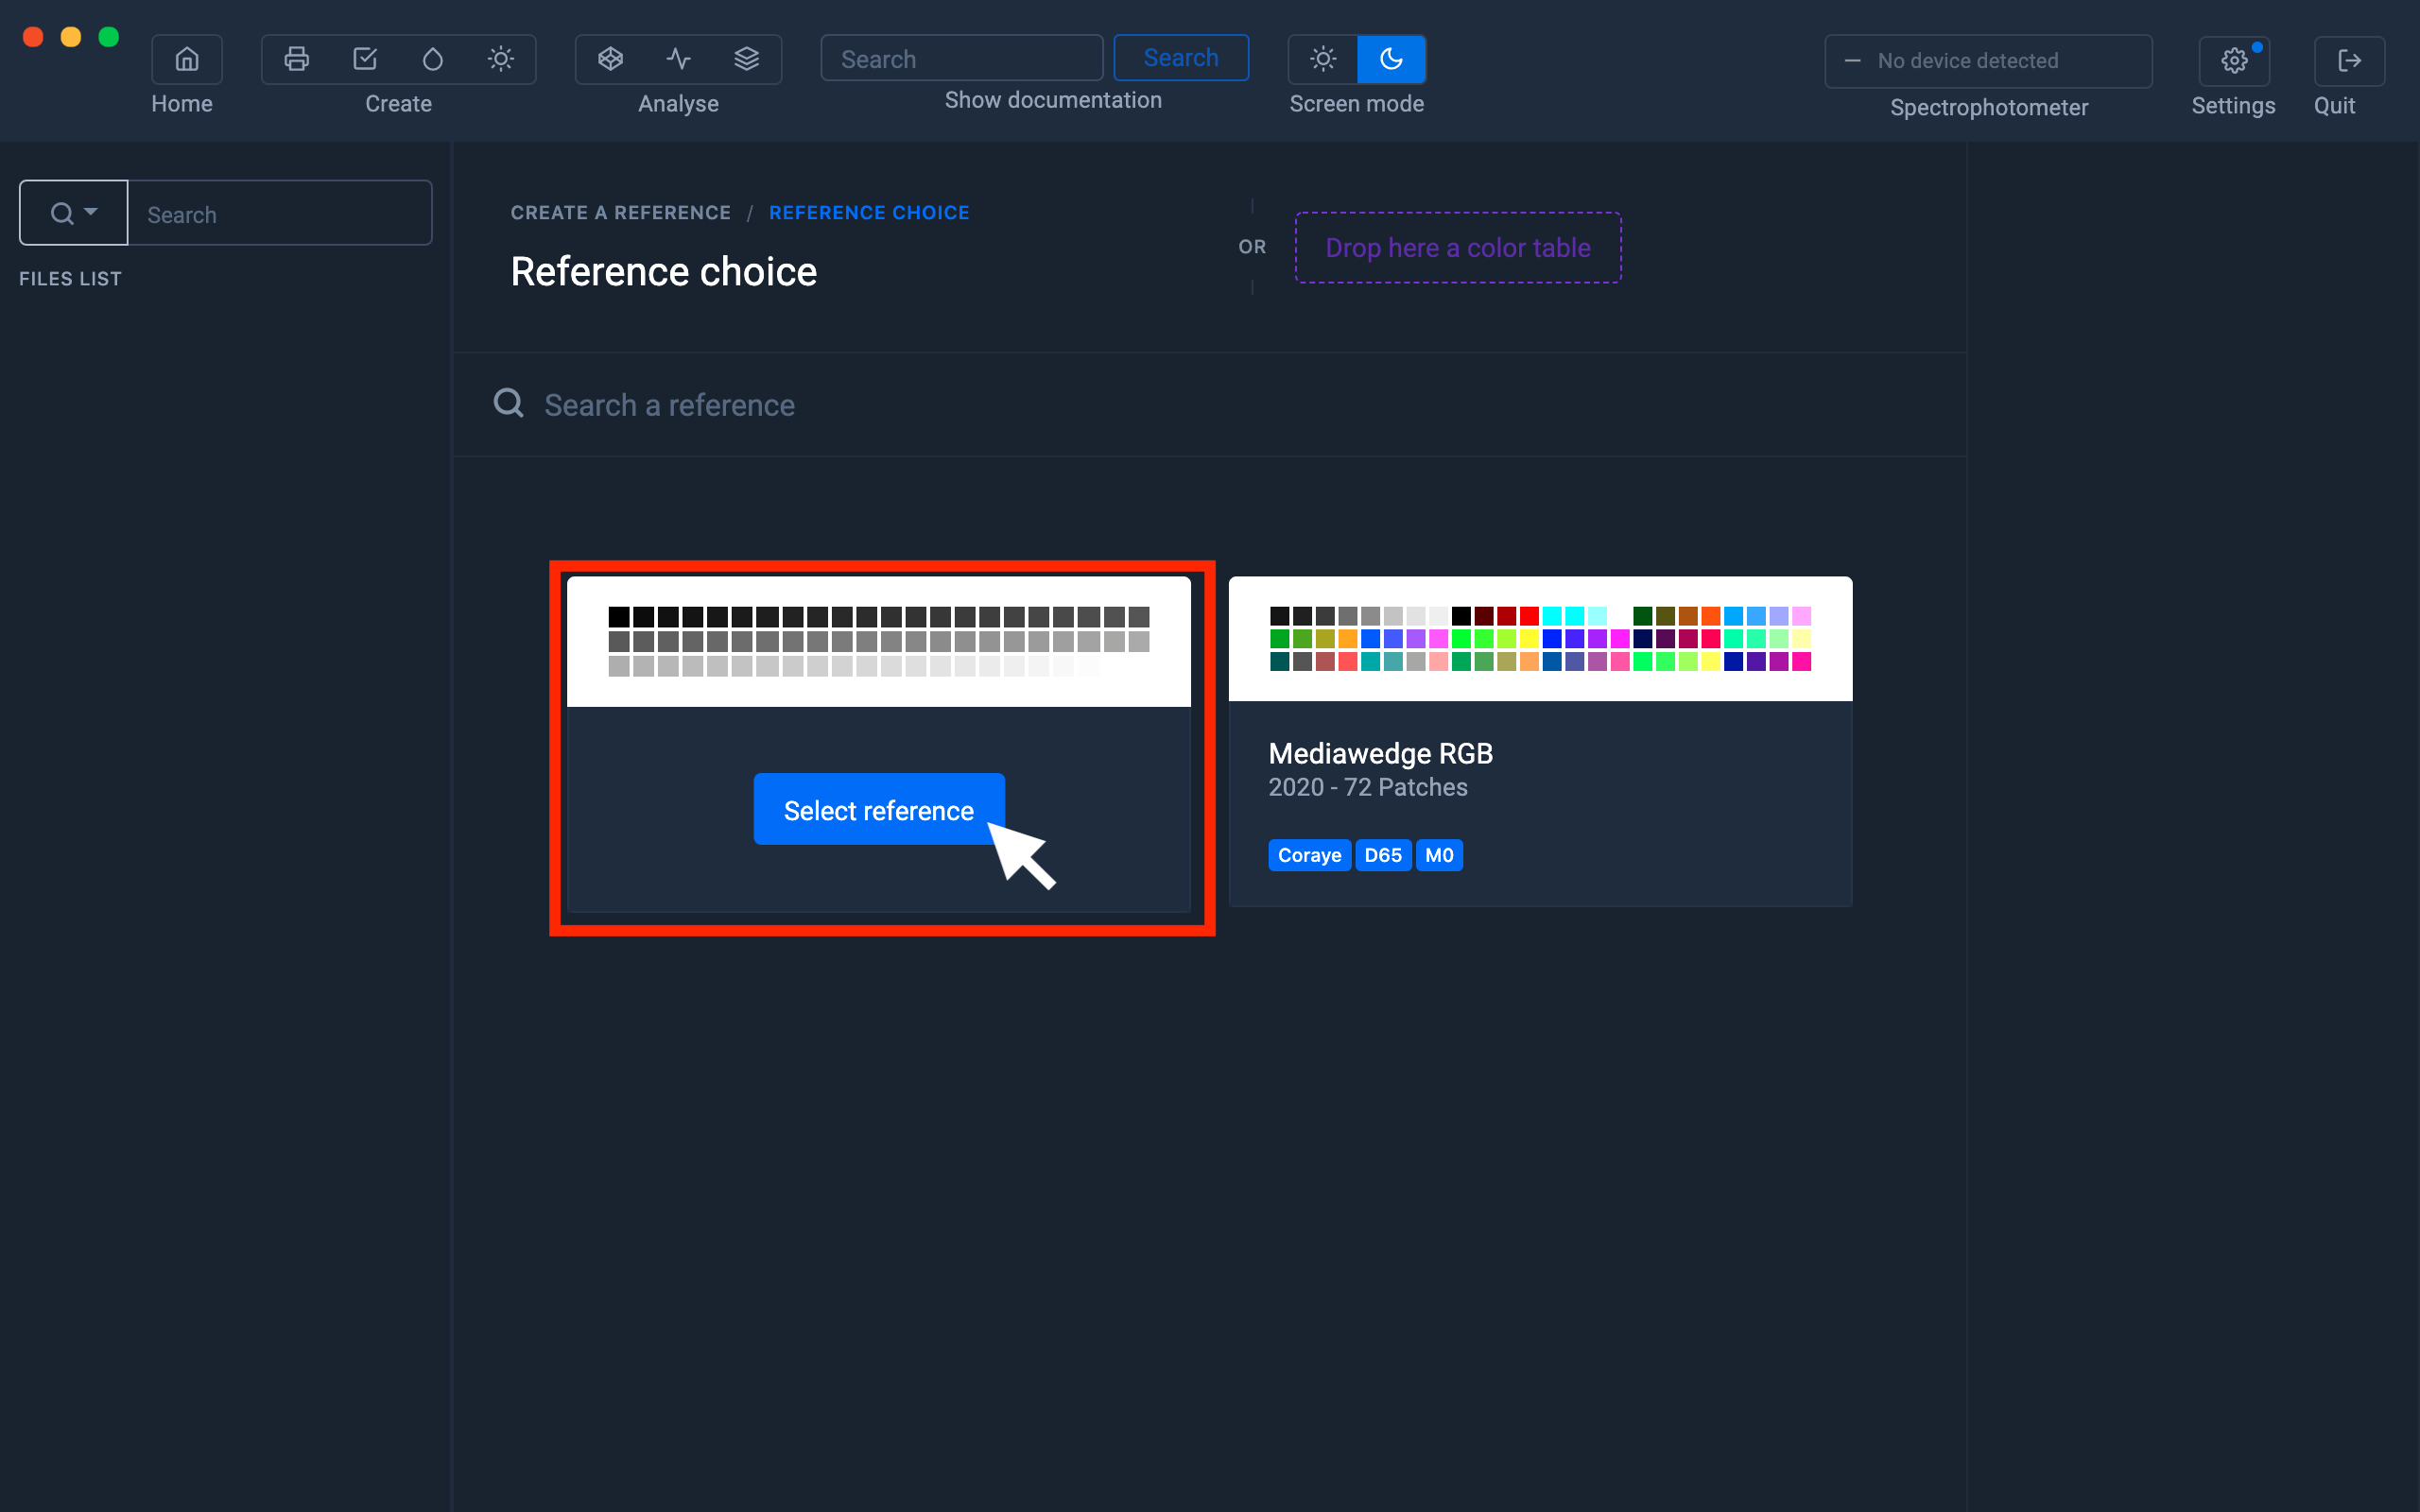
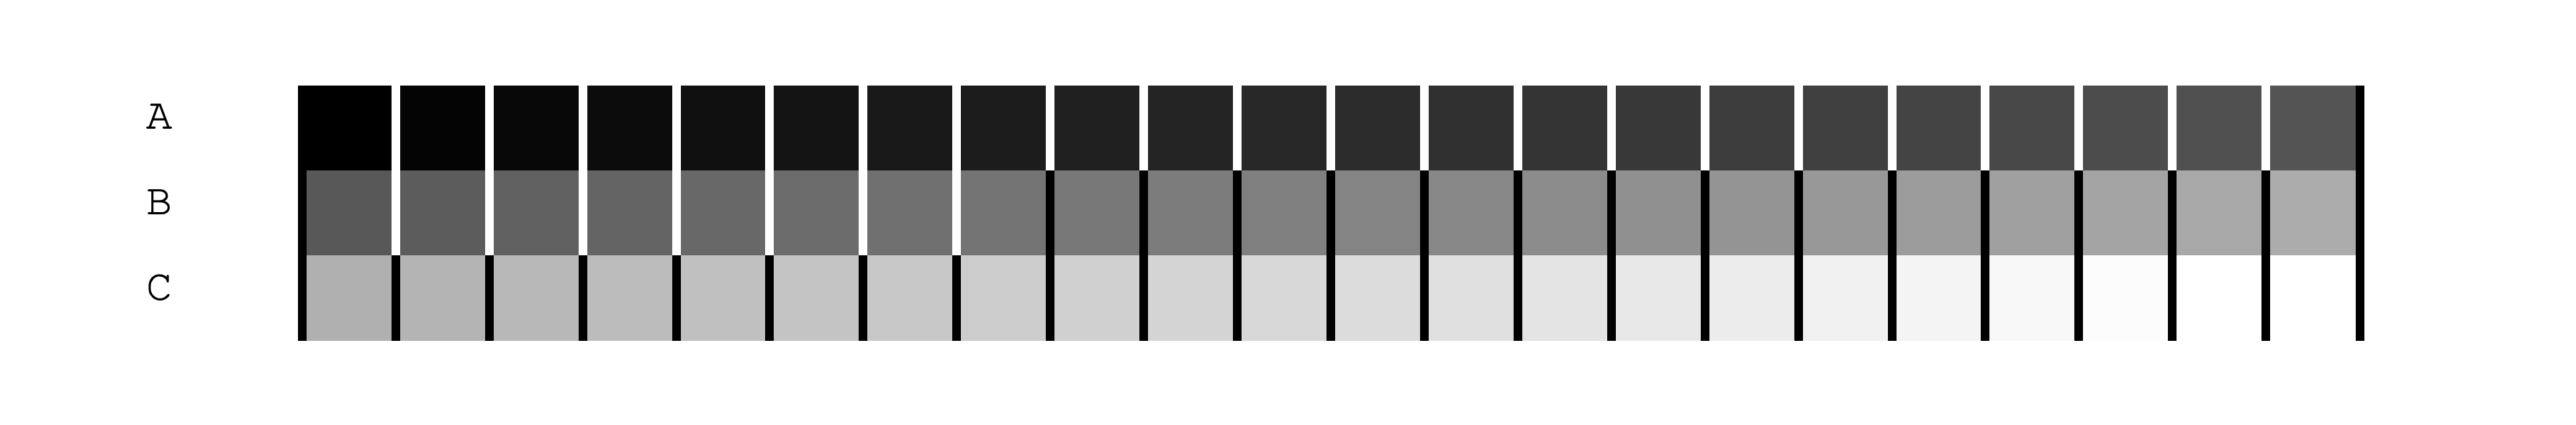
Select the gray scale
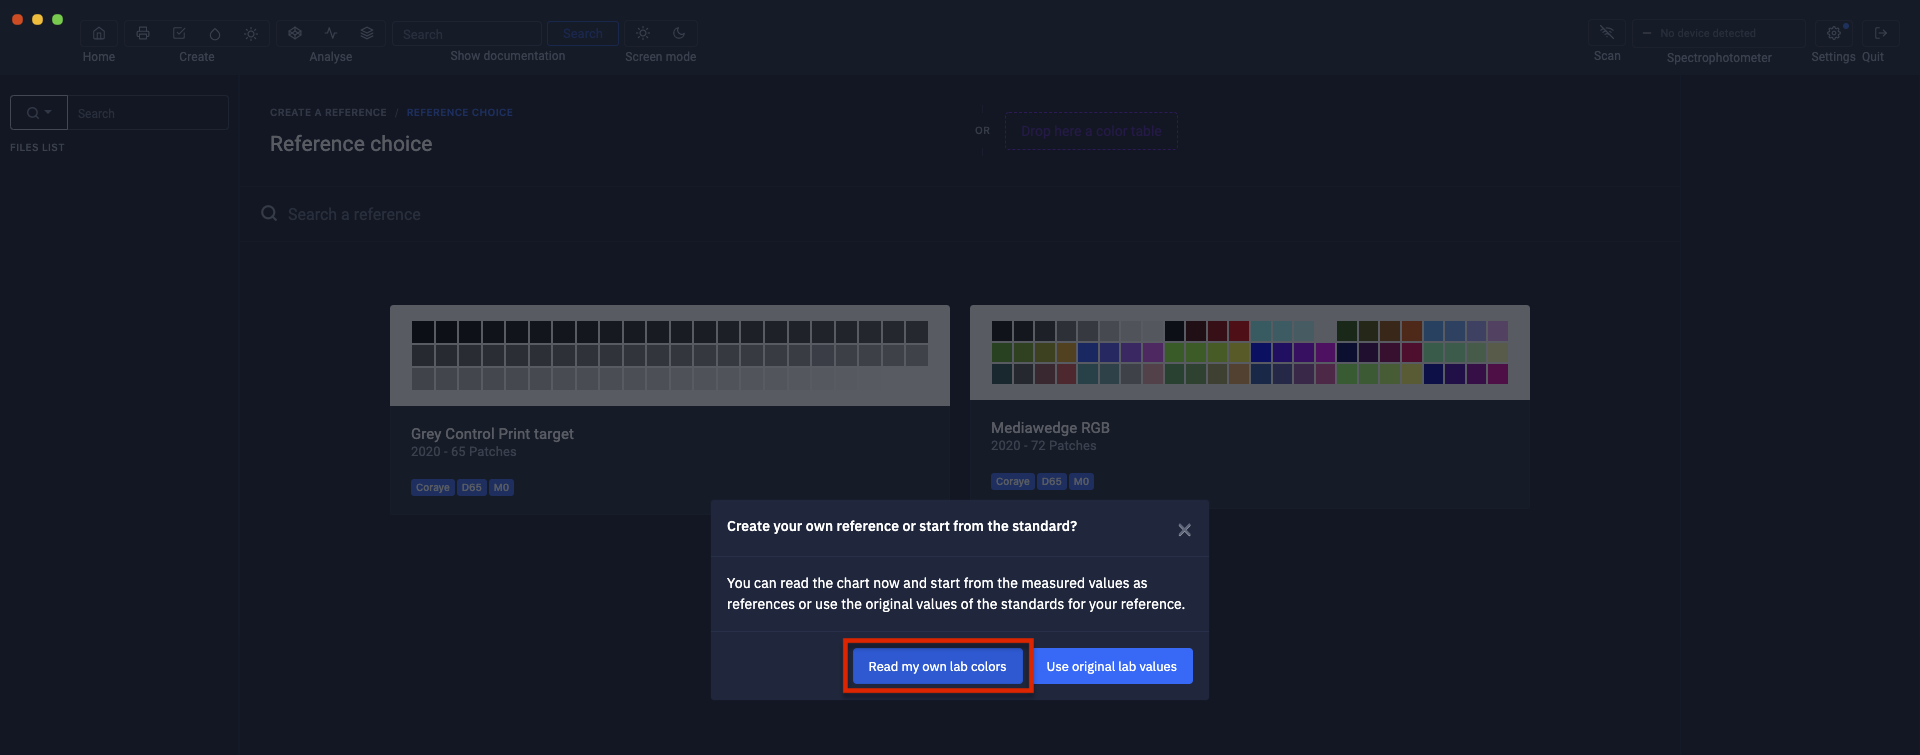
Click on the button " Measure your own Lab values "
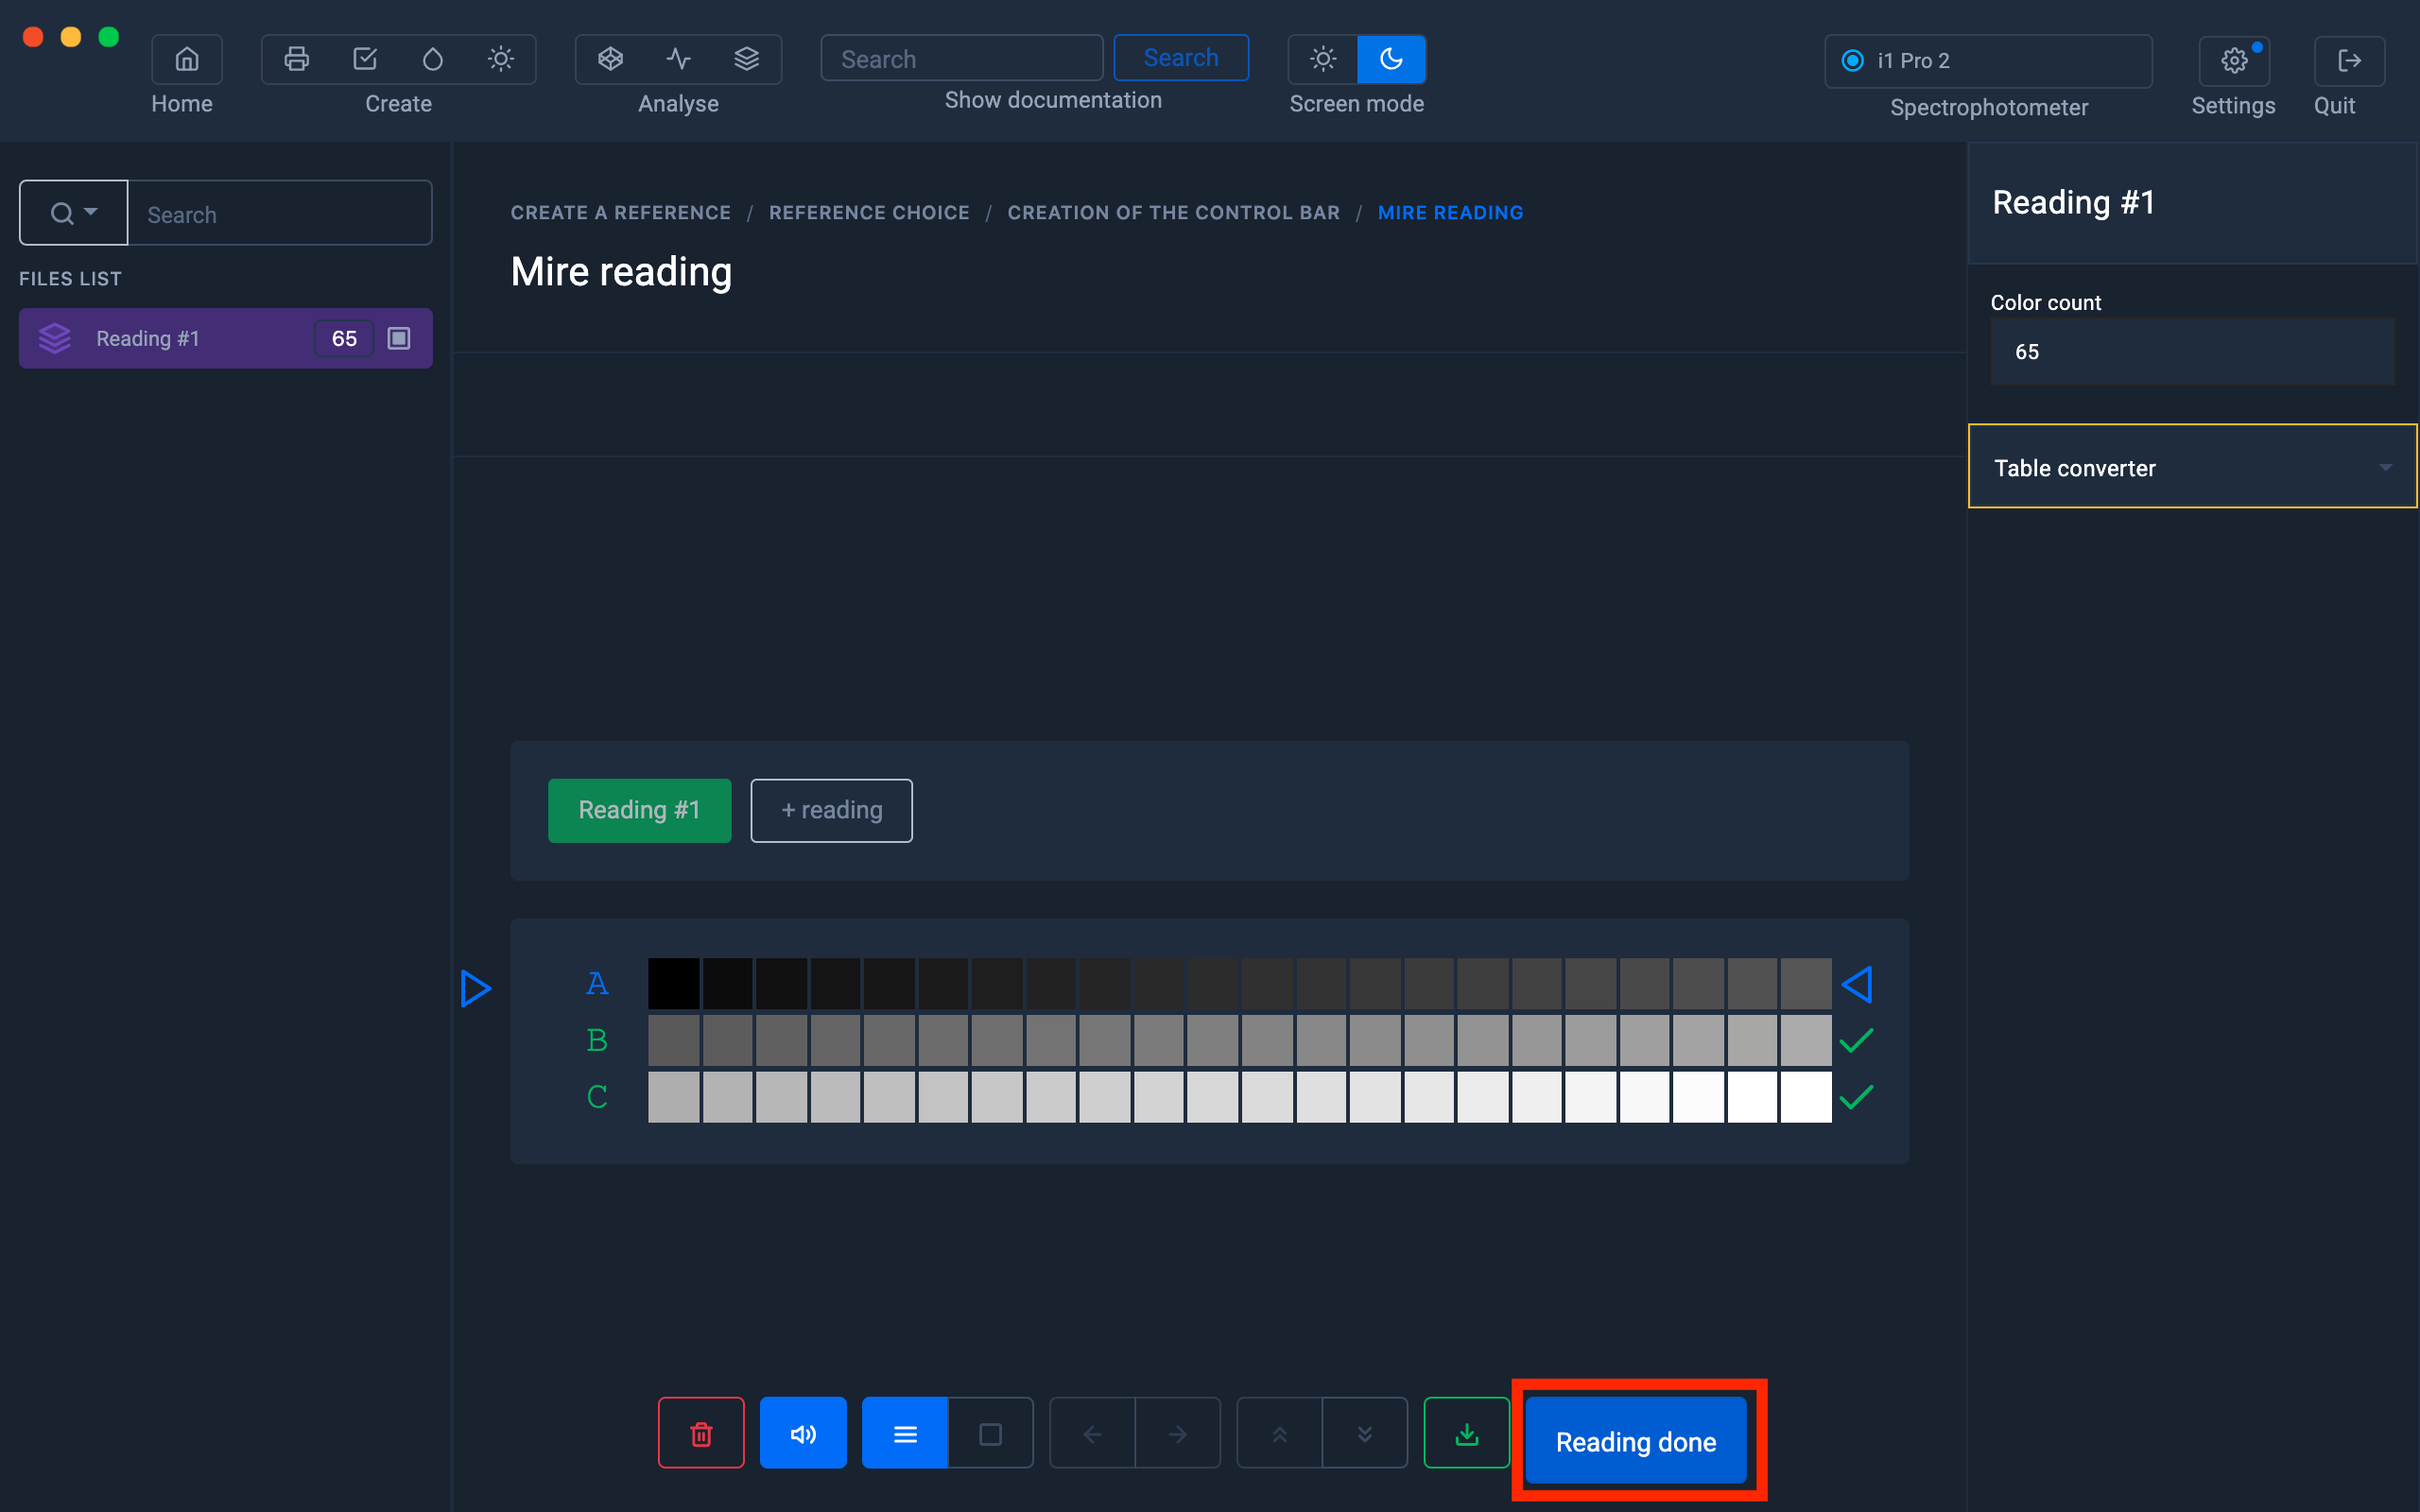
The first step is to check the neutrality of the gray scale that we are going to print.
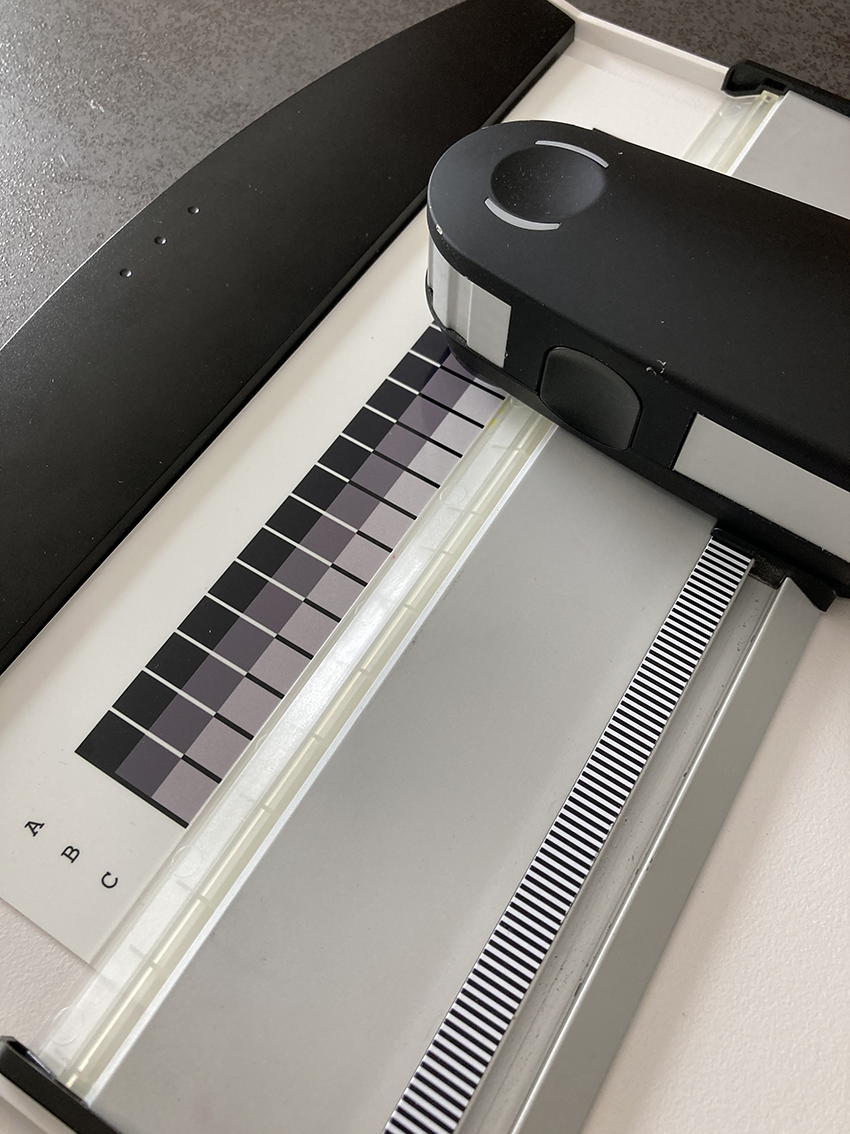
Gray's test pattern print
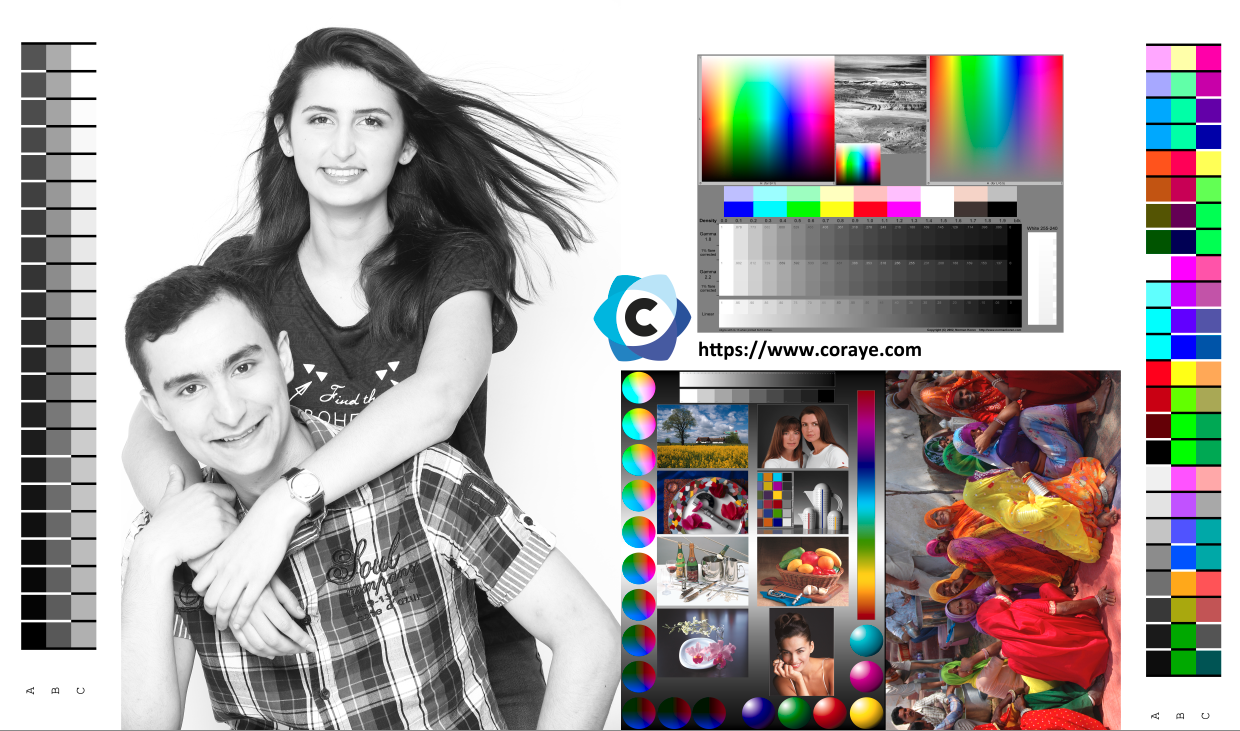
To print the grey Mediwedge, you can use the ranges from Coraye's test image:
Or click on the " Export " icon then select " Export to Tiff " or " Export to PDF "
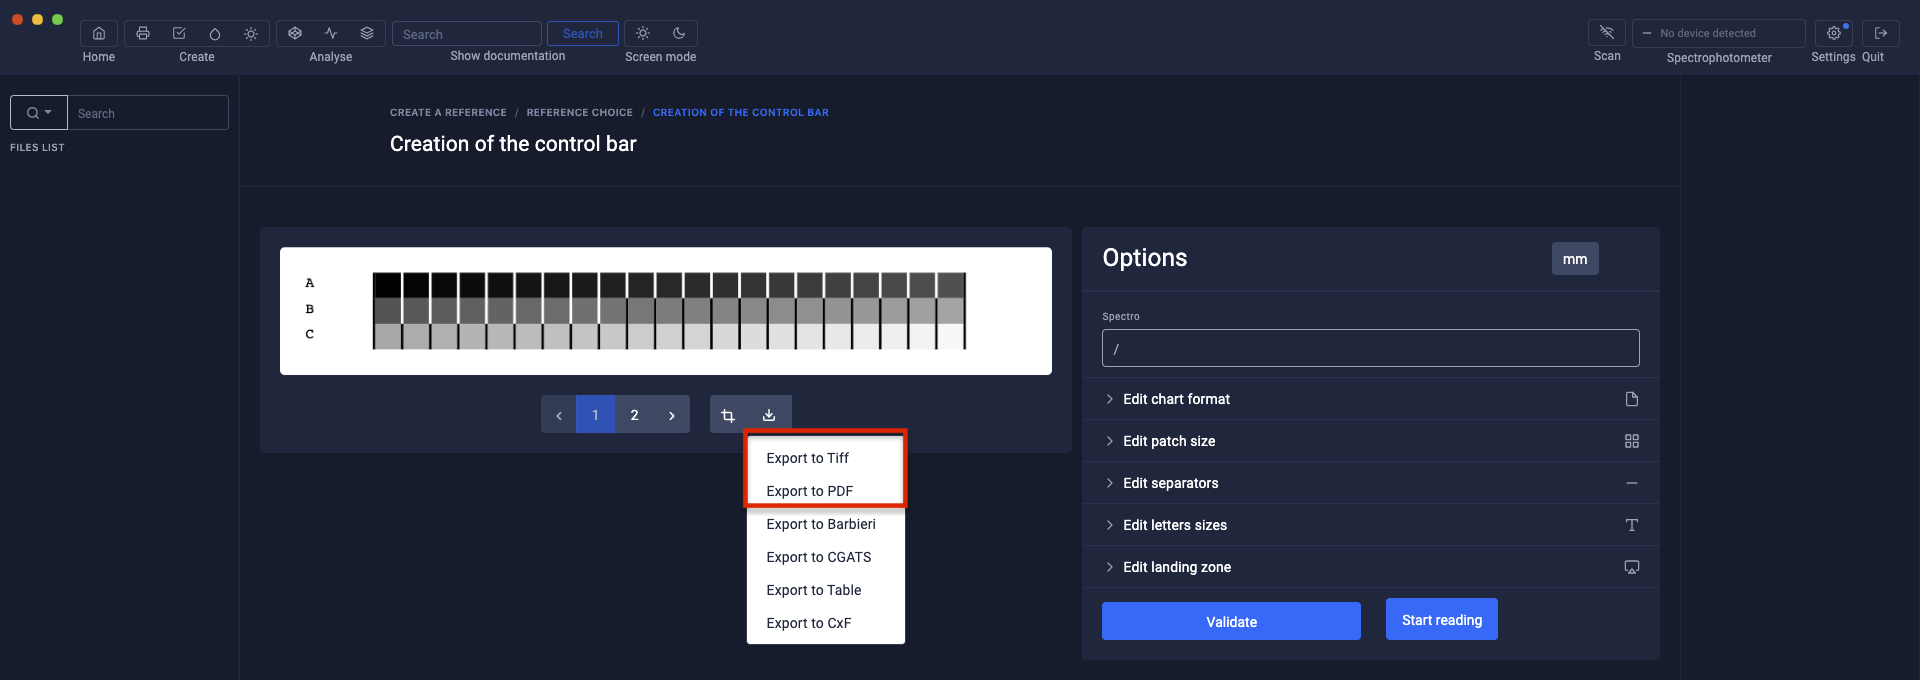
Save the range in Tiff or PDF format in a folder.
The test chart must be printed under the same conditions as a normal print to reflect the final result.
Gray scale measurement
When the range is printed, start the control measurement.
Click on " Start measurement "
Position the spectrophotometer in its calibration position, then click on " Start calibration "
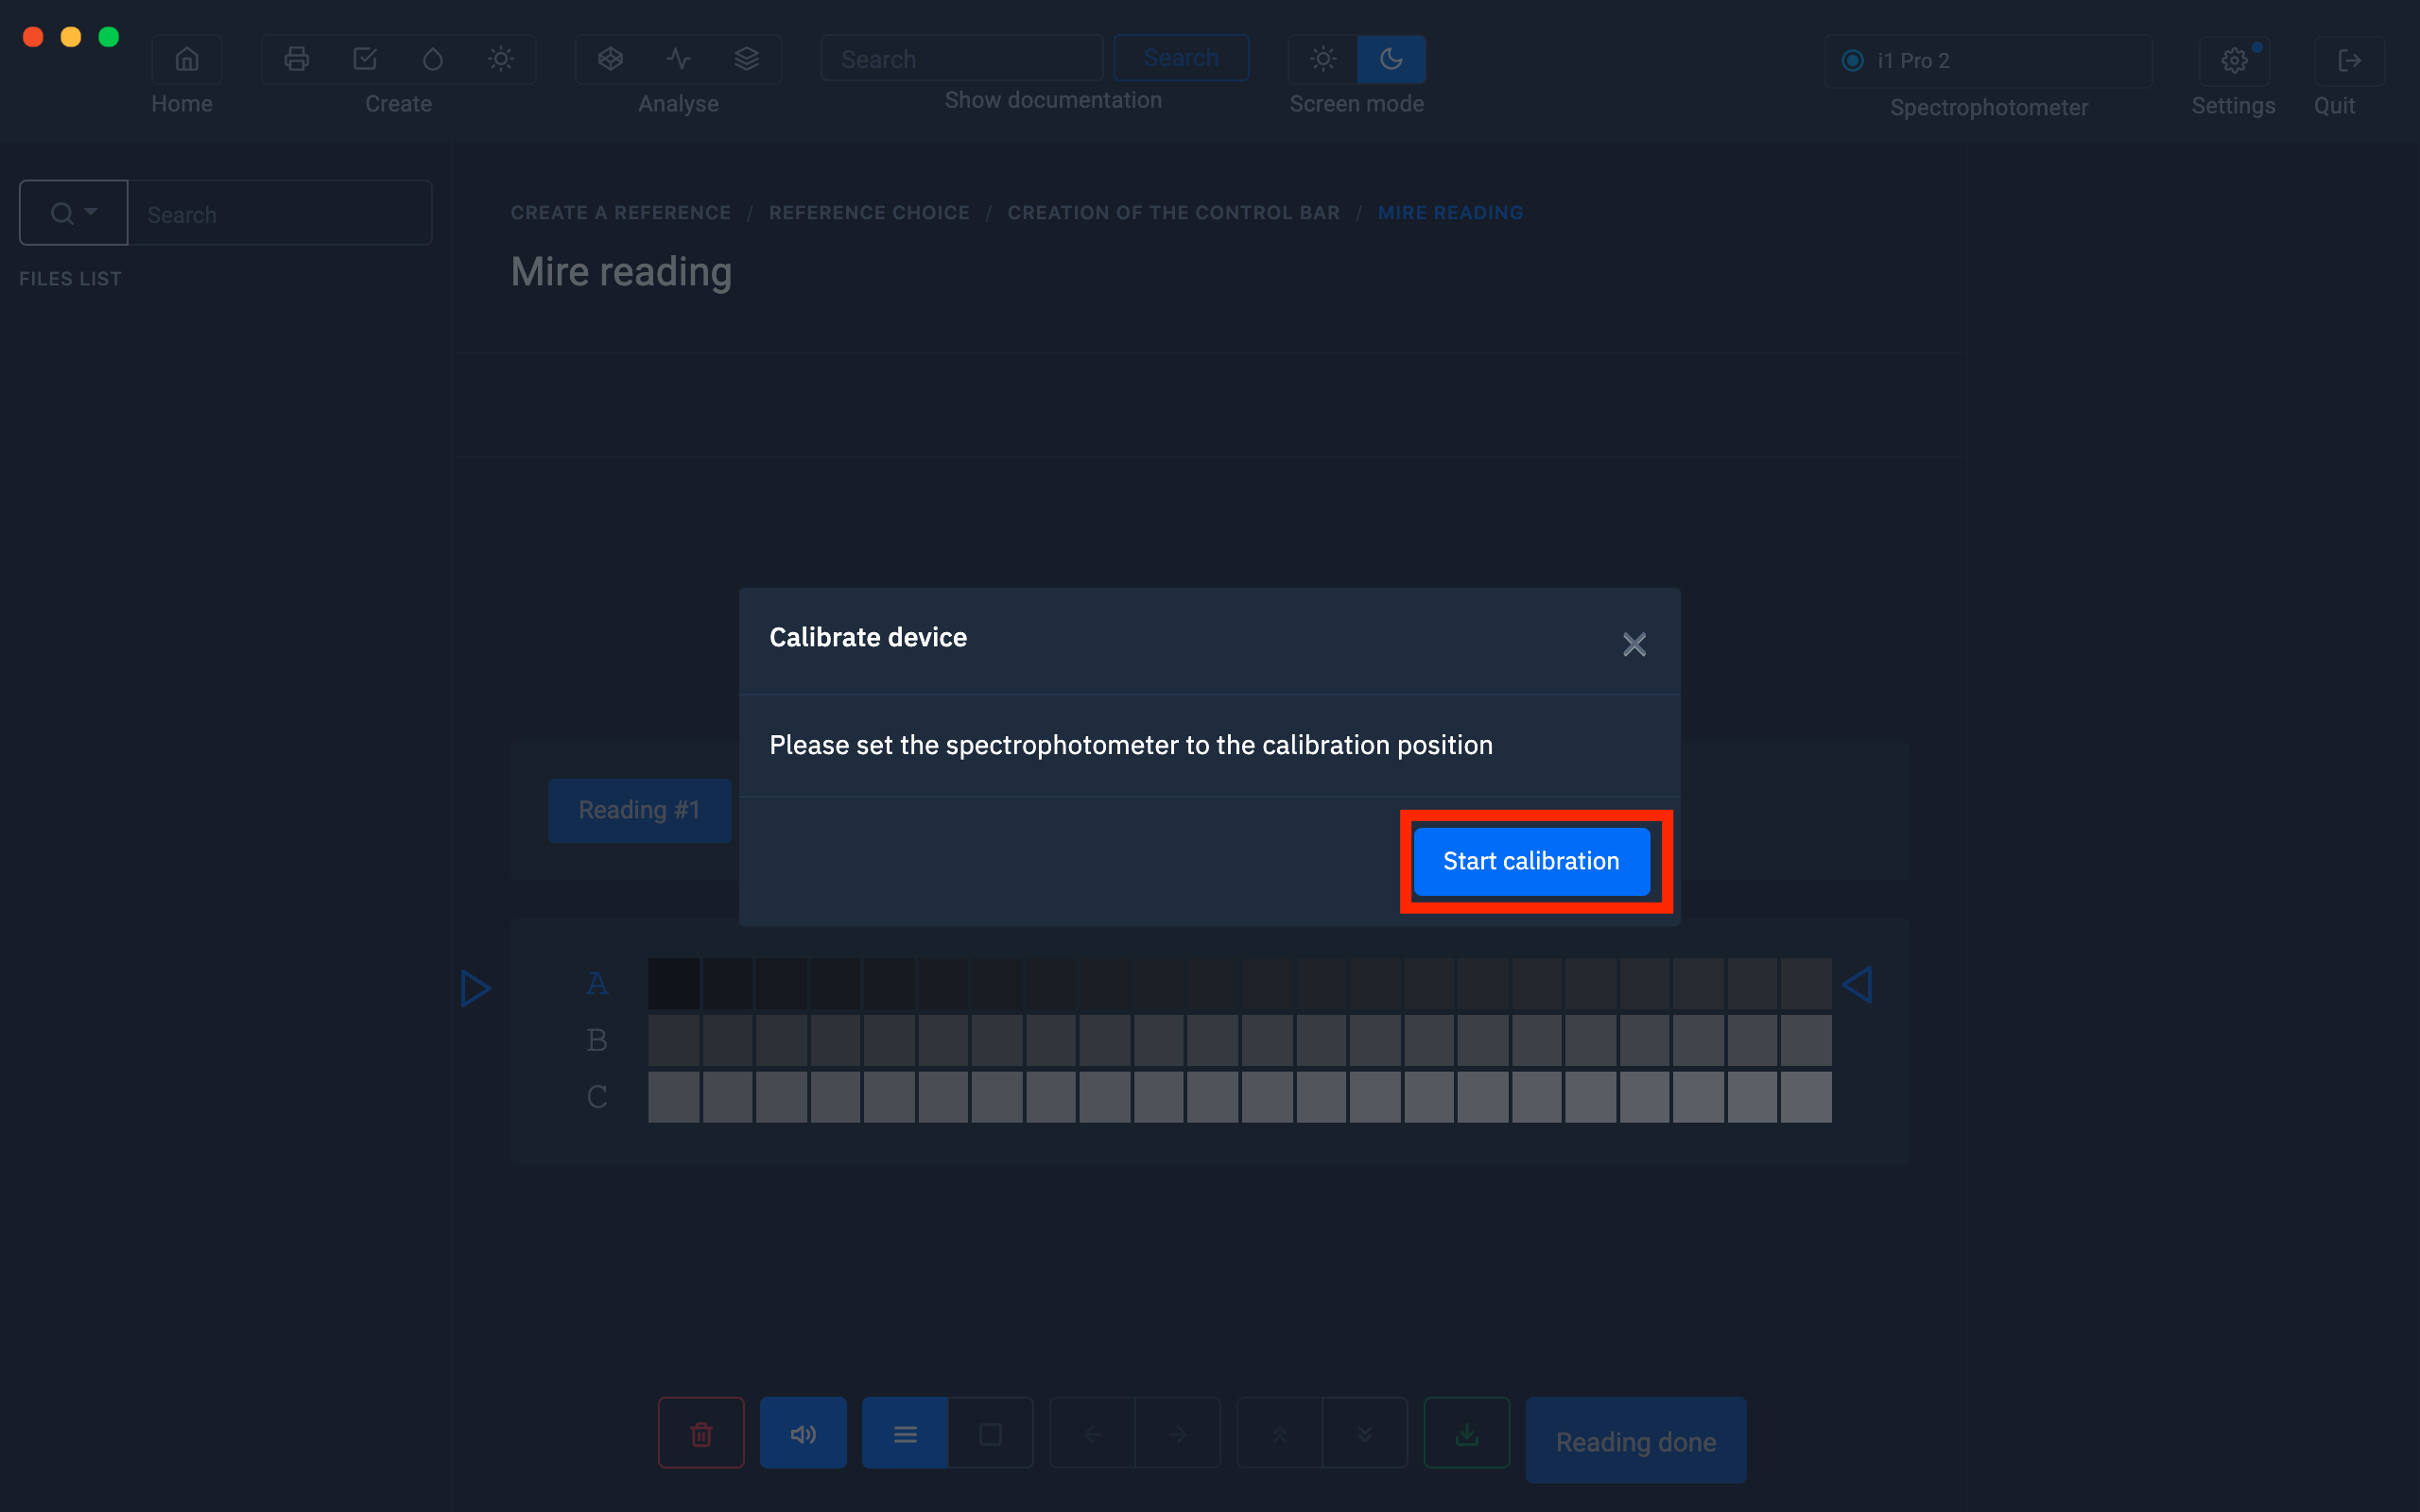
 When the spectrophotometer is calibrated, measure the staff.
The blue arrows show you the line to measure.
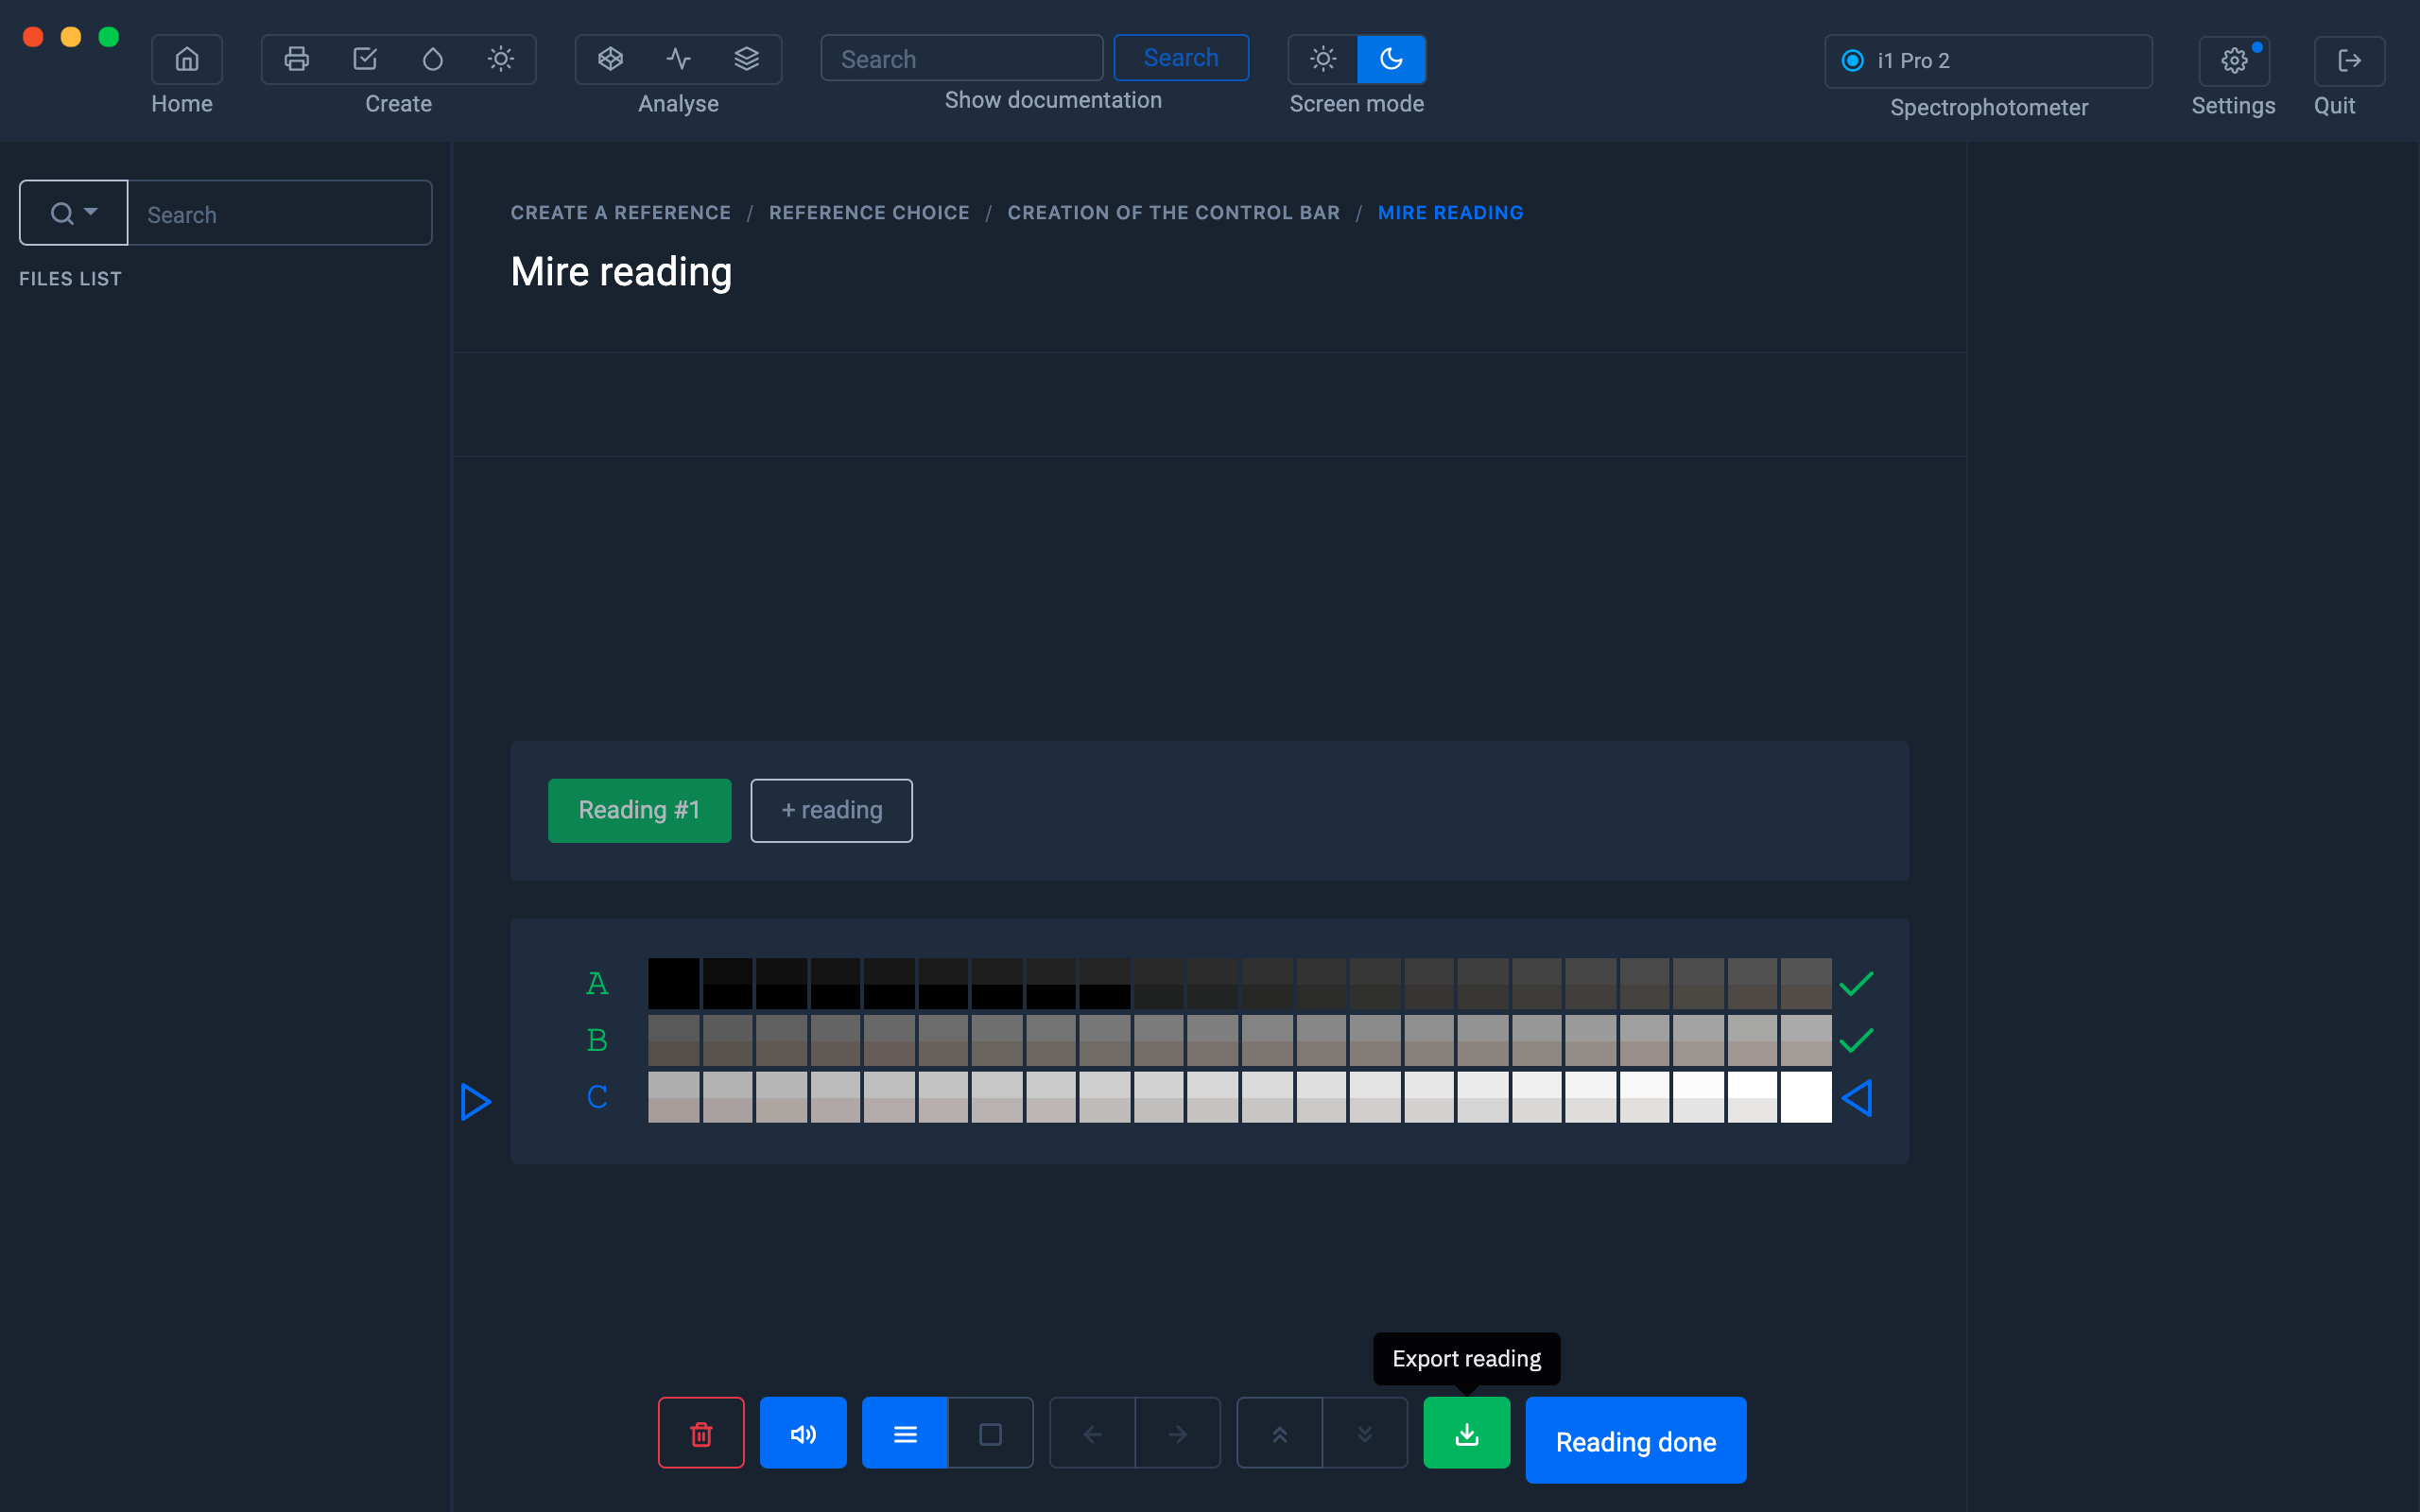
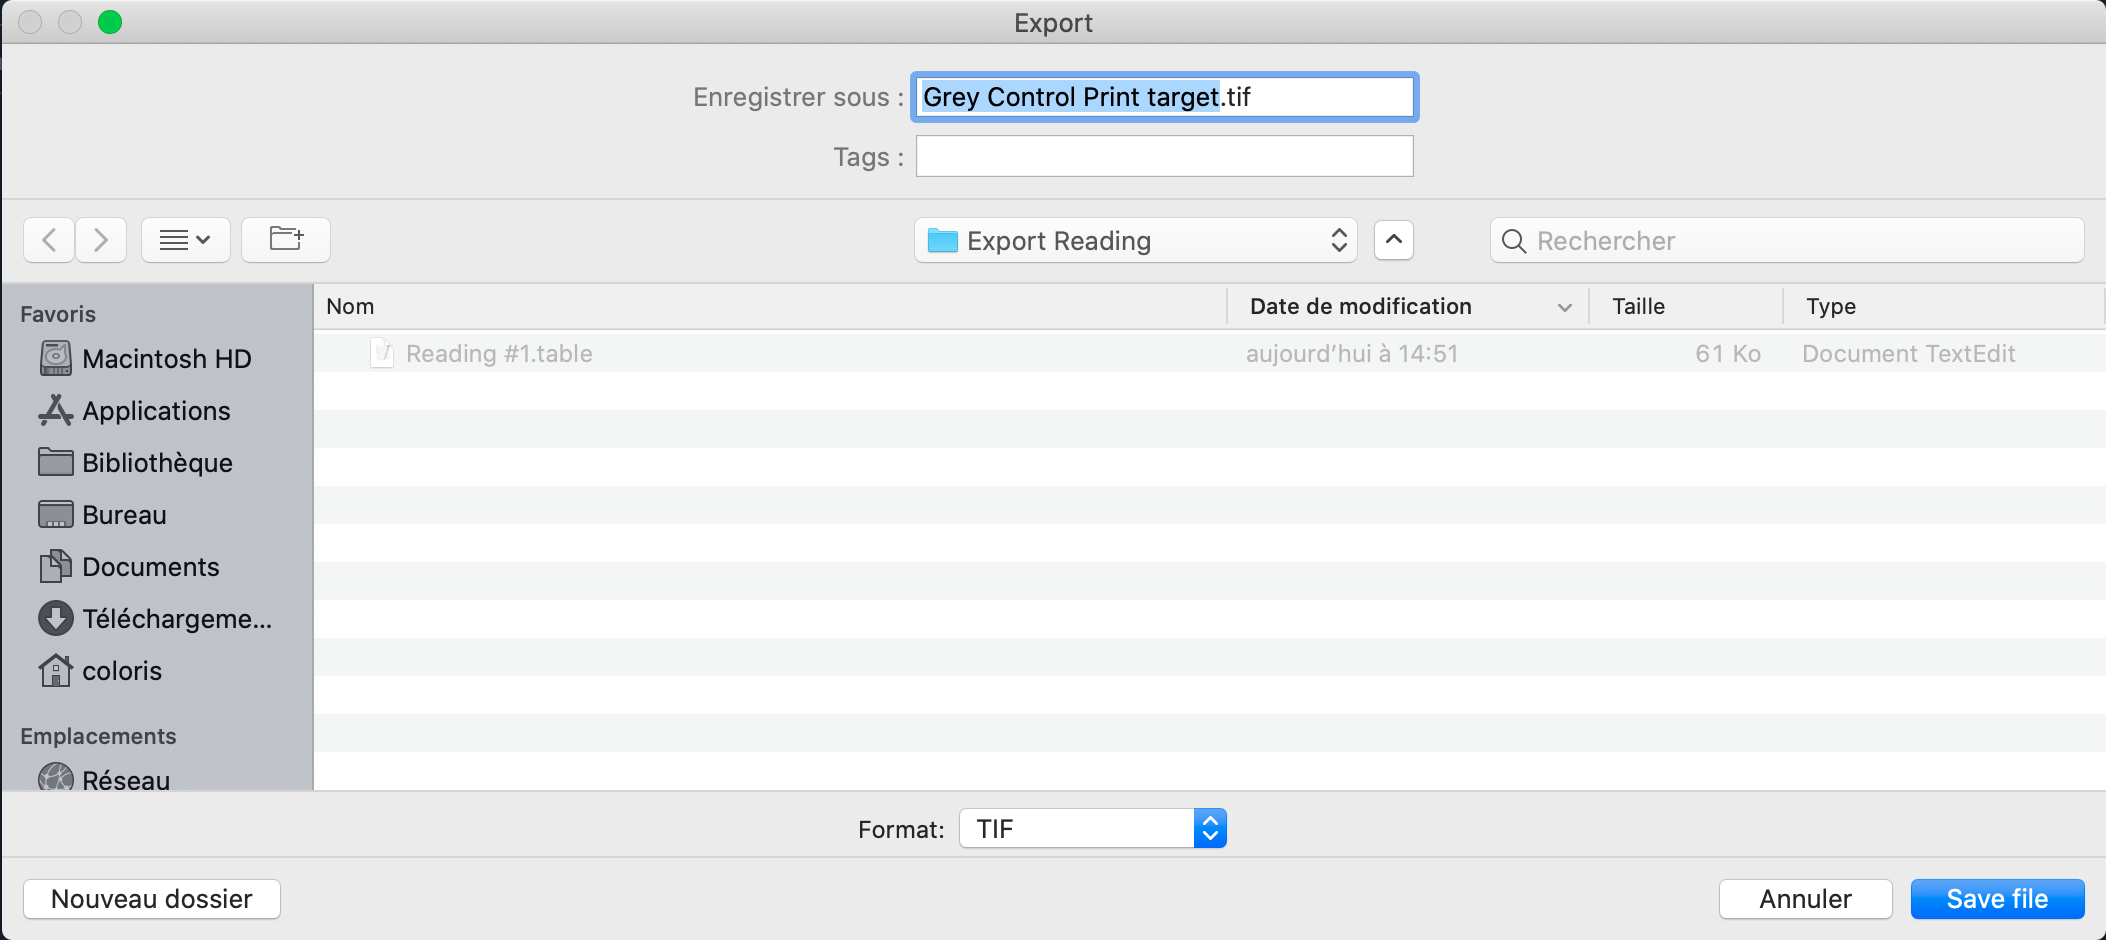
Record the reference measurement (optional step)
When the test chart is measured, you have the possibility of exporting the measurement of the range in order to view it in the Gamut Viewer for example.
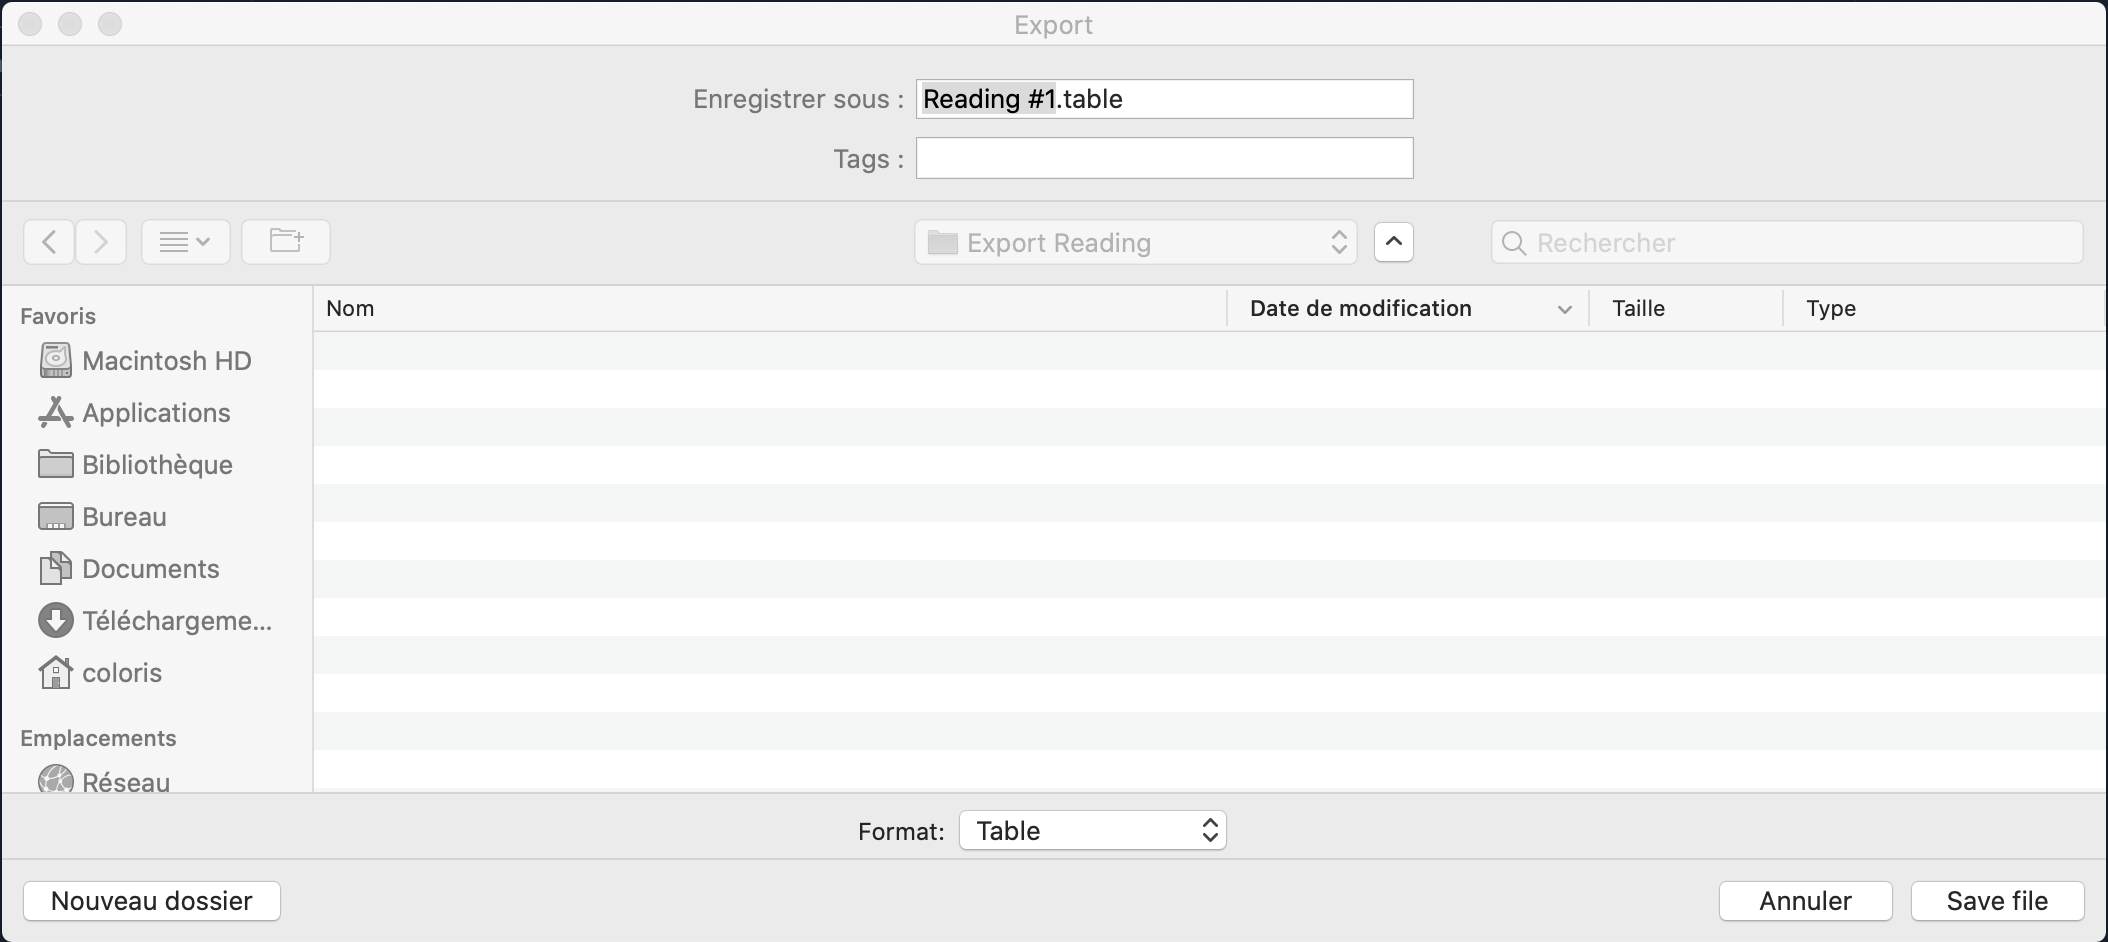
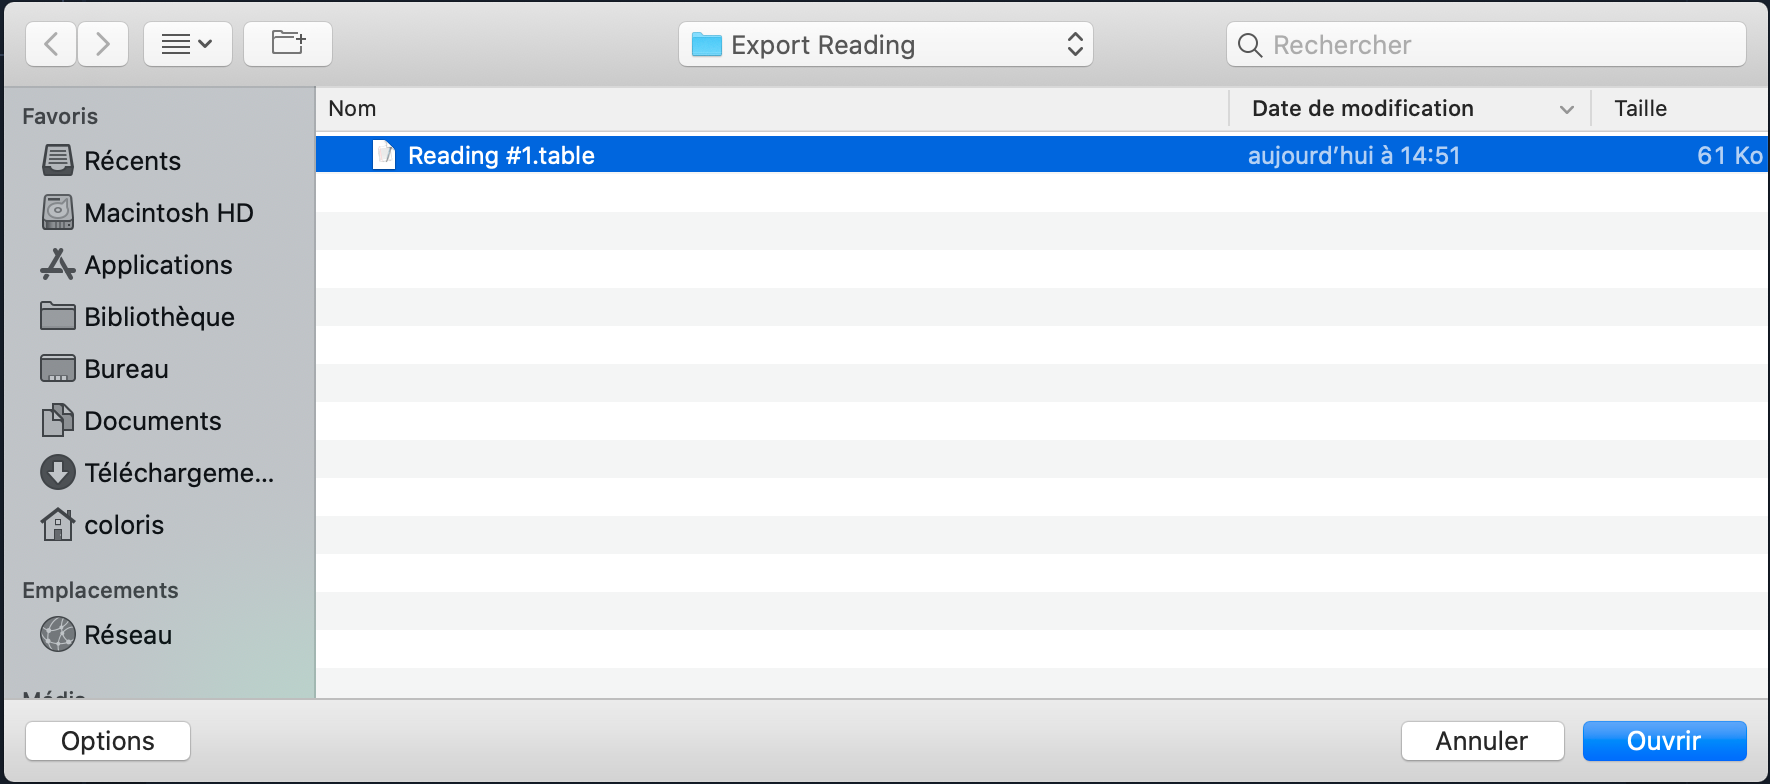
To do this, all you have to do is click on the " Export Reading " button and then select " Export table ".
Then select the folder to save your saved measurement in the .table format
As a reminder, the .table format can be used with the modules:
- Gamut Viewer
- Color Table
- Print Control
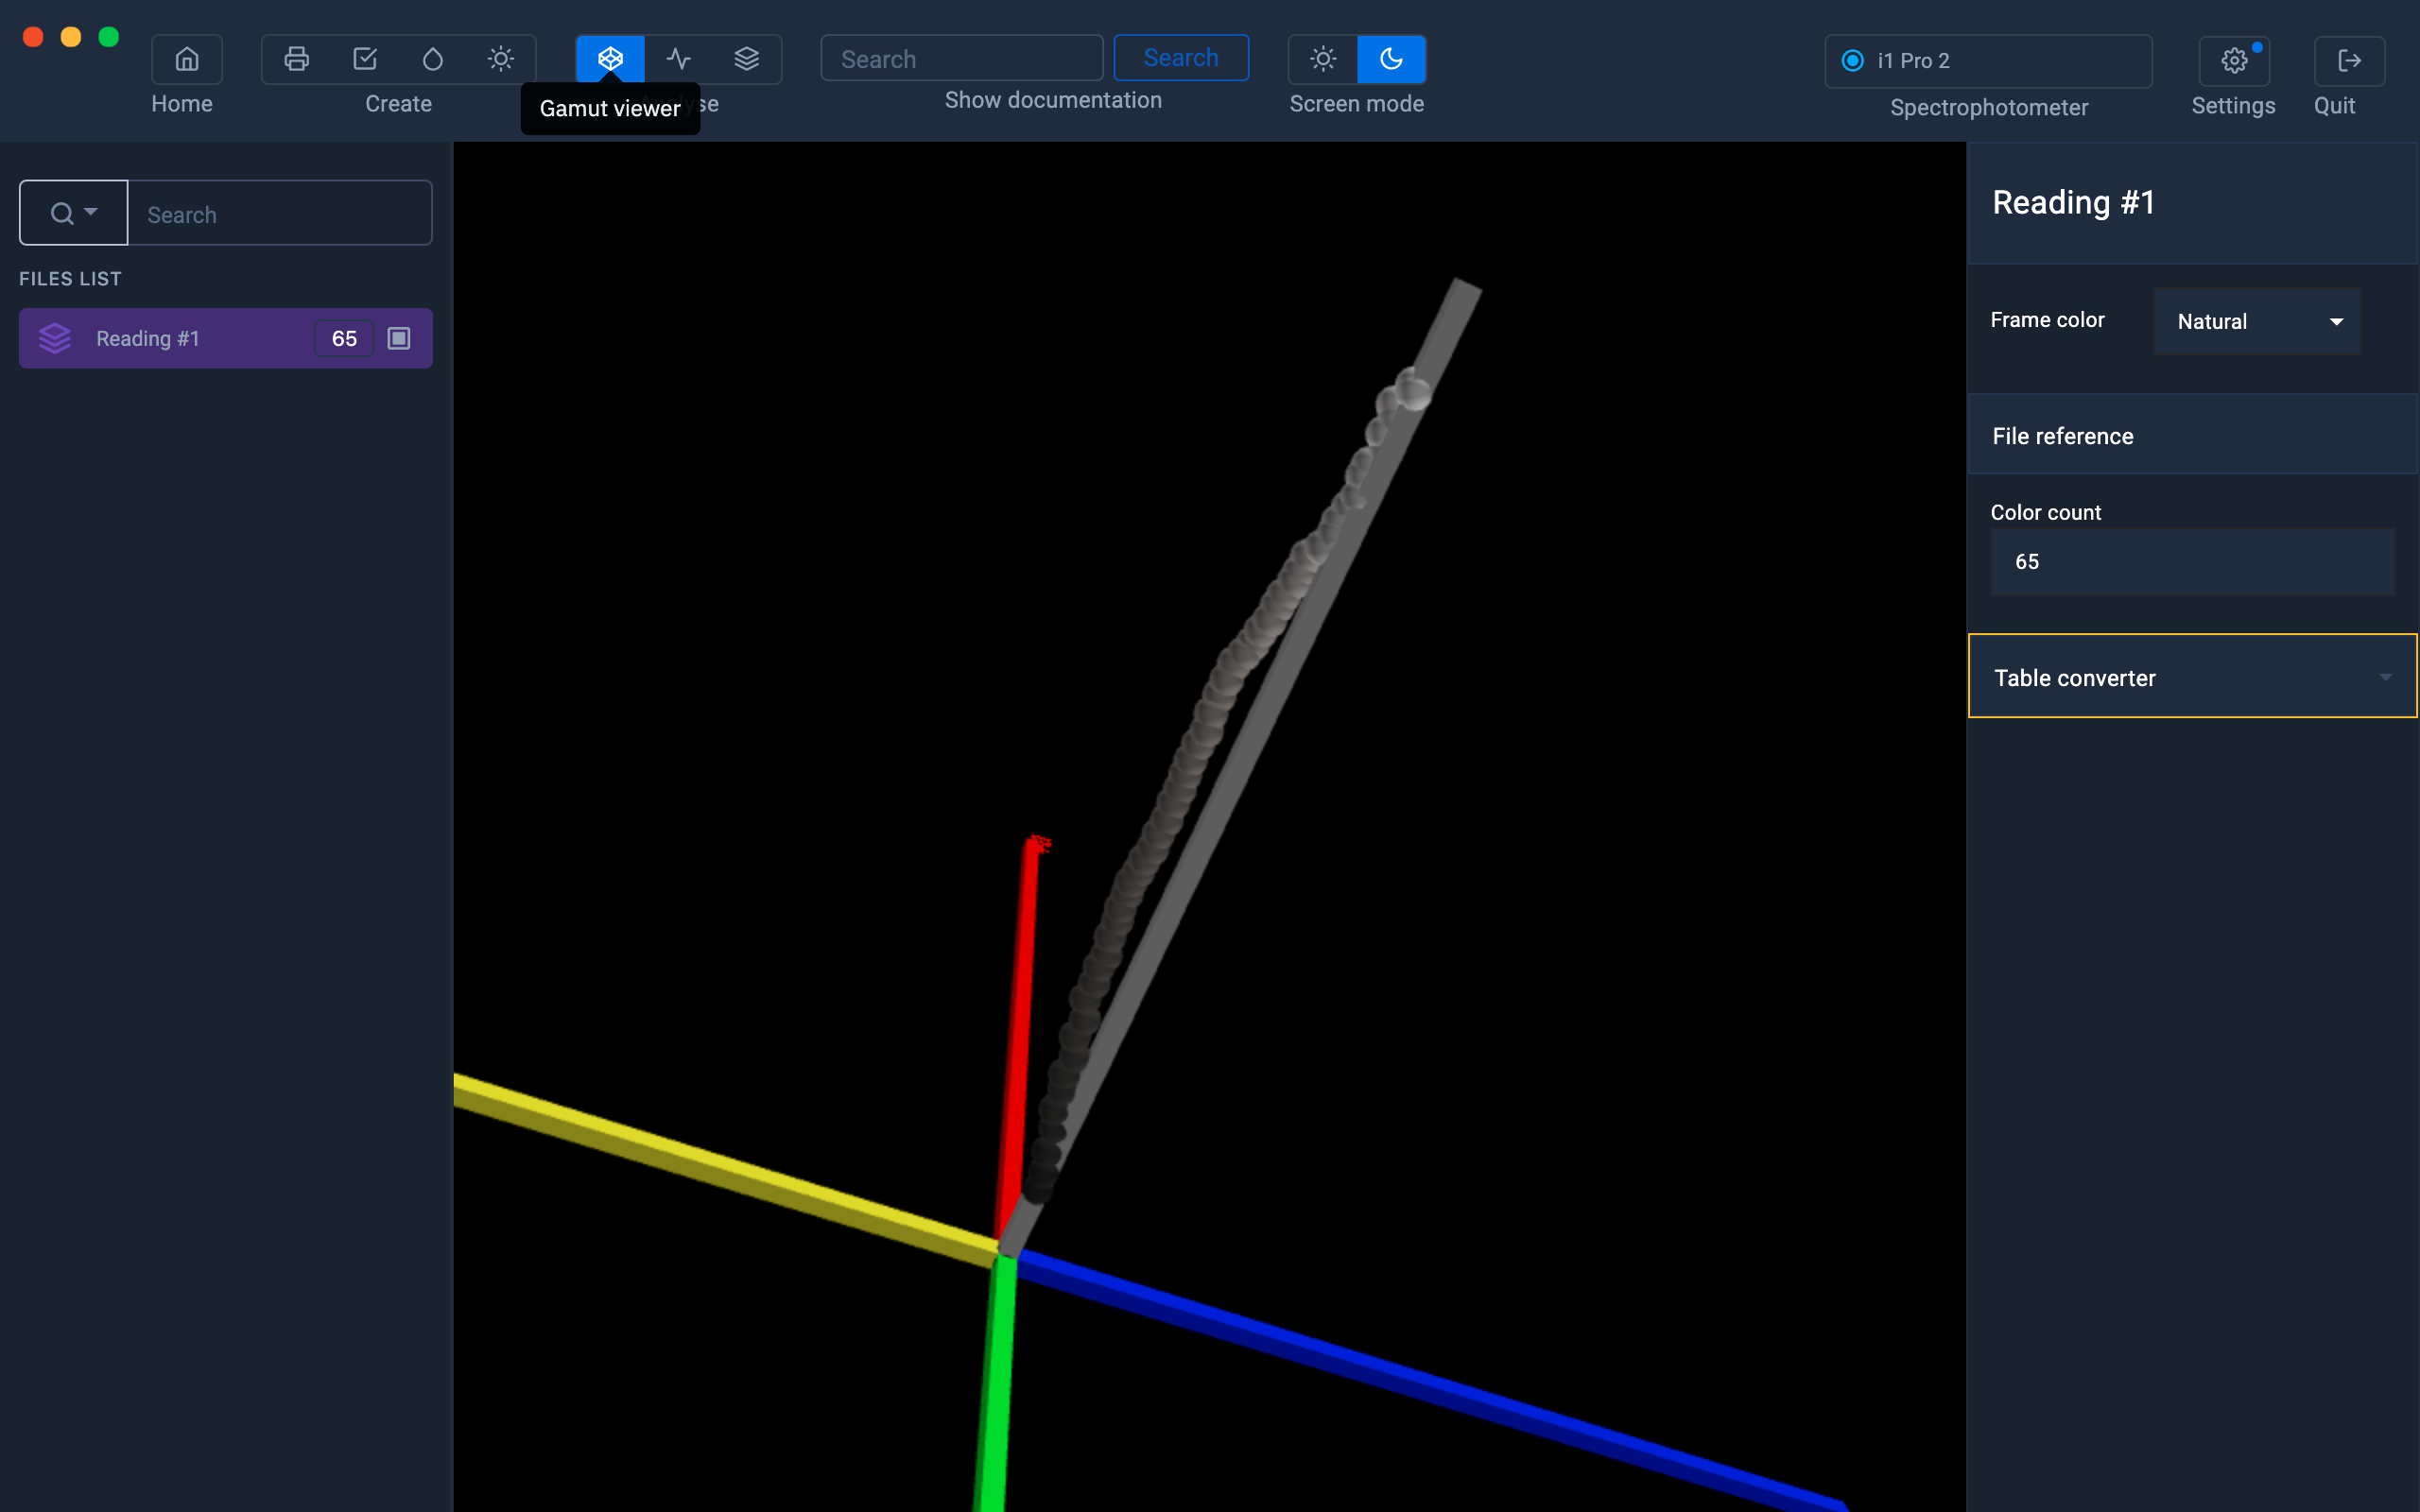
Viewing the reference measurement in the Gamut Viewer (optional step)
It may be interesting to display the result of the measurement of the gray scale in 3D to highlight any dominants.
Import the previously saved .table file
Display it in the Gamut Viewer
In the example below, we can see that the grays have a dominant which tends towards yellow.
Creation of the "Print Control" .pctrl file
Click on the " Measurement completed " button
In the information window, only the name of the setting is mandatory.
The other information is optional.
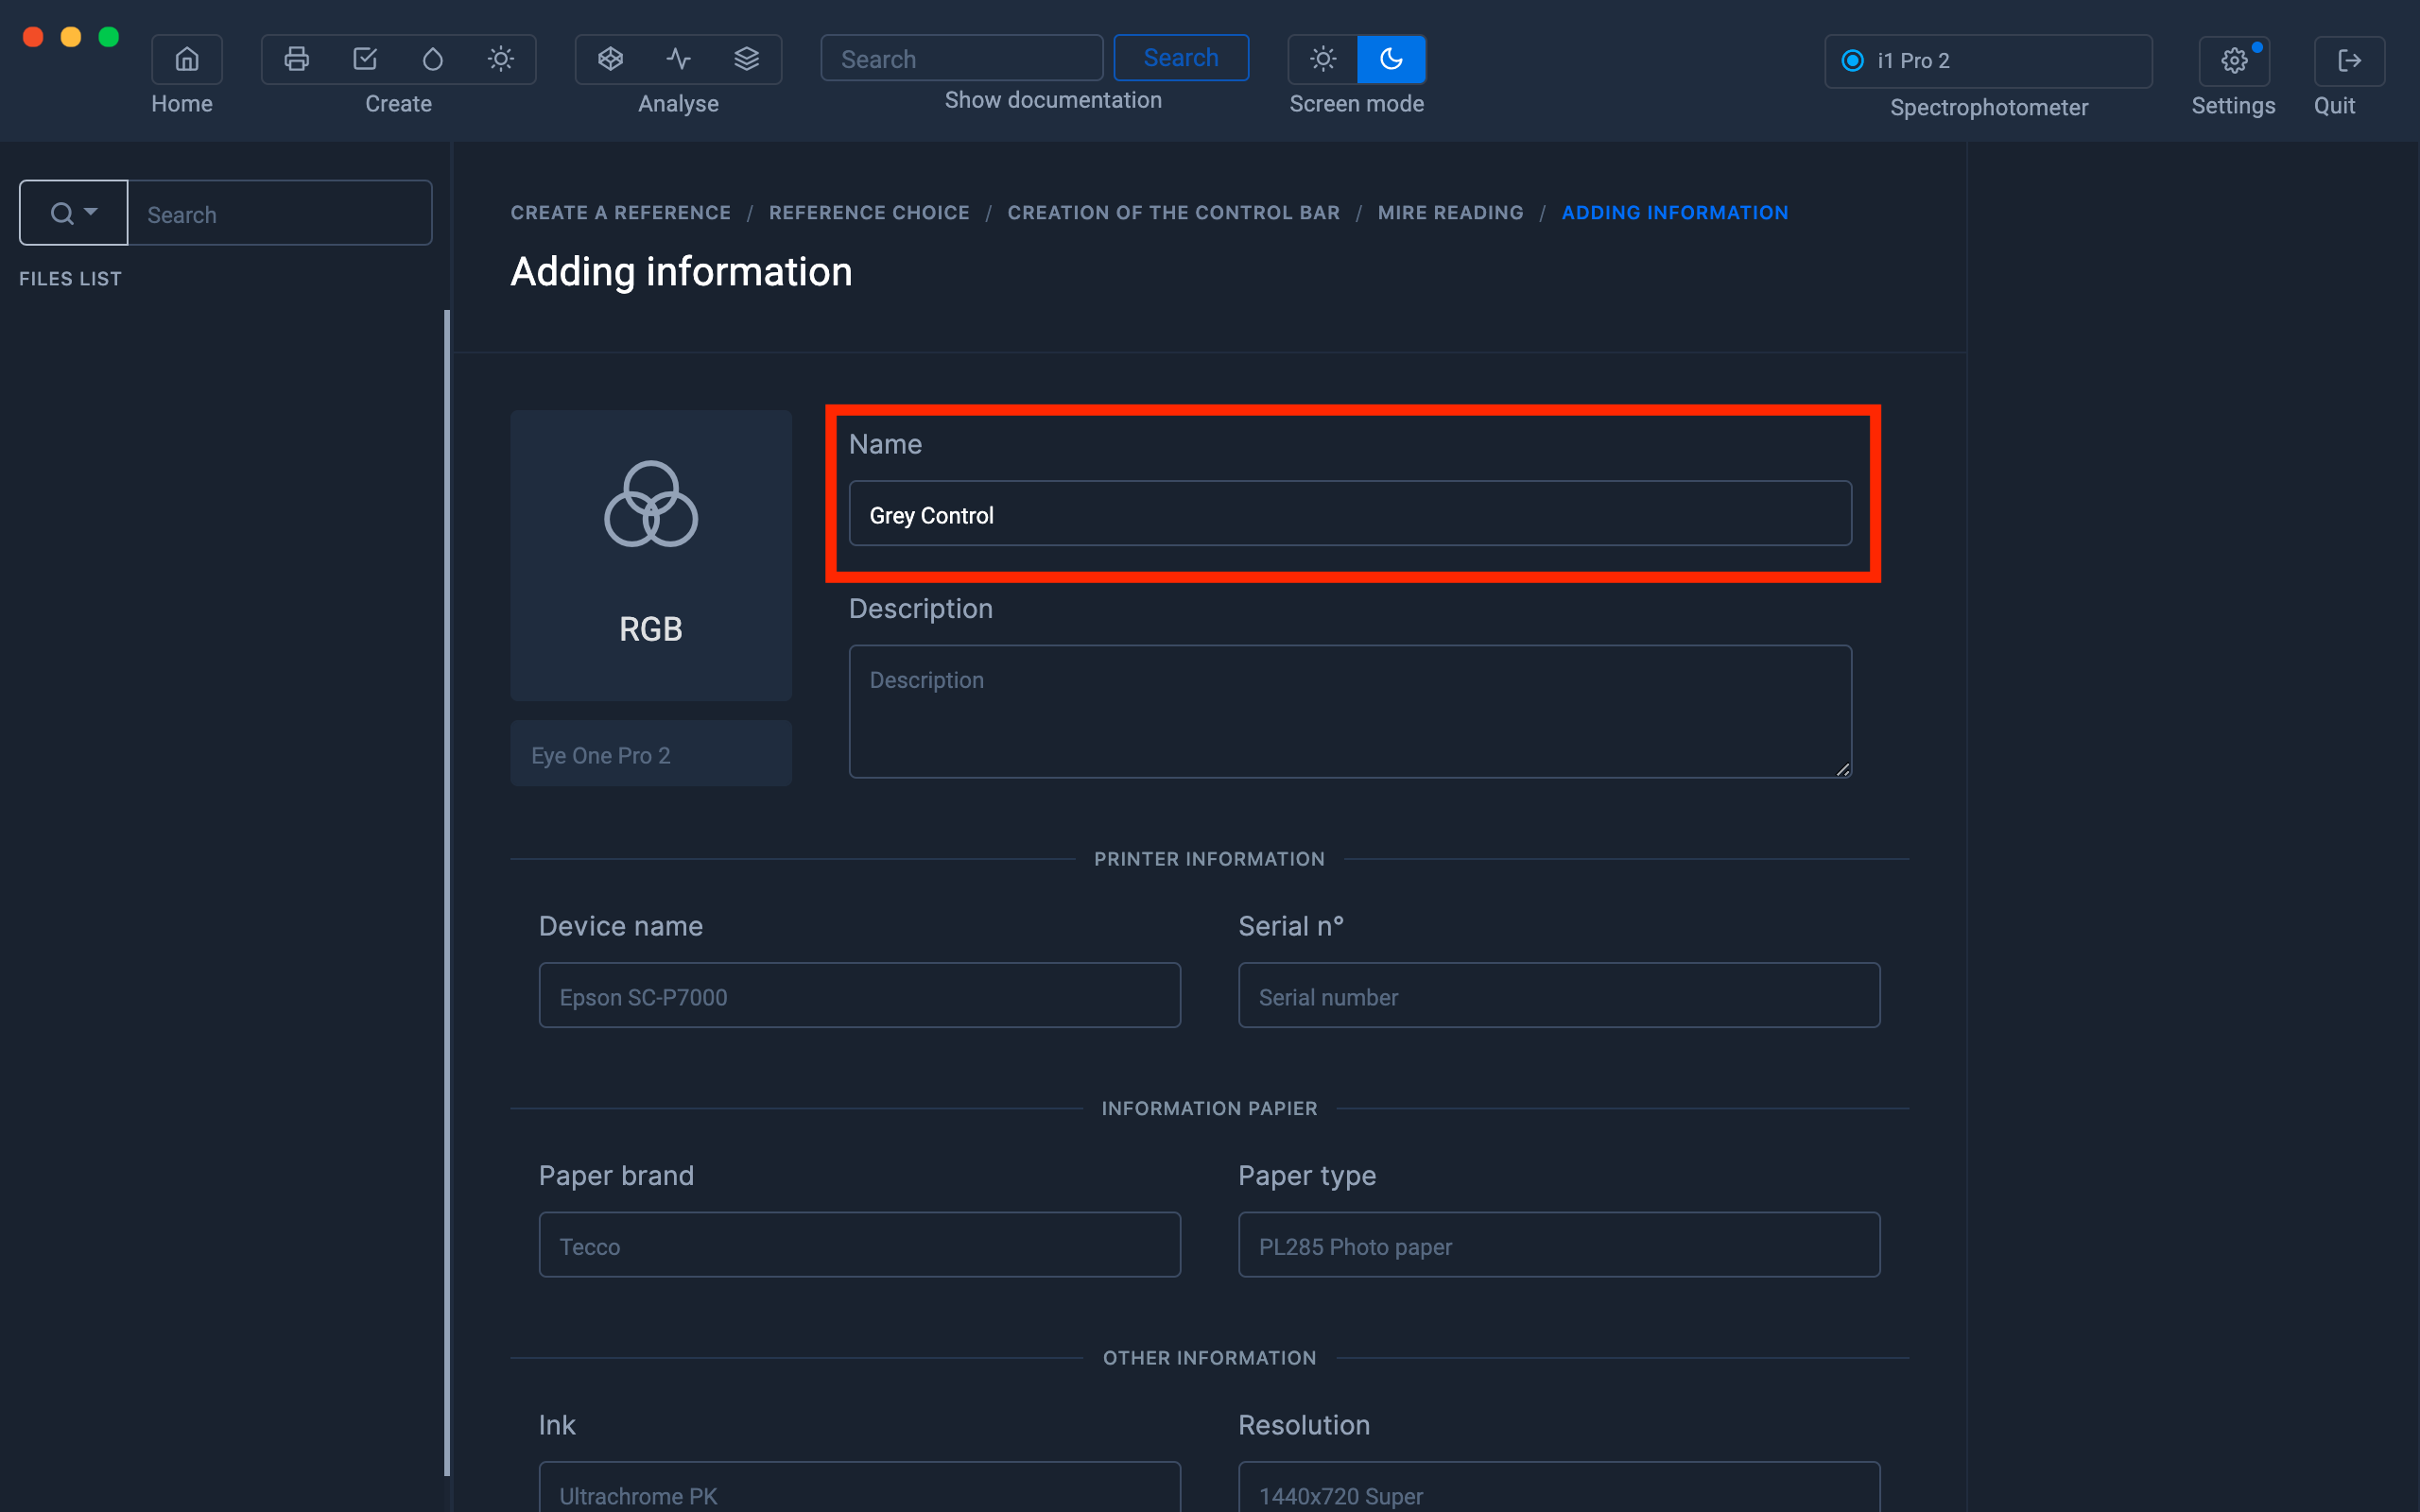
When you have finished filling in the information, click on the " Save and Exit " button.
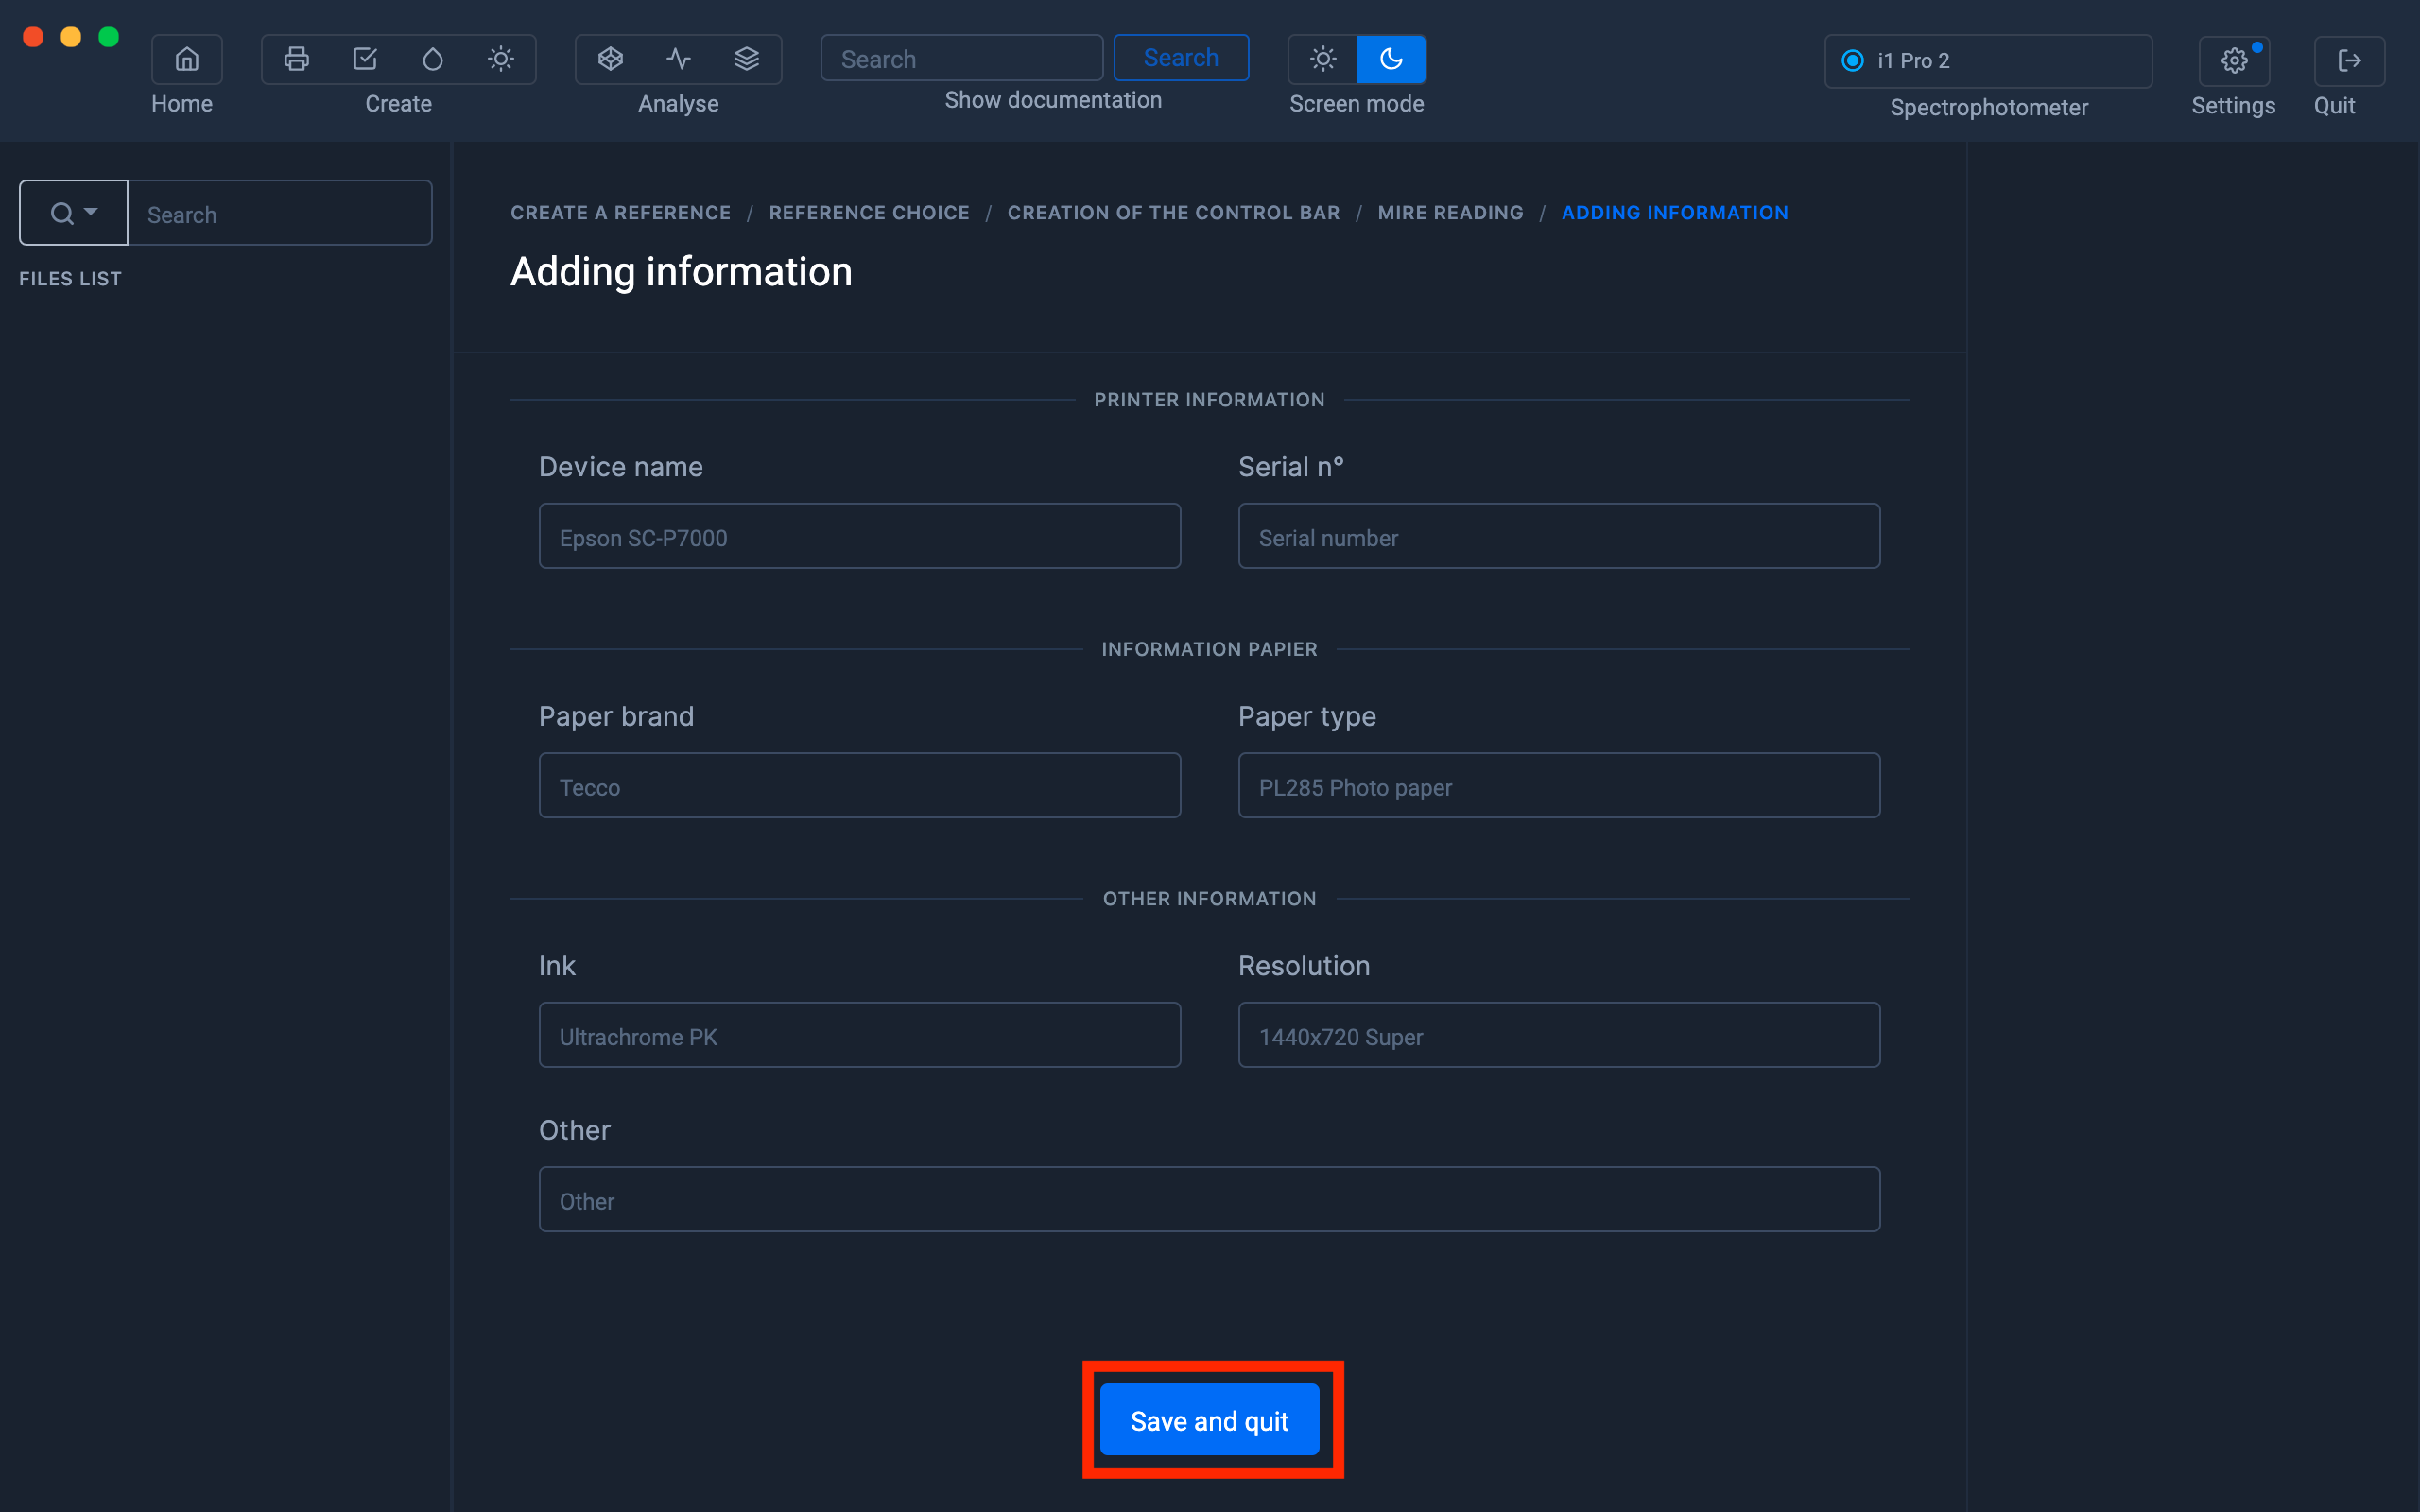
The Print Control file appears in the left column
Checking a gray scale against the values of the reference scale.
Comparing a gray scale with respect to the values of a reference range can be useful for:
- Monitoring the stability of your printer
- Checking the emulsion of your media
- Comparing the calibration of your printer fleet
- etc ...
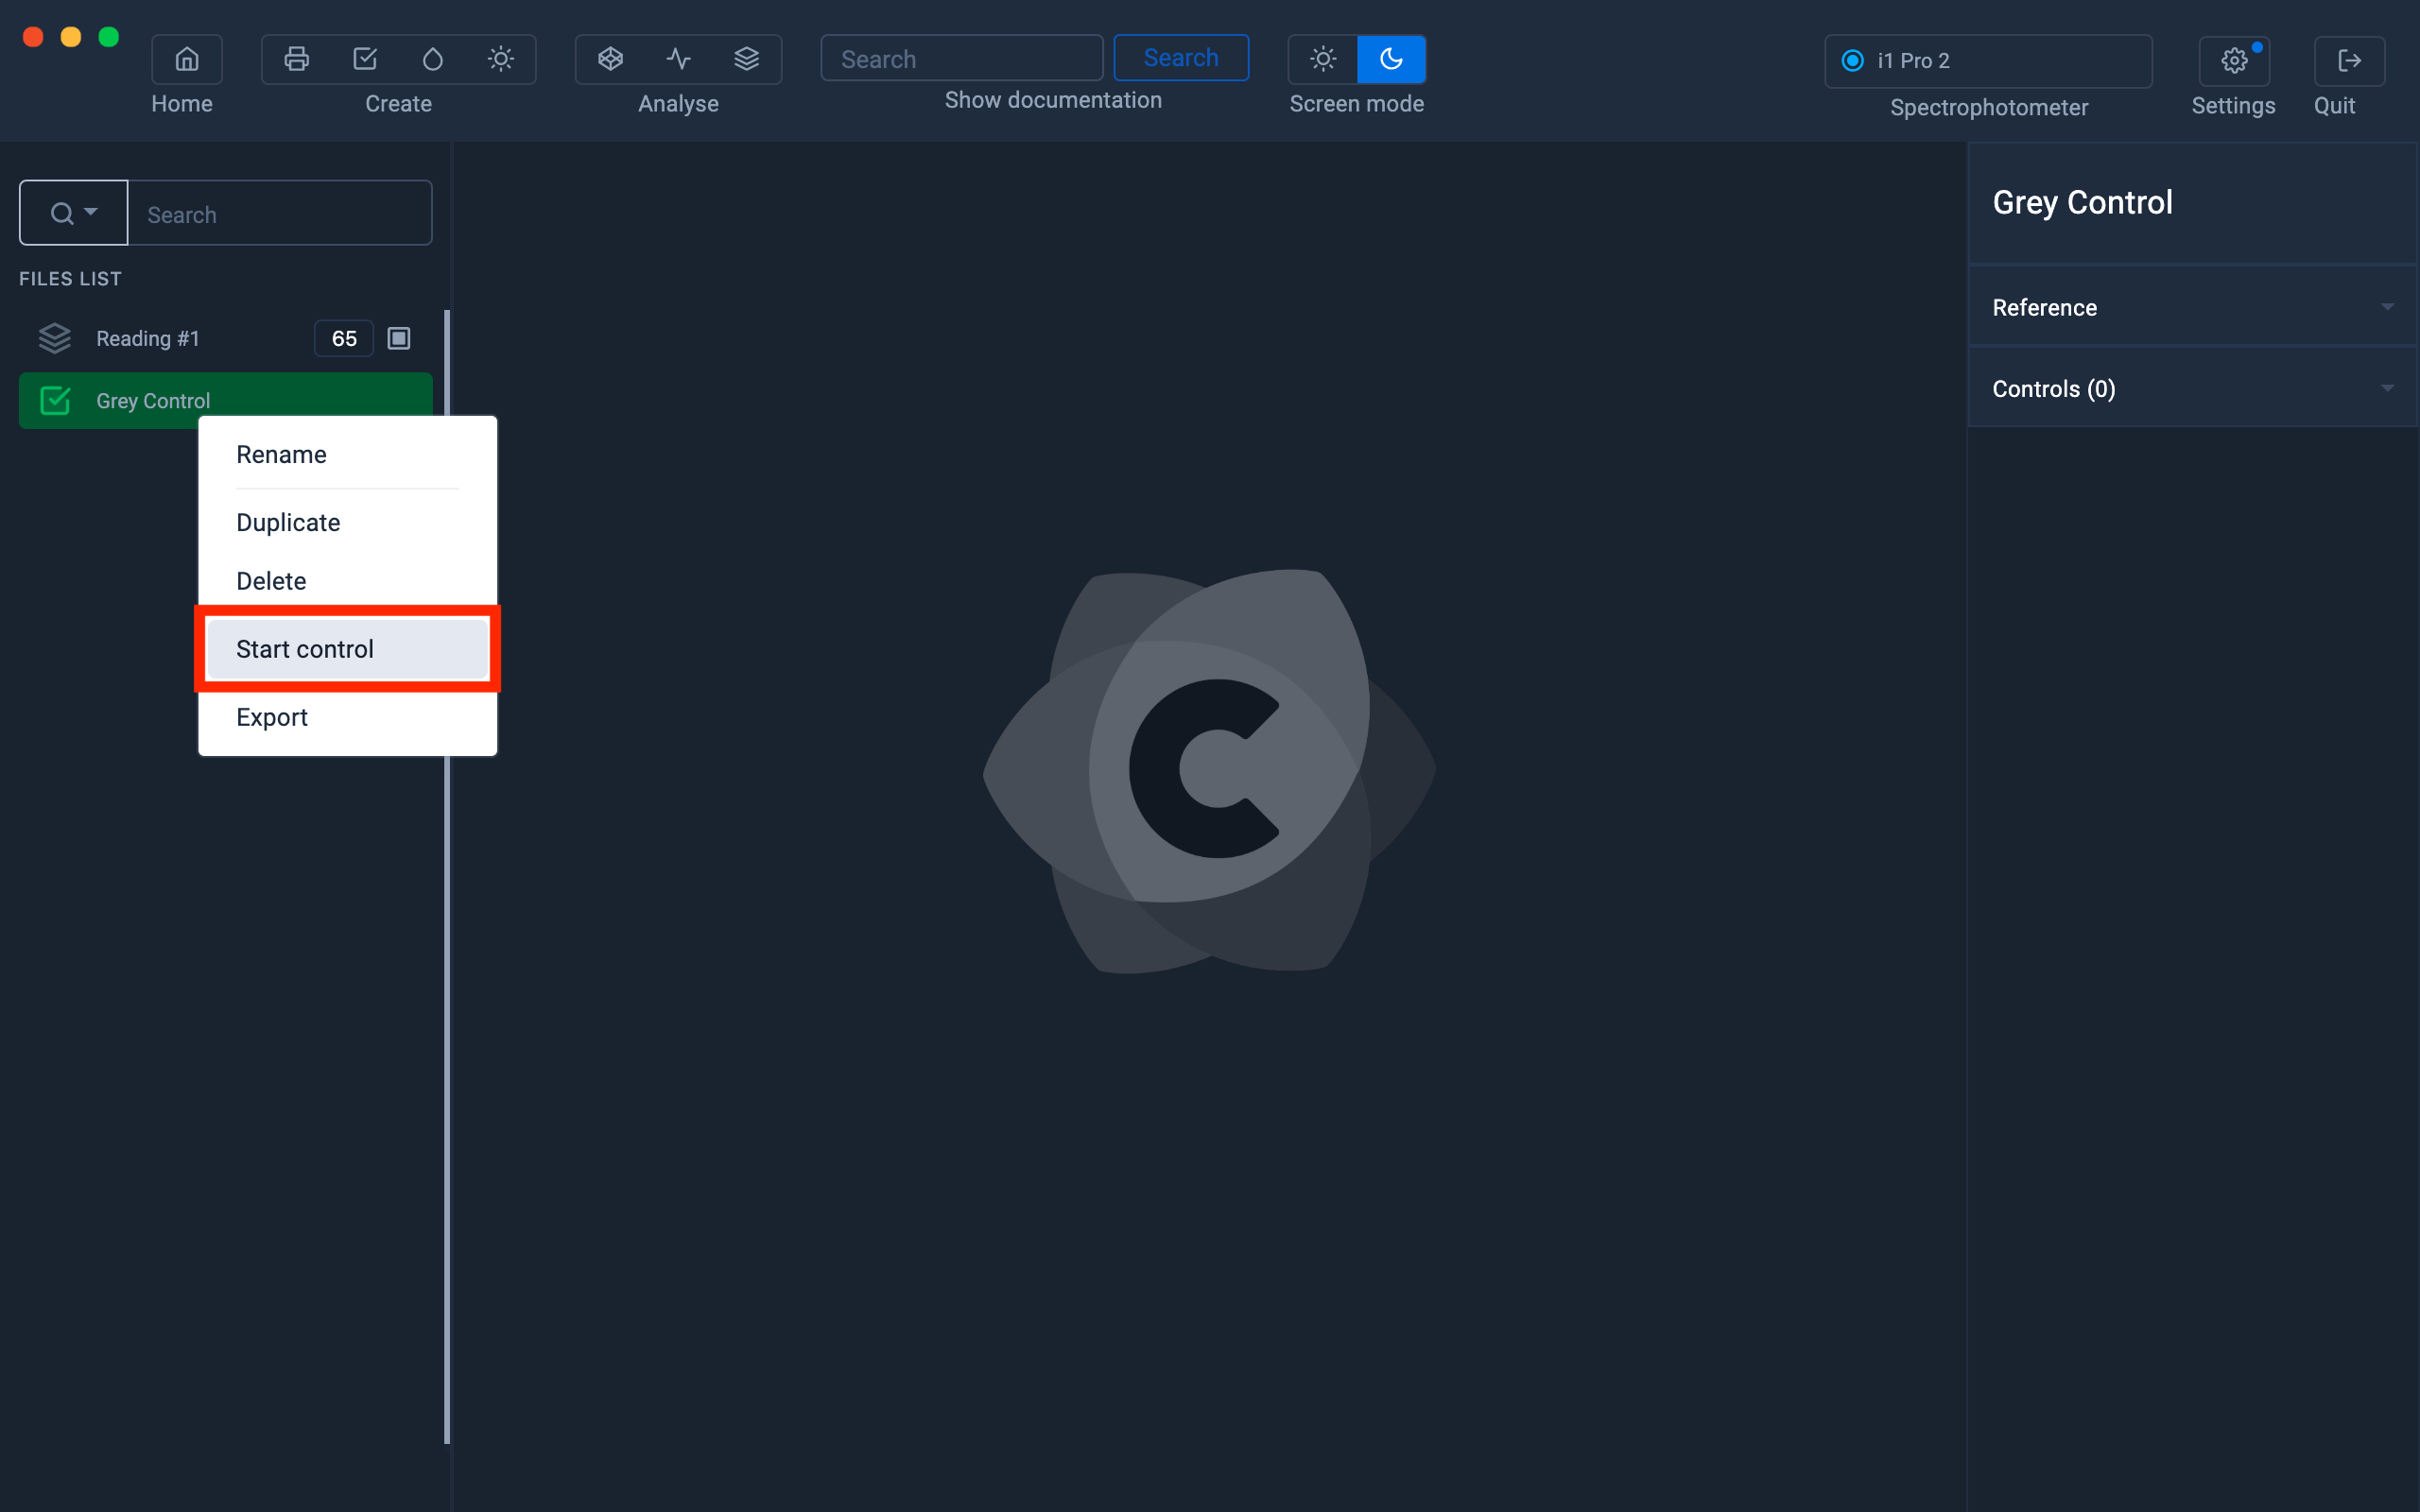
You can now start measuring another gray scale to compare it to the reference gray scale values.
Select the "Print control" file in the left column, then right click to select the " Start control " option.
To find out more, see the chapter : Checking a range
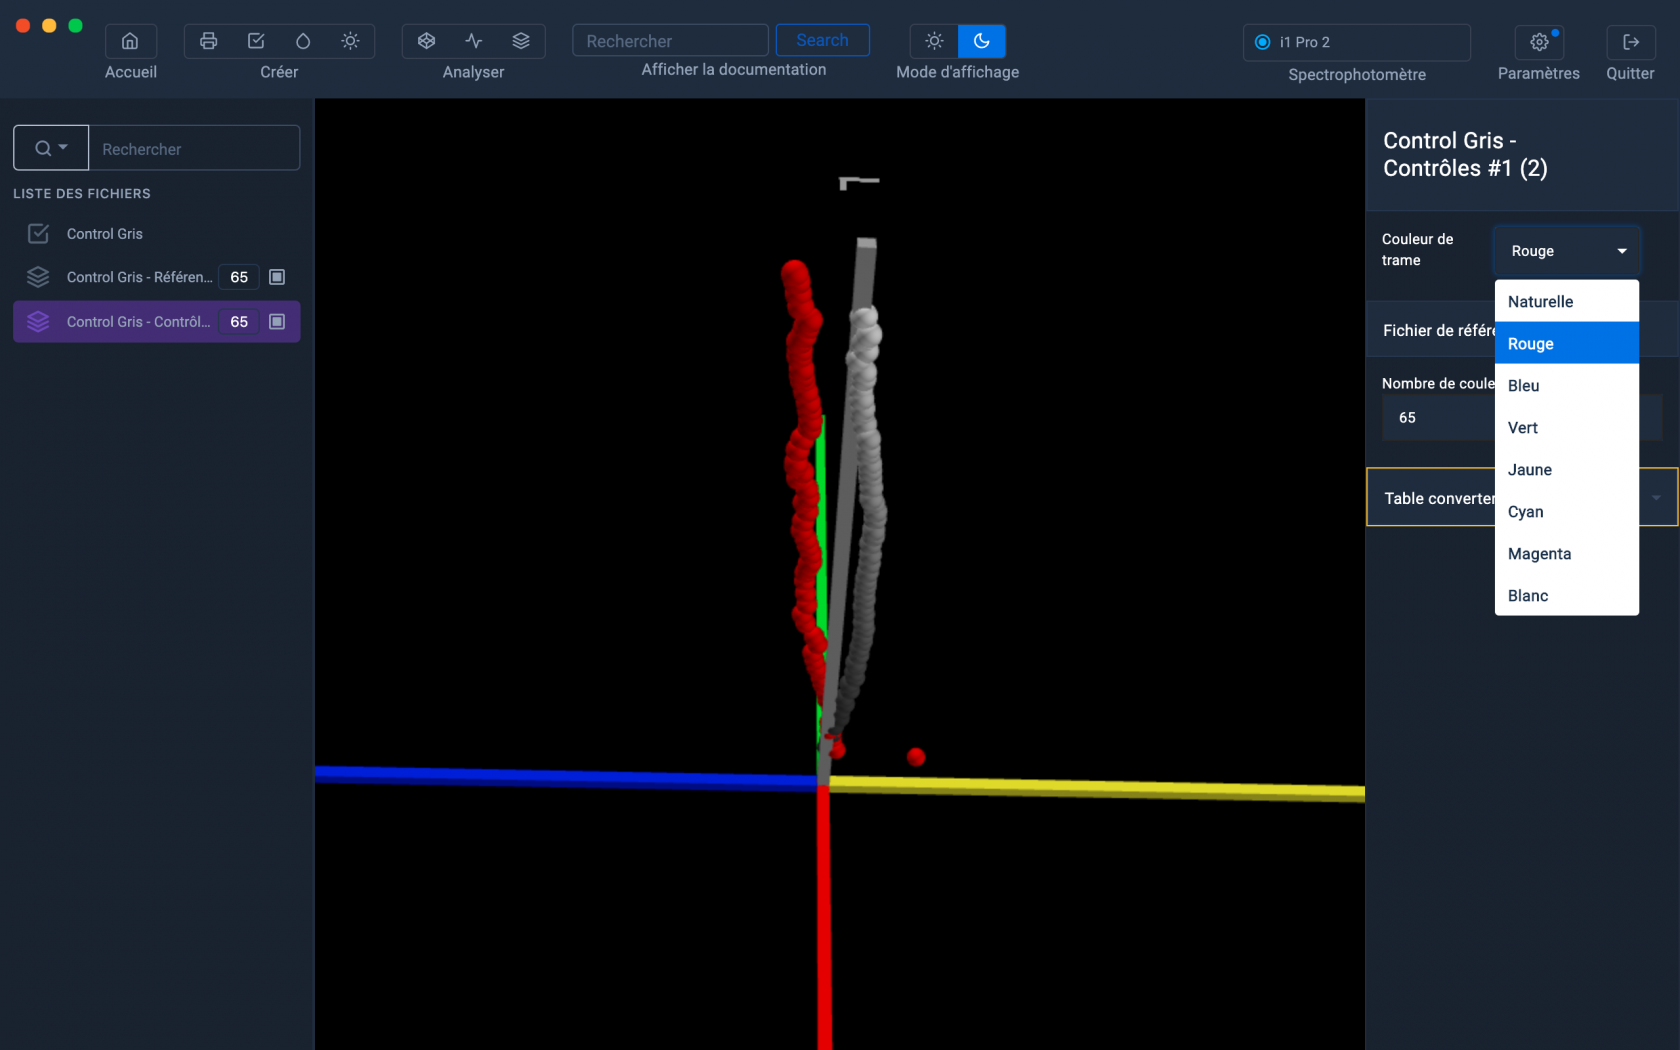
3D comparison of a control measurement with the reference measurement
When you have carried out several control measurements, you have the possibility to compare them visually in the Gamut Viewer.
To do this, click on the purple icon located in the "Reference" tab, then on the one located in the "Controls" tab.
The measurement tables will appear in the left column.
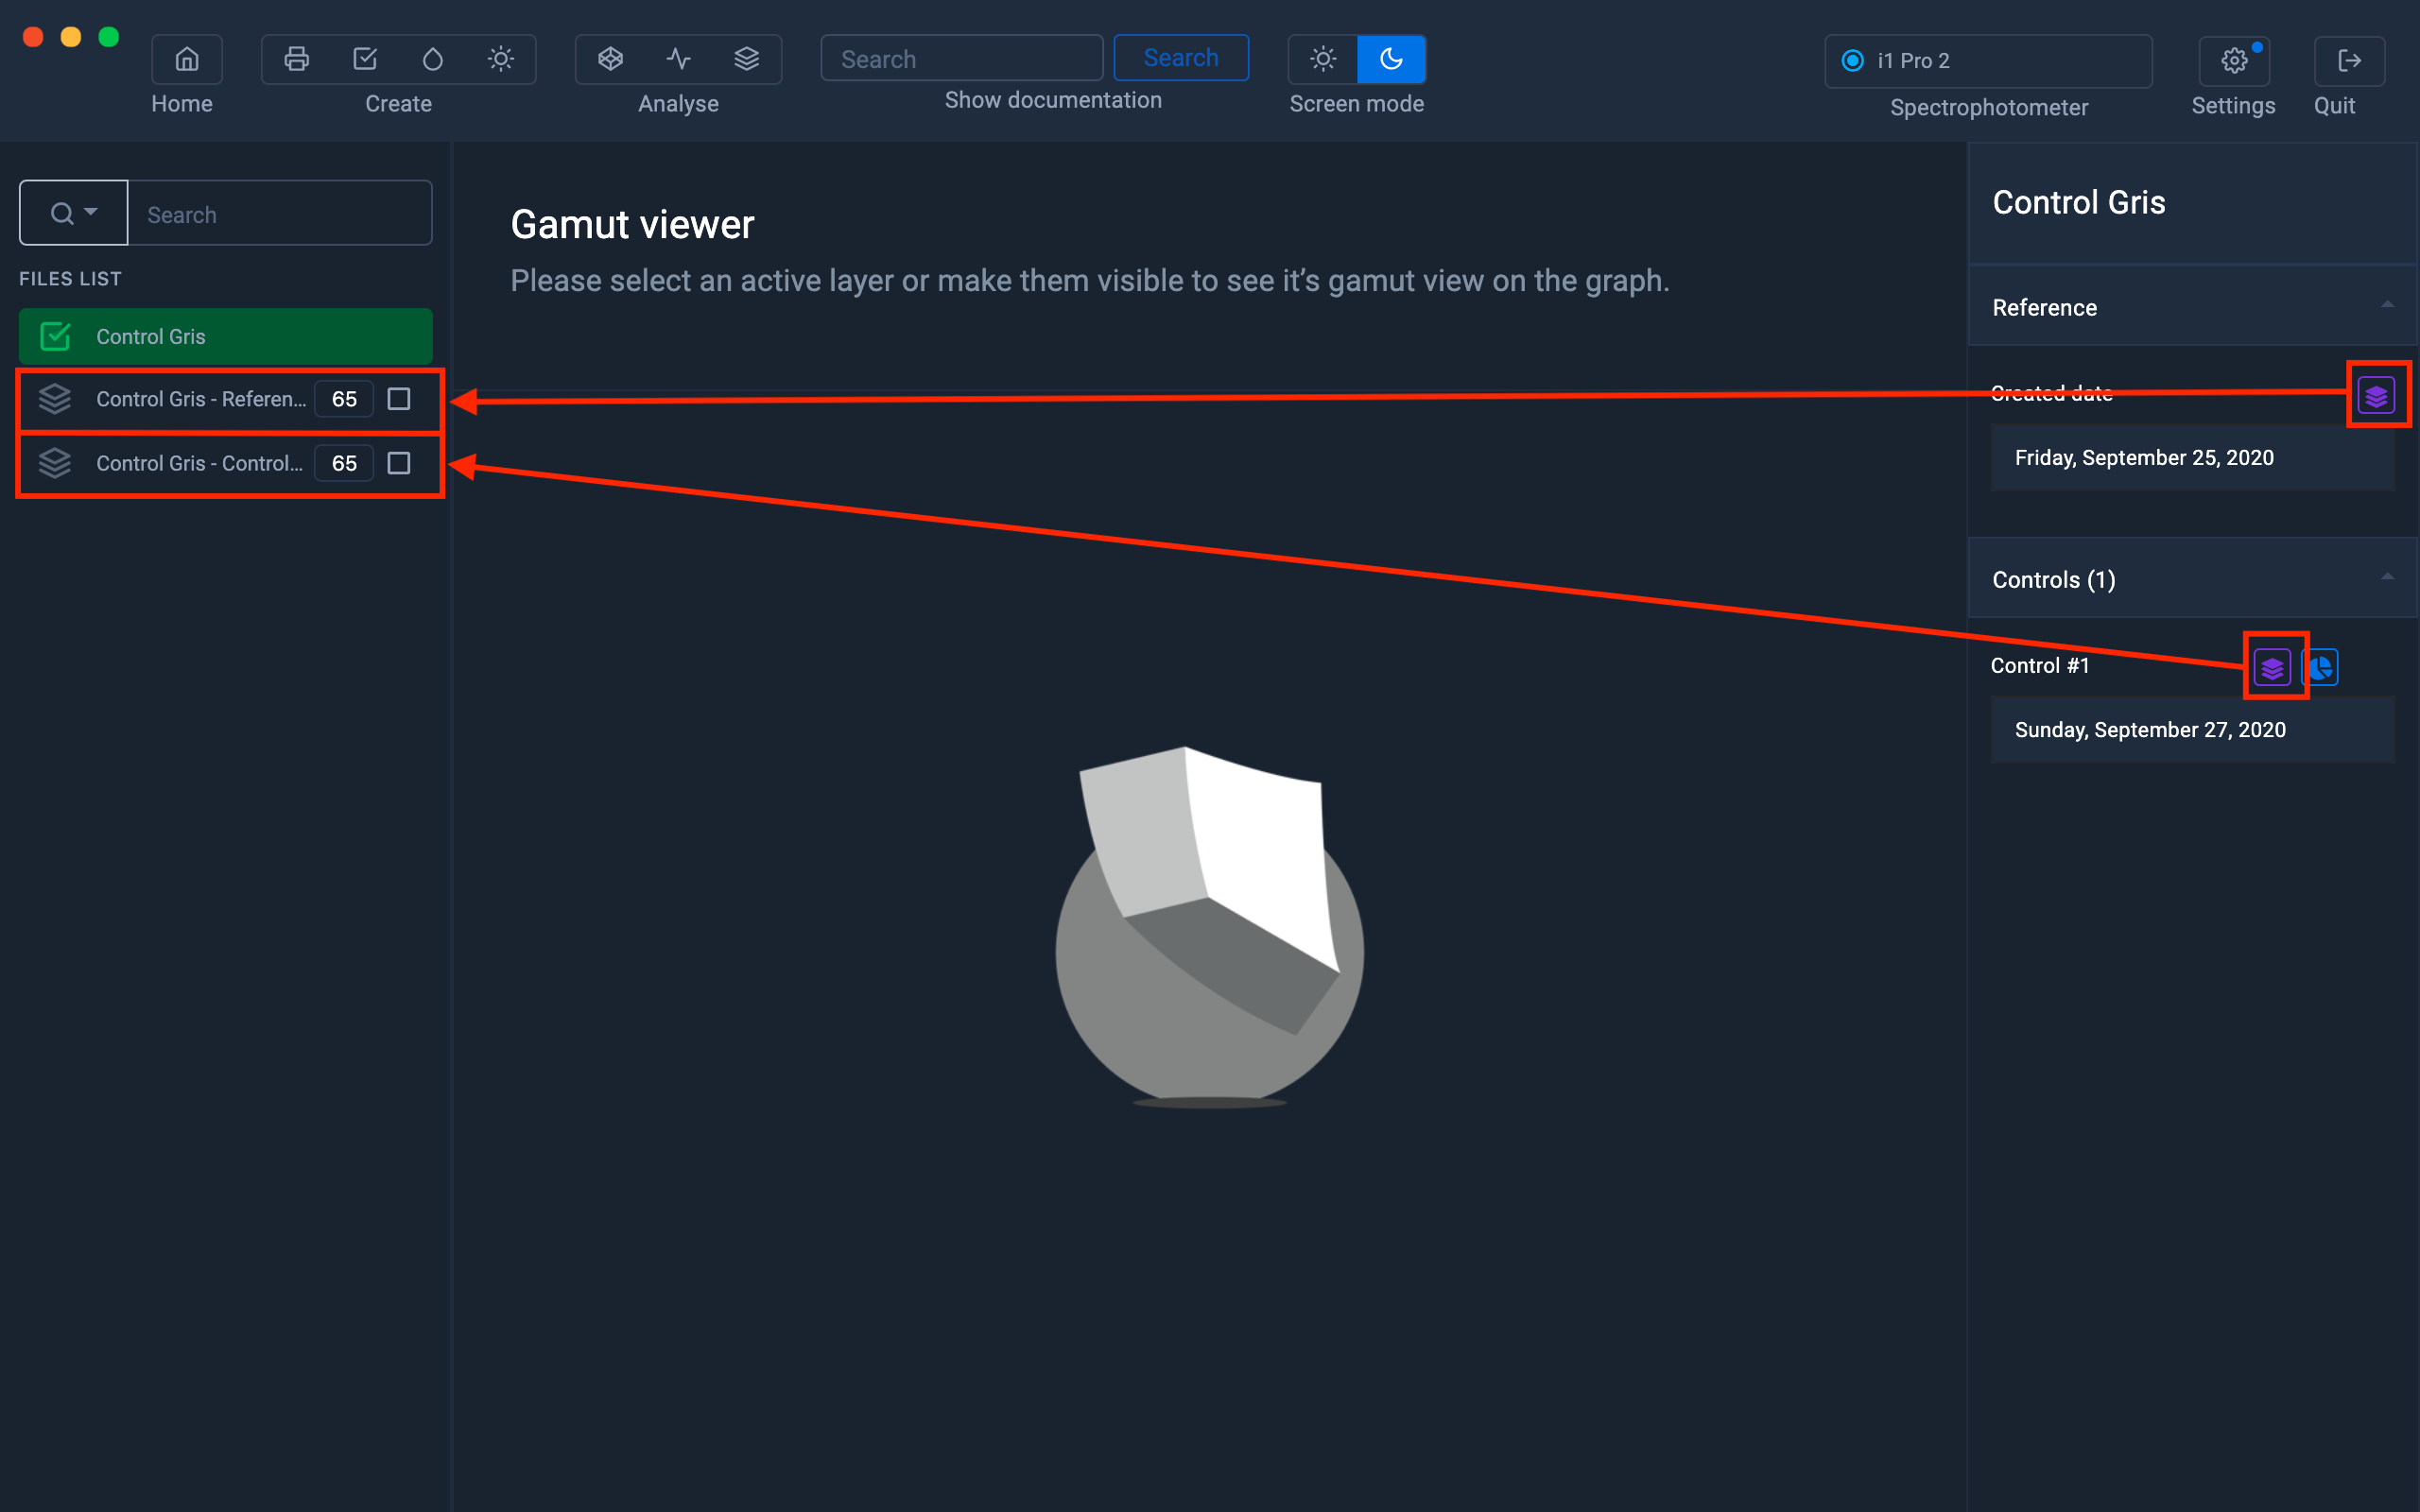
Launch the Gamut Viewer interface to display in 3D the measurements of the previously measured ranges.
To better discern the control measures, it is possible to assign a color. It is of course possible to display several measurements at the same time.
For more information, see the chapter: Gamut Viewer