Create a profile from a standard test pattern
This tutorial explains how to create a printing profile starting from a standard test chart without a calibration step.
To faithfully reproduce colors on your printer, you will need a paper profile that matches your printing conditions. (Printer, inks, paper, resolution and illuminant)
By default, you can use the profiles and settings provided by the paper manufacturer.
But sometimes this is not enough, maybe you will need more precise chroma to meet your requirements.
In addition, paper manufacturers do not always provide all icc profiles for all printers.
Create your personalized profile
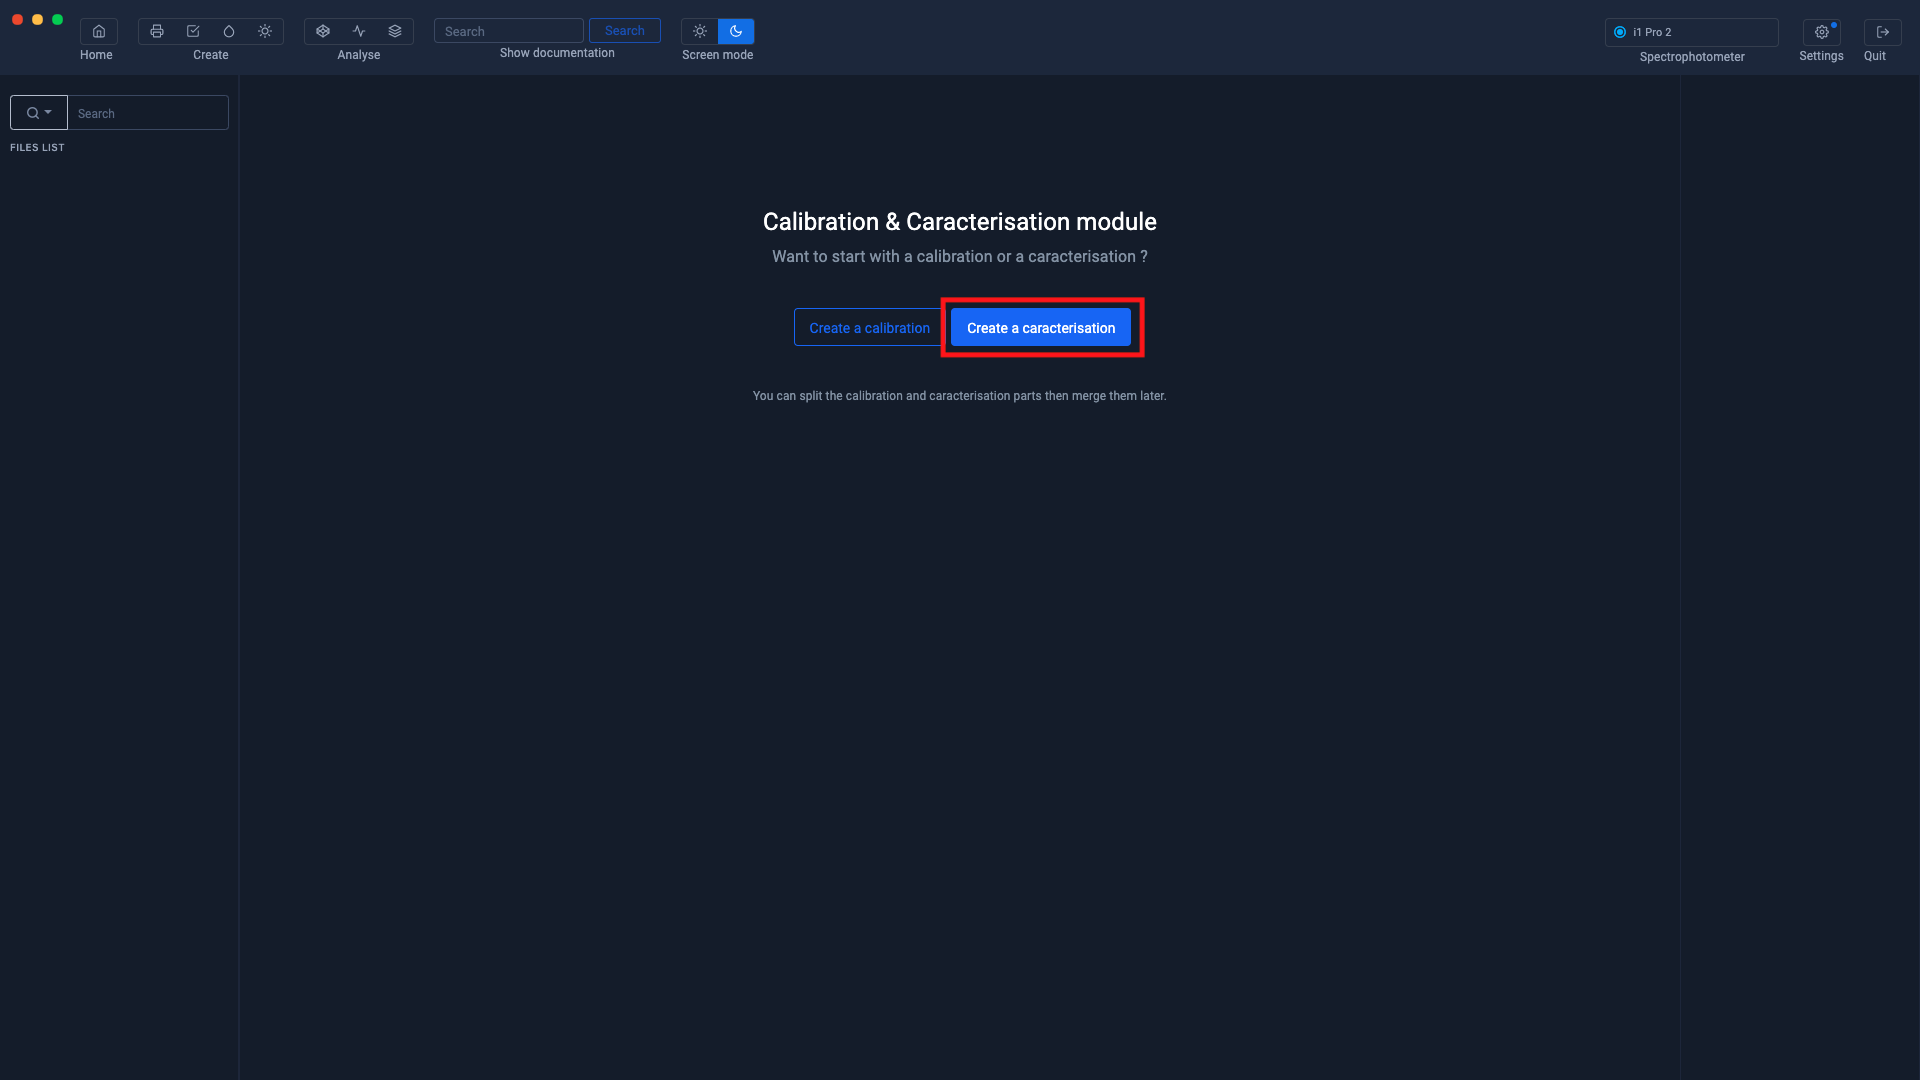
Let's start by launching the profile creation module by clicking on the "Create Profile" logo in the upper left corner.

The "Calibration & Characterization " module window will appear. Click on the " Characterization " button
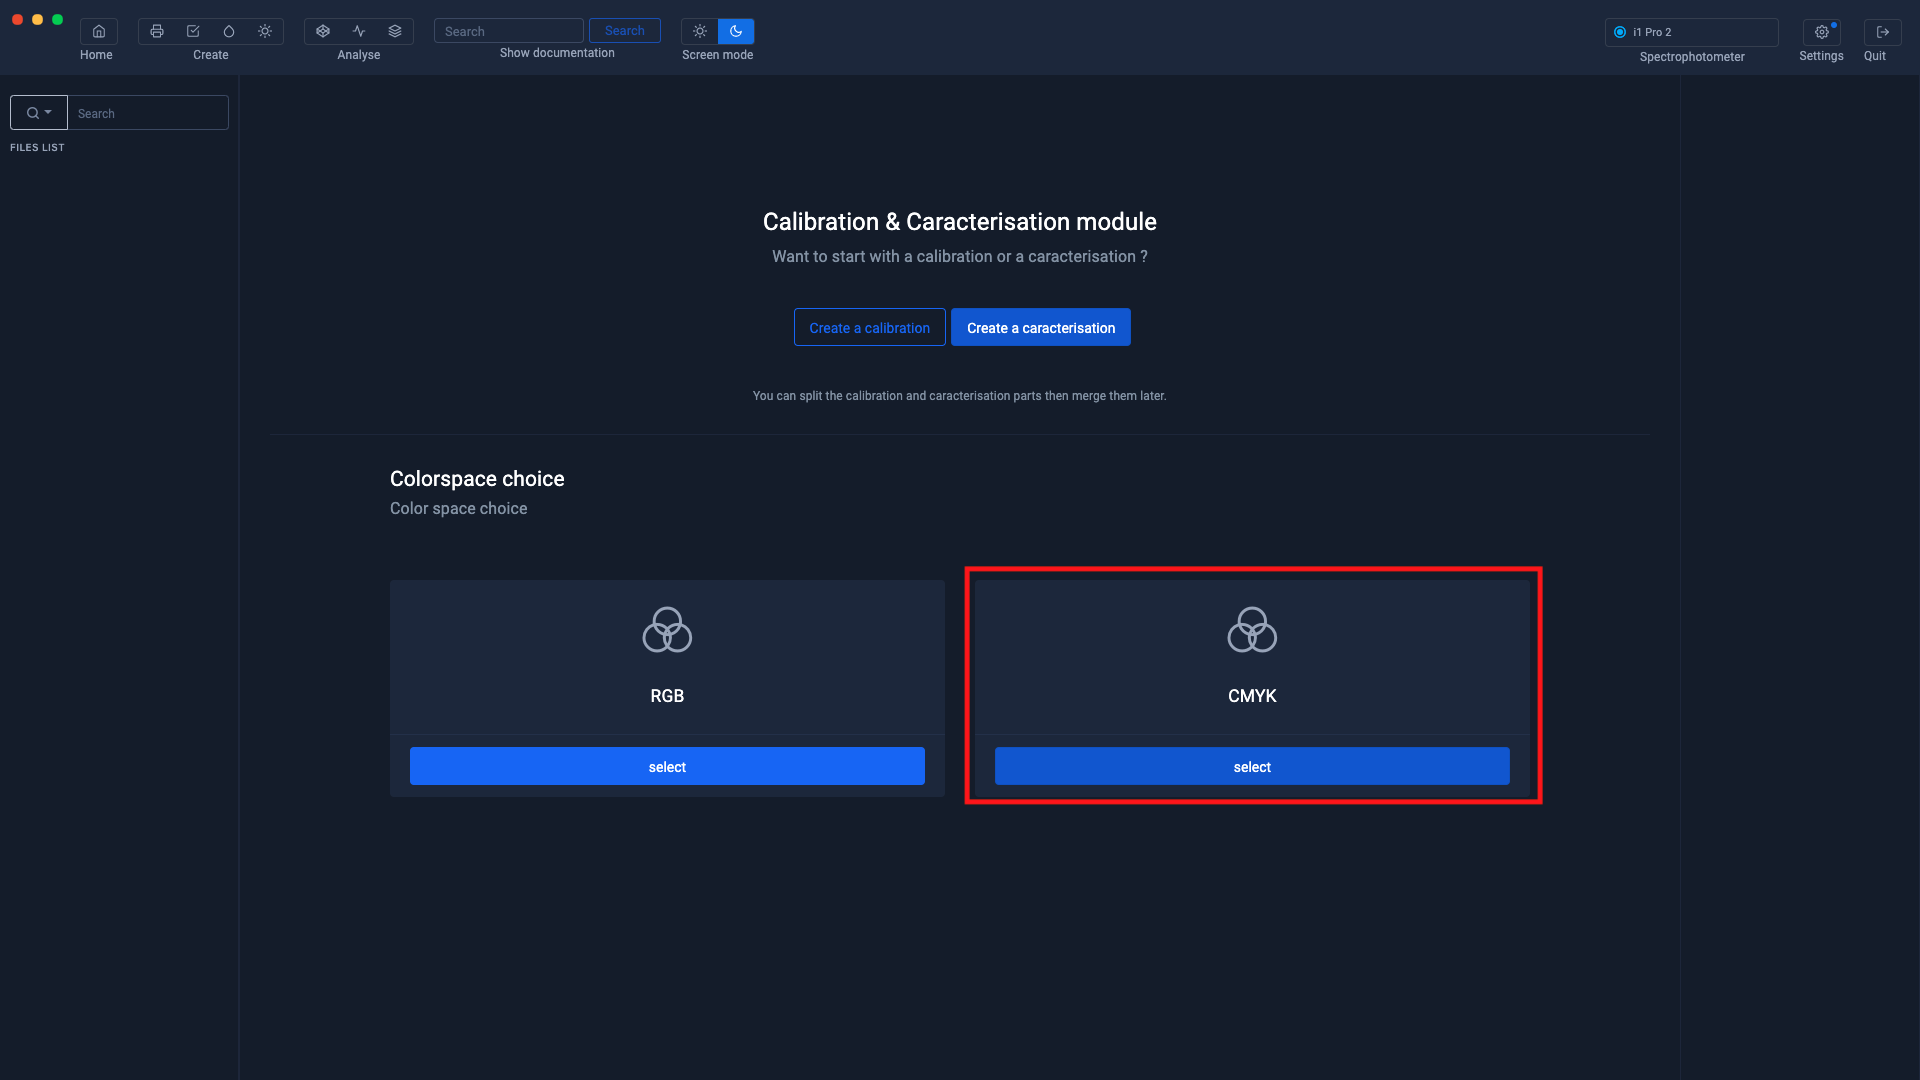
Typically, you will select RGB mode if you need to print from a driver (For example, if you want to print directly from Photoshop or another application without going through printer software (RIP))
If you are printing from a professional RIP (EFI, Caldera, Onyx, Ergosoft, Wasatch, NeoStampa, Epson Edge Print, etc.), you may need to create your ICC profile in CMYK mode.
Selection of the benchmark
Click on the " CMYK " button
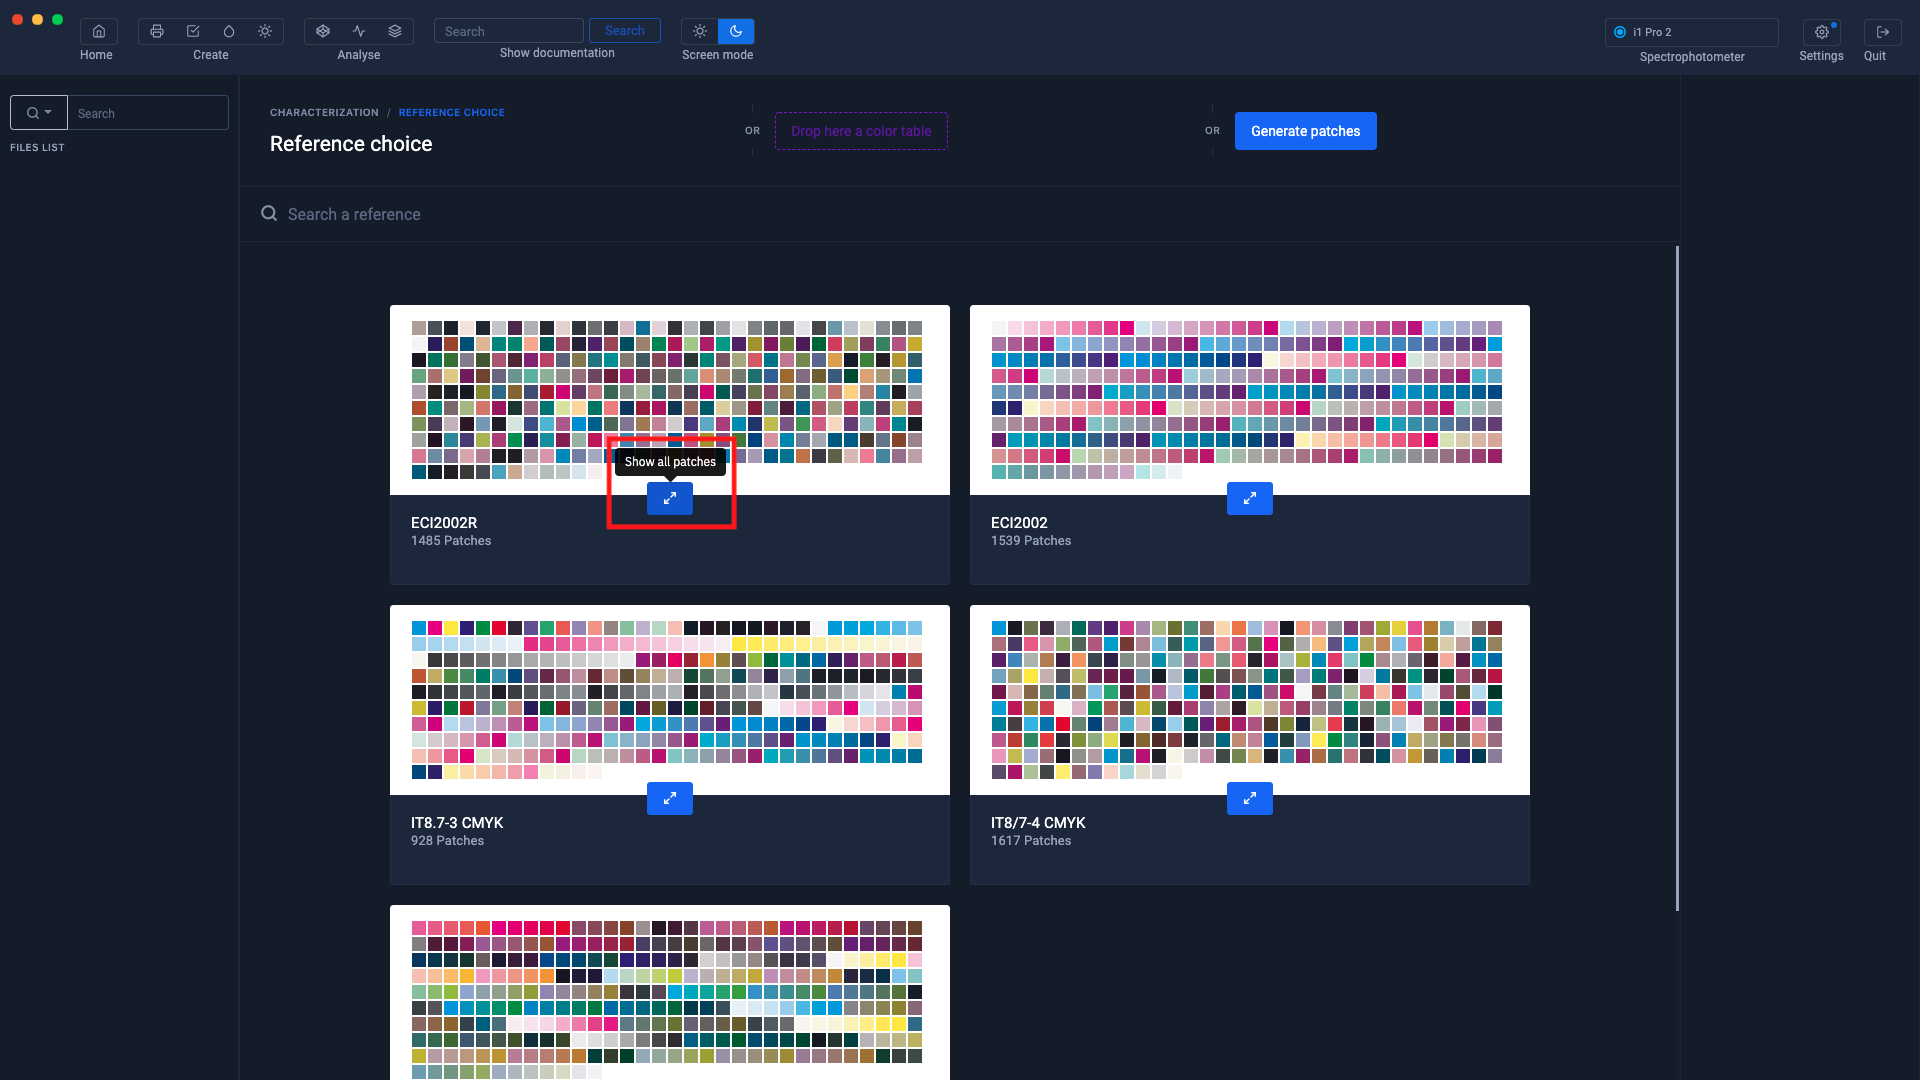
A list of benchmarks appears.
By clicking on the " Show all patches " button you can view all the patches in the range.
This button is located under the crosshairs
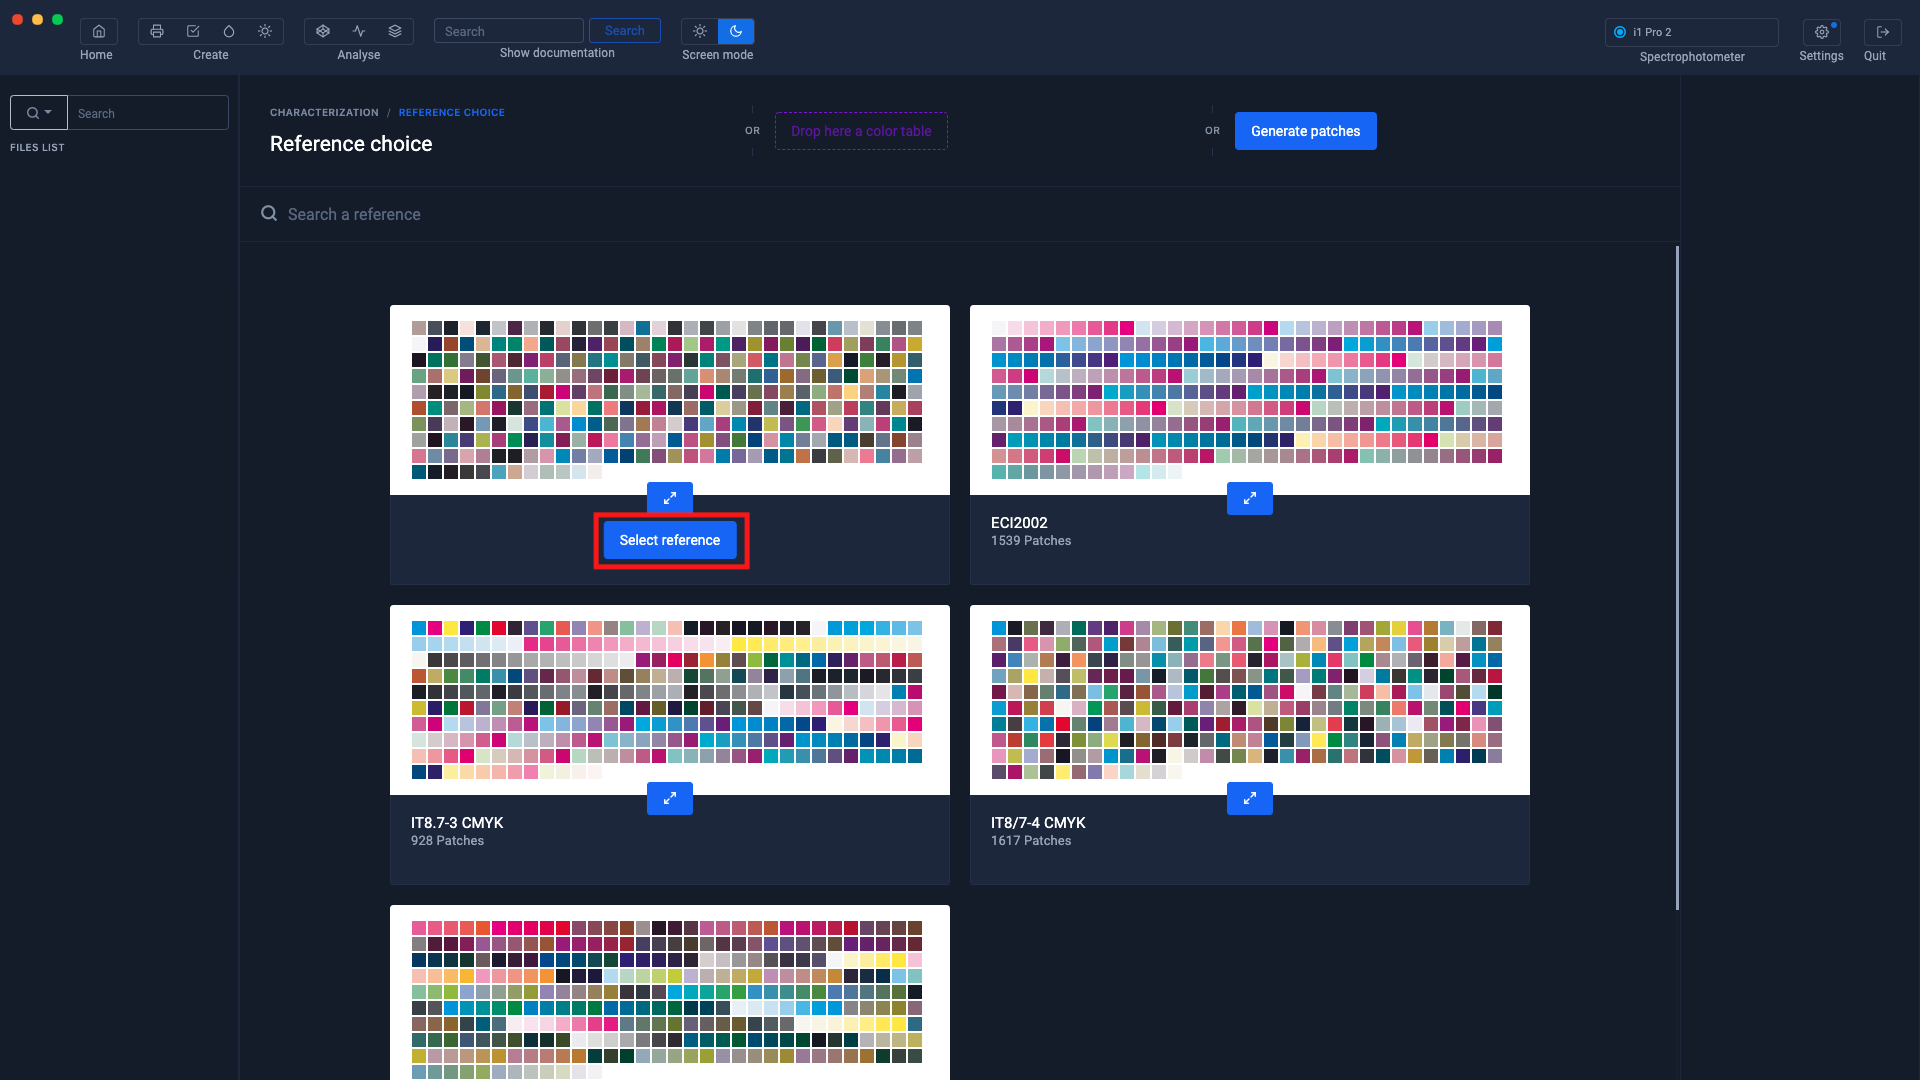
When you hover over the staff with the mouse, a " Select reference " button appears.
Click on the " Select reference " button corresponding to the ECI2002R test pattern
Editing the test pattern
At this step, you can customize your test chart before printing it.
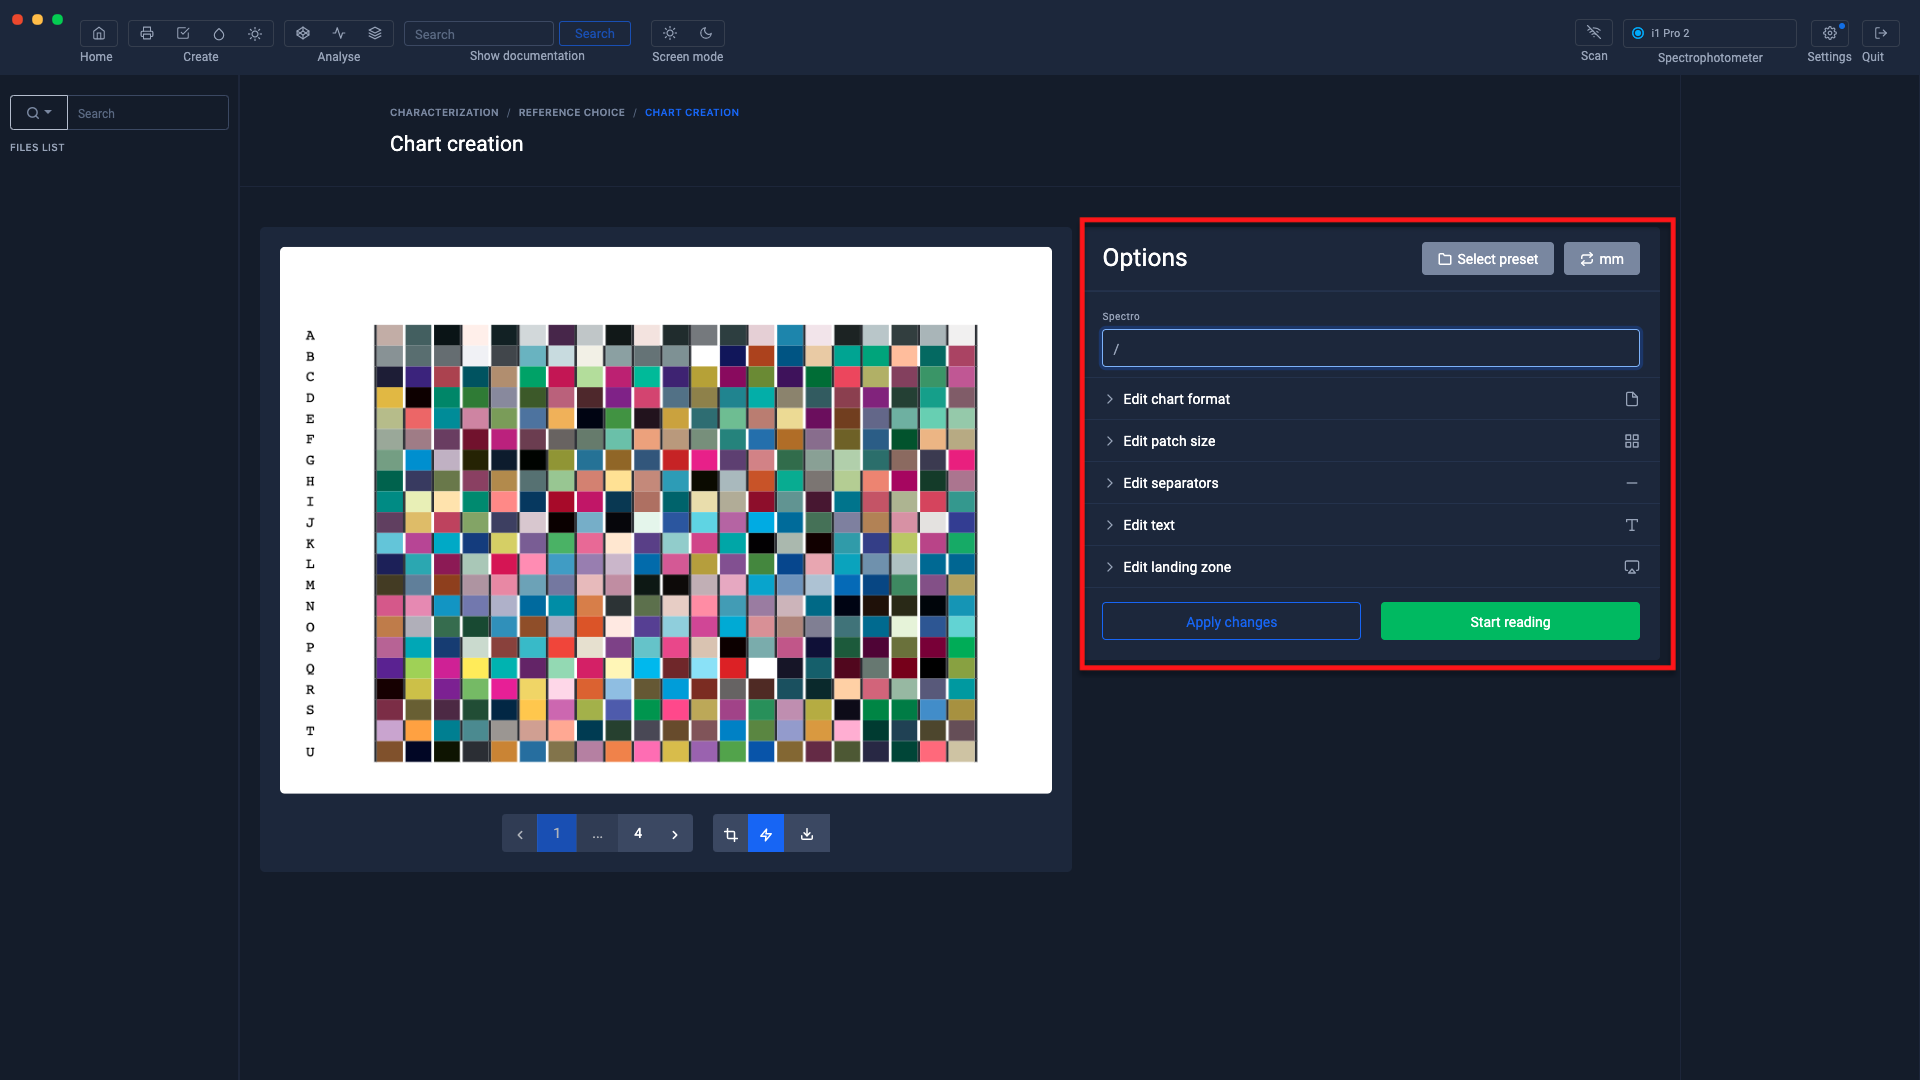
To find out more, see the chapter: Customizing charts
Printing the test pattern
When the test chart is finished, export it in Tiff or pdf format to print it.

Patterns can be made up of multiple pages, depending on the number of patches and the page size.
Important: you must print the ranges without color management.
If the profile is intended to be used by a RIP, you must print the CMYK or RGB targets under the conditions defined by the RIP.
If the profile is intended to be used via a printer driver, you must print the RGB targets under the conditions defined by the printer manufacturer.
For more information, see the chapter: Printing an RGB test patternvia a driver
Target measurement
Once the test chart has been printed, click on the " Start reading " button to start measuring the range.

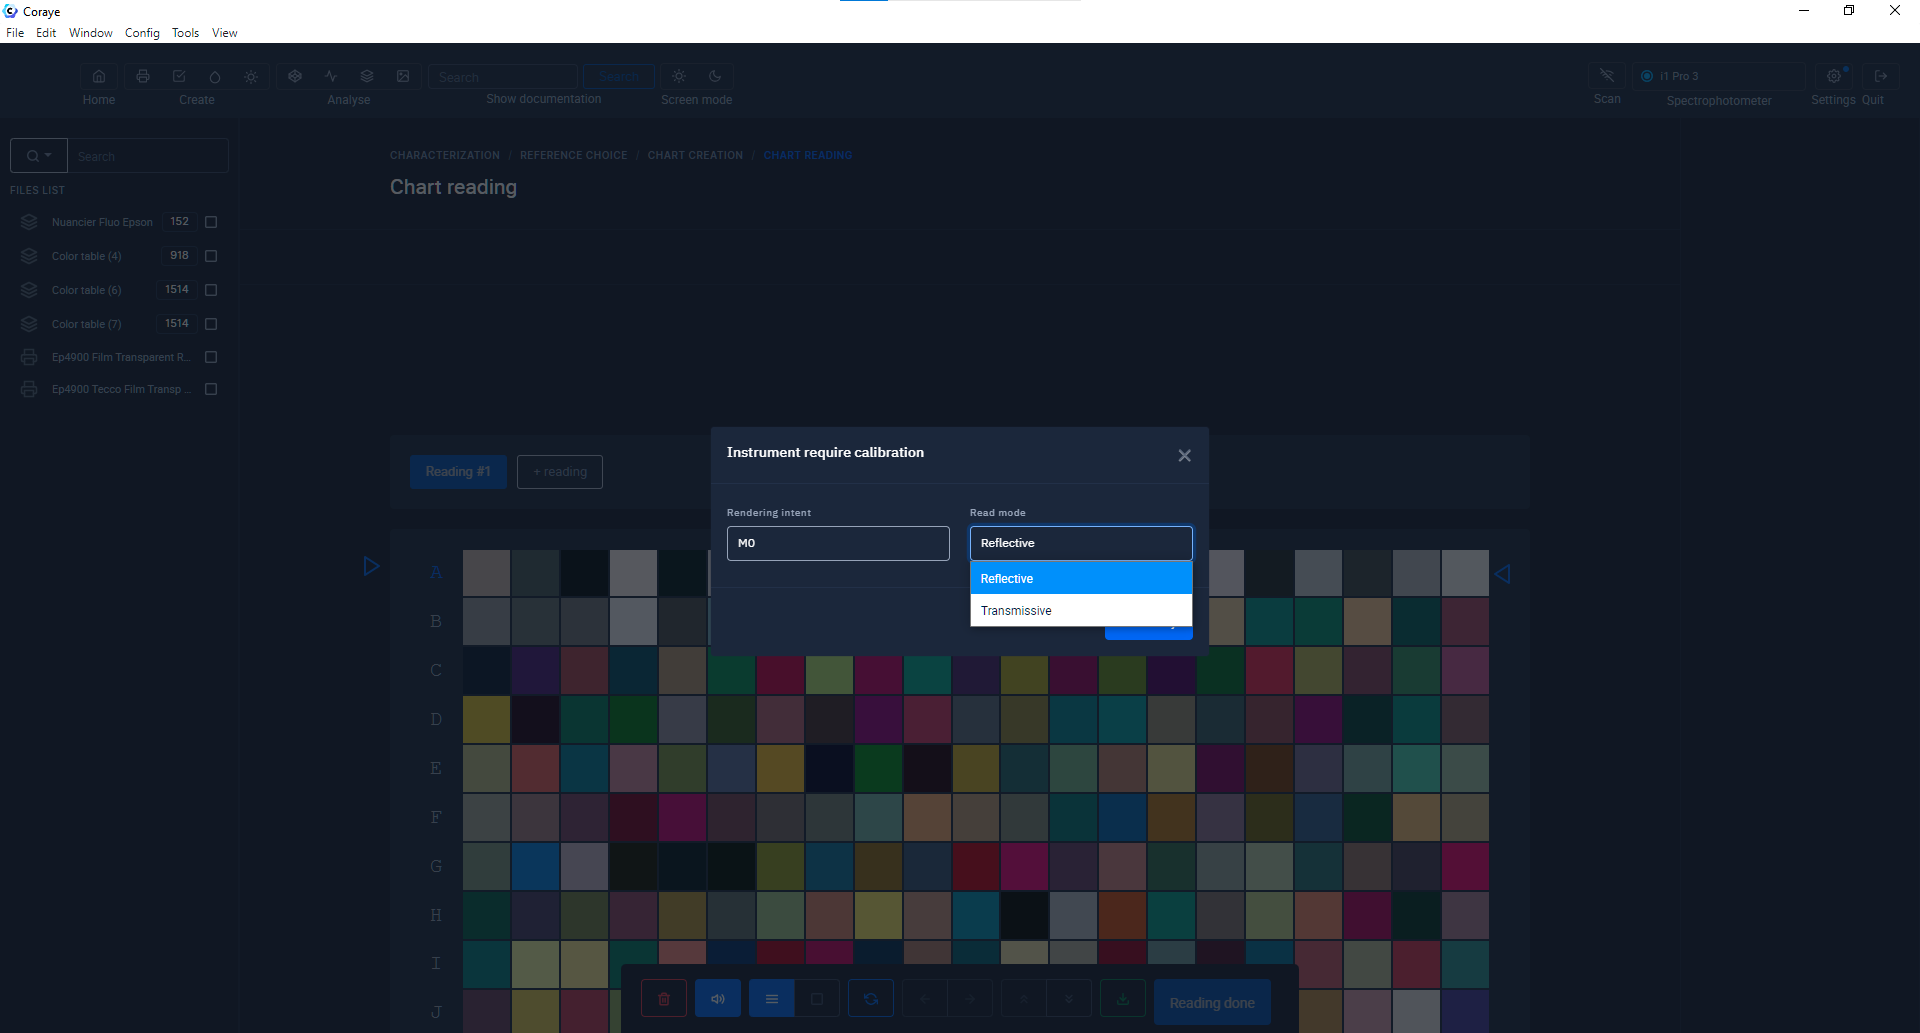
Select the measurement options, then click the " I'm ready " button.
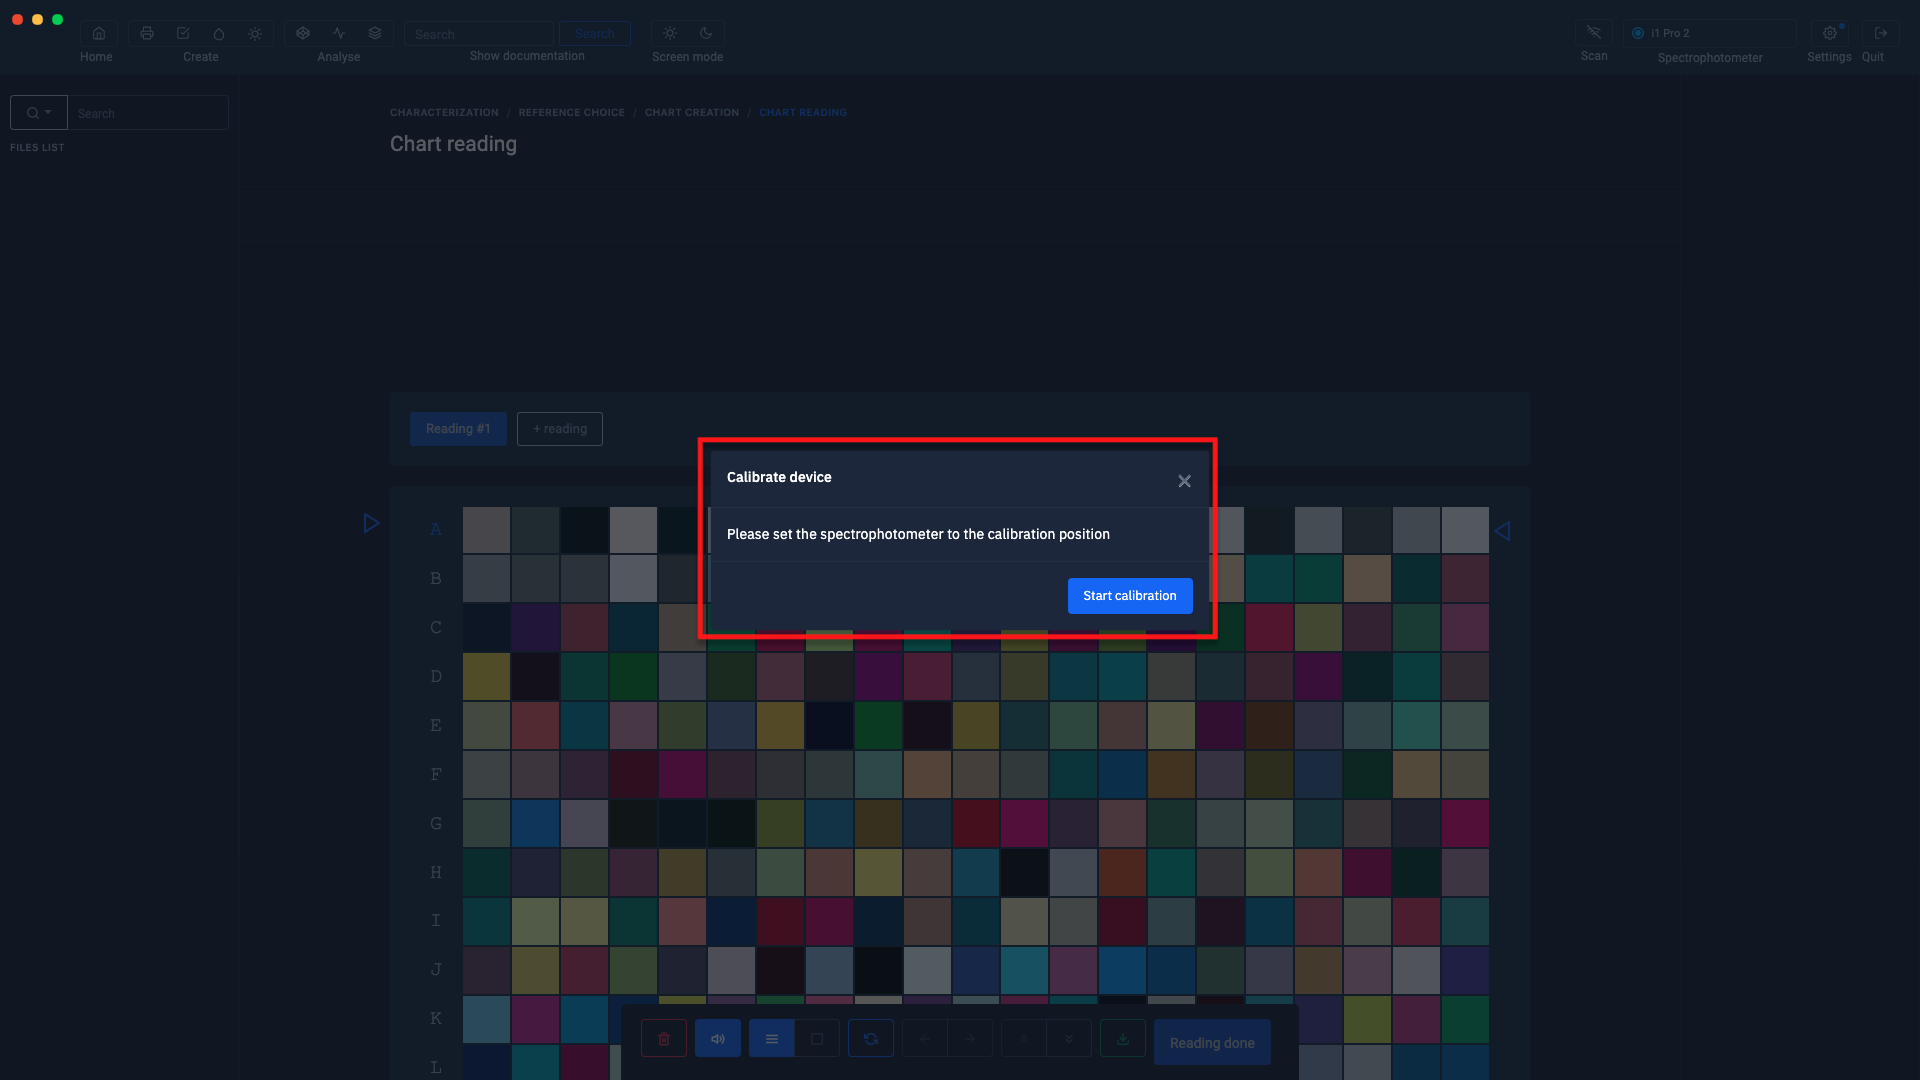
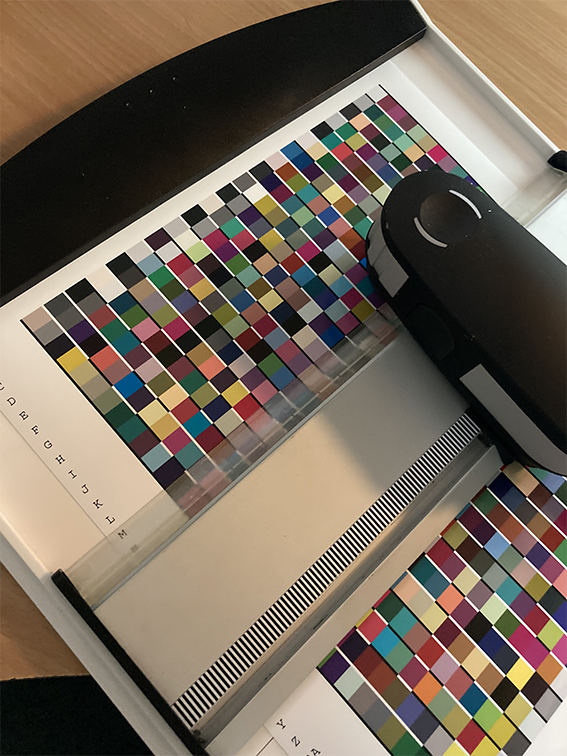
Position the spectrophotometer in its calibration position
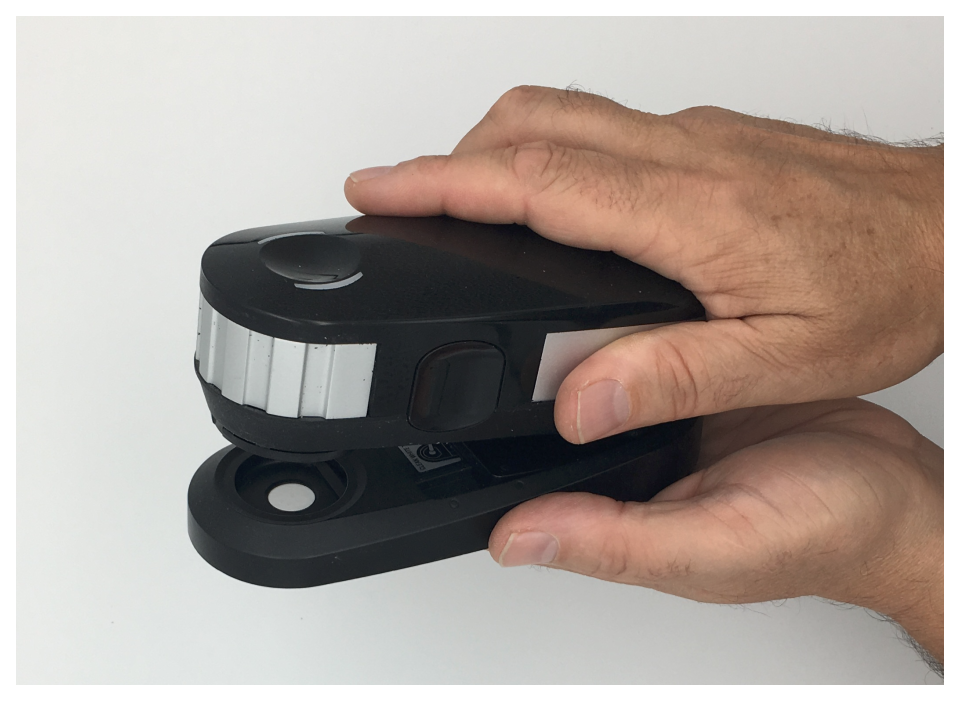
Then click on the " Start calibration " button.
Perform the range measurement
Tape playback begins from the blank of the paper on the right of the letter and ends on the blank on the opposite side.
The measurement starts with line "A", Measure the line corresponding to the line selected on your screen.
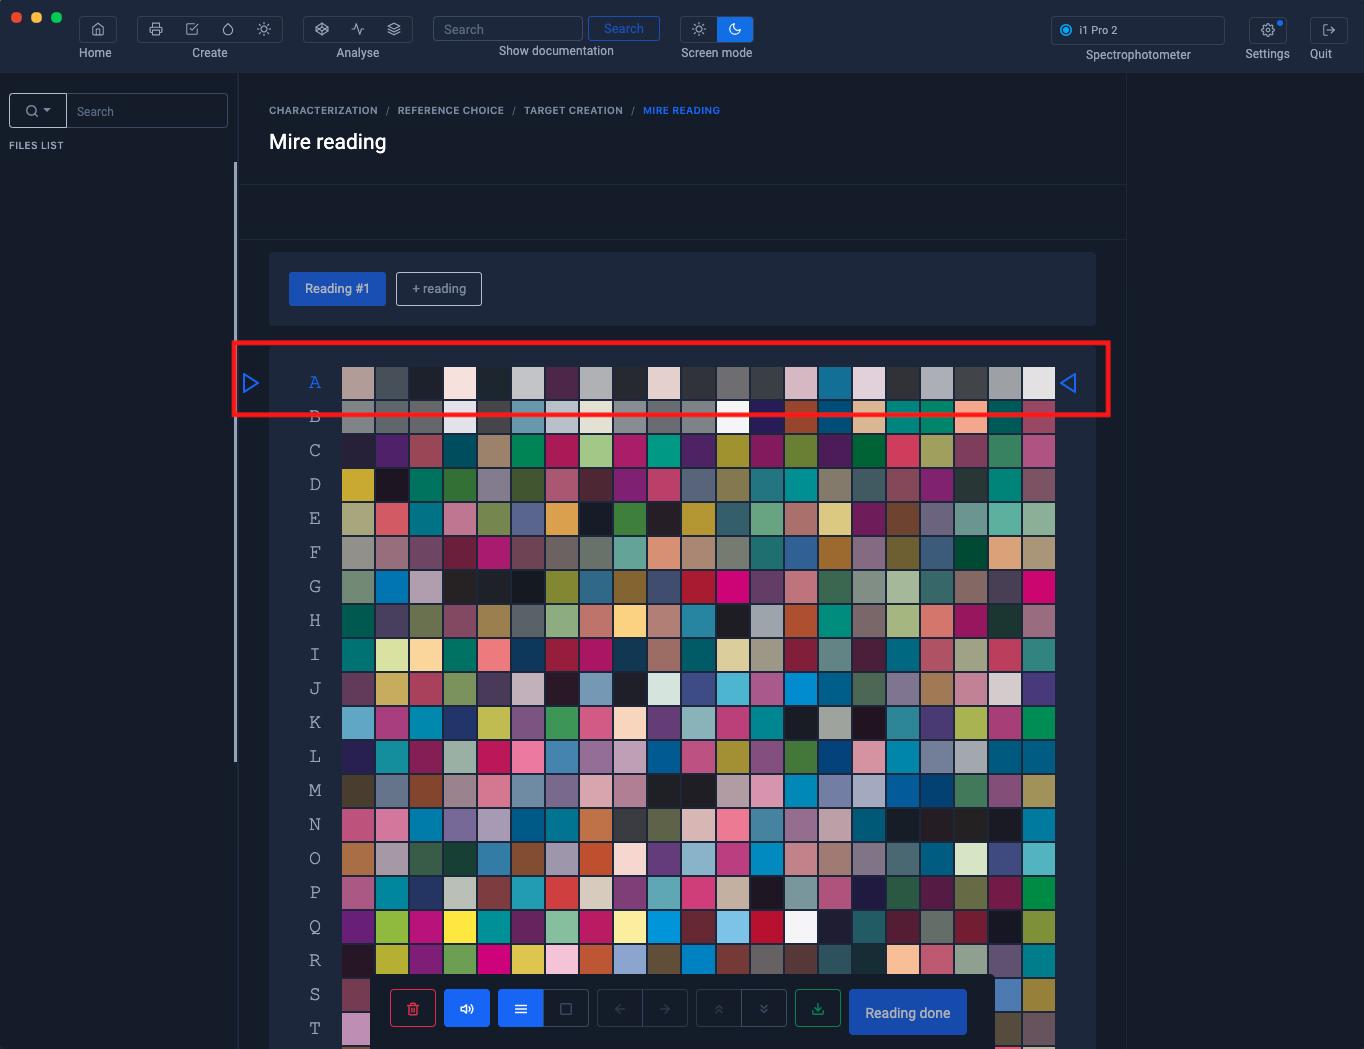
When you have read a line, Coraye will make you read the next unread line.
You can visually check whether there is any error when measuring the line, by comparing the top and bottom color of the measured patches.
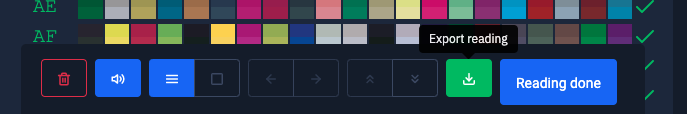
Saving the measurement
To save the measurement in the form of a .table file, click on the green " Export reading " button located at the bottom of the window.
This will be added to the files in the left column.
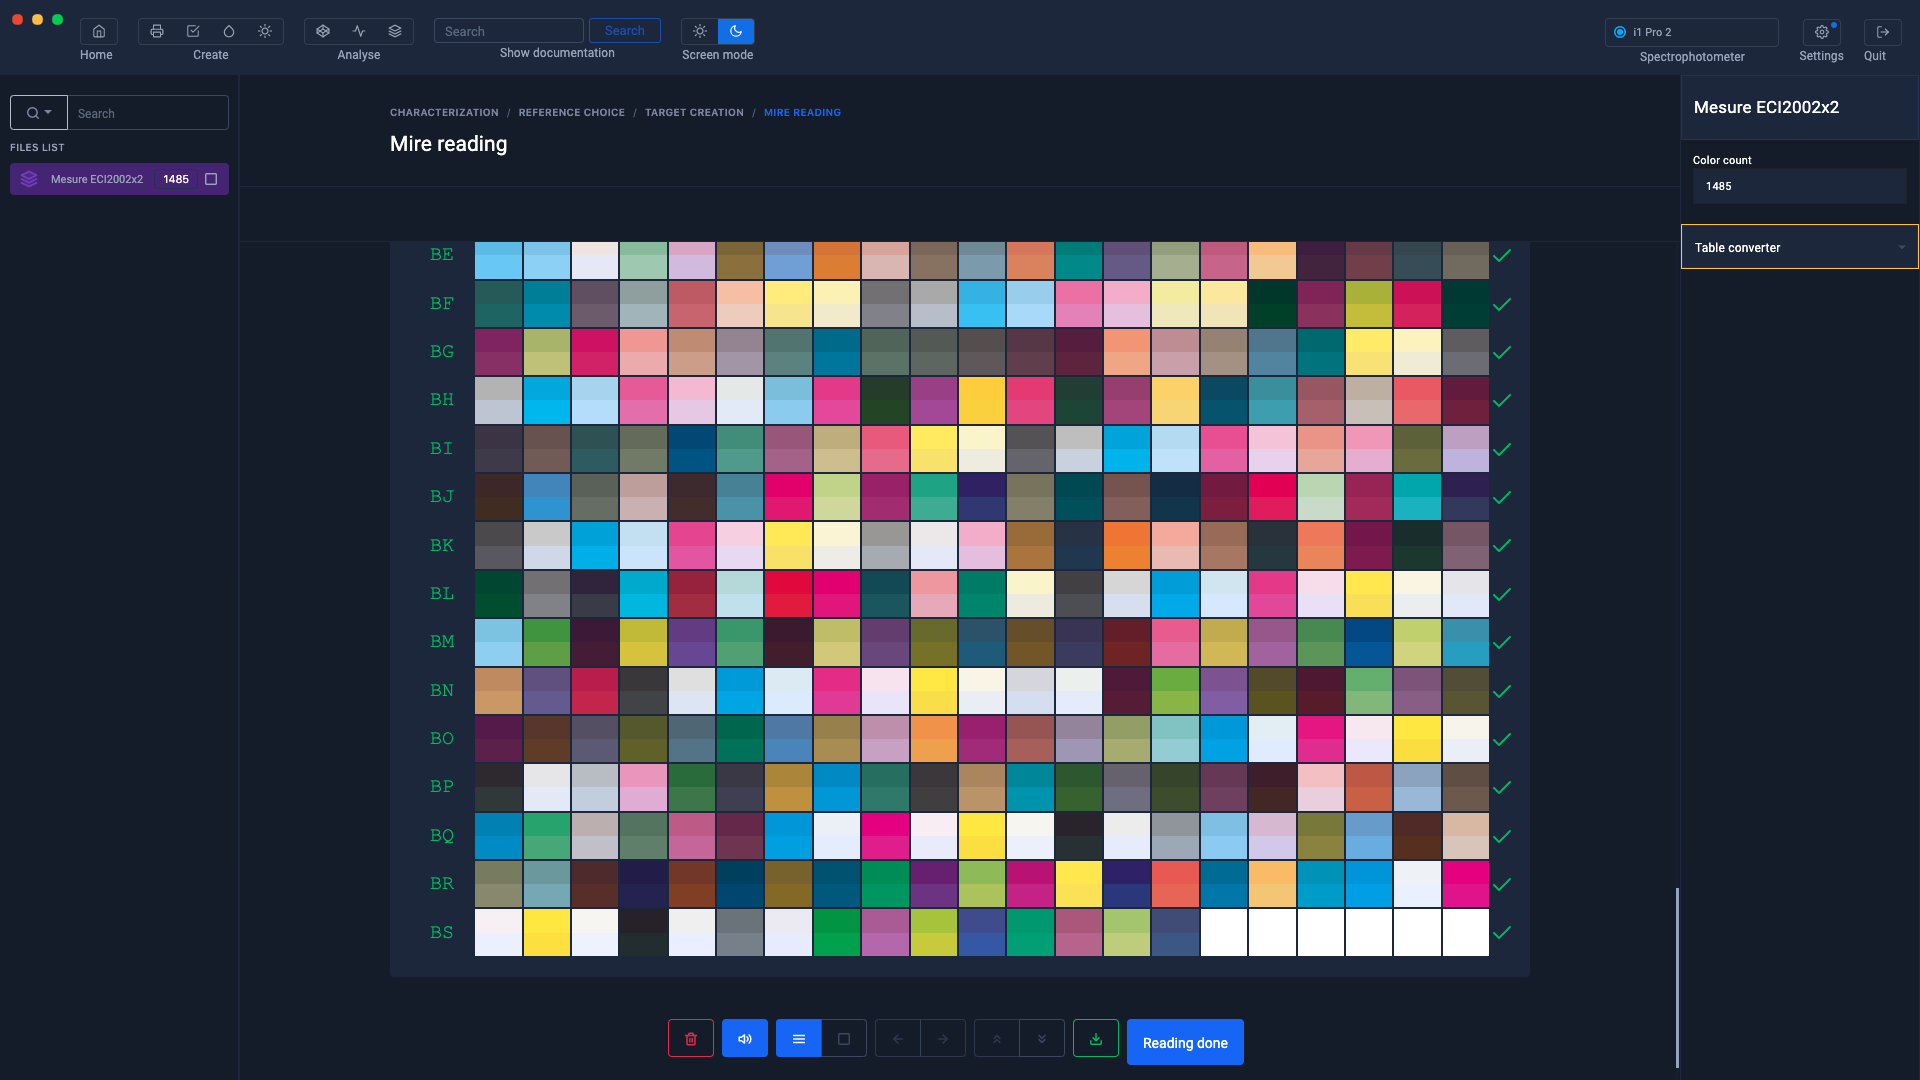
When the range measurement is complete, click on the " Reading complete " button
Parameters for creating the icc profile
Before calculating the profile, you can choose some options:
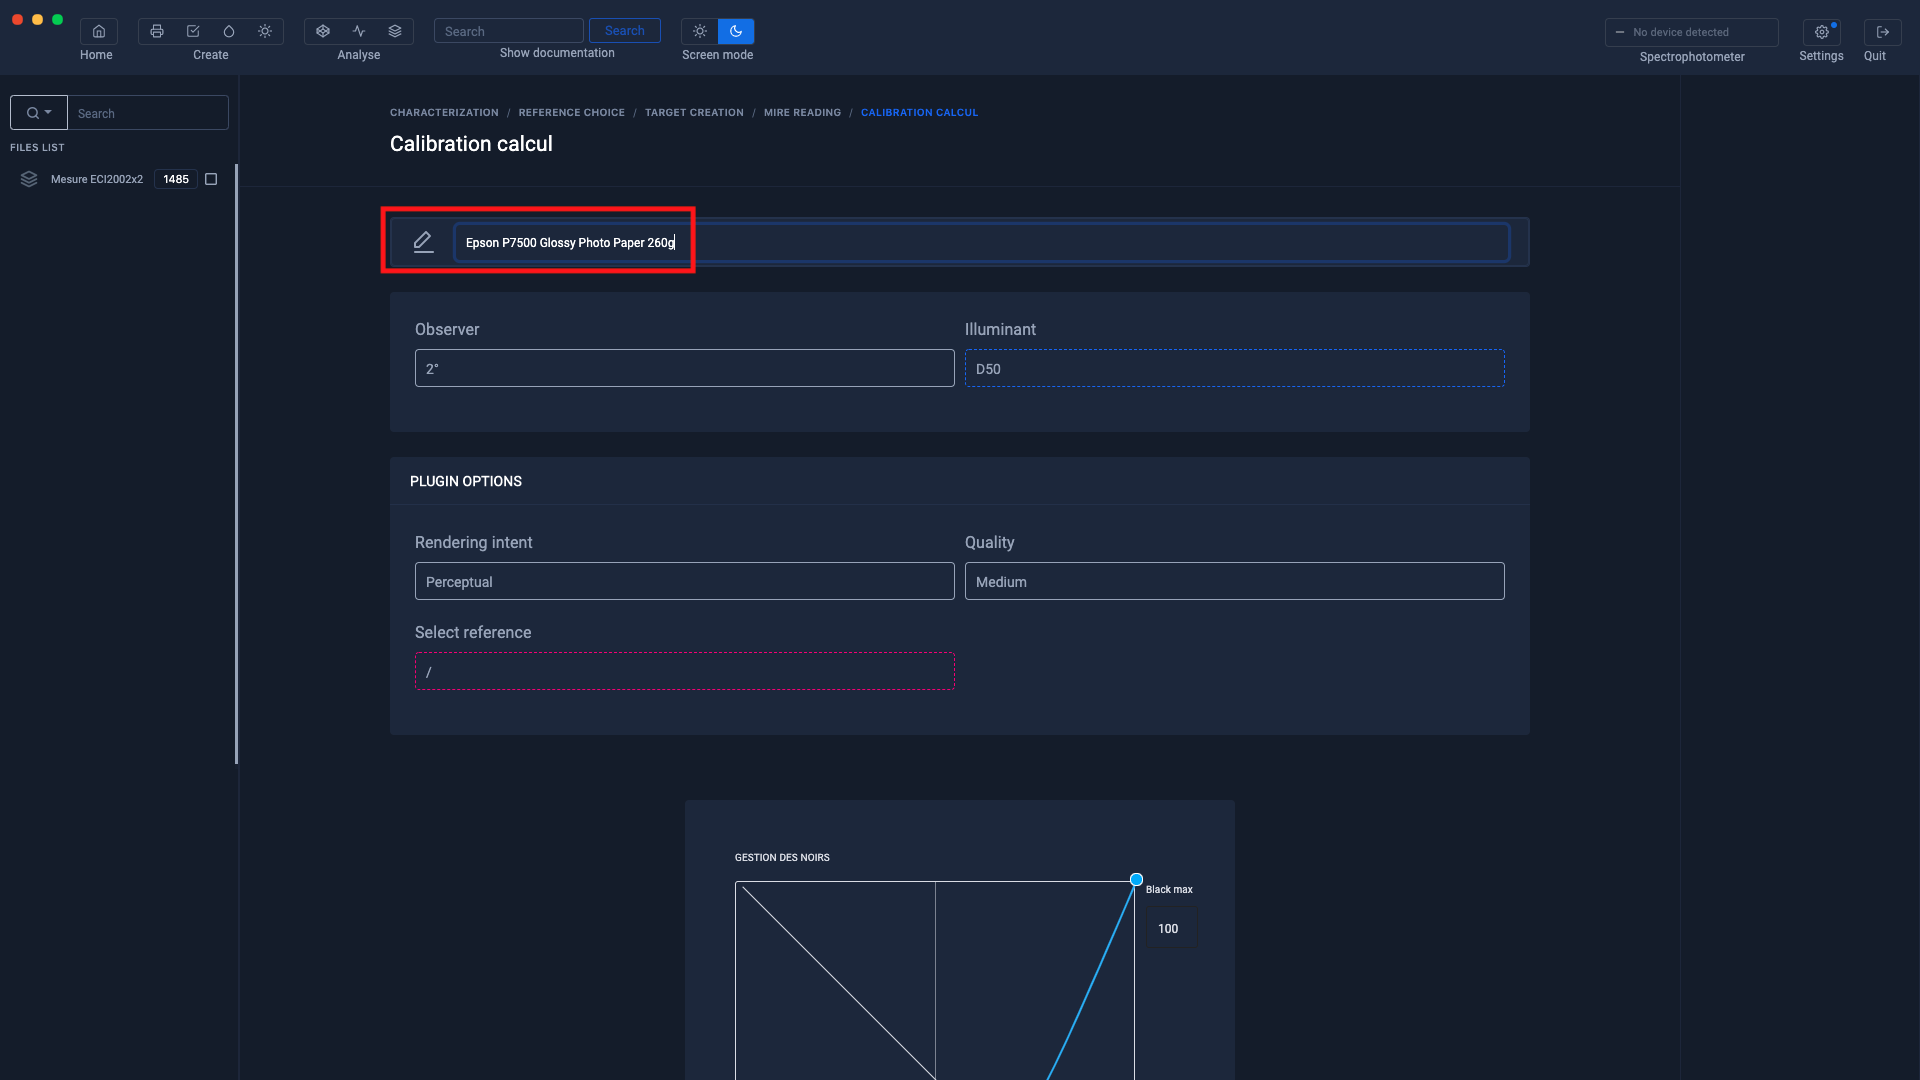
Reference illuminant

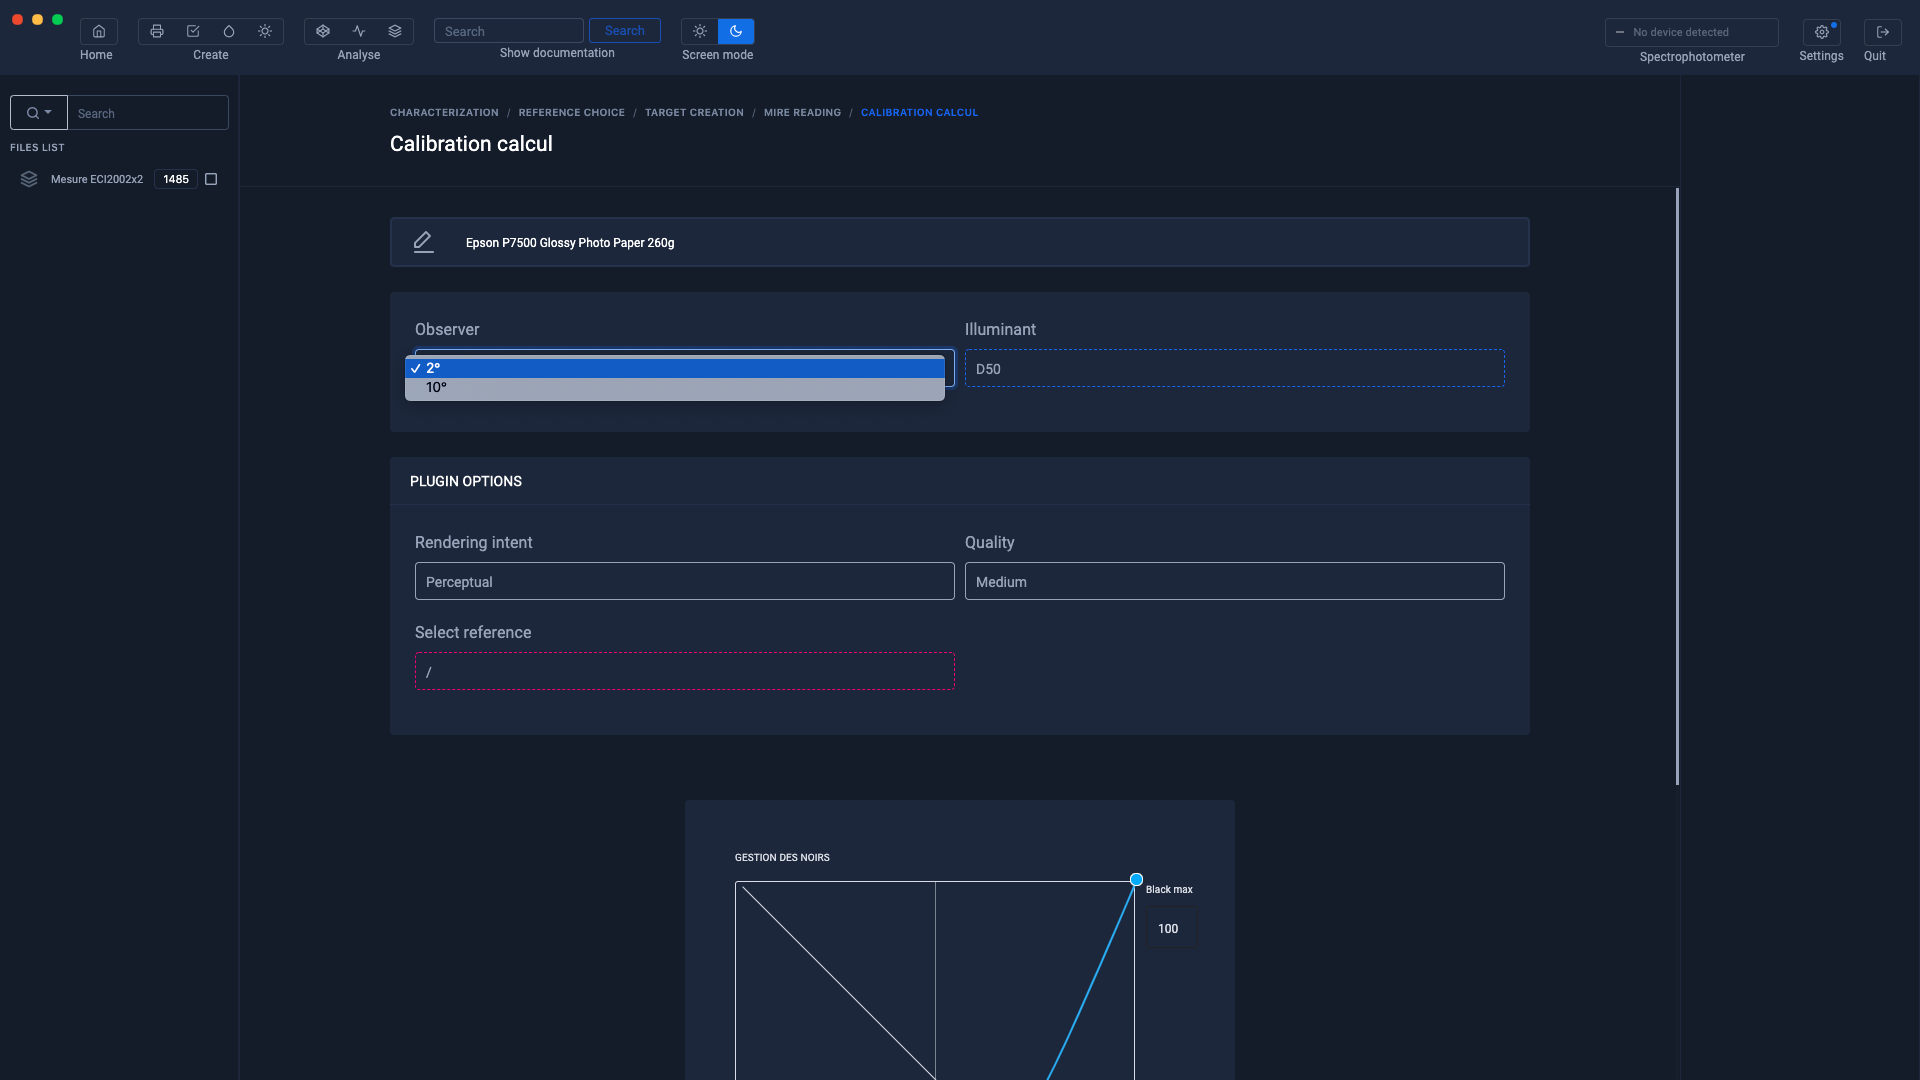
Observe
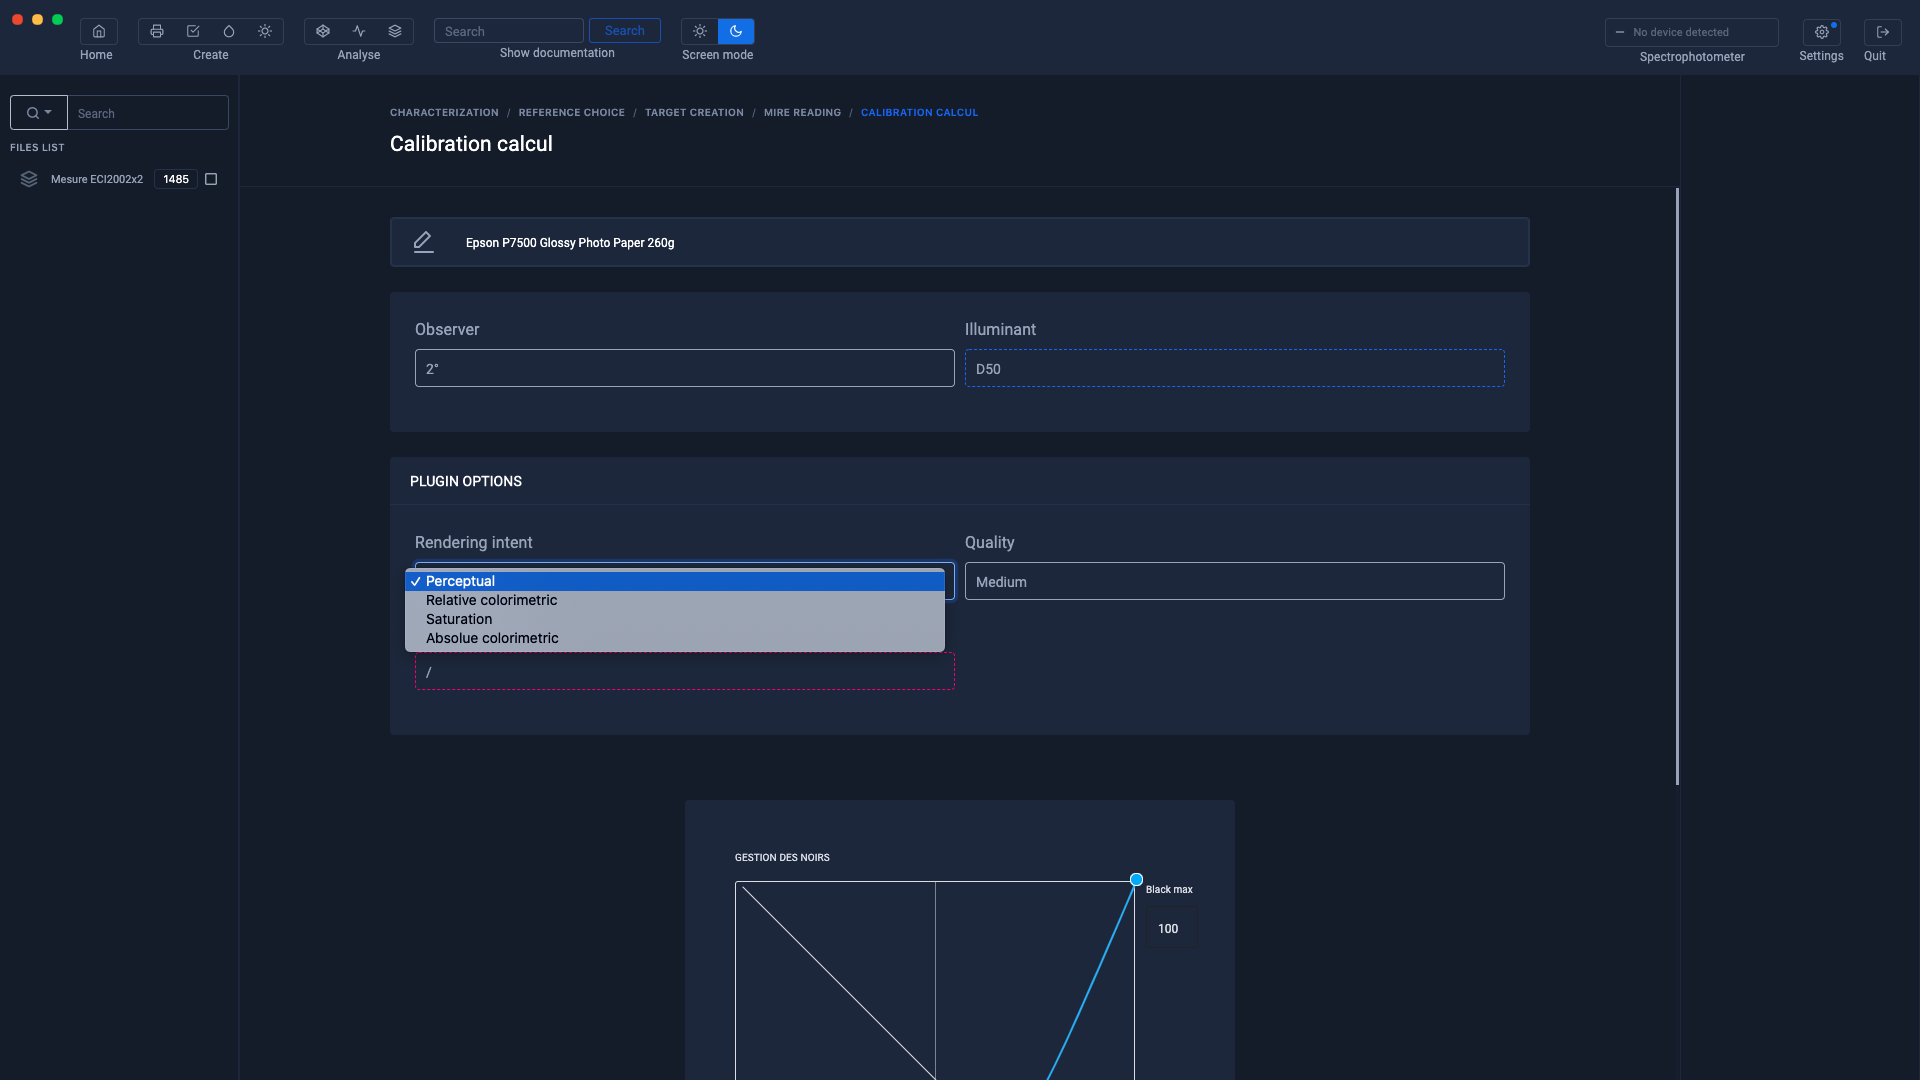
Default calculation mode
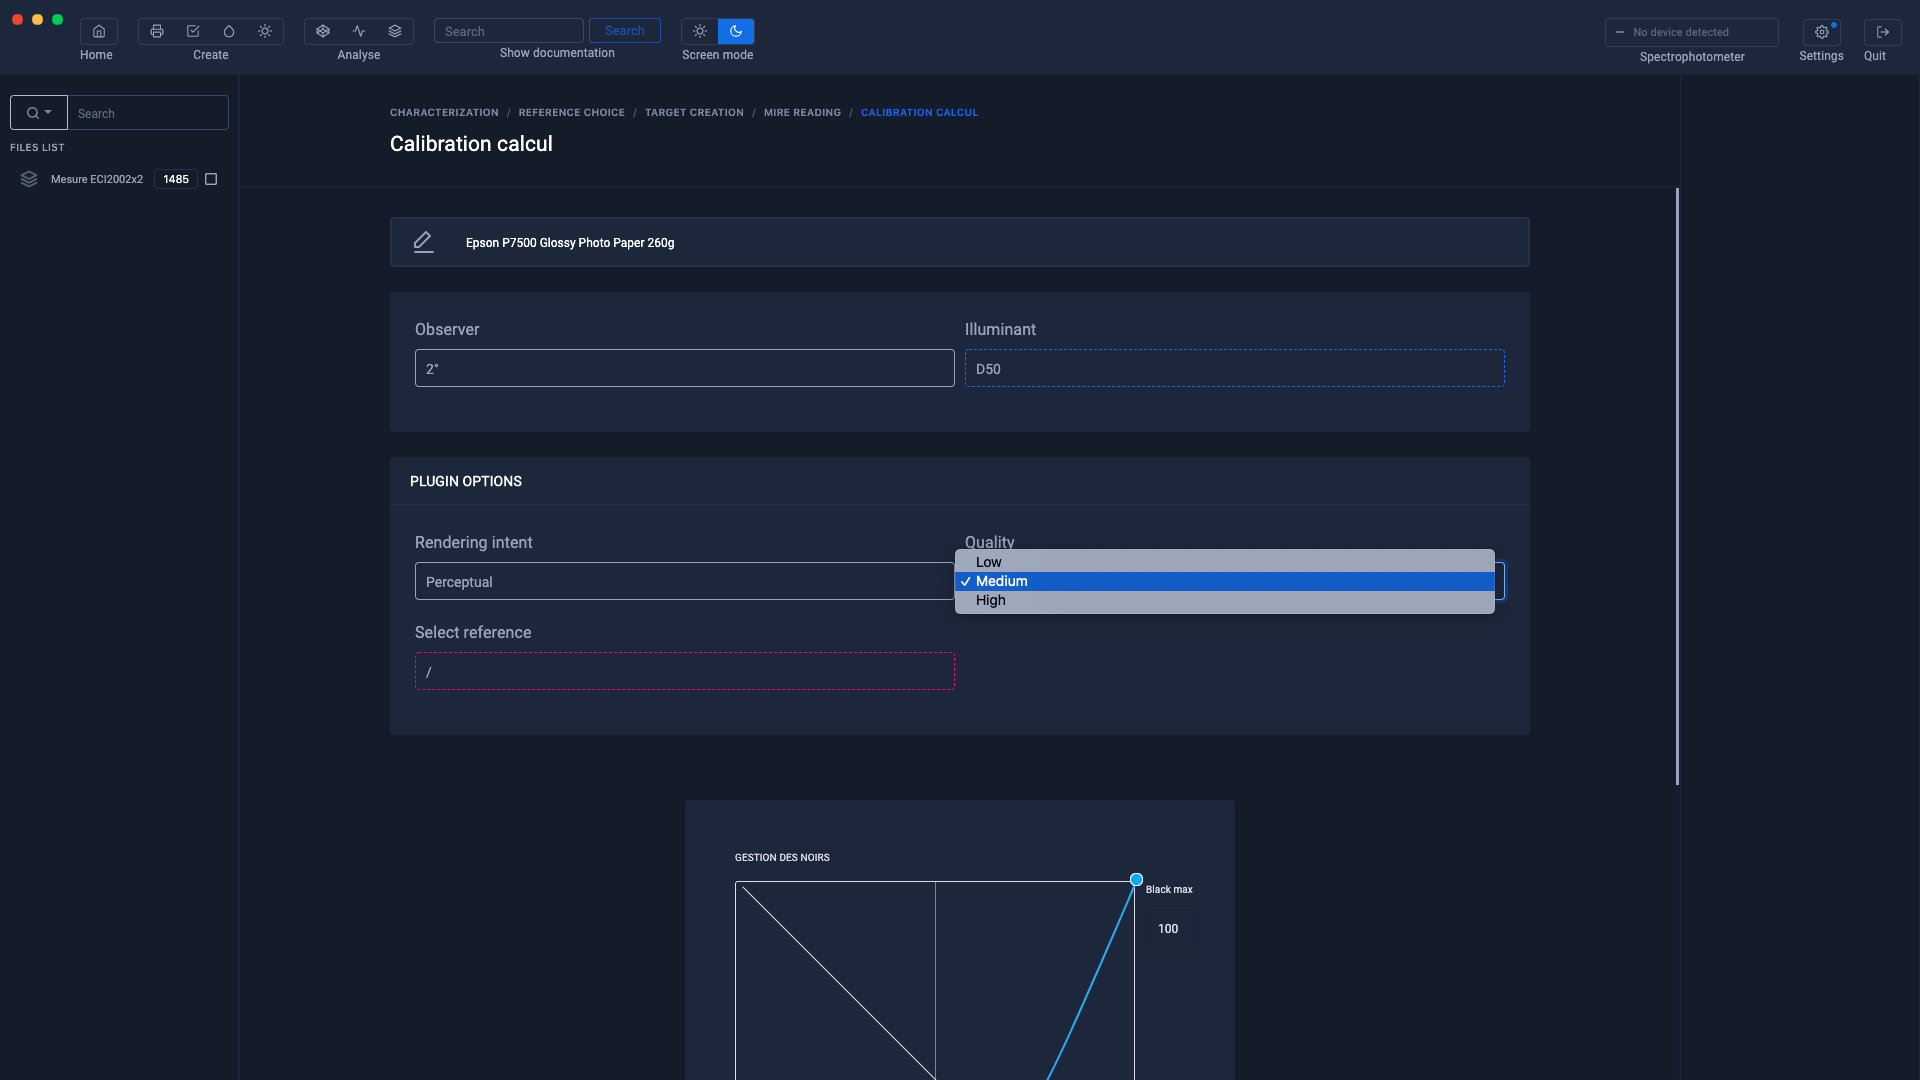
Profile quality We advise you to stay on the " Medium " quality
Reference profile
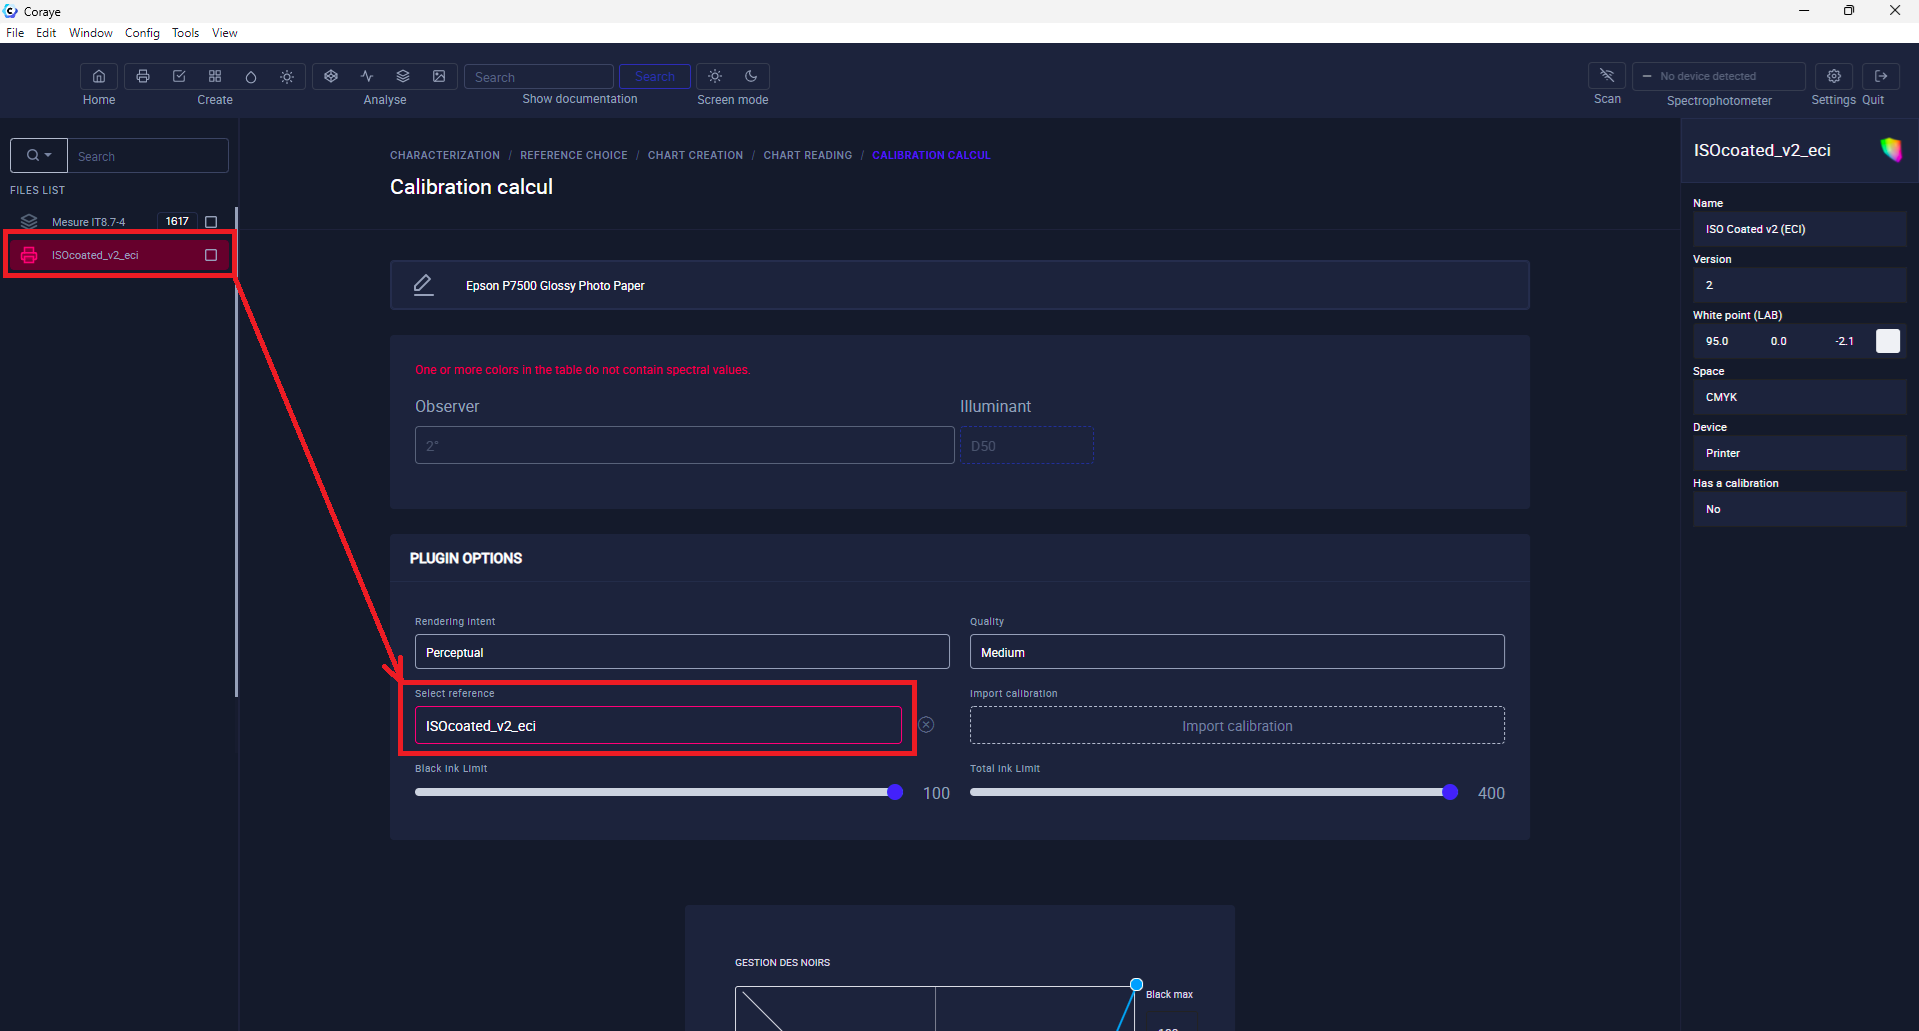
The management of the black ink for the calculation of the CMYK profiles, is done, quite simply, by moving the points of the graph.
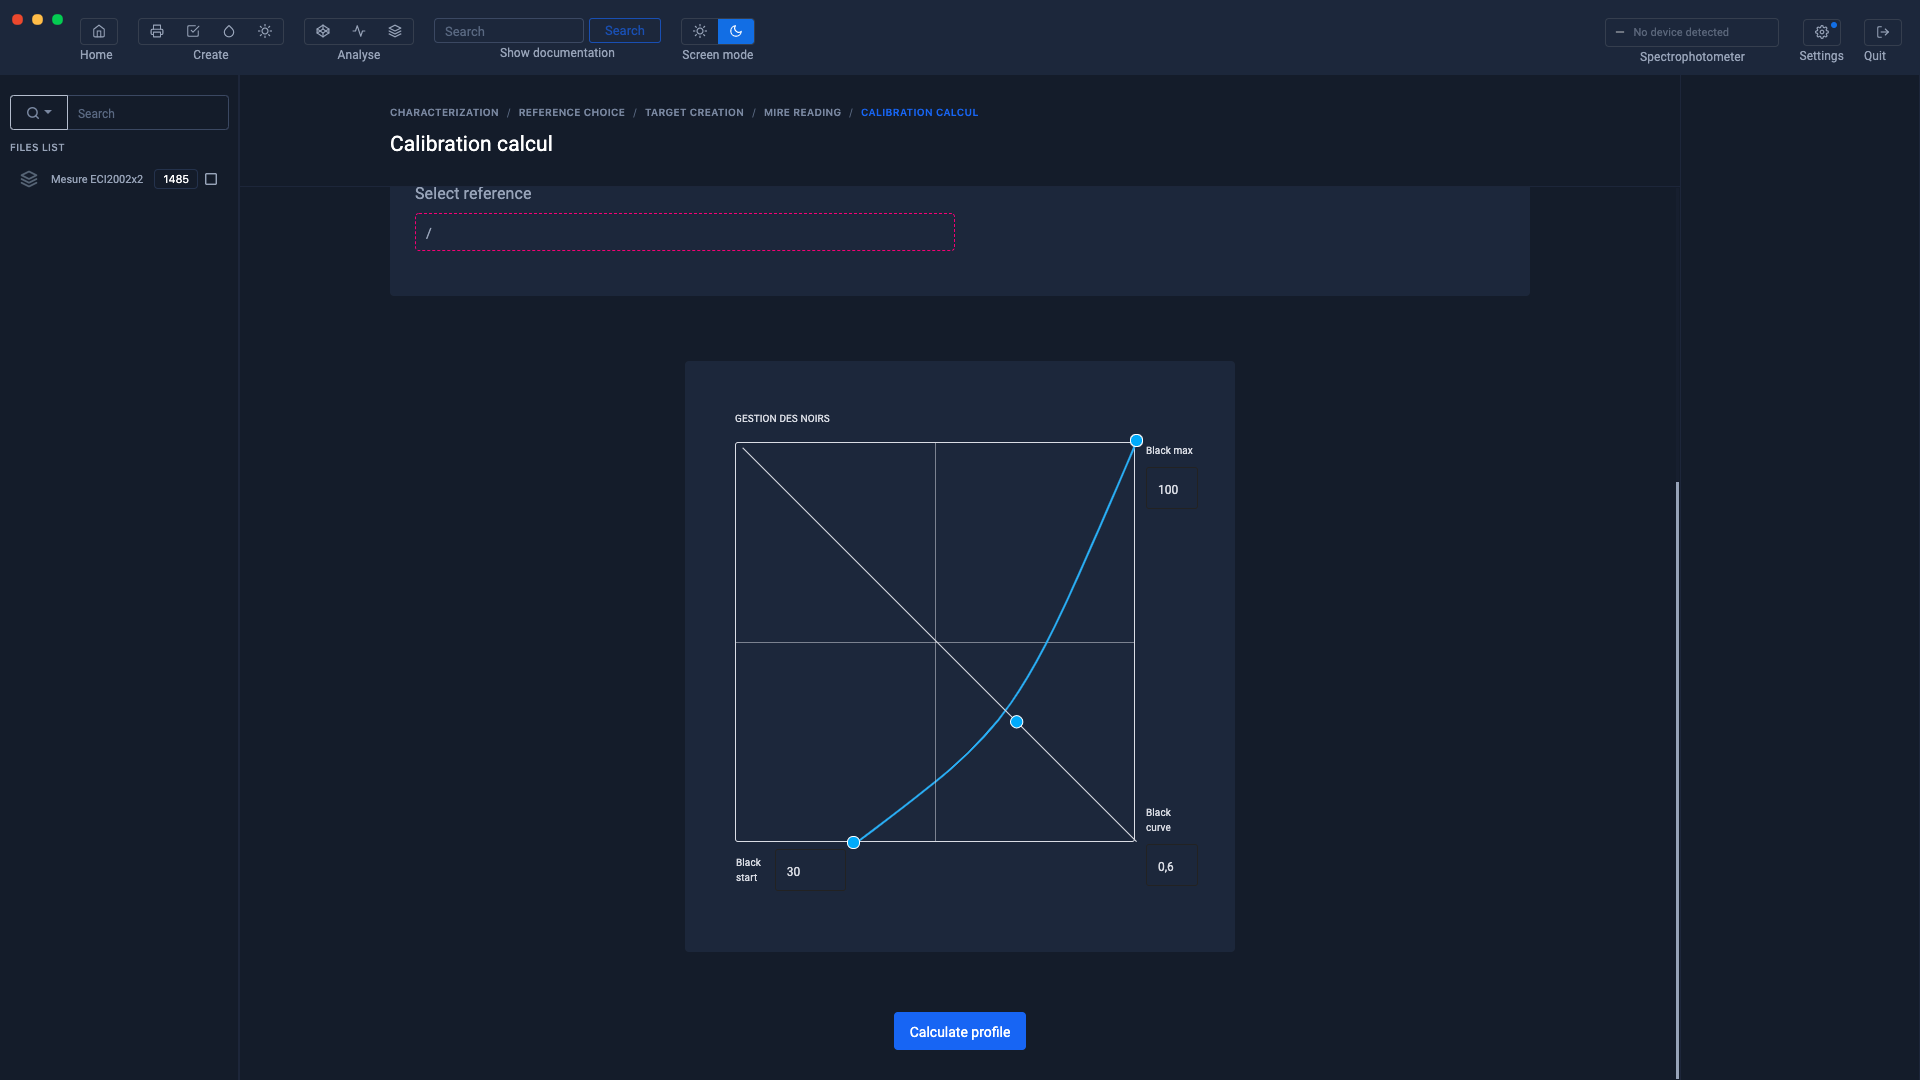
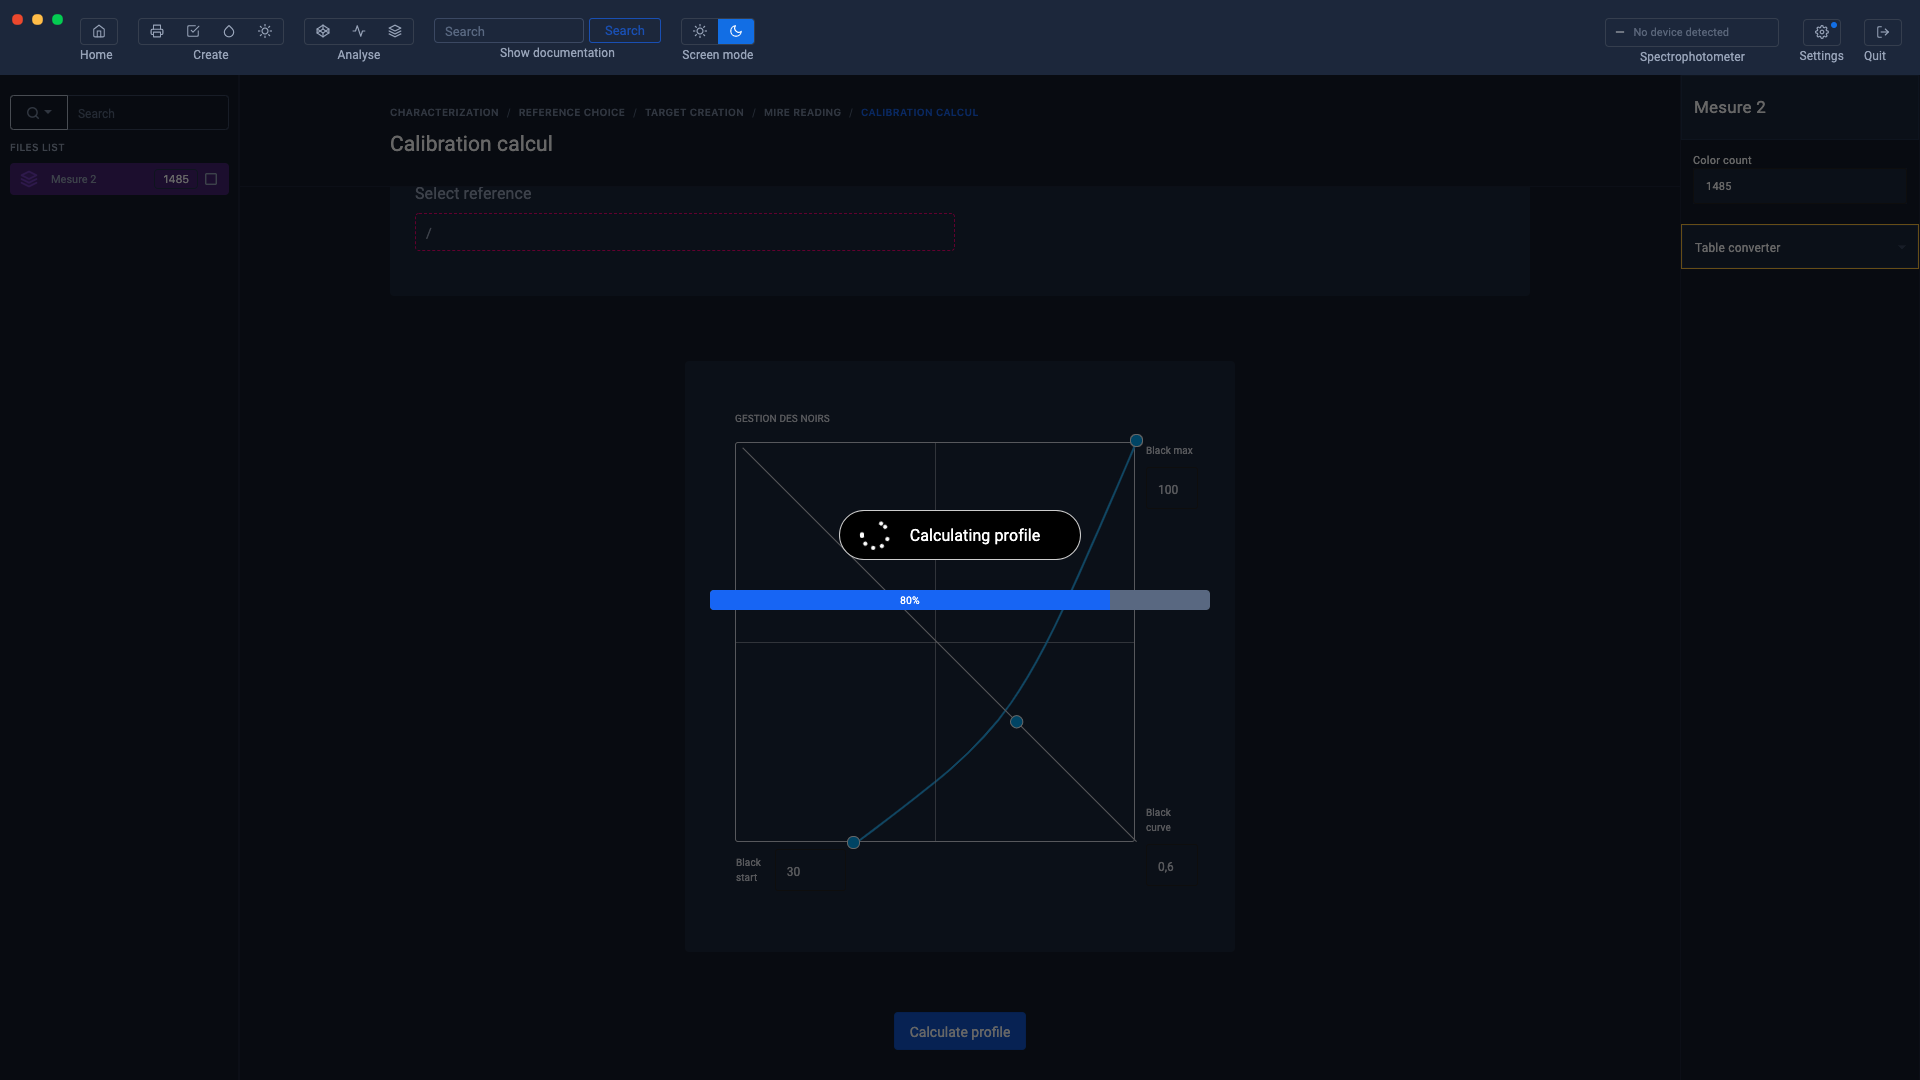
When the parameters are defined, click on the " Calculate profile " button
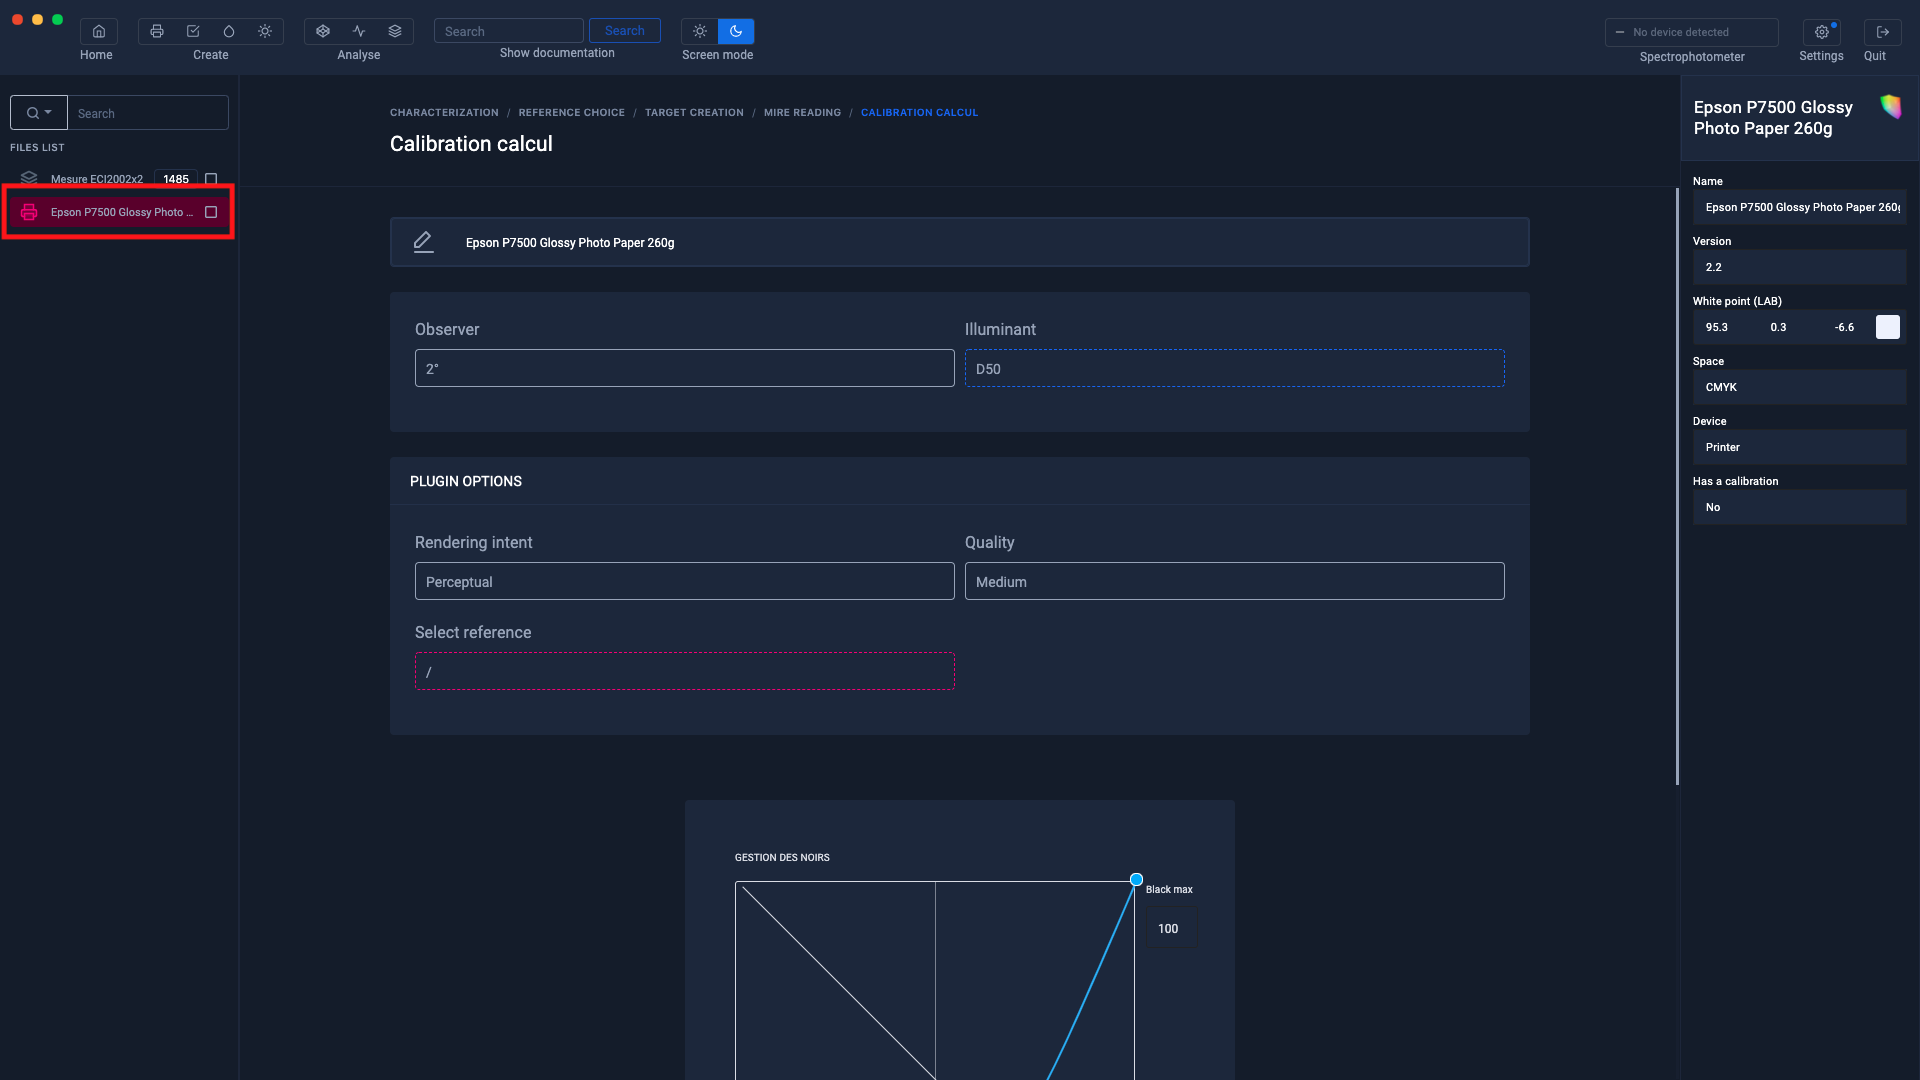
The profile is calculated
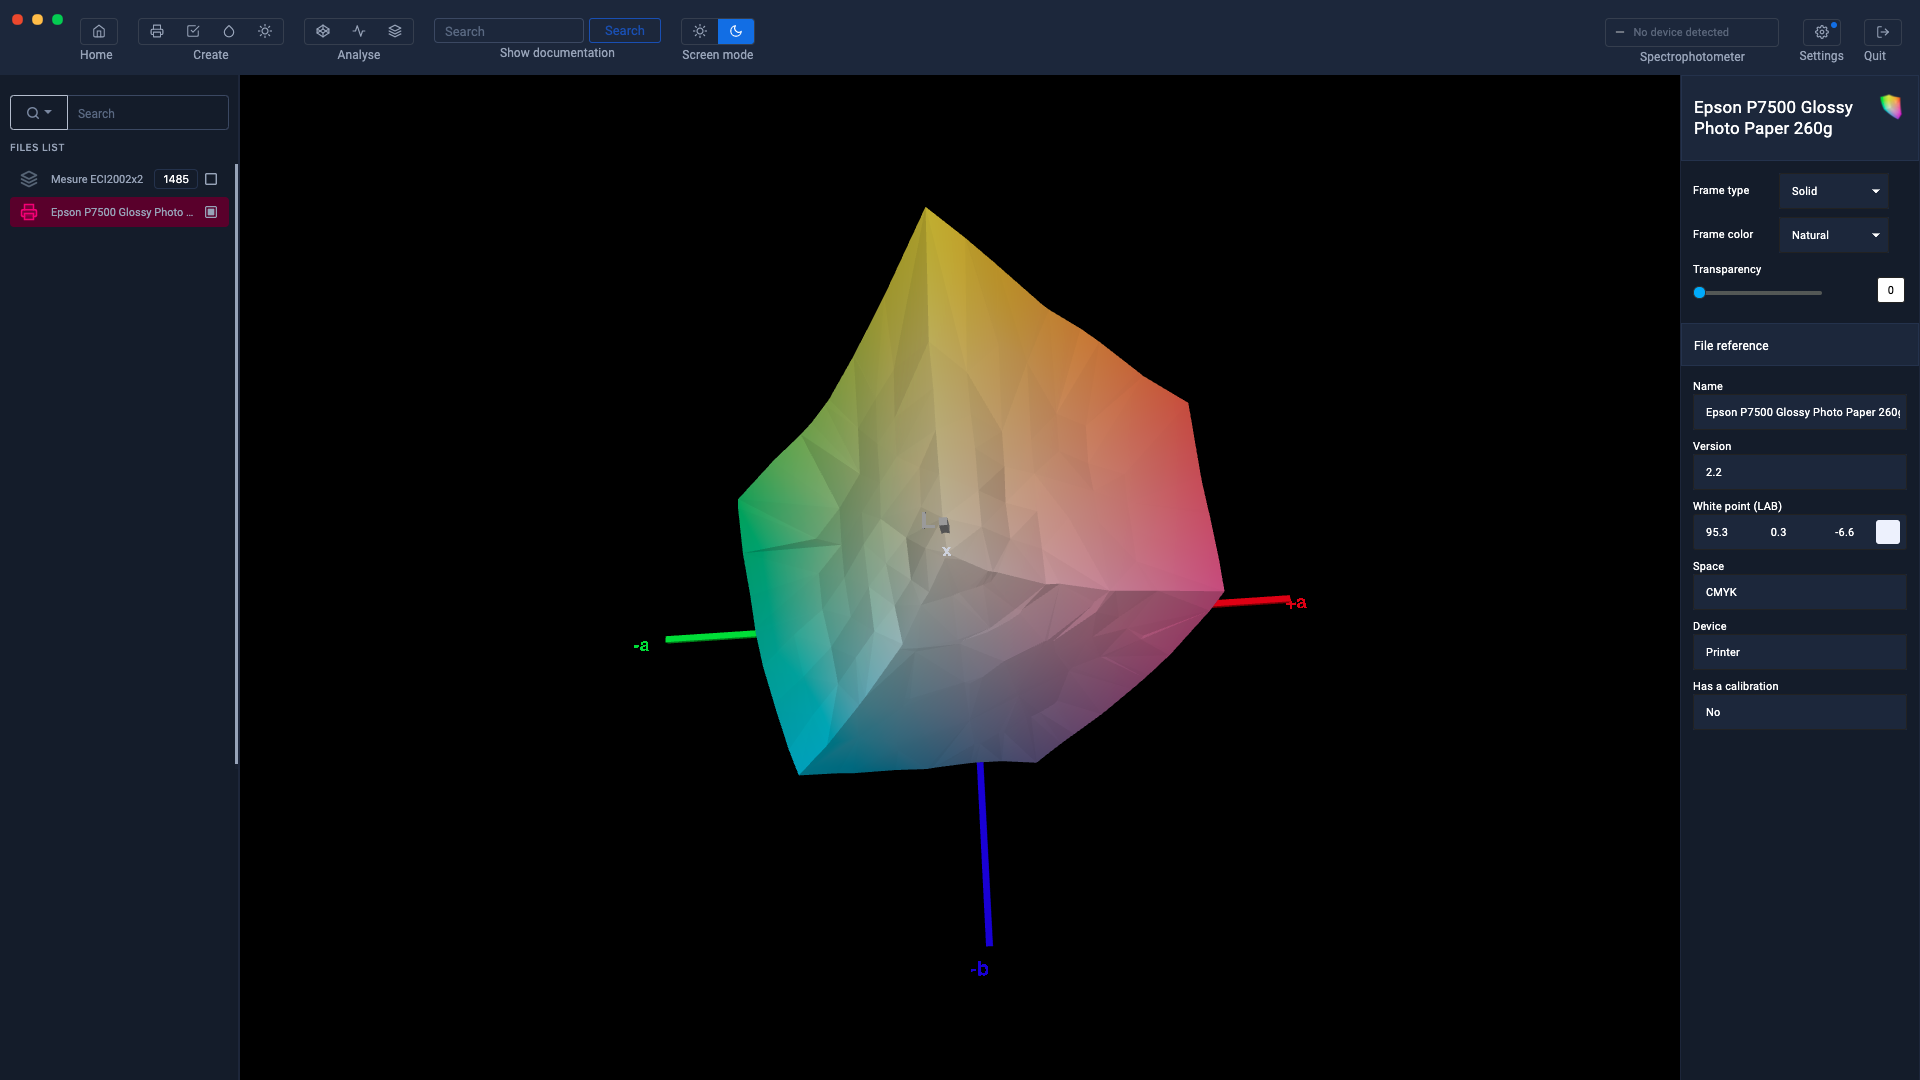
Once the profile has been calculated, it appears in the left column.
In order to check the consistency of the profile, it is recommended to display it in the Gamut Viewer
You can also print a test image to assess your impression. You can download a test image here:
Don't forget to save your profile
