Compare and edit chart measures
Before taking the average of several chart measurements, intended for the creation of an icc characterization profile, it is advisable to check the measurements and correct them if necessary.
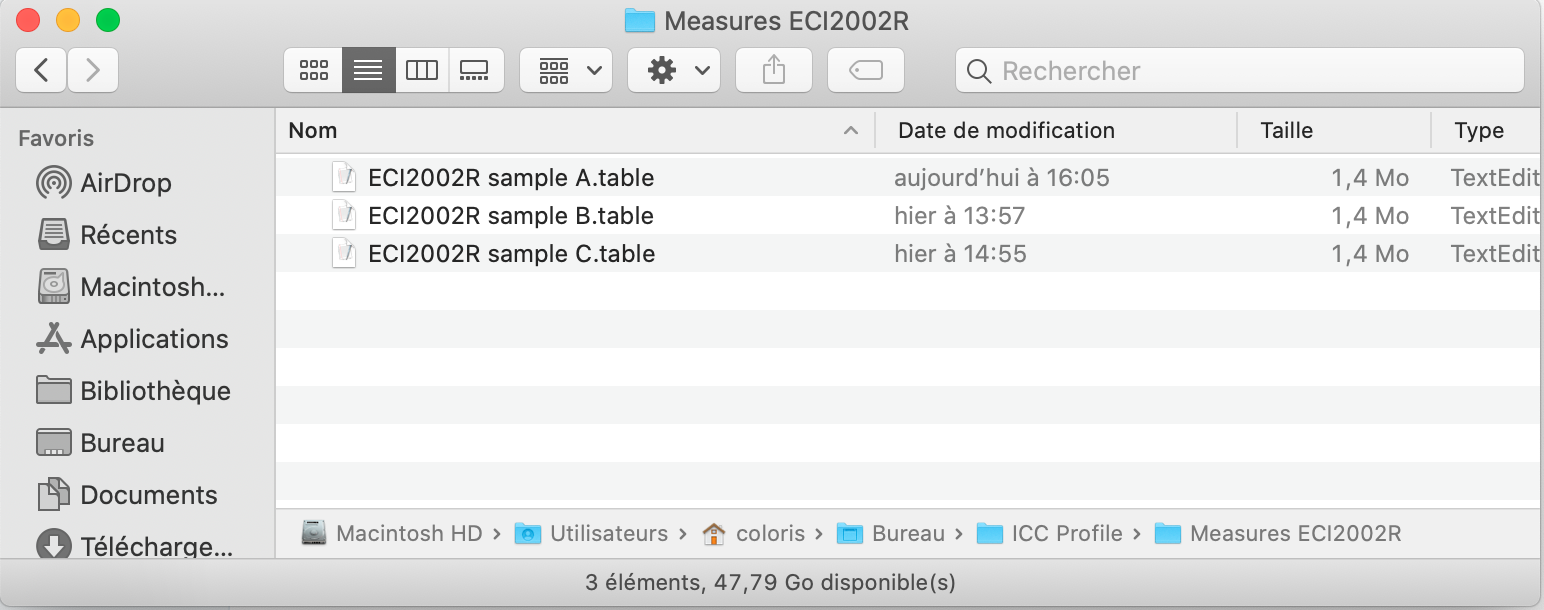
In this tutorial, we will measure 3 identical ECI2002R charts. The goal is to check if there is not too much difference between these charts and to check if measurement errors have not crept in during the reading.
Import of measurements made in the " Create profile " module
To find out more, see the chapter: Create an icc profile from an average of measured charts
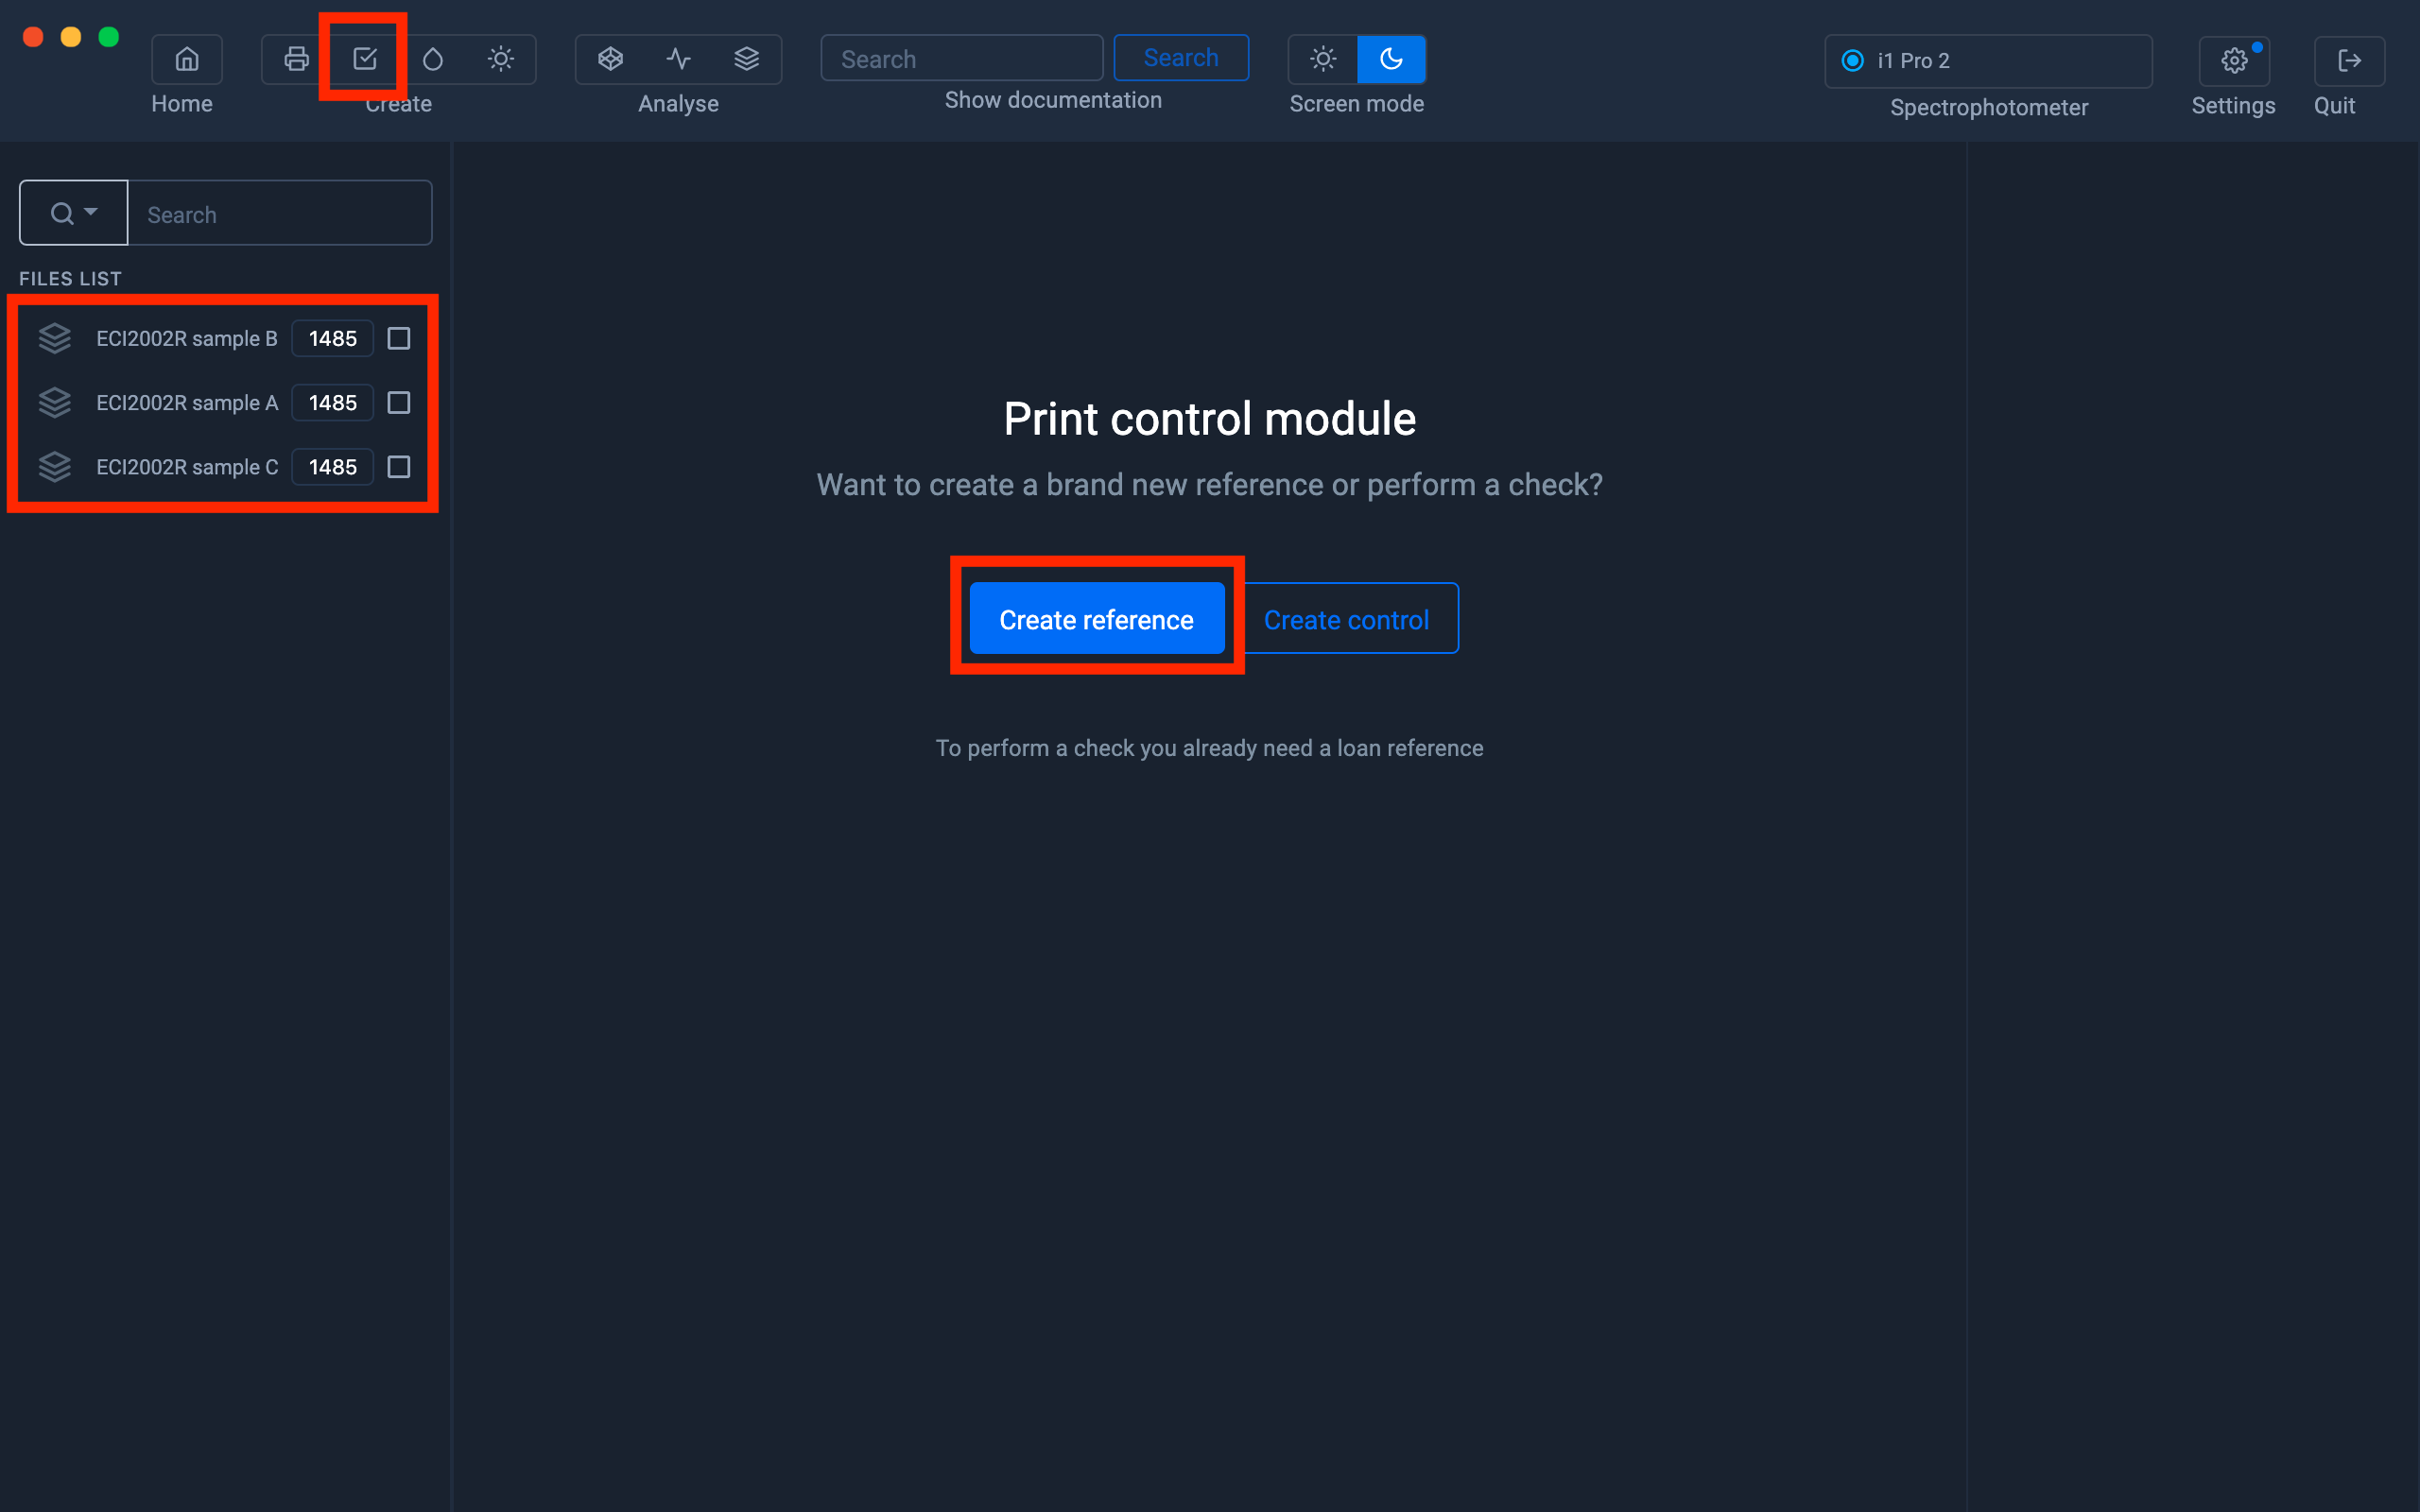
The imported measurements will appear in the left column
Creation of a reference file
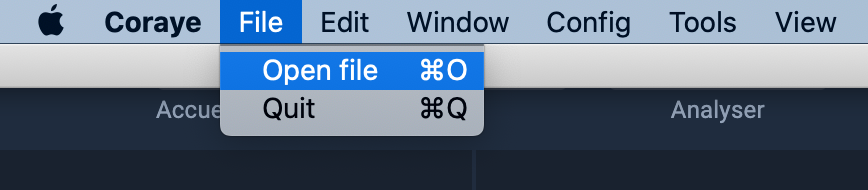
Click on the " Create a reference " button
The ECI2002R test charts being in CMJN mode, we will click on the "CMJN" button

We will choose the "ECI2002R sample A" measurement as a reference to compare it with the other two.
Drag the "ECI2002R sample A" measurement into the " Drag the color table here " area
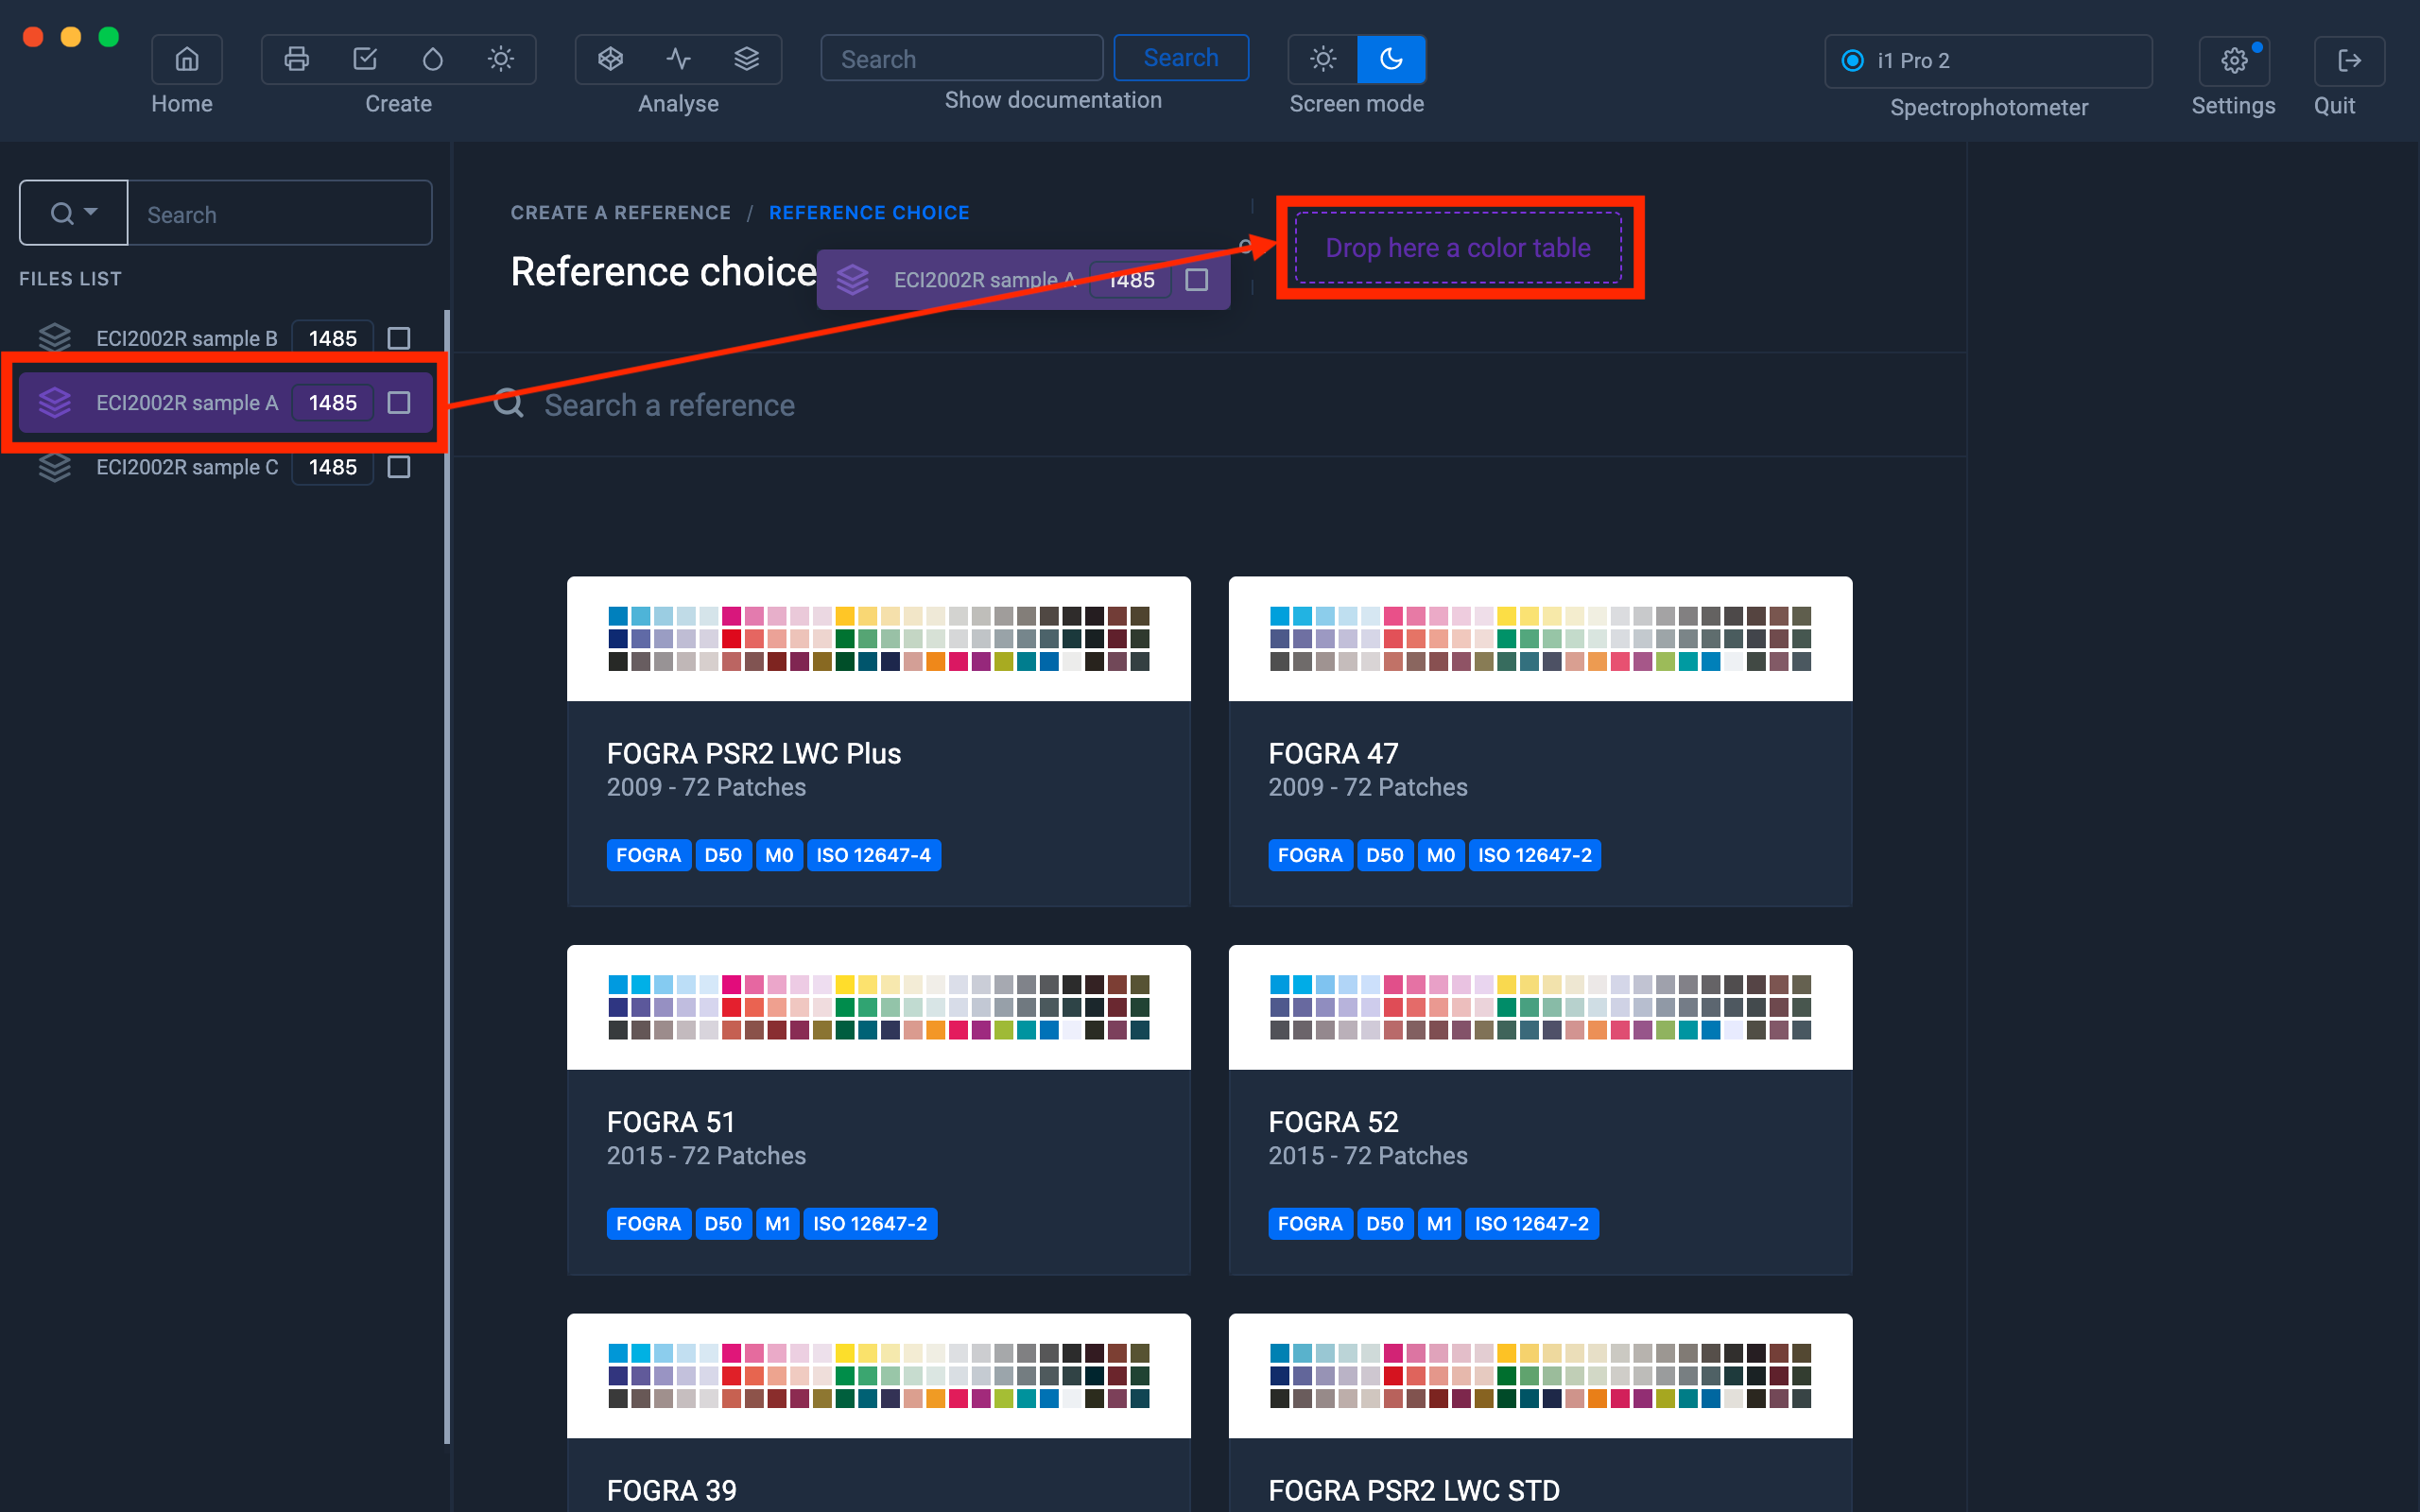
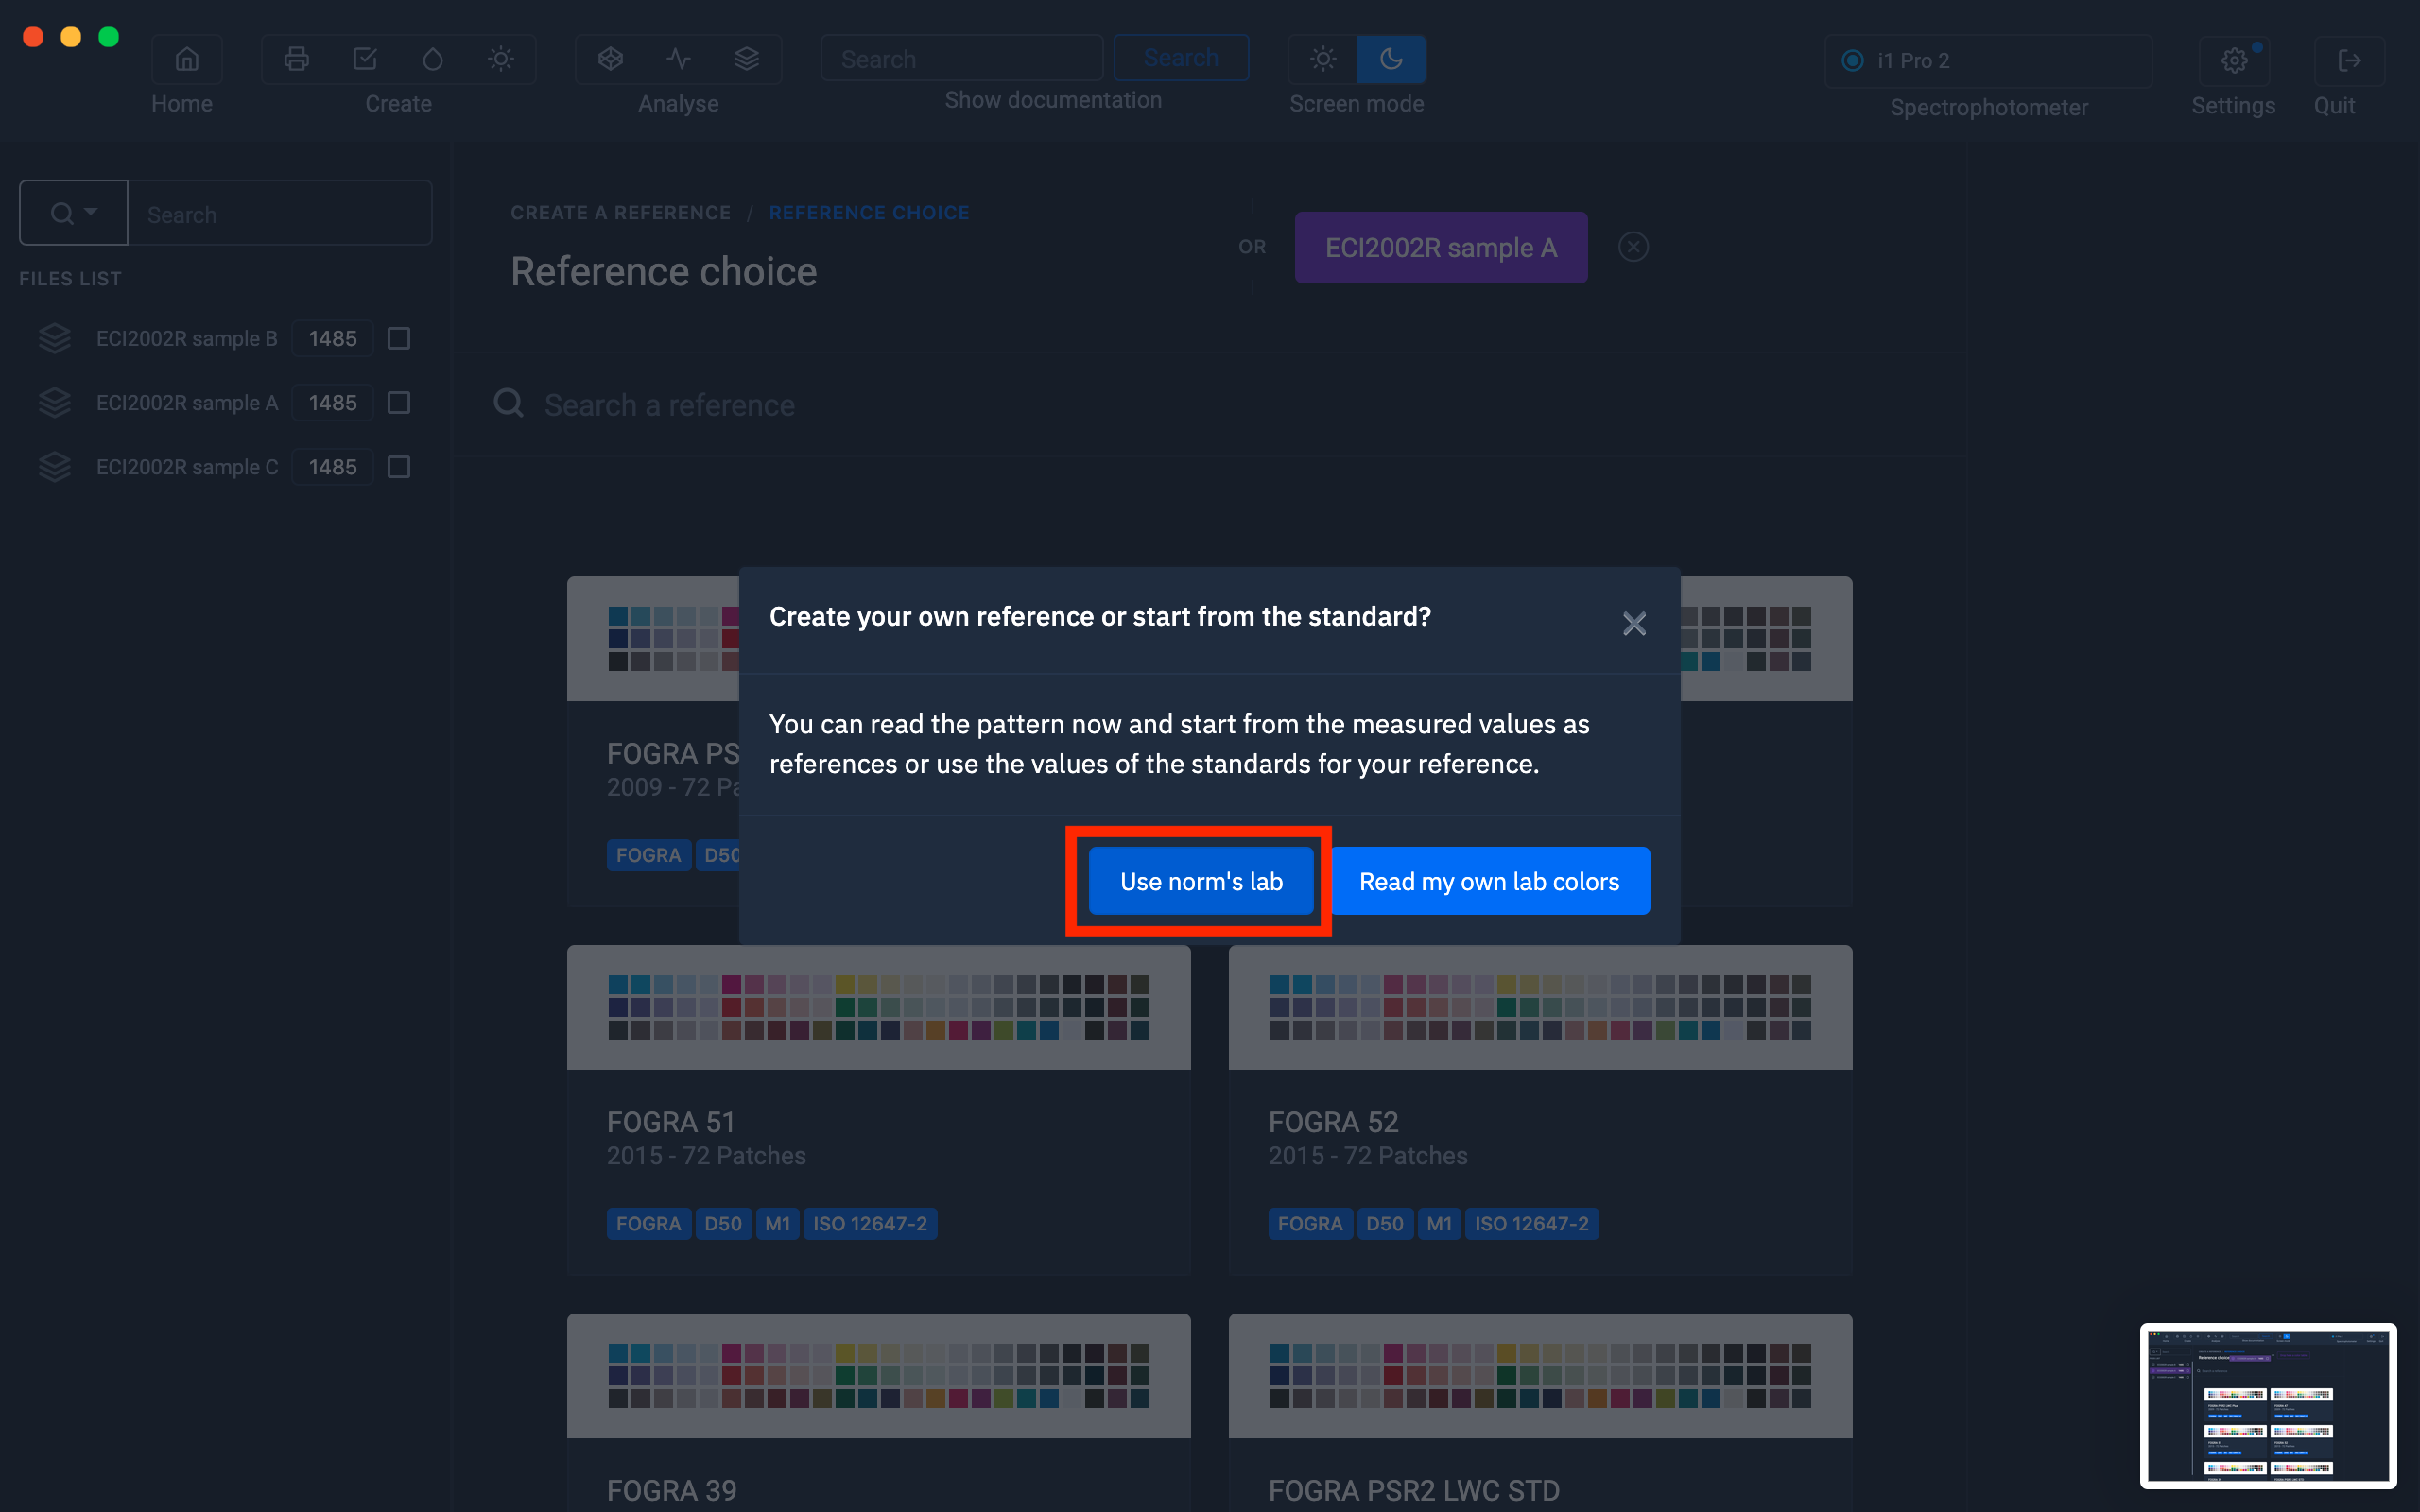
Then click on the button " Use the Labs of the standard "
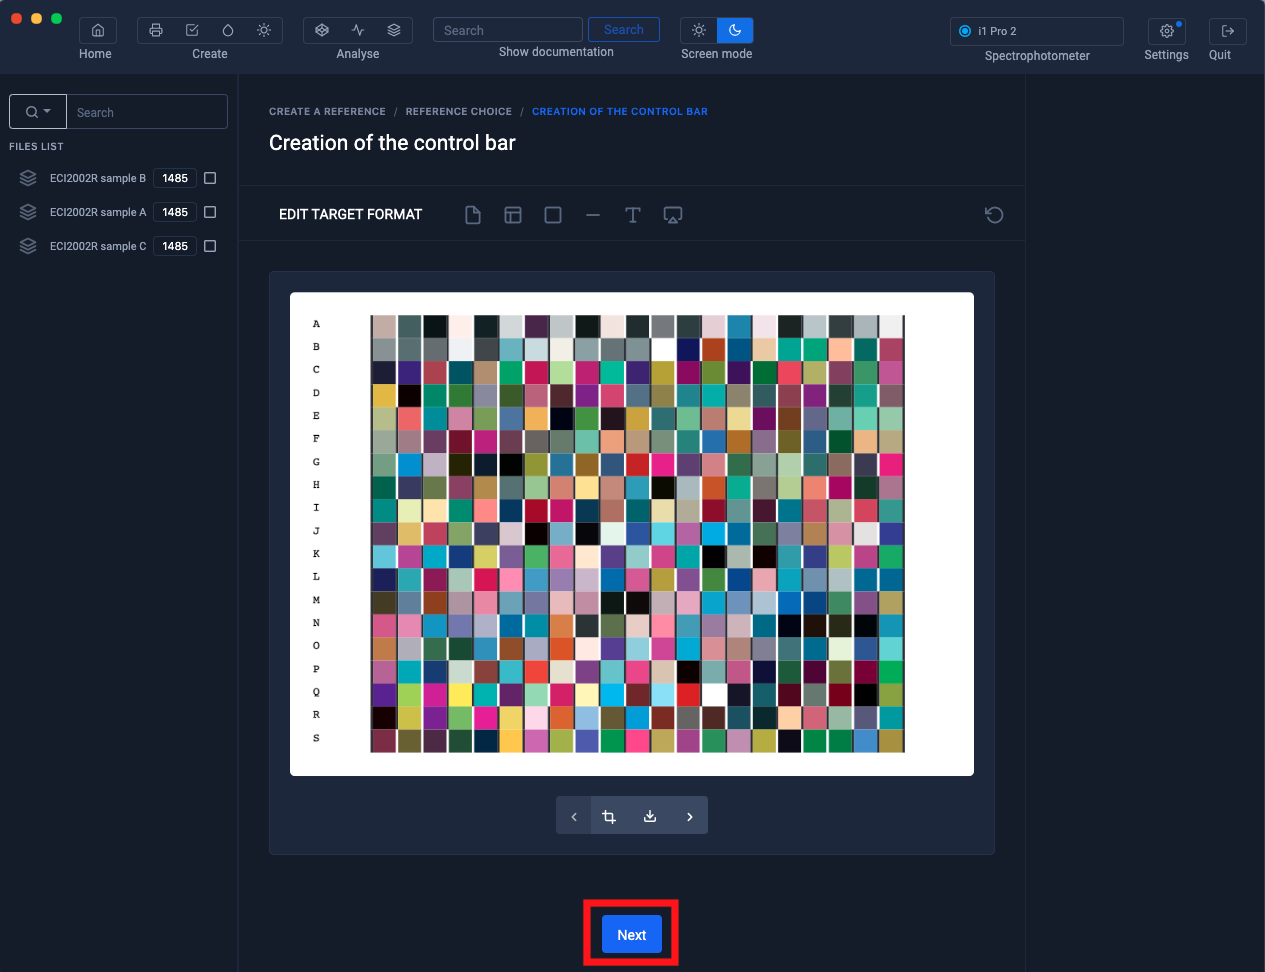
Click on the " Next " button located at the bottom of the test chart
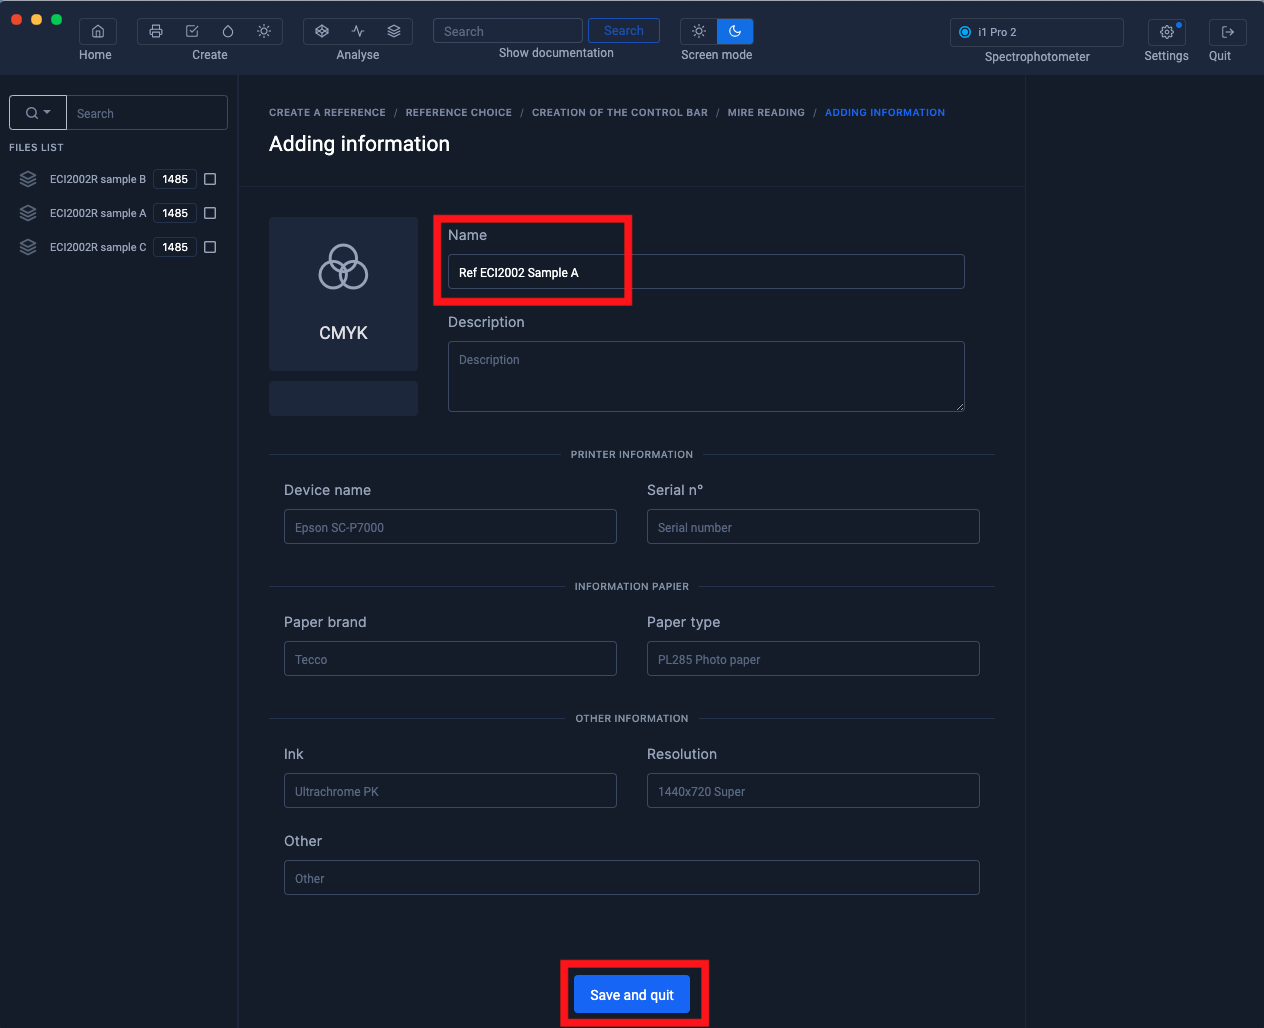
Name the reference file then click on " Save and exit "
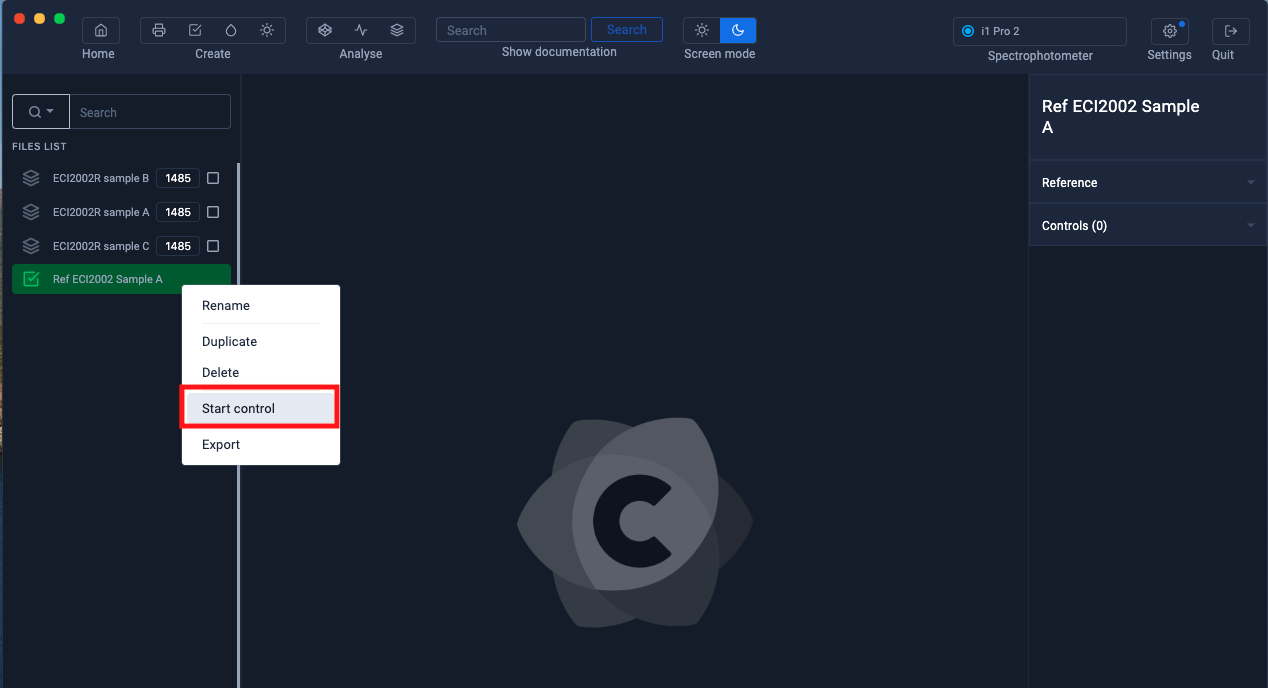
The reference file appears in the left column.

Make sure the spectrophotometer is plugged in then right click on the reference file then select " Start control "
Select the options the options of the spectrophotometer then click on "I'm ready"


Comparison of a measurement against the reference measurement
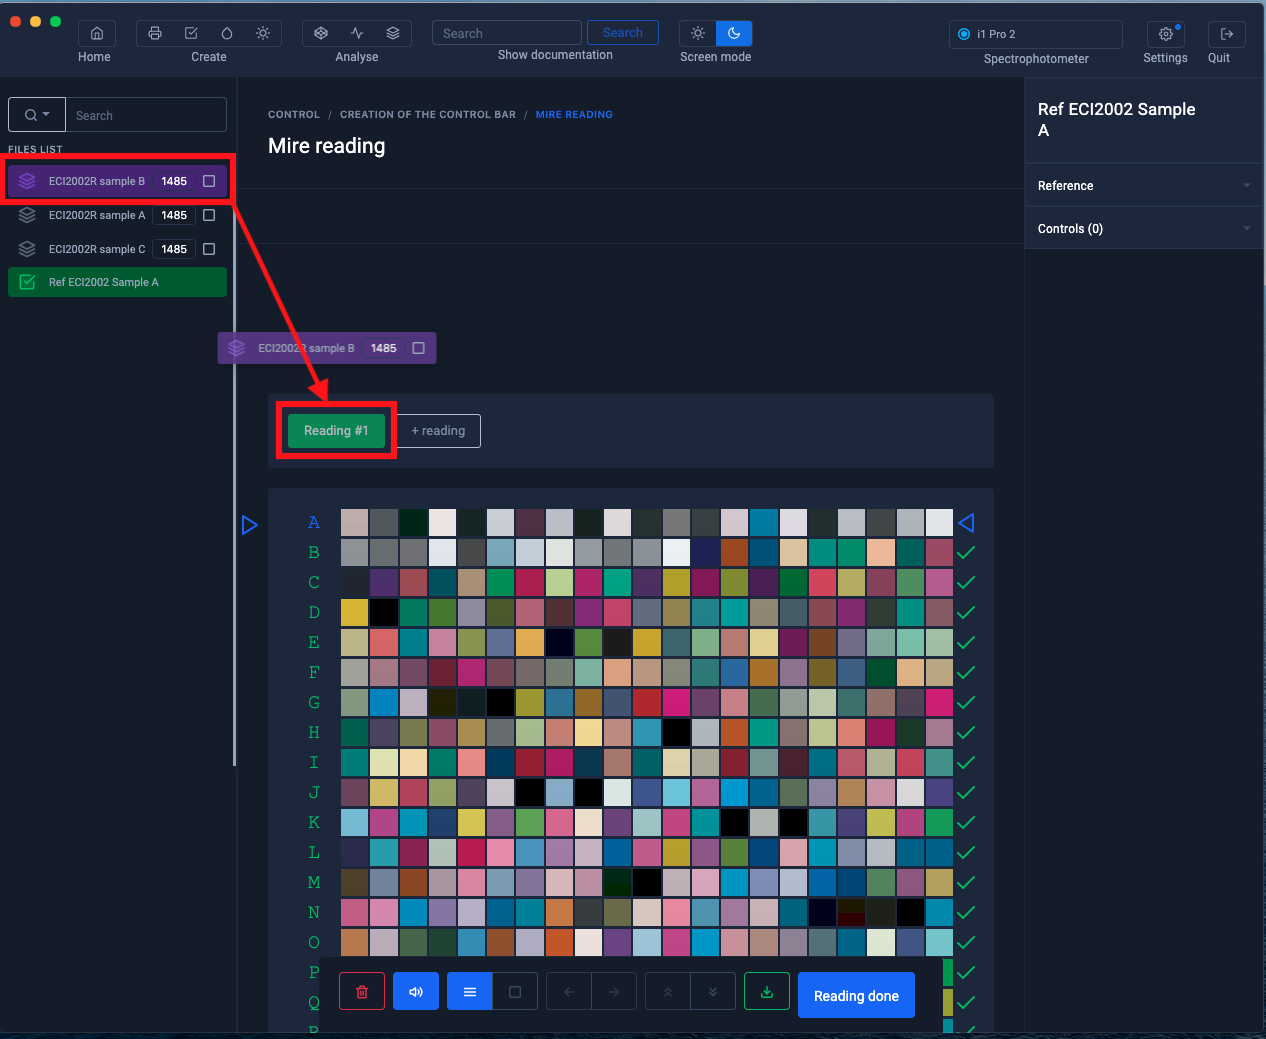
Drag the "ECI2002 sample B" measurement file onto the "Reading # 1" button
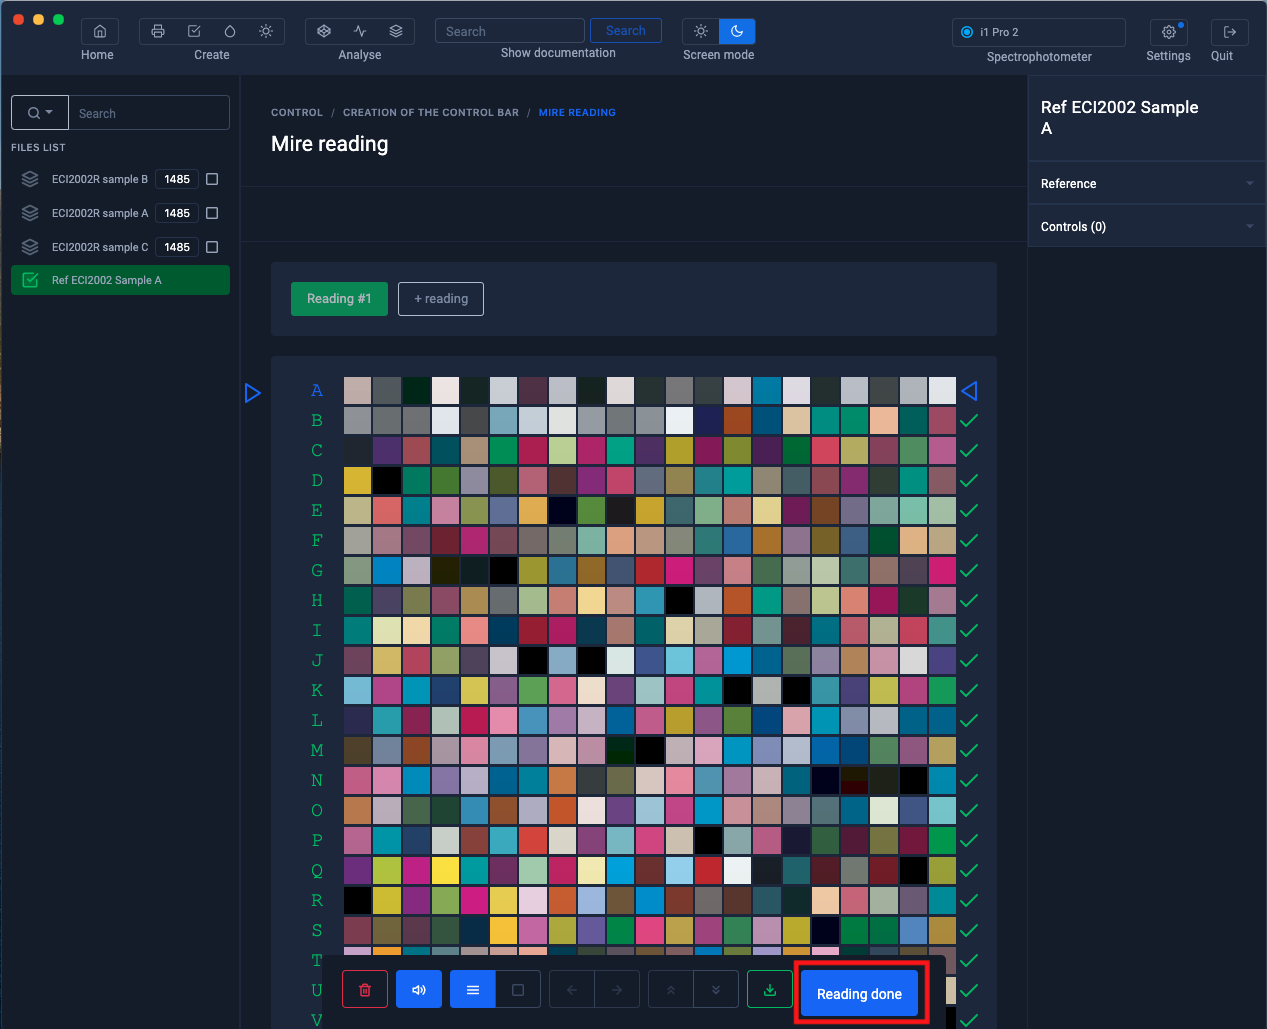
When the measurement is loaded, click on the " Measurement finished " button
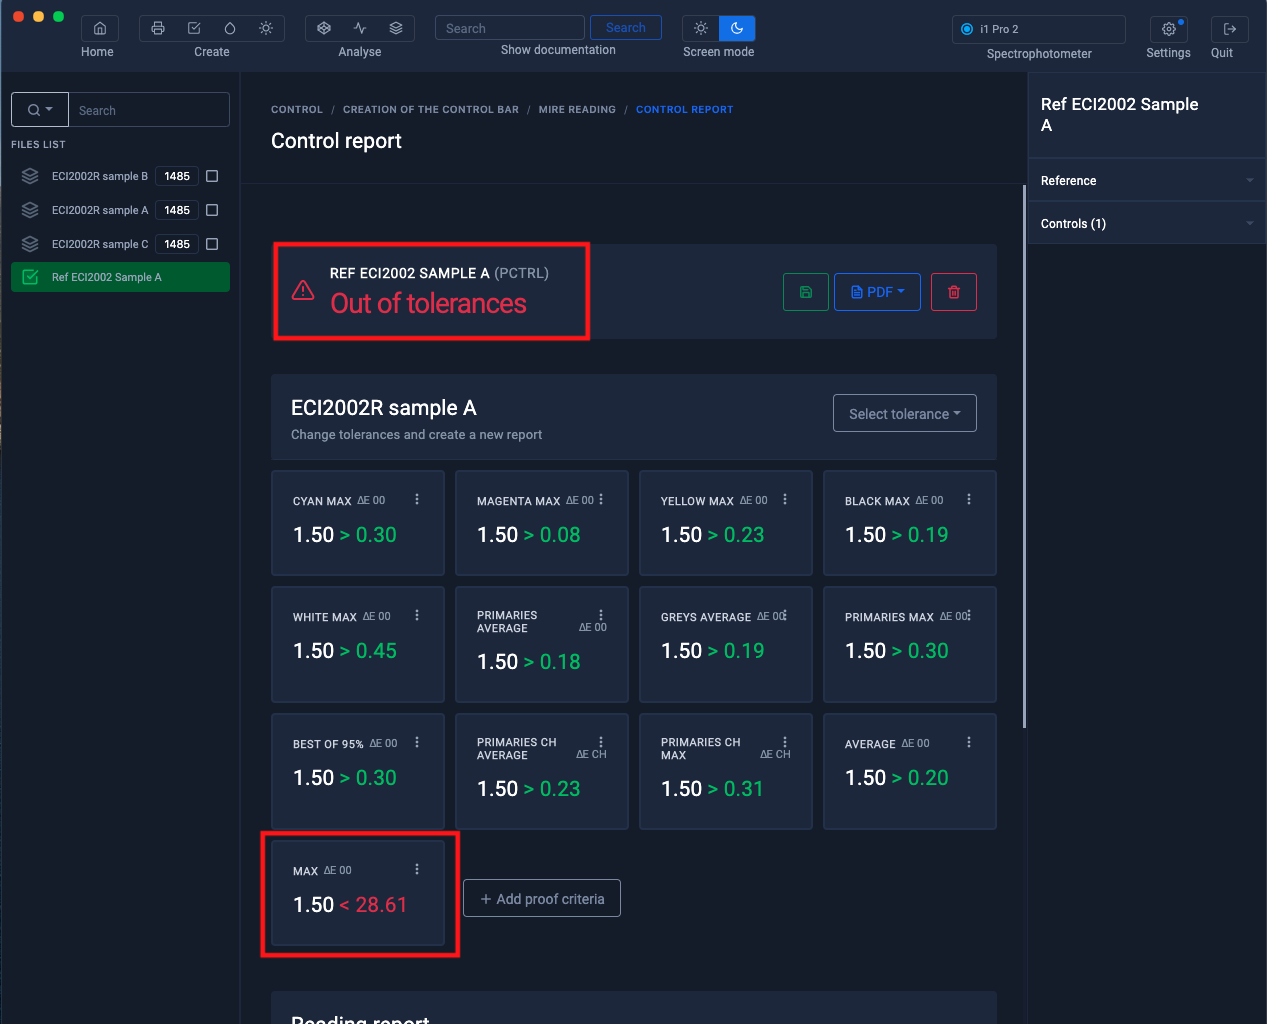
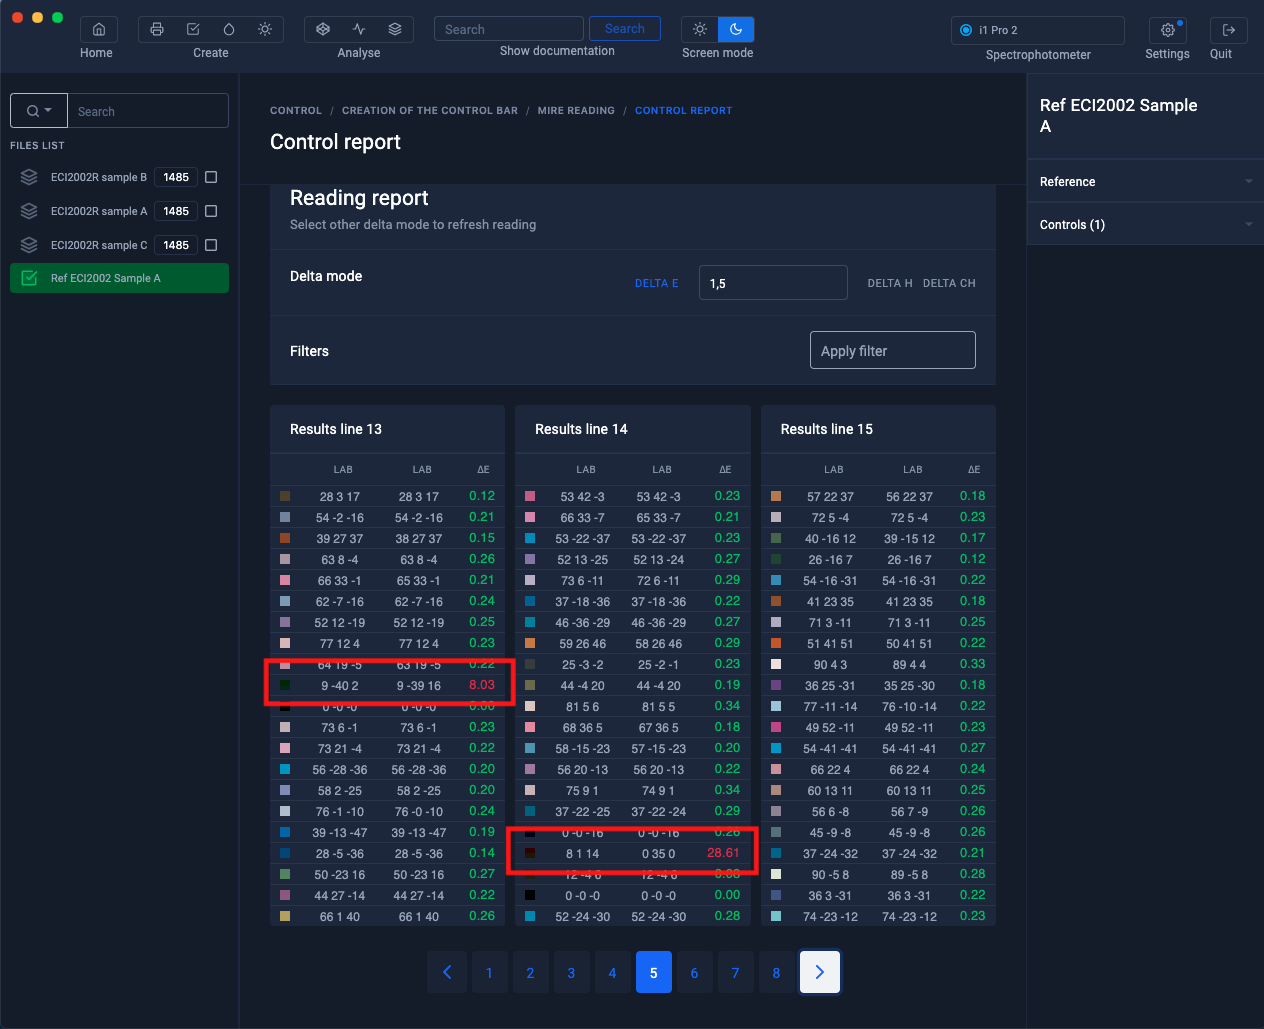
The report is displayed and indicates that there are samples that have an unusually high difference.
This may be due to a defective target or to a reading error.
In the "Reading report" area we will identify the bad measurements.
Two measurements are problematic:
- The 18th measurement in column 13 => M10
- The 10th measurement in column 14 => N18 We are going to measure them again.
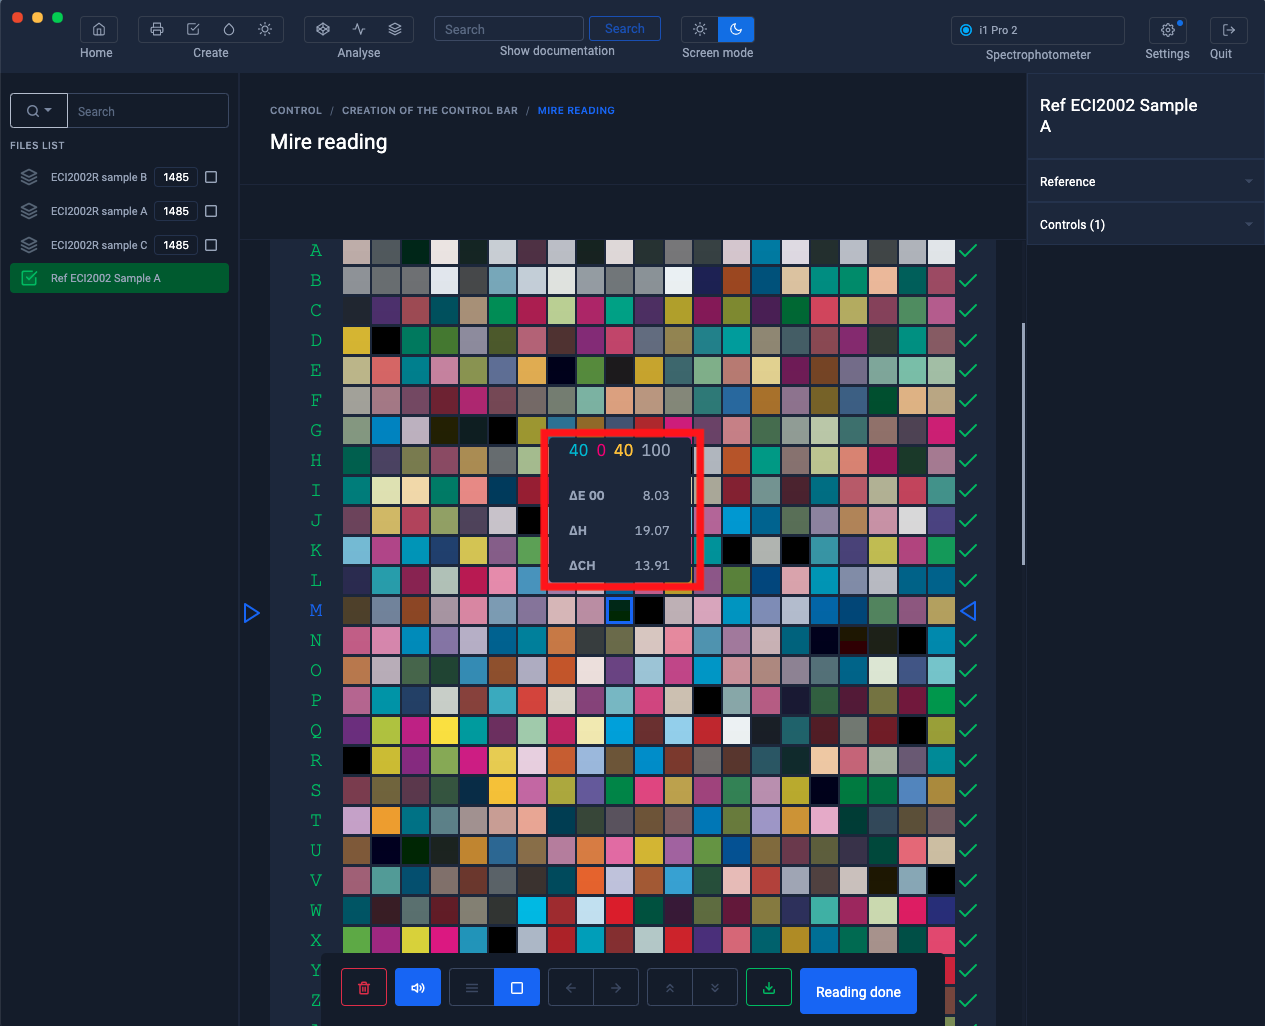
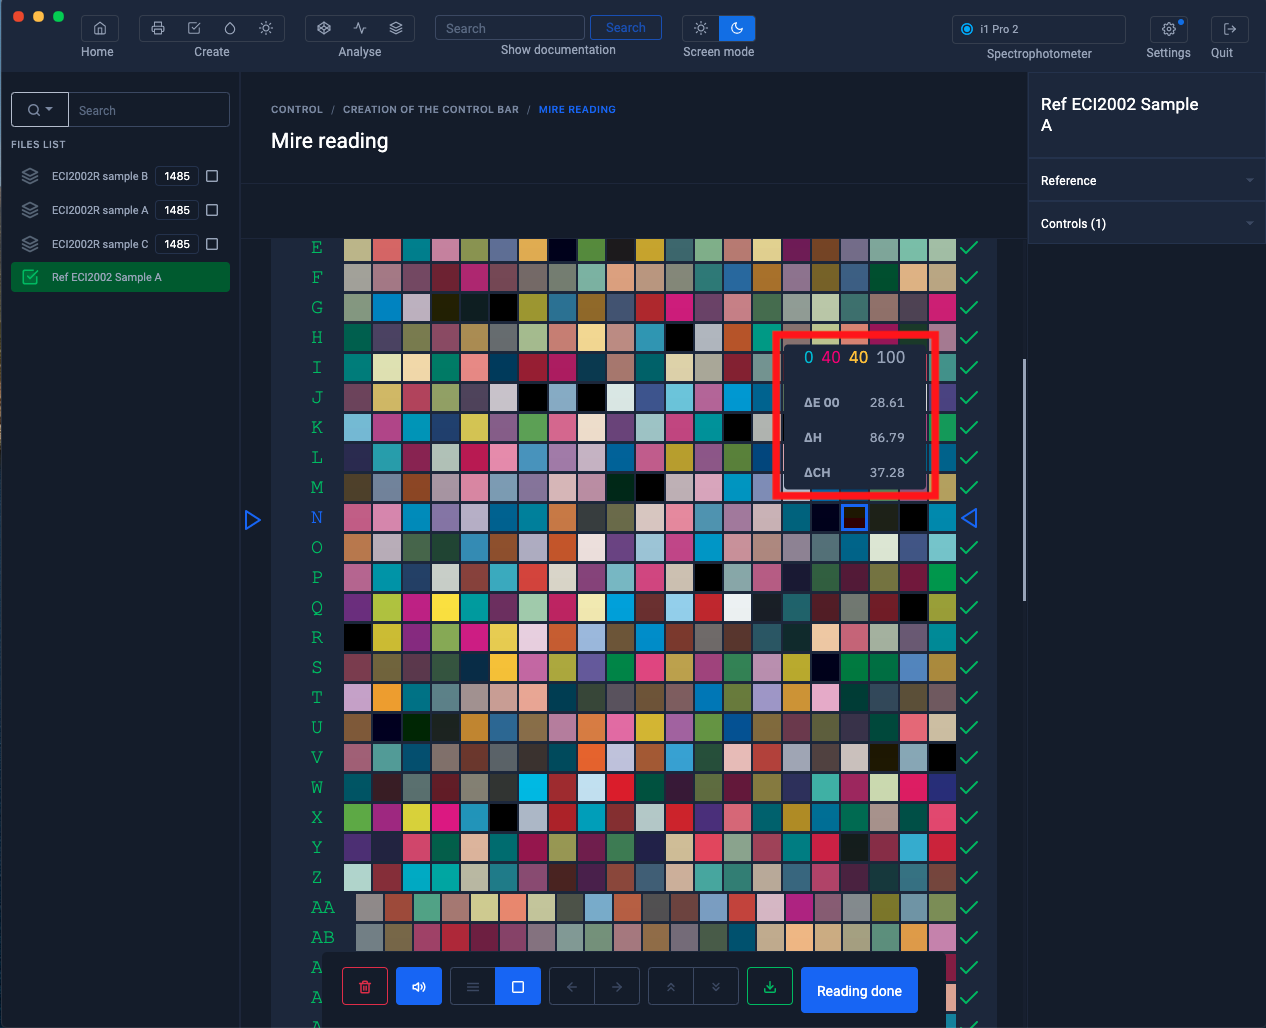
When the measurement is loaded, the color hover displays the deltaE values.
Click on the color to re-measure.
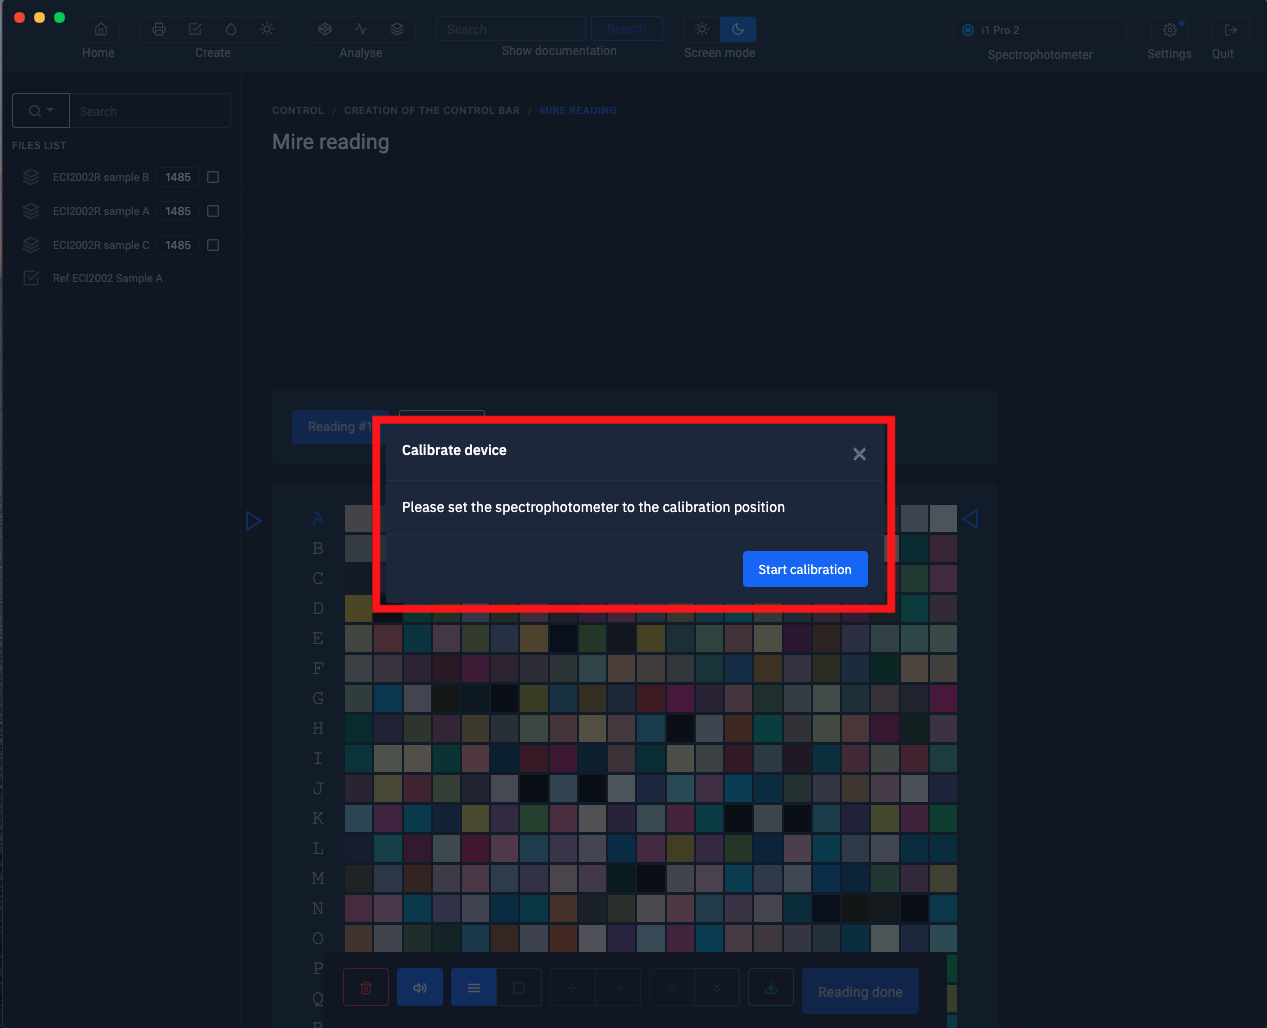
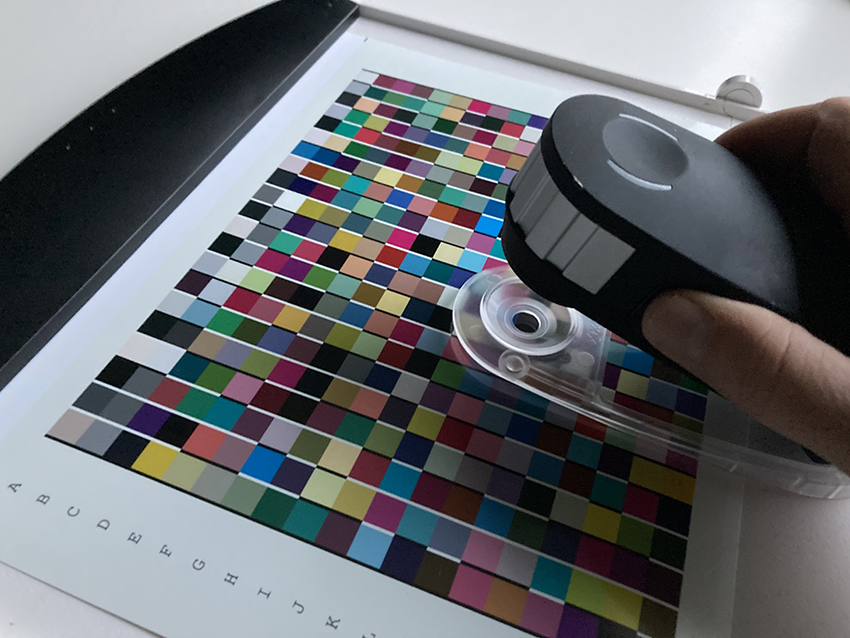
The spectrophotometer will ask you for a calibration then measure the sample on the printed test chart.
Check the new value after measurement.
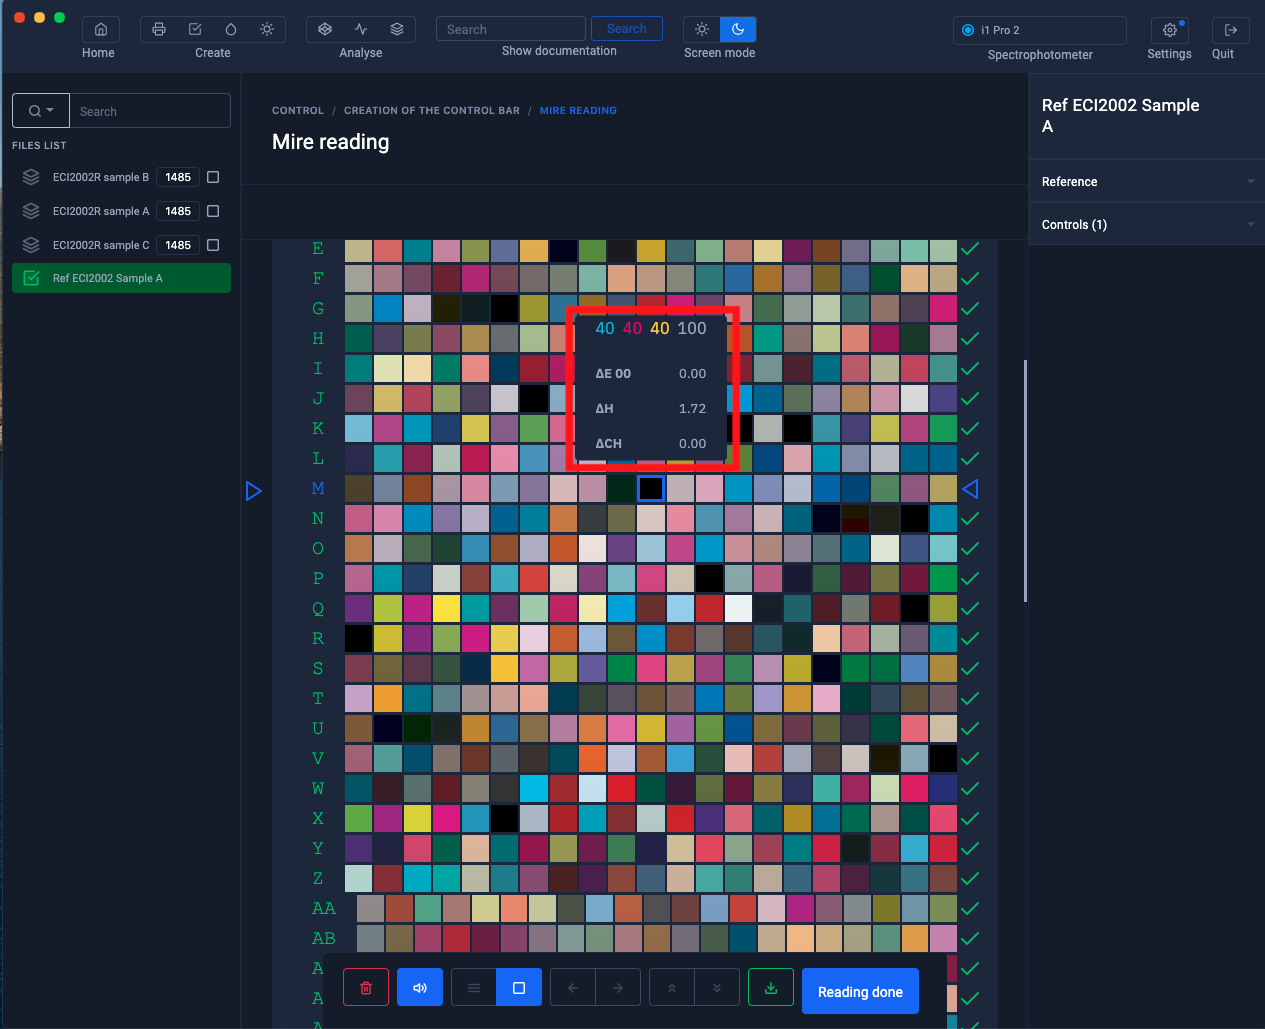
Perform the same operation for the second value.
Check the new value after measurement. When the measurements are finished, click on the " Measurement finished " button
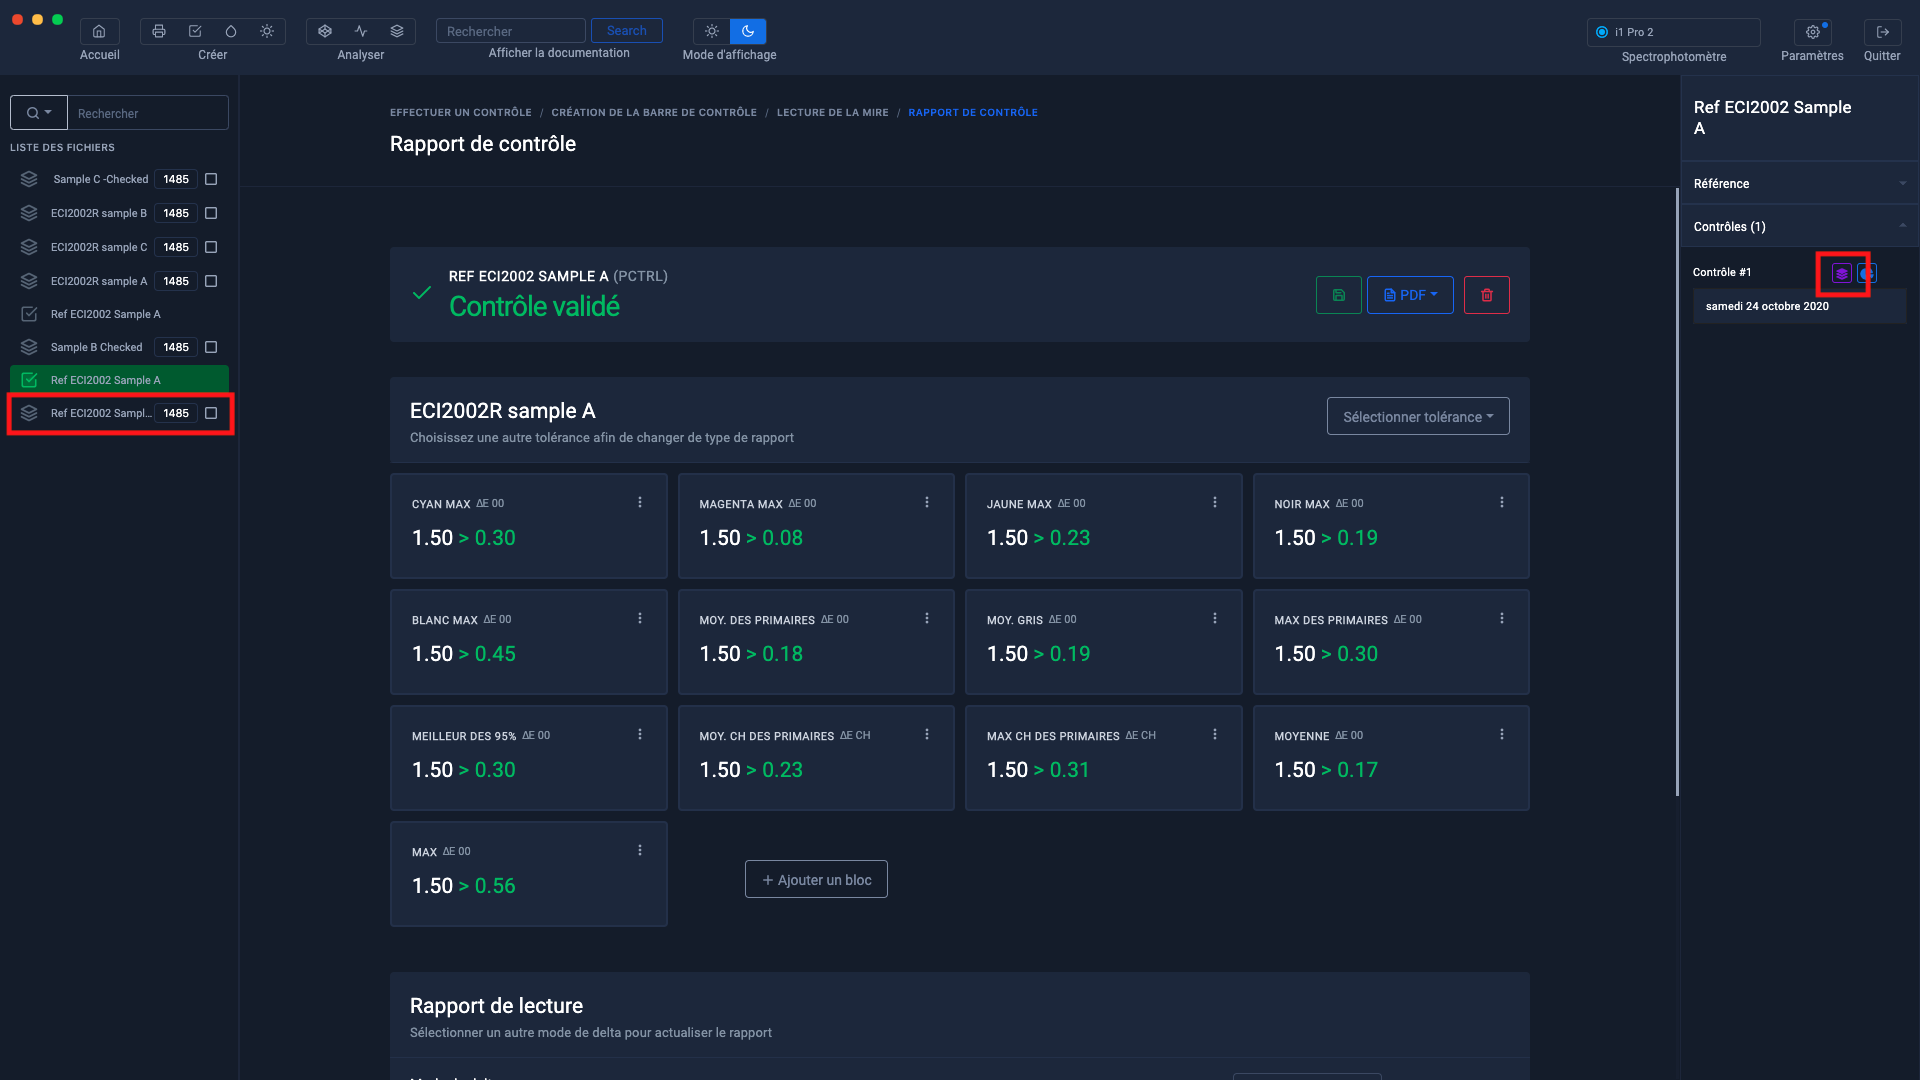
The new report is displayed
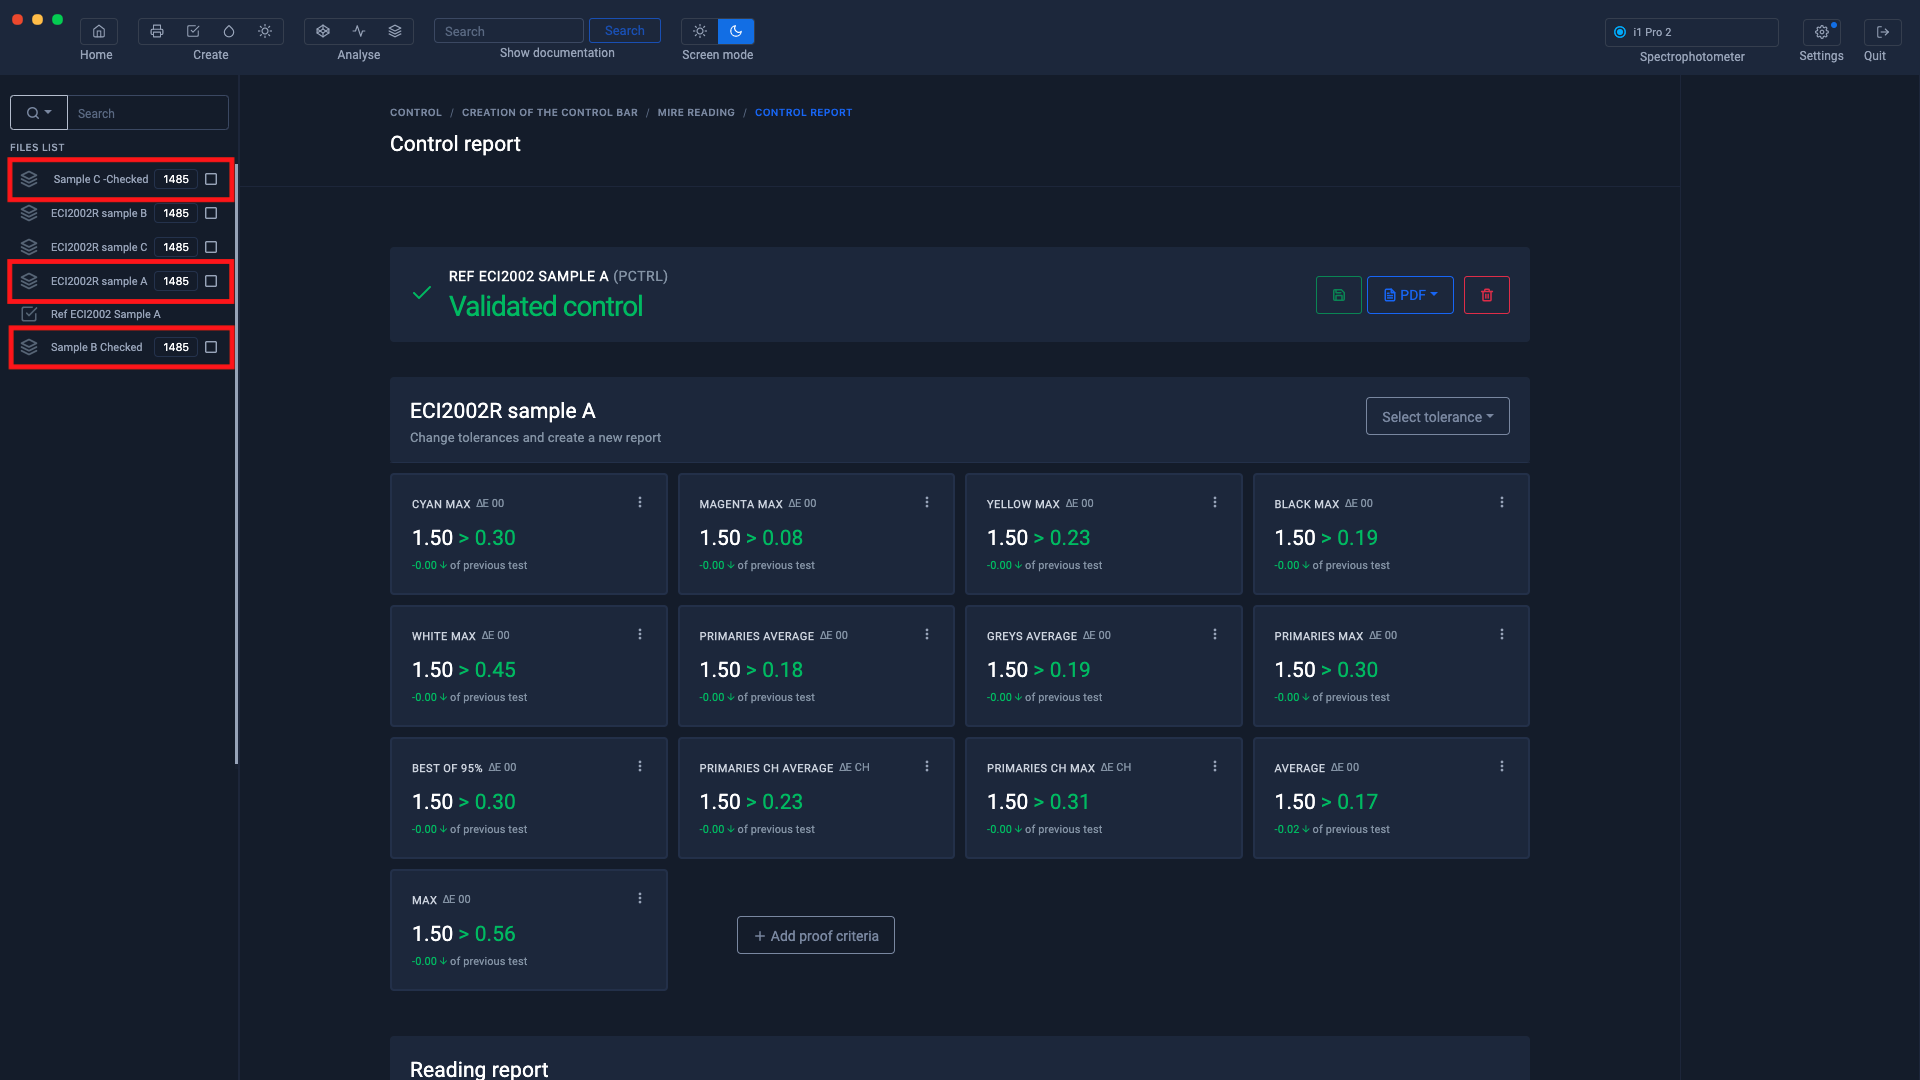
Carry out the same operation with the other measurement "ECI2002R sample C"
The average of the verified measurements can be used to create the icc profile
To find out more, see the chapter: Create an icc profile from an average of measured charts