Create an icc profile from an average of measured charts
Creating a characterization profile from measurements taken on a sample of several test charts is necessary to characterize an unstable printer or press.
In this tutorial, we will create a characterization profile from a sample of 3 CMYK test charts of the ECI2002R type.
This profile will be carried out in 4 steps:
- Printing of the test charts
- Take and measure the 3 test targets
- Compare the measurements of the 3 test targets in order to check the quality of these and check for any measurement errors.
- Take the average of the 3 measurements then start the profile calculation.
Printing of charters
In the profile creation module, click on " Create a characterization " then on " CMJN "
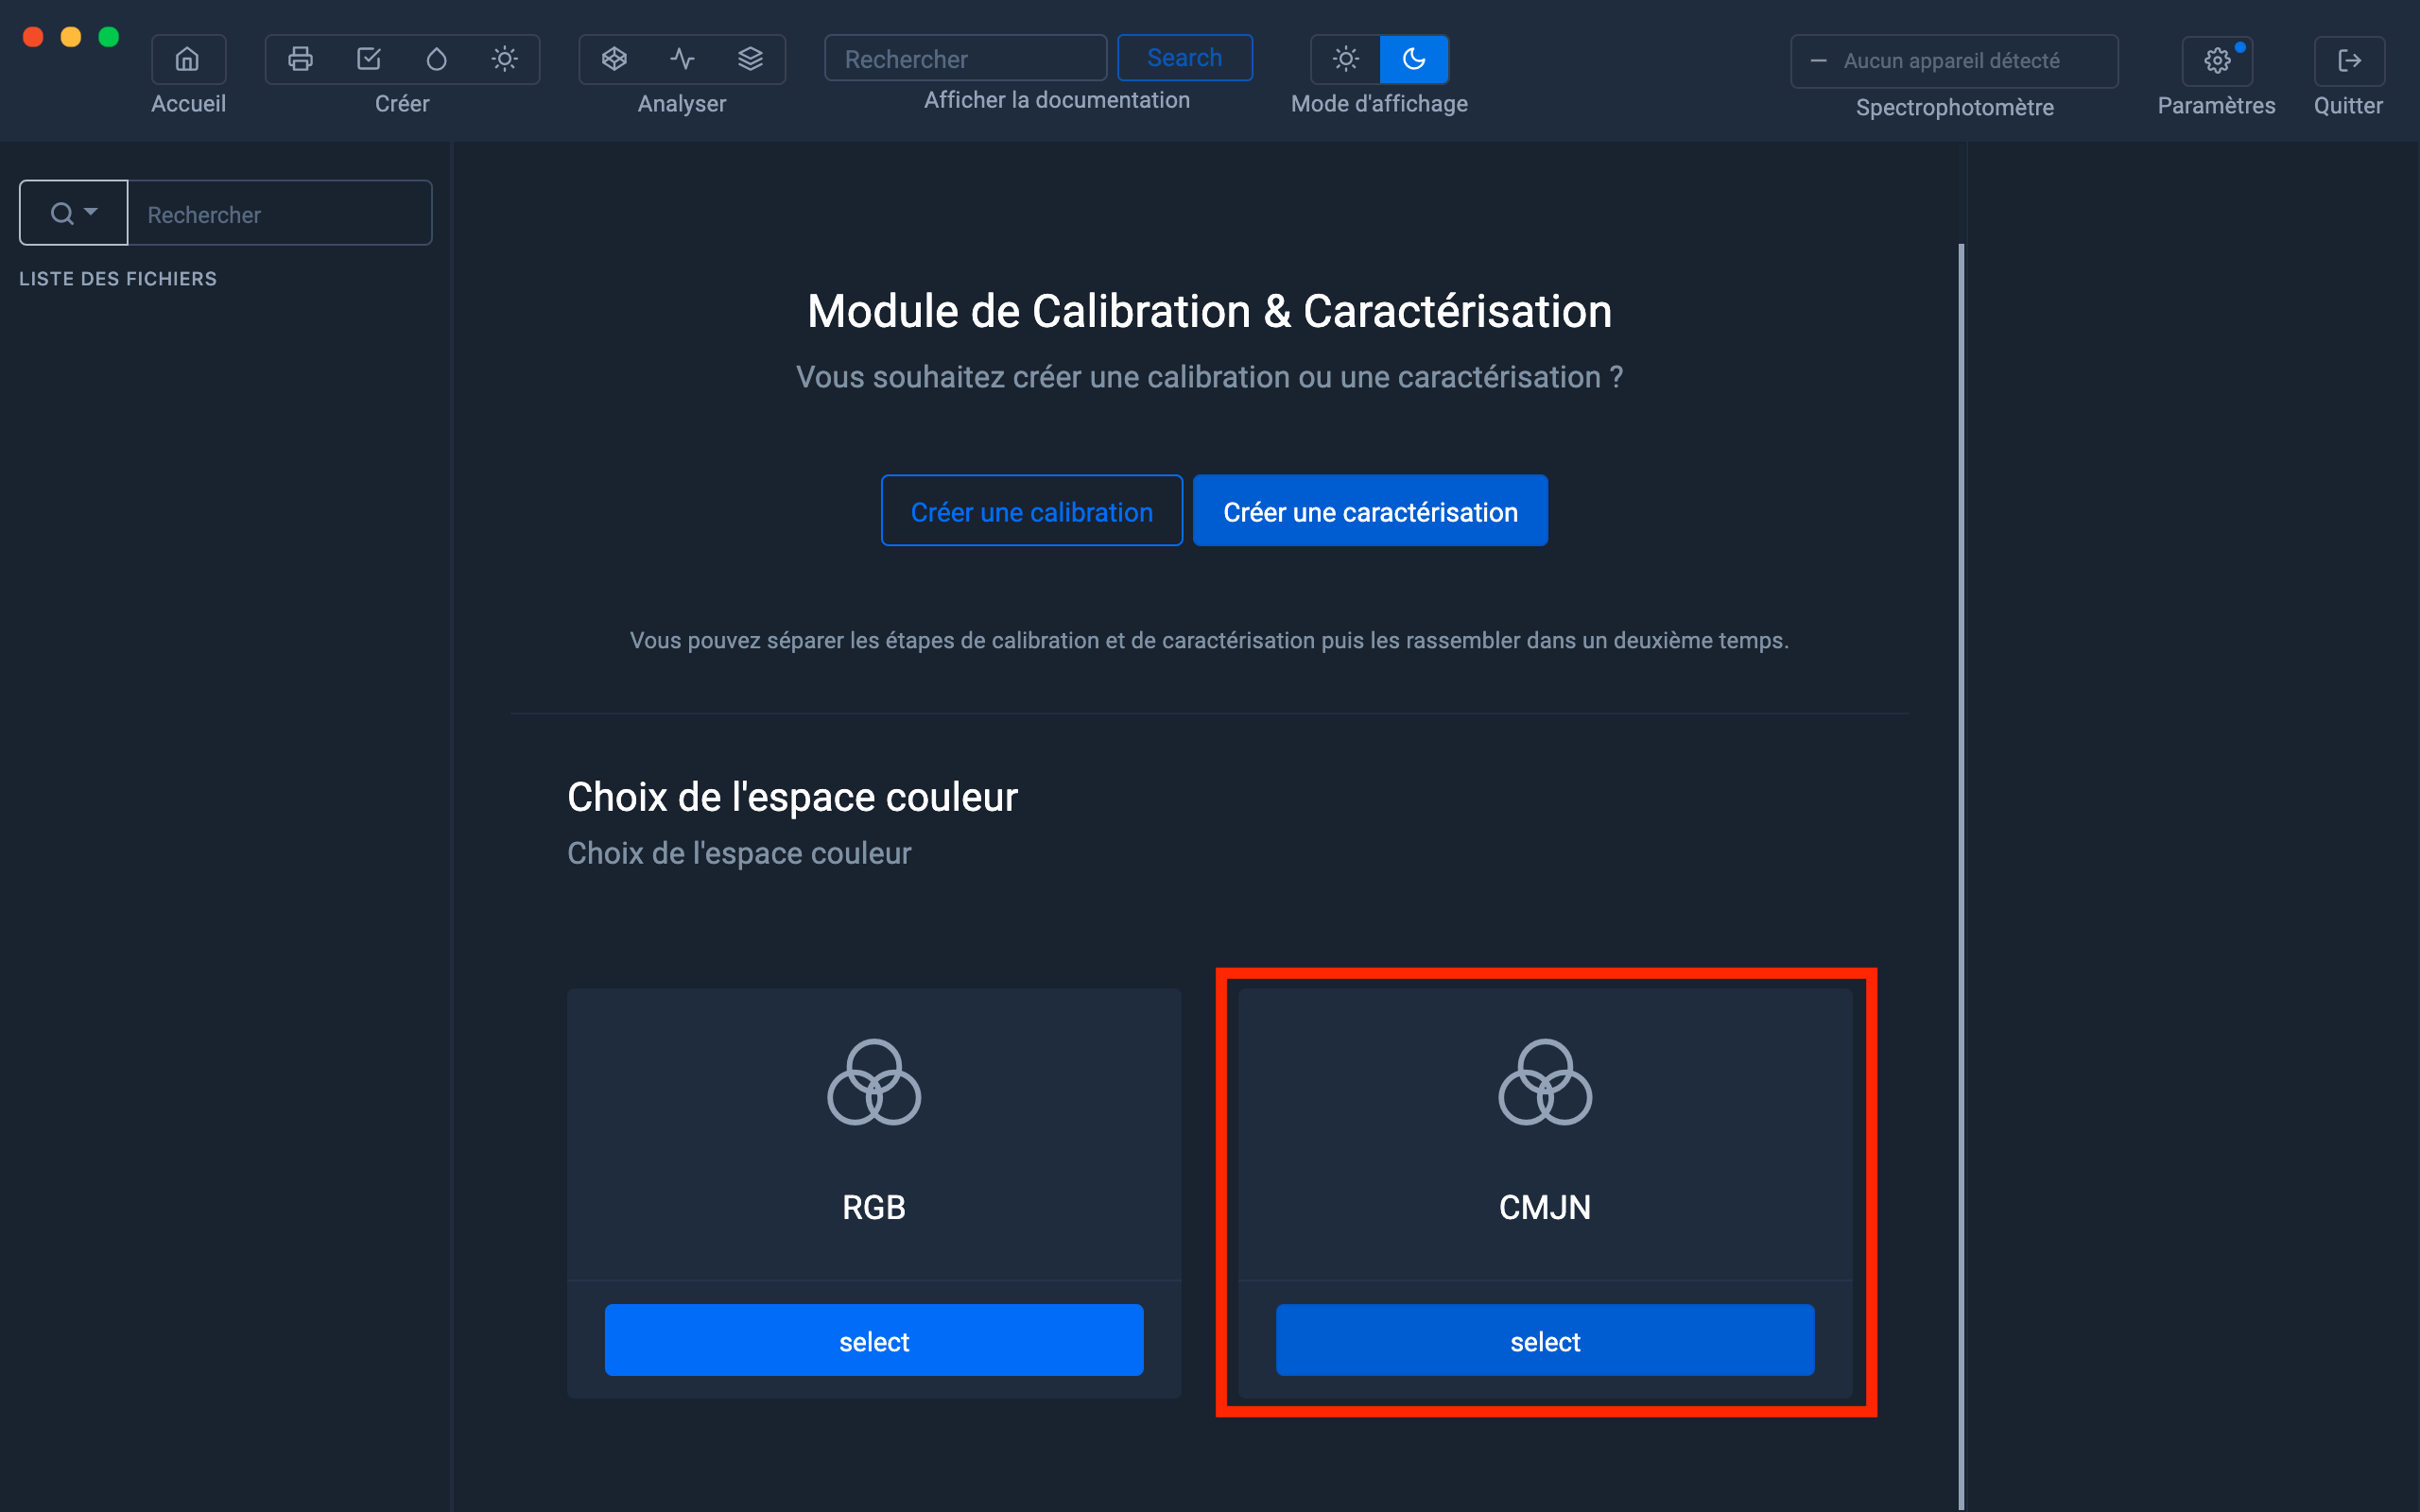
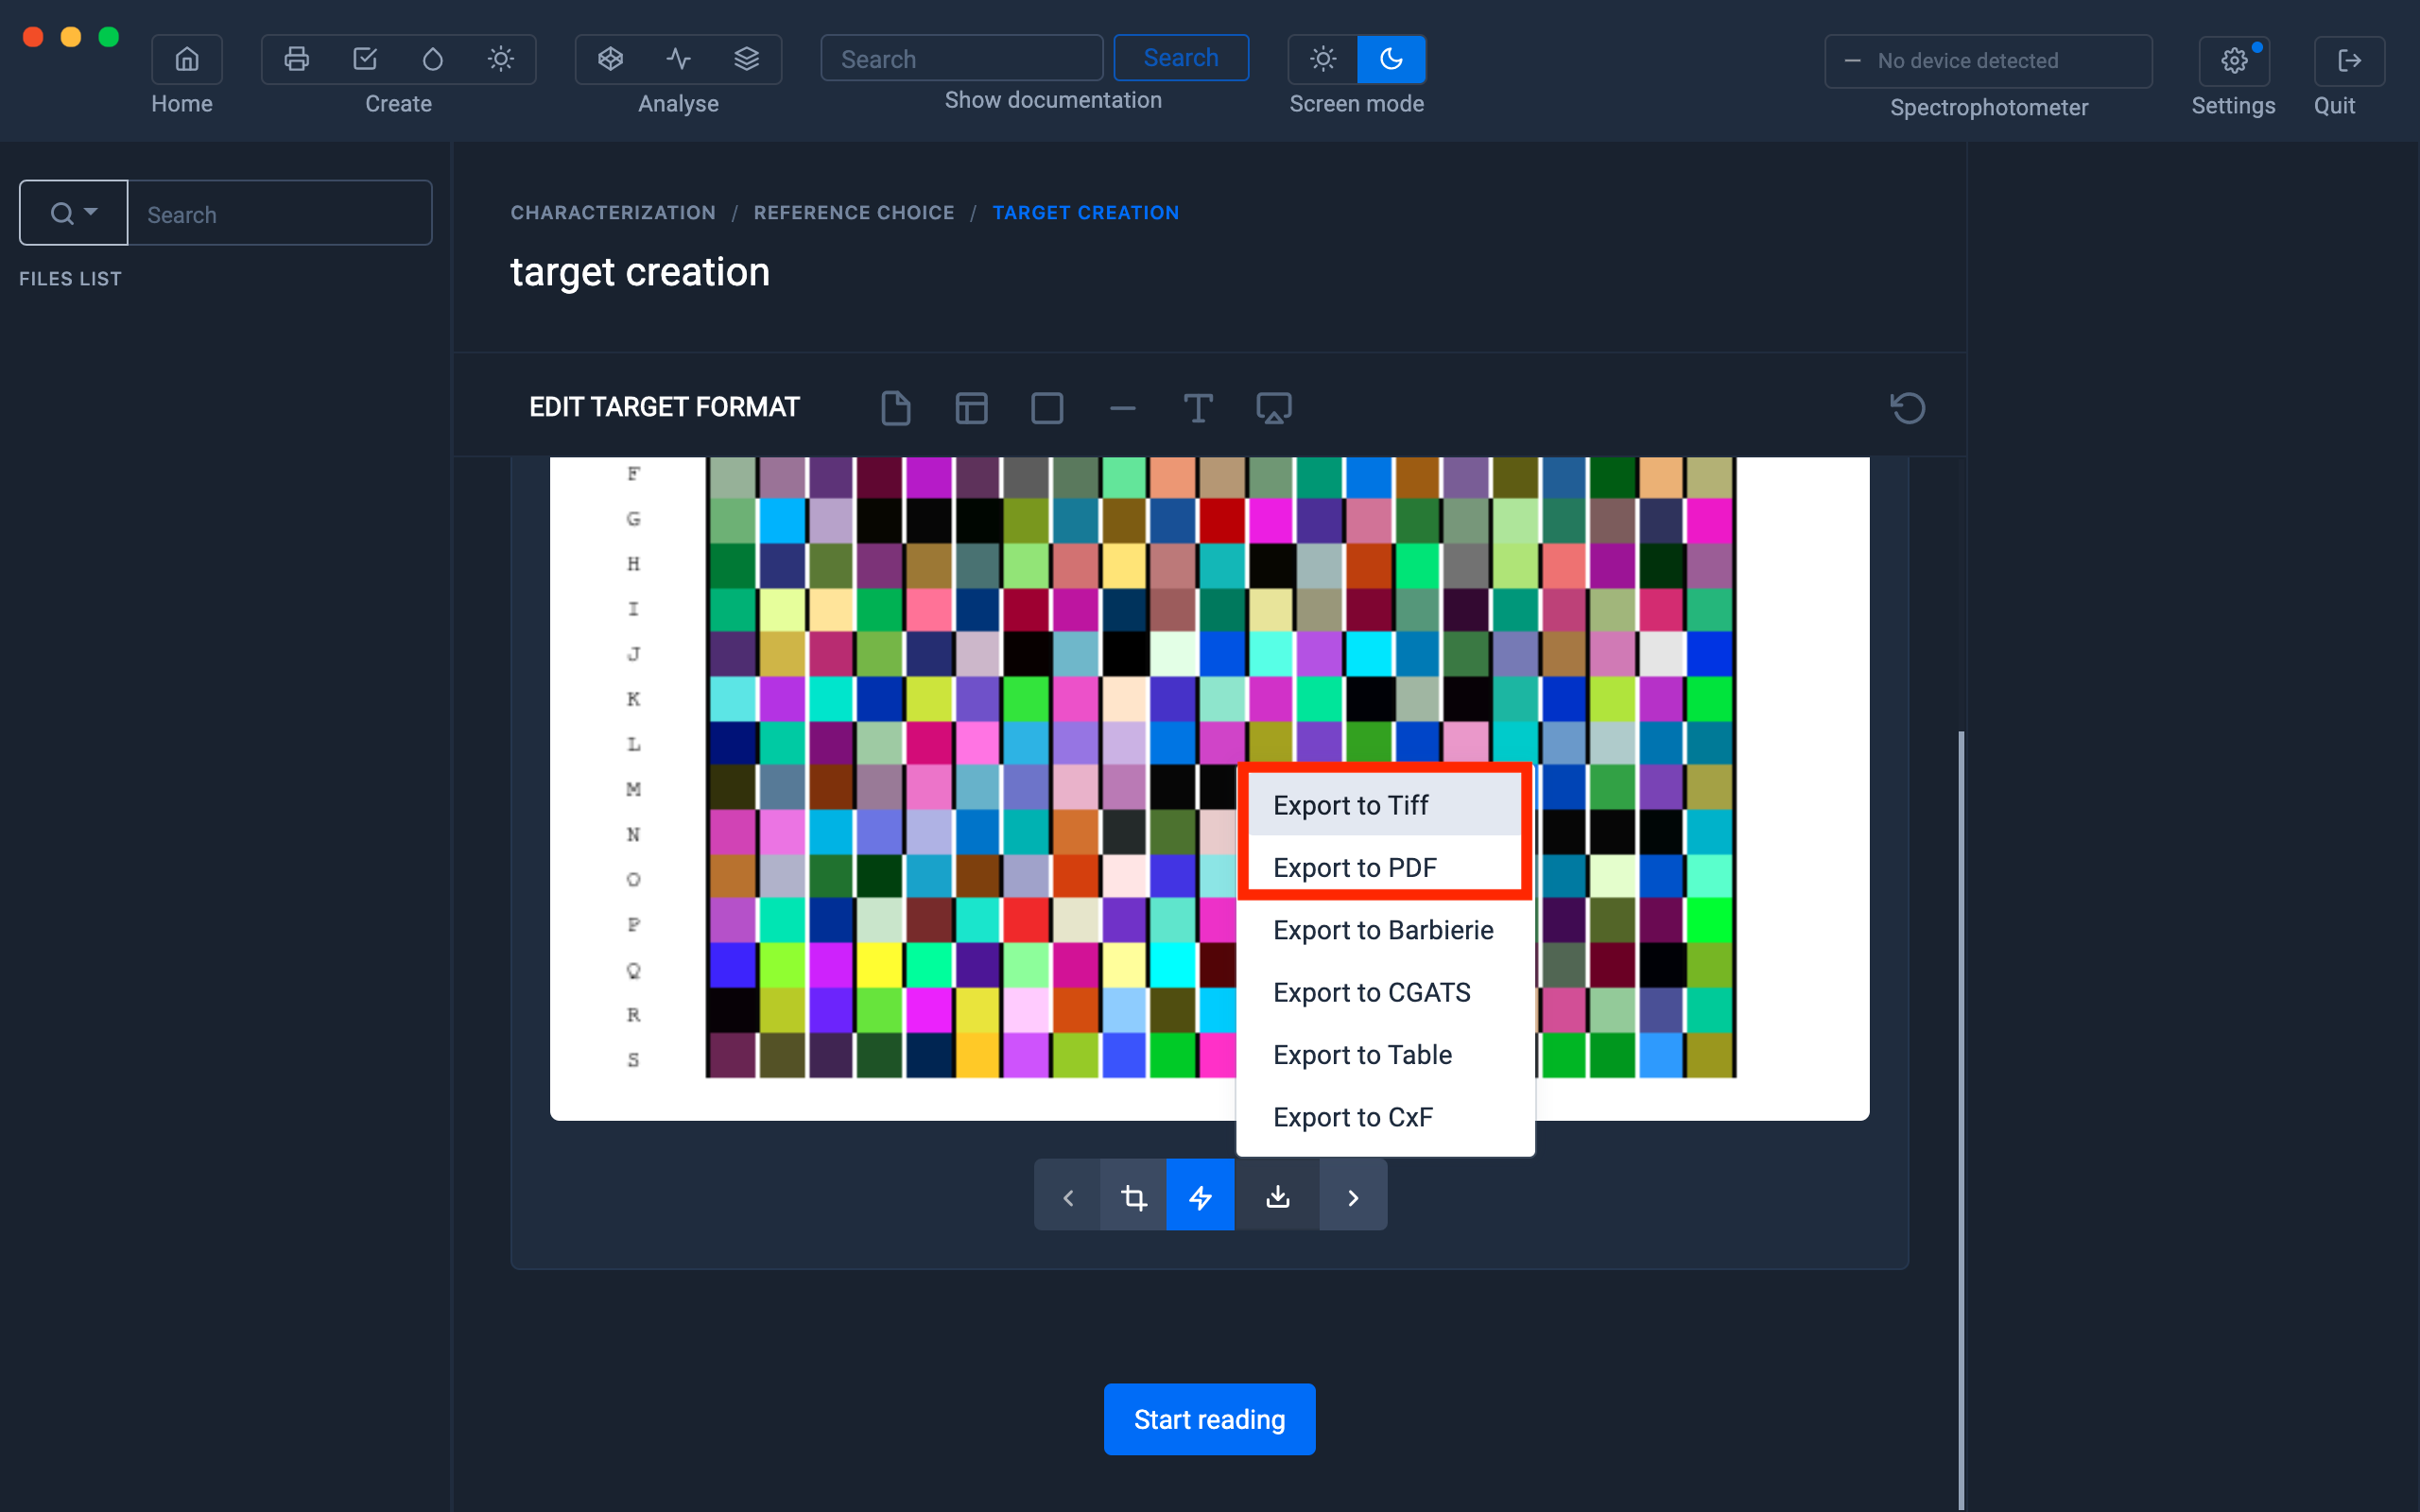
Select the " ECI2002R " charter by clicking on the button located under the charter.

When the chart is displayed, export the test chart in Tiff or Pdf format in order to print it.
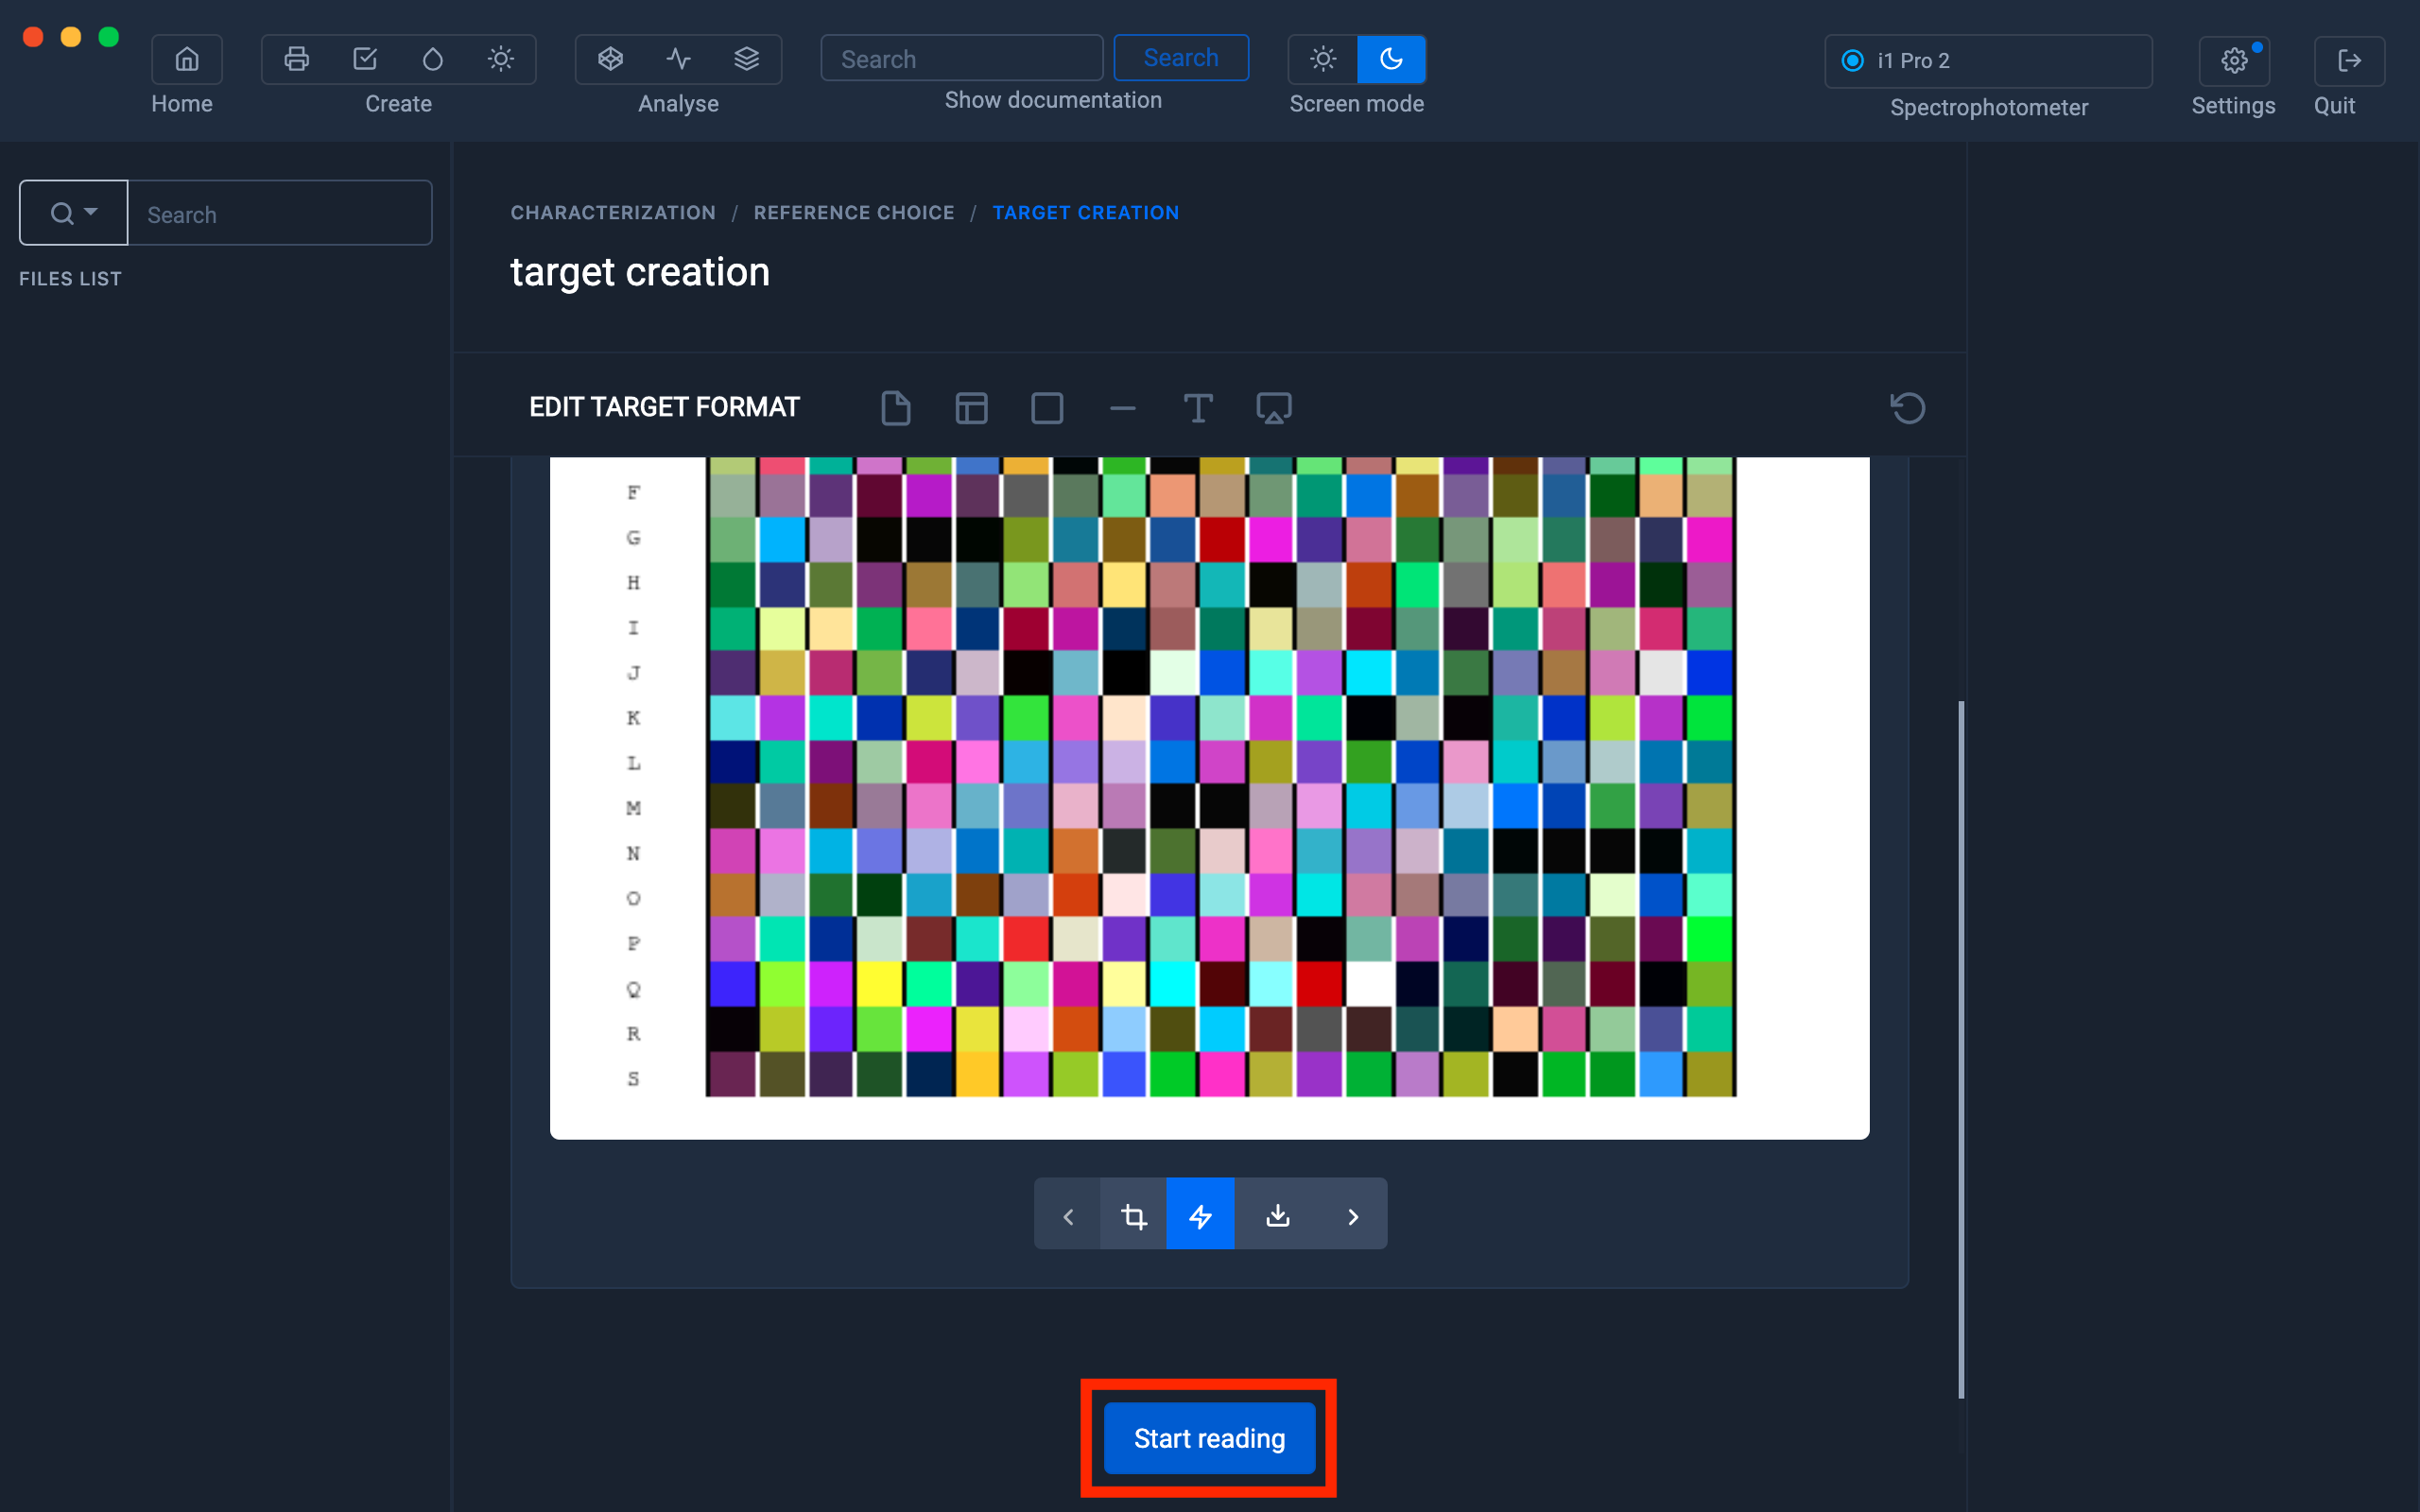
When the test charts have been printed, click on the " Start measurement " button
Select the spectrophotometer options then click on the " I'm ready " button

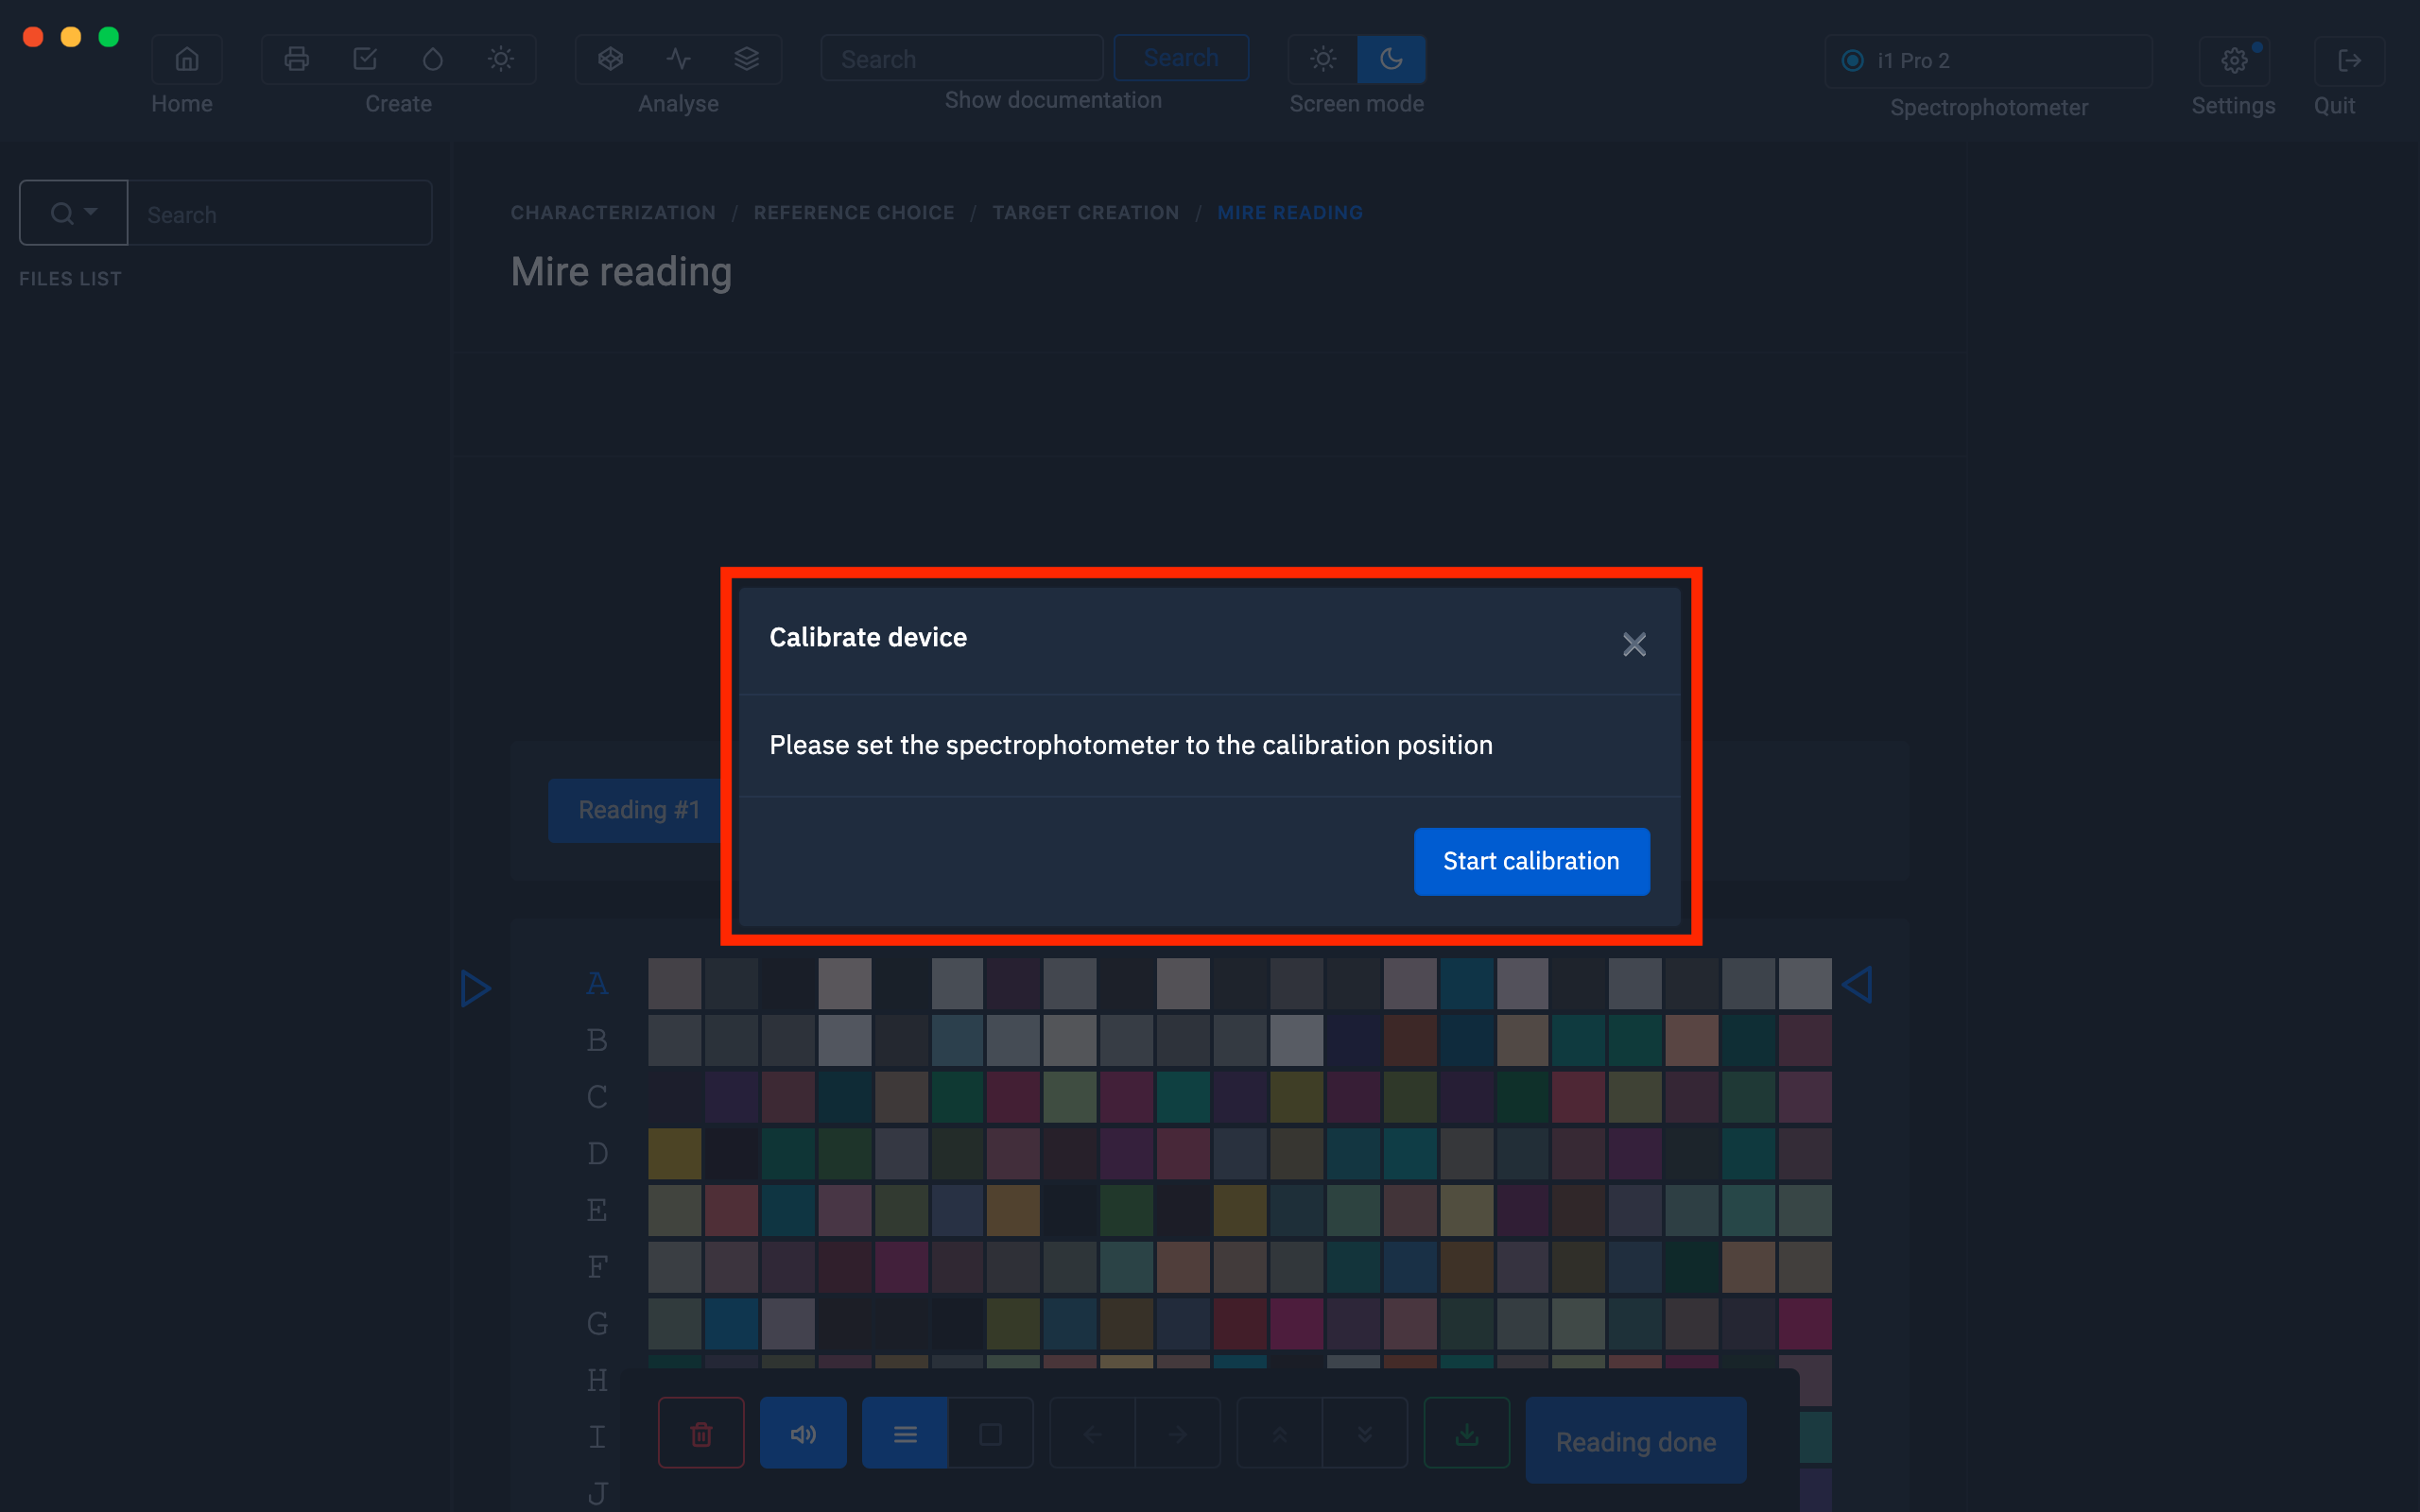
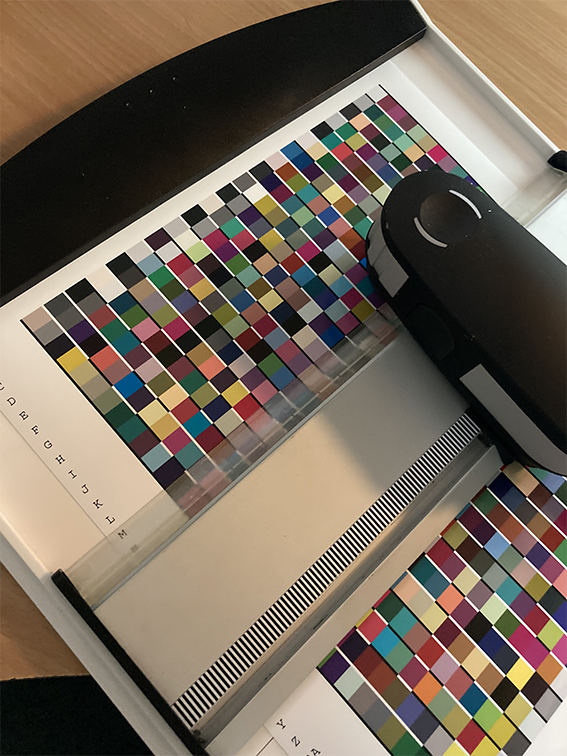
Put the spectrophotometer in its calibration position

Start the calibration by clicking on the " Start calibration " button
When the calibration is complete, perform the chart measurement.
Measure charters
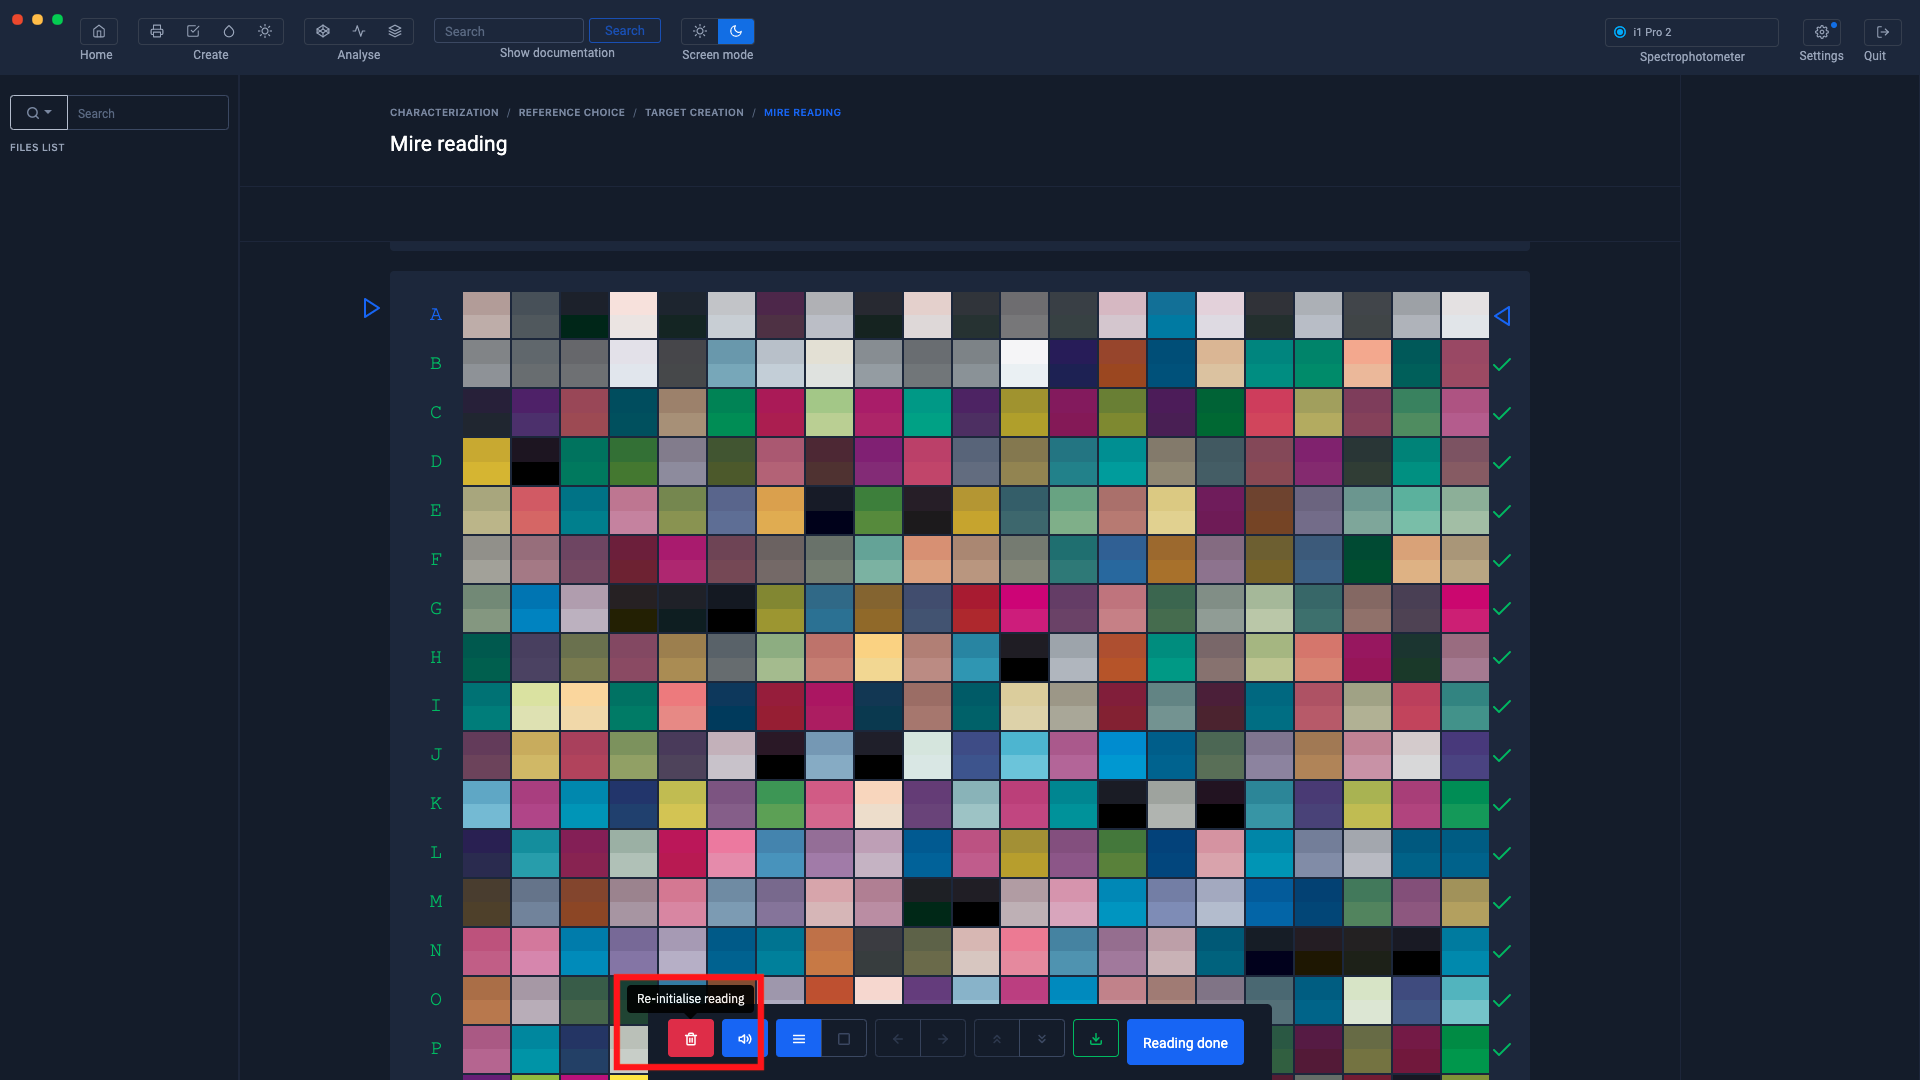
When the chart is completely measured, click on the " Export measurement " button located to the left of the "Measurement completed" button
This will be added to the files in the left column.
Do not click on the "Measure completed" button until you have read all the charts.

When the measurement is saved, click on the trash can icon to perform the measurement for the next chart.
Compare measurements
When all the measurements have been saved, it is advisable to check their quality to detect any faults in the ranges (damaged ranges or measurement errors for example).
To find out more, see the chapter: Compare and edit chart measurements
Average measurements
Use the measurements from the charts carried out previously.
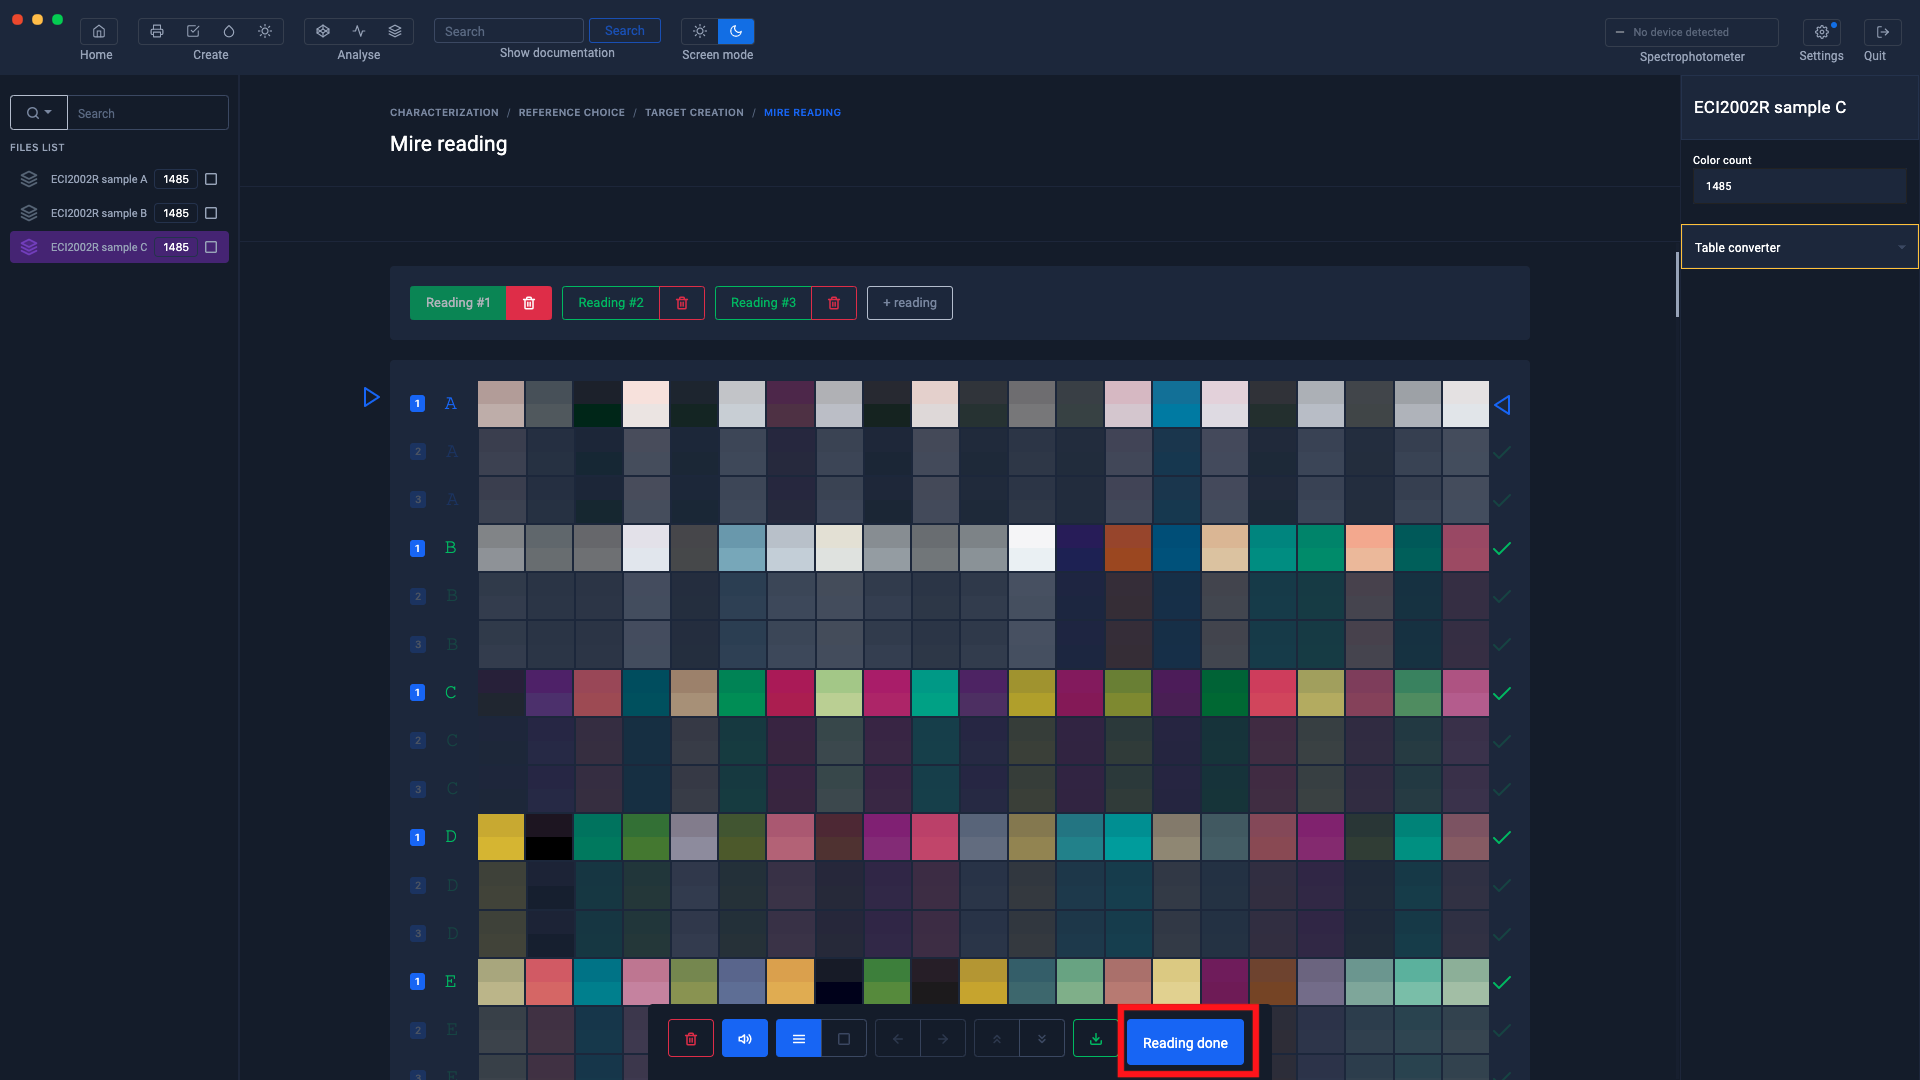
The measurements are displayed as a color table in the left column
New "Reading #" buttons will appear as well as measurement lines.

Drag the color tables (corresponding to the measurements of the ranges) onto these buttons.

Then click on the " Measurement completed " button
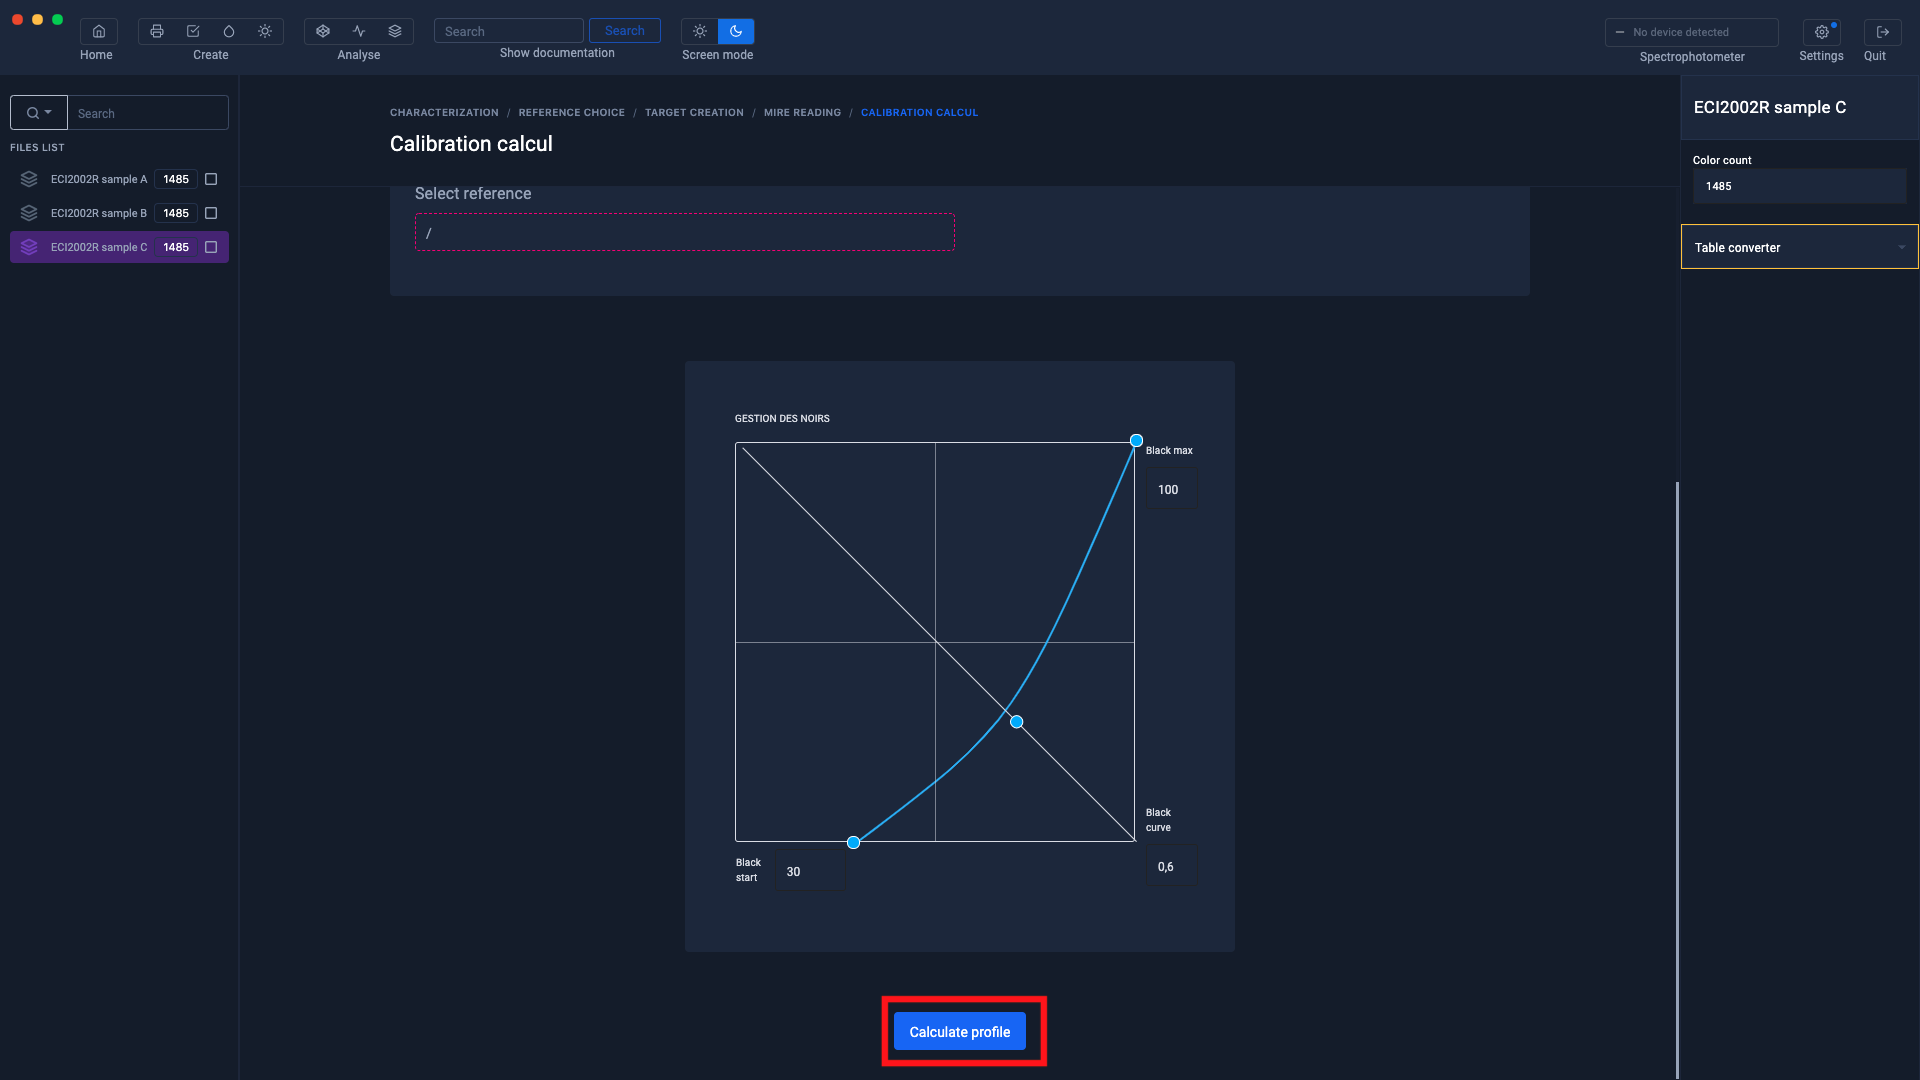
Choose a name for your icc profile
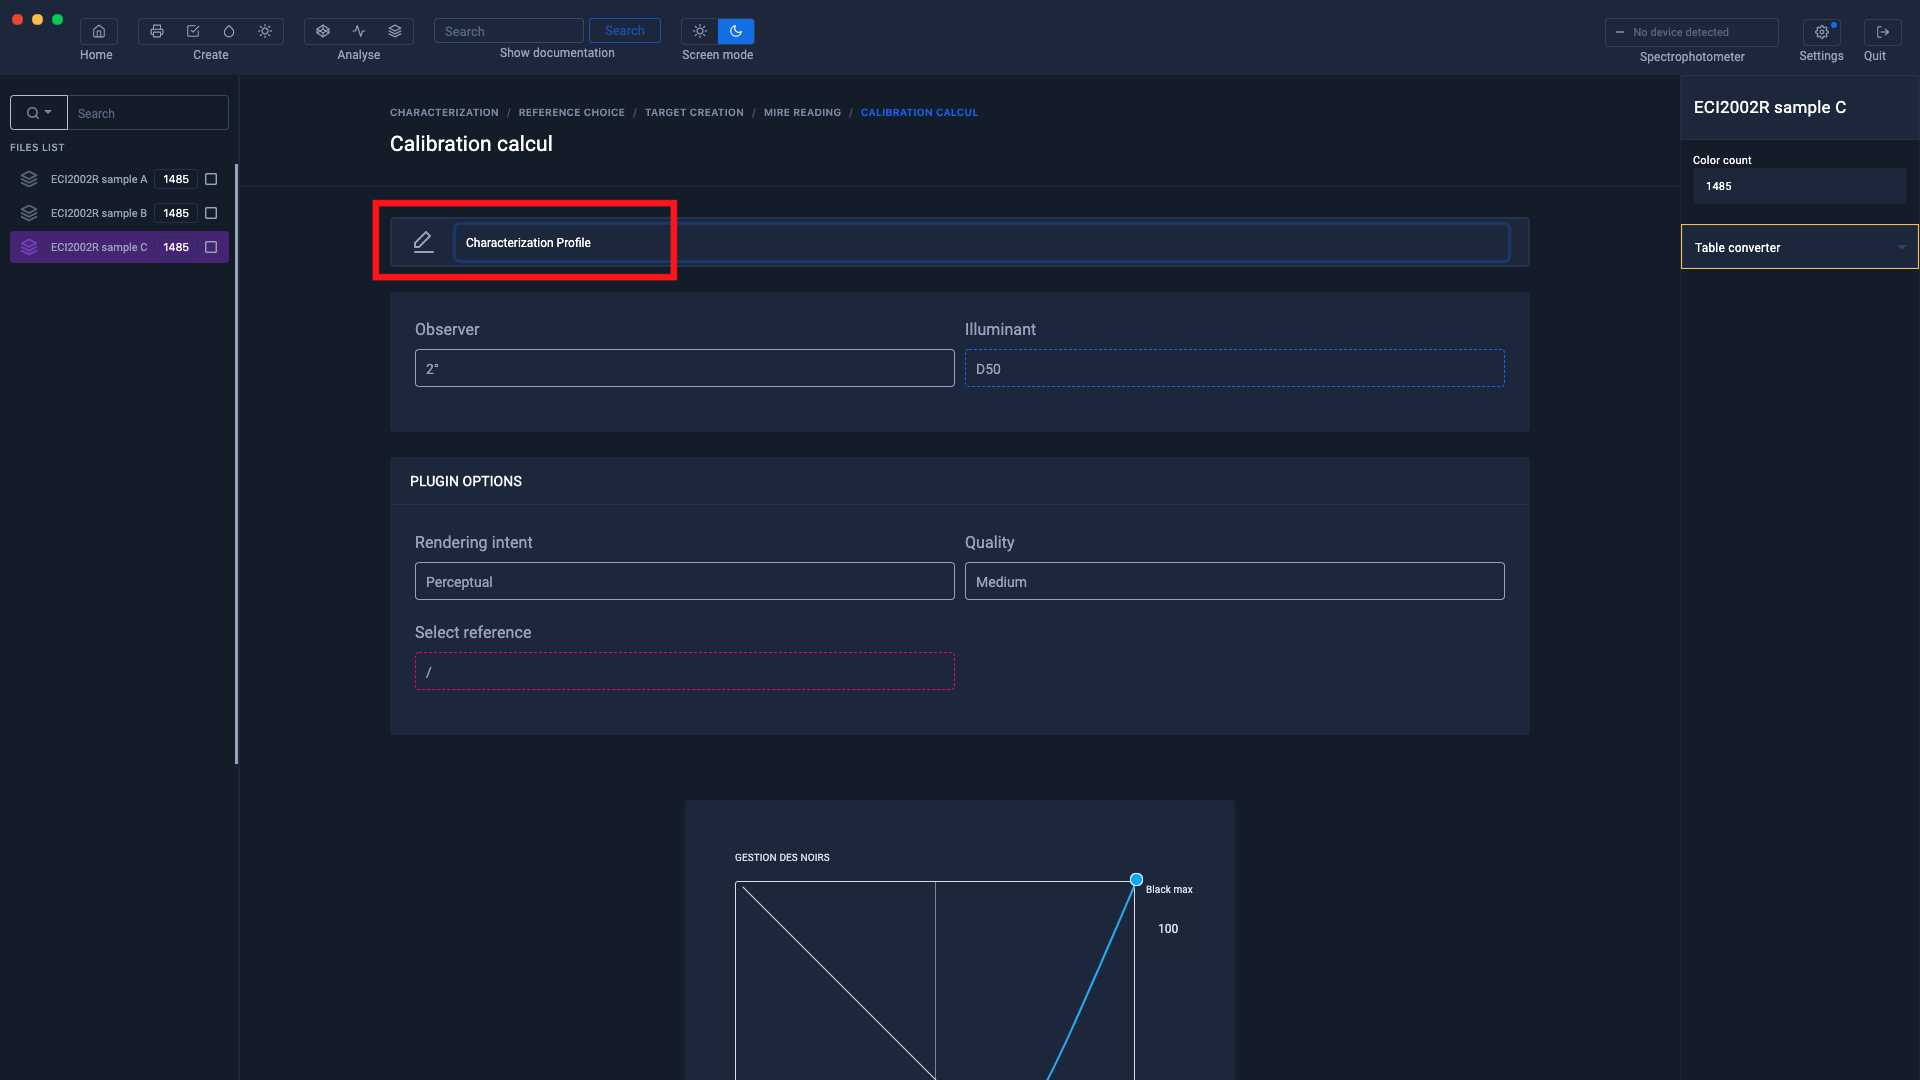
Once the profile parameters have been defined, click on the " Calculate profile " button
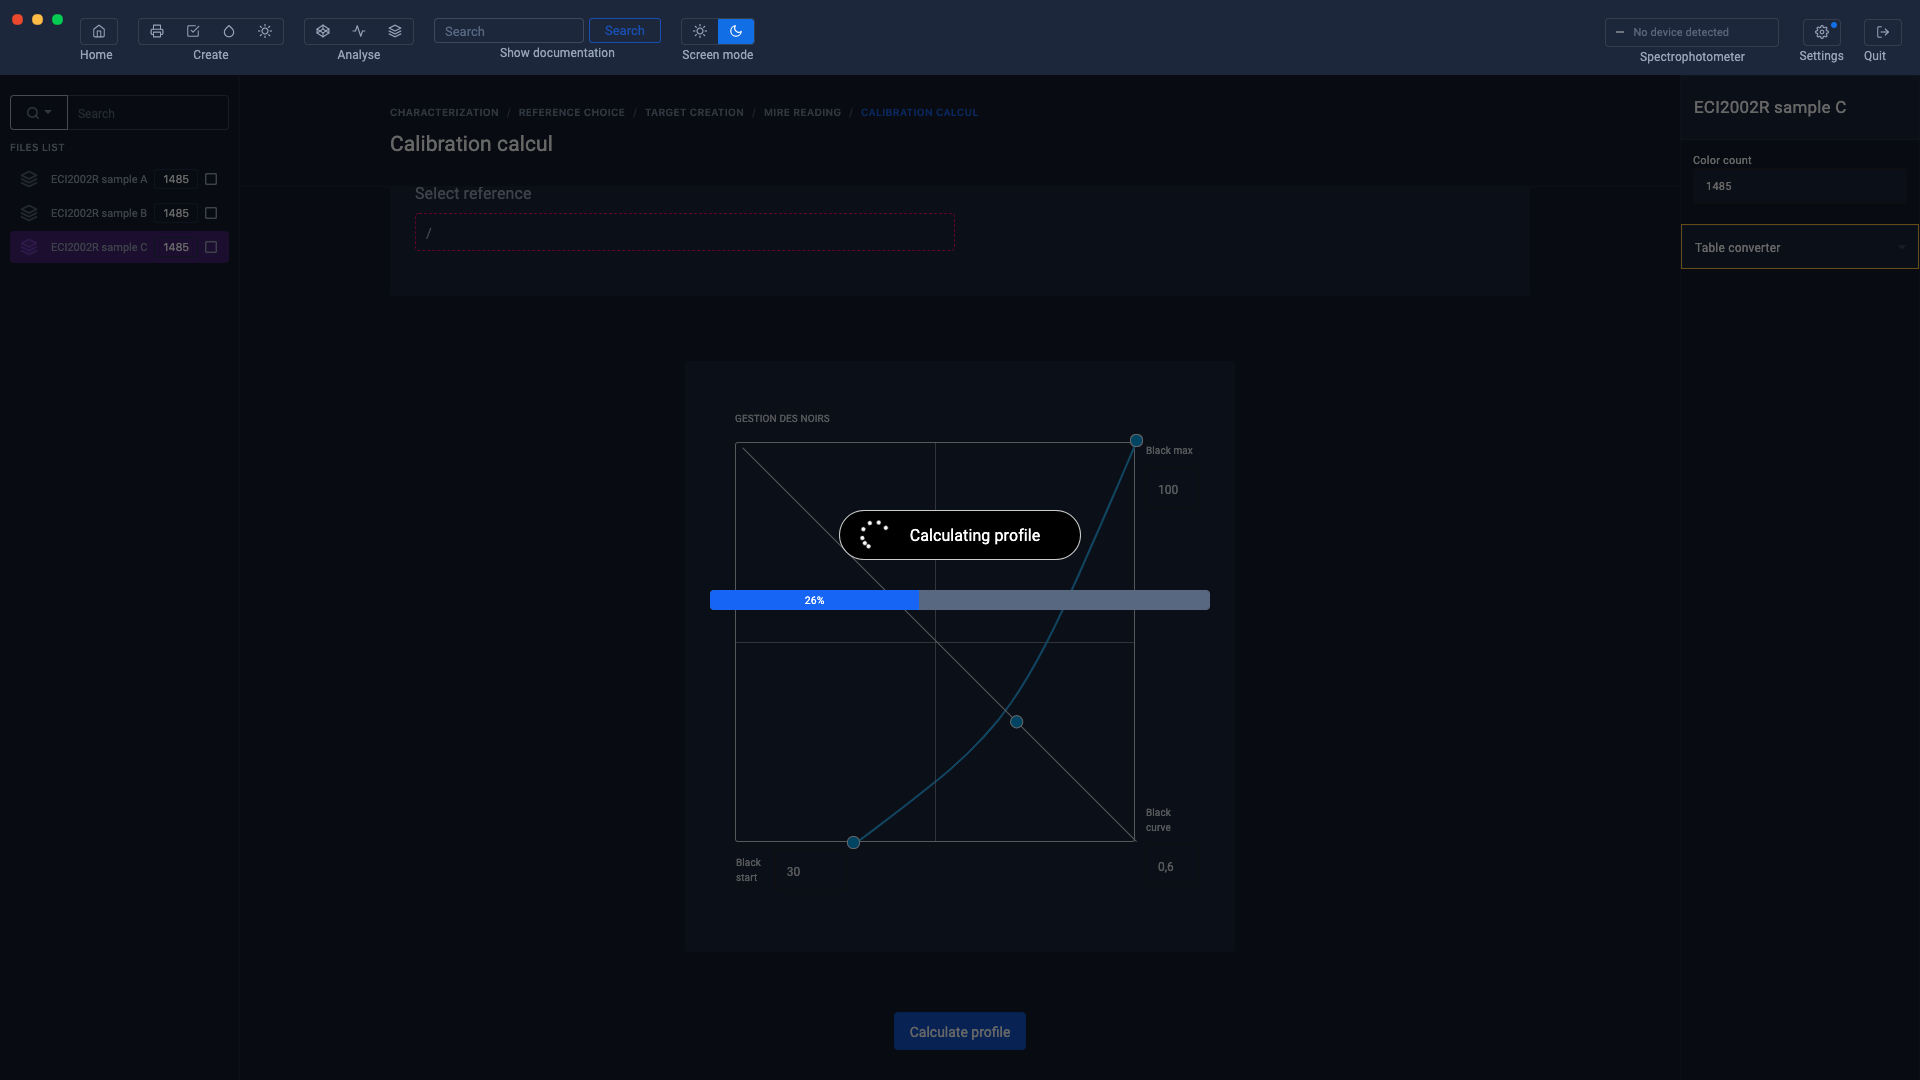
Profile calculation
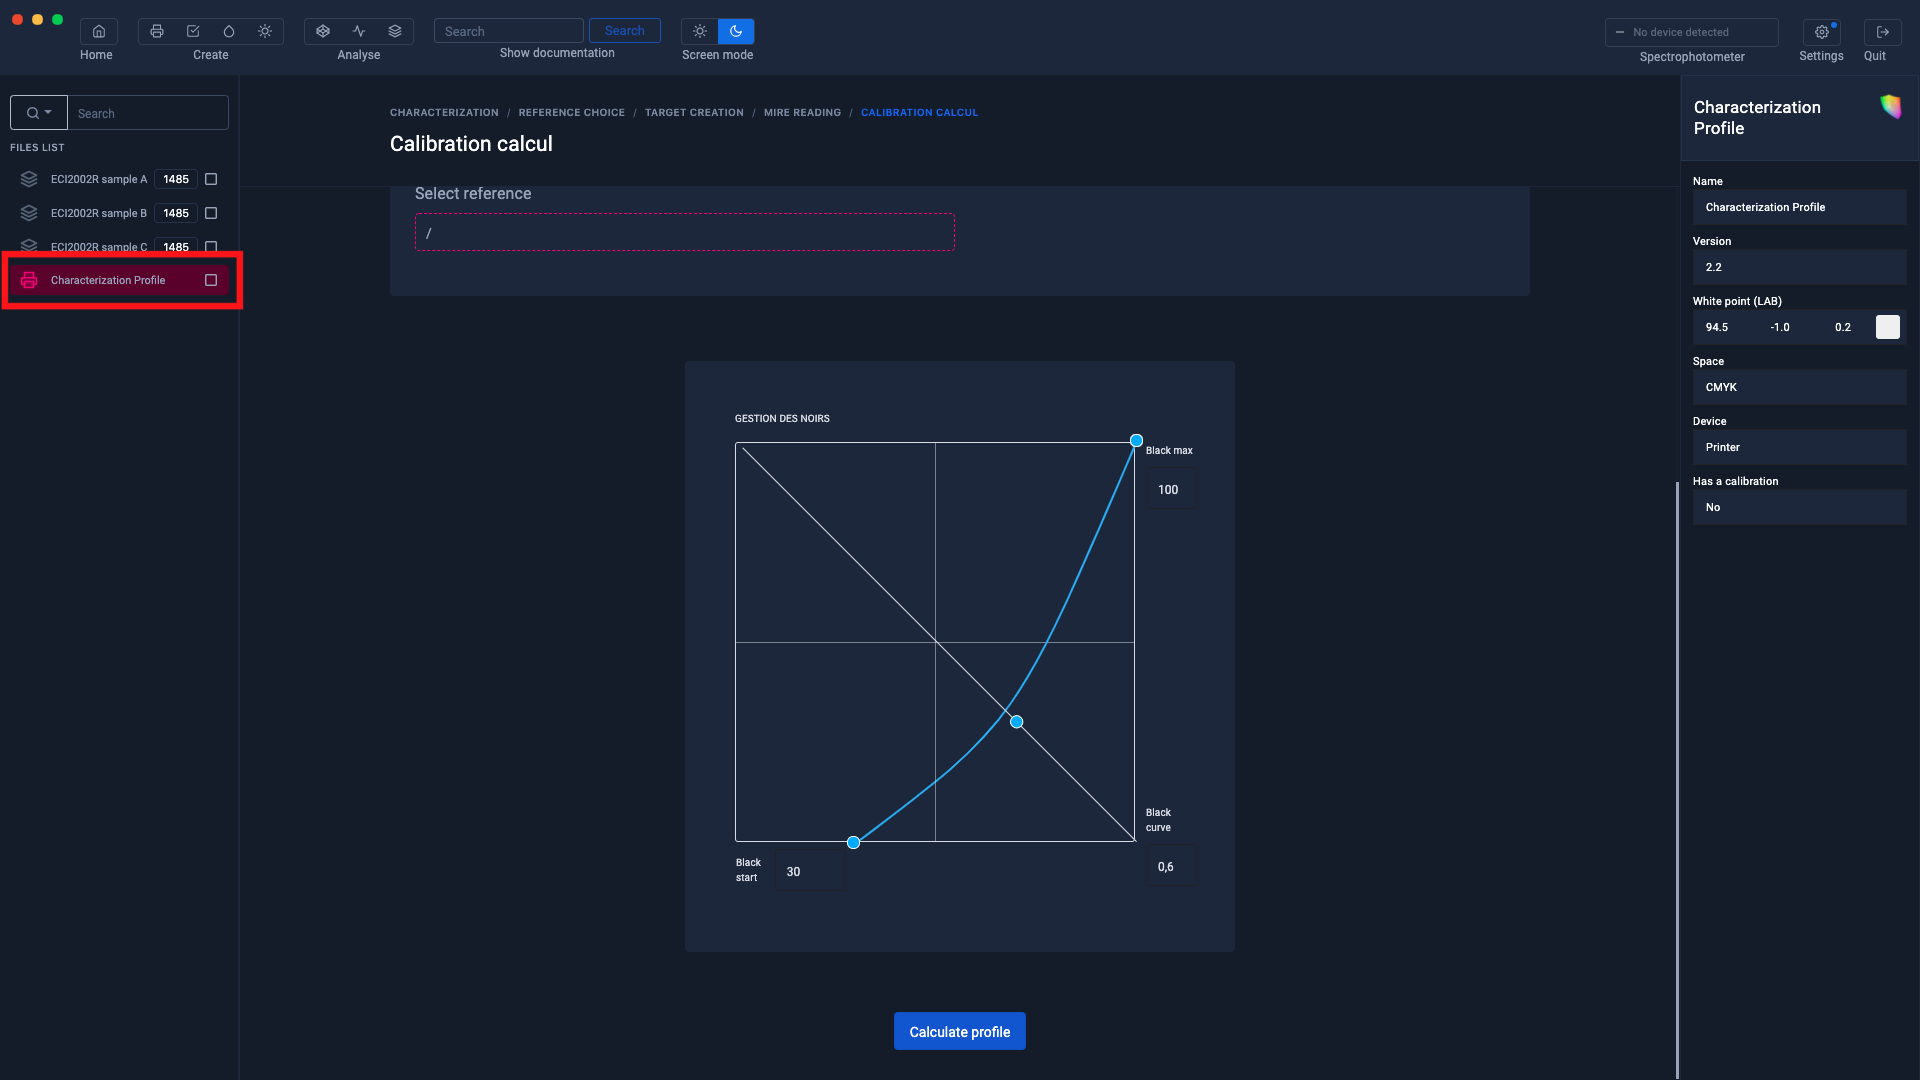
Once calculated, the profile will appear in the left column
A Preview in the Gamut Viewer will allow you to visually control the quality of your profile
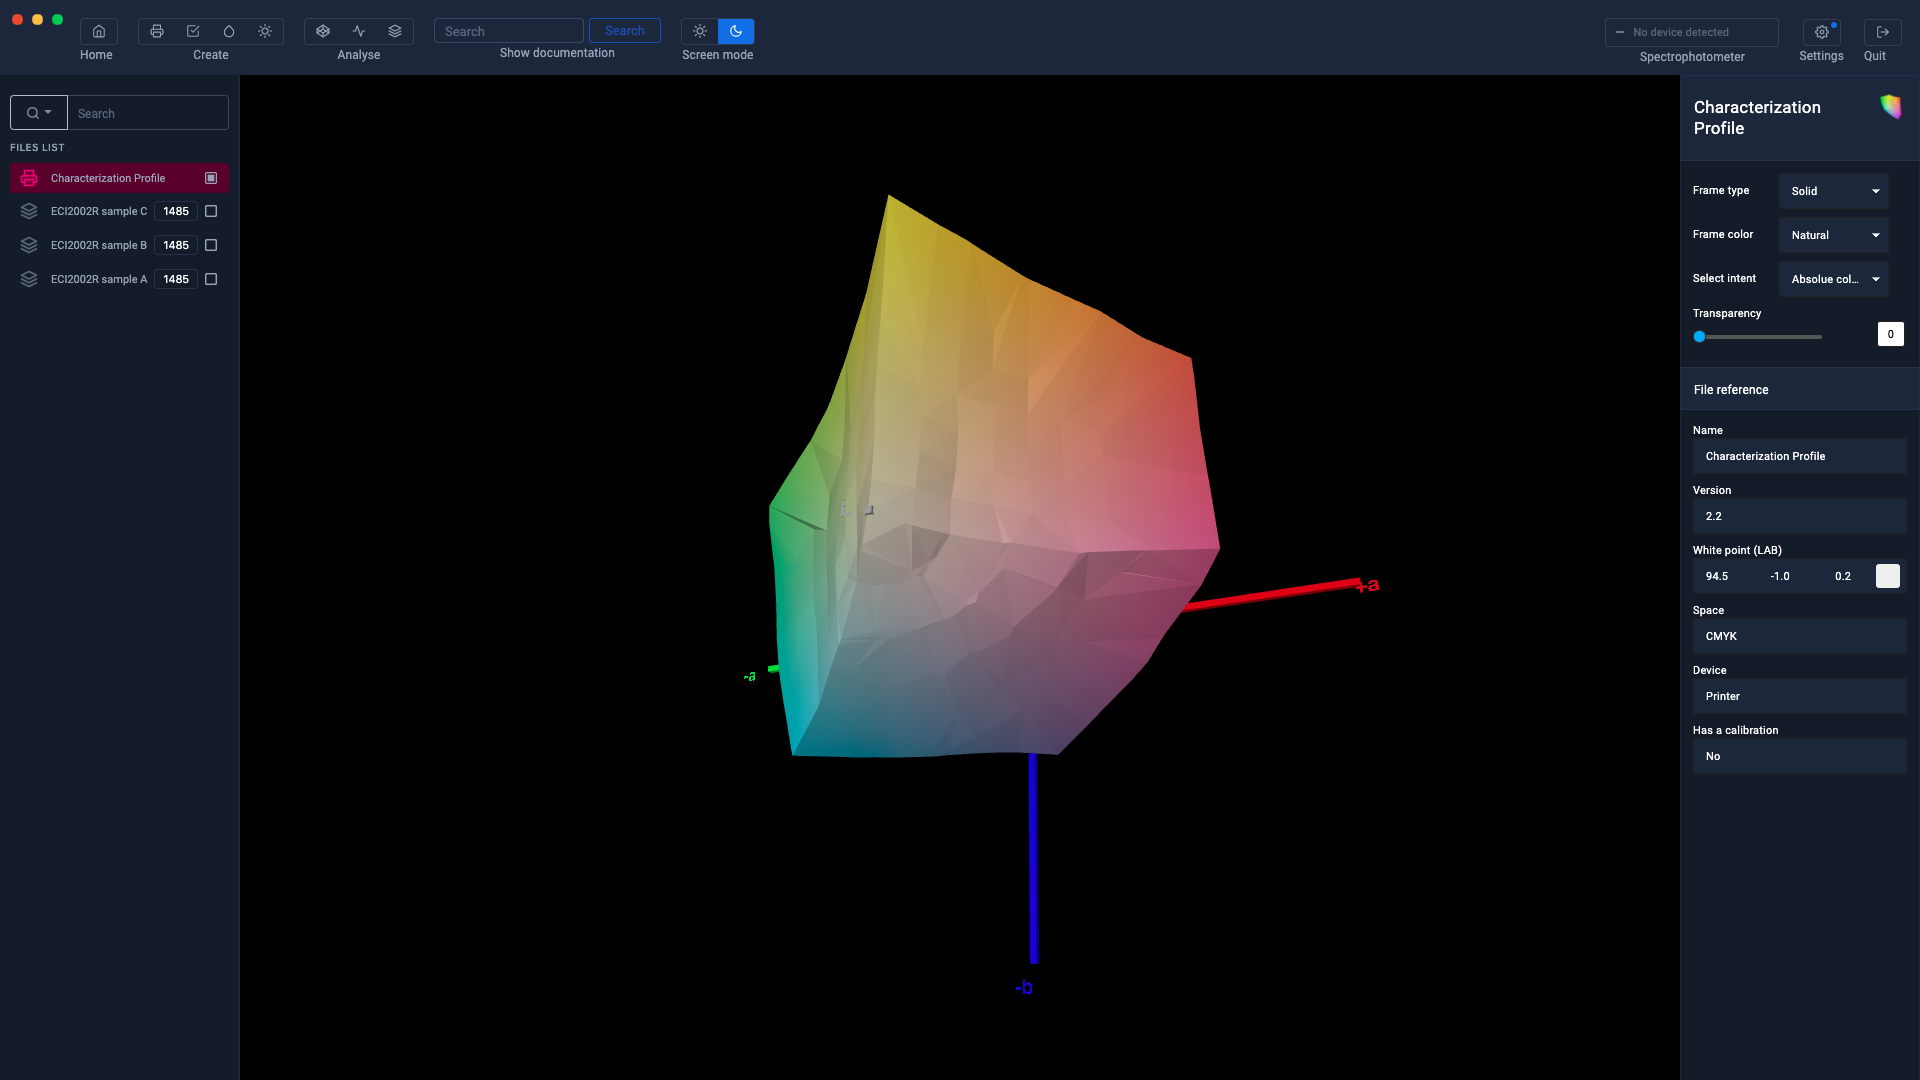
For more information, see the chapter: Gamut Viewer