Interface presentation
Before starting to use your Coraye software, we invite you to a presentation of its graphical interface.
Display areas
Coraye's graphical interface is structured in 6 areas, plus a menu bar.
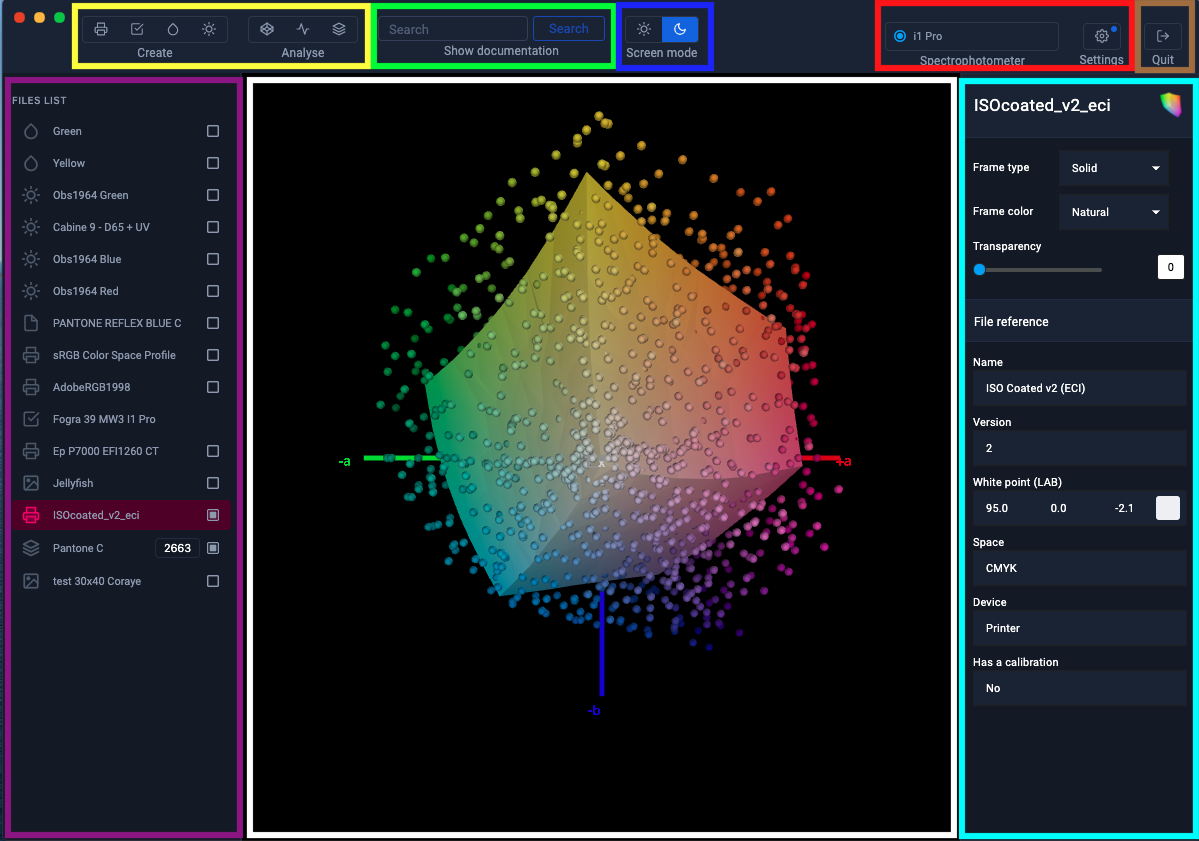
The Yellow zone (Creation and analysis tools)
This area is made up of seven pictograms associated with Coraye modules

From left to right we have:
Calibration & Characterization: 

This module is used to calibrate and characterize RGB or CMYK printing systems
For more information, see chapter: Calibration & Characterization
Print Control: 

- Control of CMYK Fogra & IDEAlliance proofs
- Creation of custom RGB & CMYK control ranges
- Control of printer stability
- Comparison between two test charts (for example IT8 or ECI)
- Tone control direct
For more information, see the chapter: Quality Control
Capture Color: 

For more information, see chapter: Capture a color
Capturing a light: 

For more information, see the chapter: Controlling an illuminant
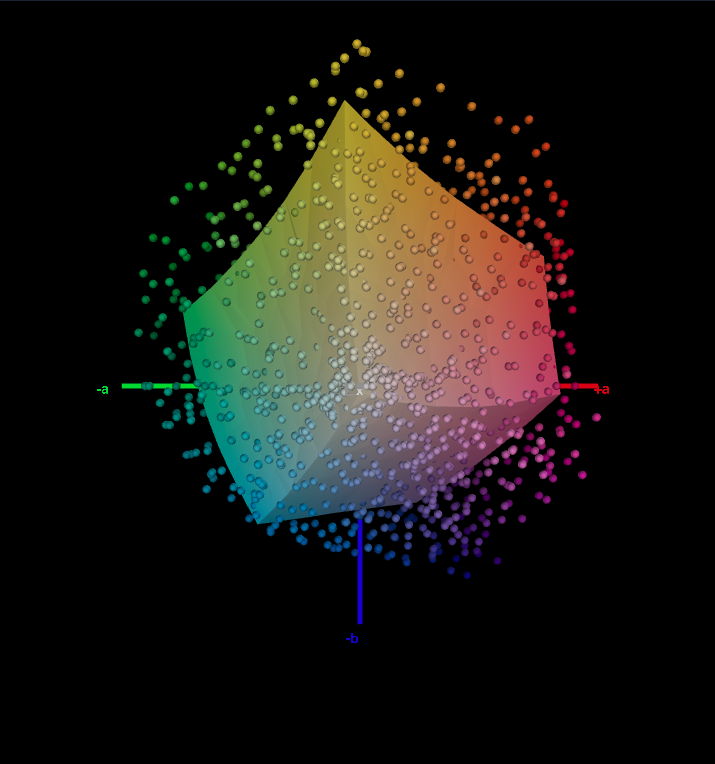
Gamut Viewer: 

- The measured samples
- The colors of a table (for example PANTONE, RAL, etc ...)
- The gamuts of the icc v2 profiles (does not support icc v4)
- The gamuts of the jpeg and Tiff images
- The training.
For more information, see the chapter: Gamut Viewer
Spectral Viewer: 

Another very fun module to display the reflectance curves of the measured colors and the spectral curves of the illuminants. This tool can be useful for:
- Analyzing the white of the papers - Analyzing the quality of light sources
- Analyzing the metamery between 2 measured samples and a light source.
- Training.
For more information, see chapter: Spectral Viewer
Color Table: 

The Color Table module is a major module of the Coraye solution. It allows to create, edit and convert color tables. These tables will then be useful for:
- Standardizing the color table exchanges between the software used by creatives (Adobe Suite or Coreldraw) and the software used by printers (RIP) for example.
- Carry out color research
- Create personalized test charts for printing control.
- Create personalized targets for characterization.
For more information, see chapter: Color tables
The Violet Zone (Files)
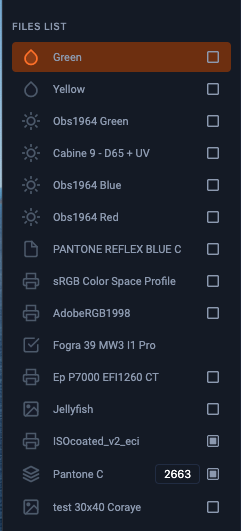
To use the files, just check the box, select or drag & drop the file depending on how it is used.
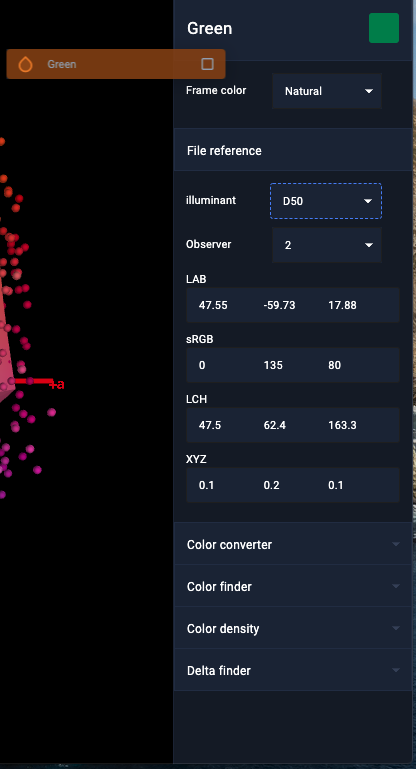
The Cyan area (Information relating to the selected file)
The White area (The central area for display)
This central zone displays the instructions during the procedures (Calibration, quality control, measurement, etc.), the color tables and the graphic representations of the Gamut Viewer and Spectral Viewer modules.
The Green Zone (Online help)
Thanks to the keywords written in this search bar, you can access our online tutorials directly from your Coraye software.

The Red zone (Device and plugins management)
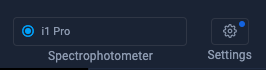
To find out more, see the chapter: Installing and managing plugins
Added to this is :
The Blue area (Display mode)
Personalize your display by choosing between dark mode and light mode.

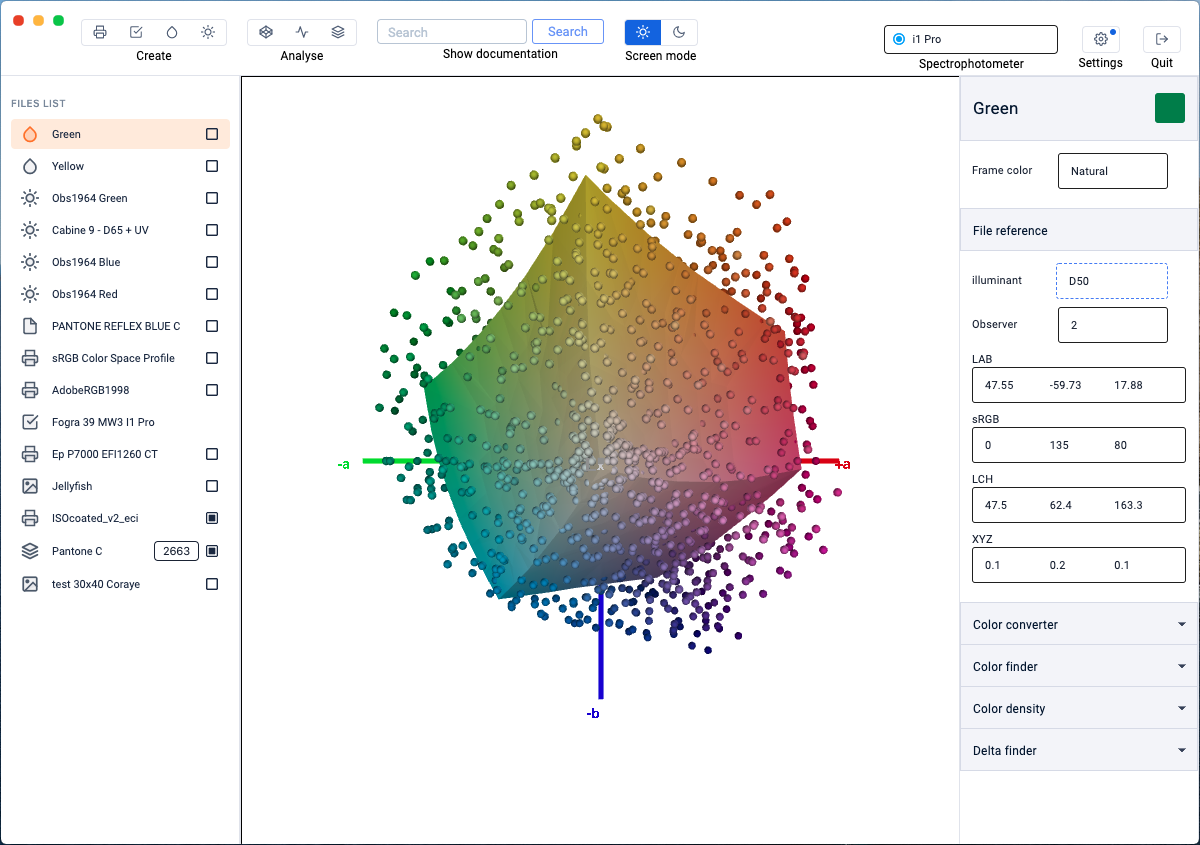 Clear mode
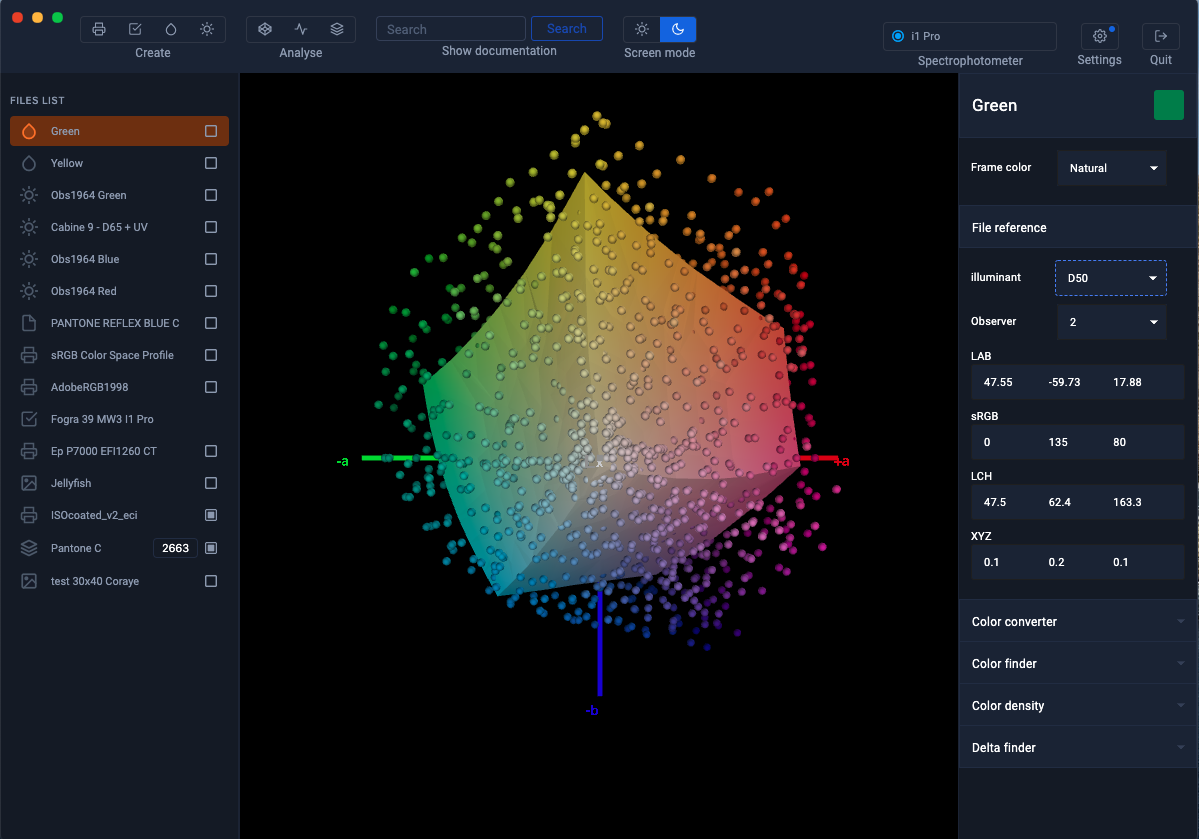 Dark mode
The Brown Zone (Logoff)
By clicking on the " Quit " button you quit the software by disconnecting, to find yourself on the connection page.
To restart the software, you must use the Email address and the password associated with your license and be connected to the Internet.


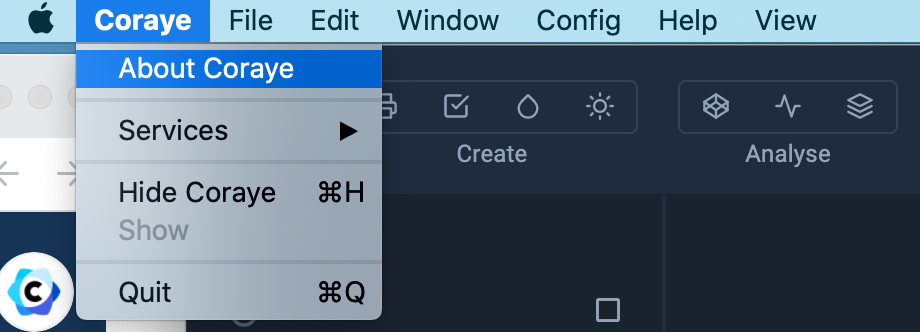
Menu bar
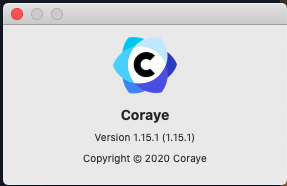
Coraye menu> About Coraye
Version display
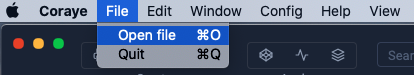
File menu
The " Open file " option allows the import of files compatible with the Coraye software.
The " Quit " option closes the Coraye software without logging out.
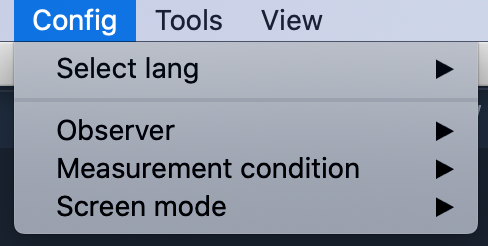
Config menu
Display of submenus
- Languages - Observer
- Illumination
- Screen mode
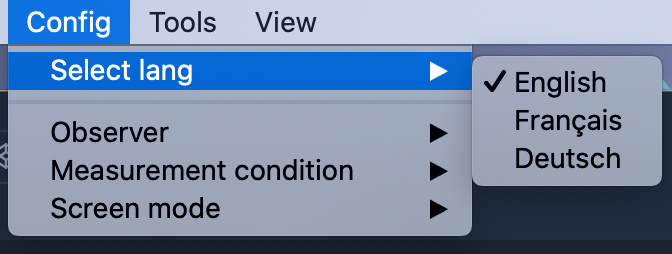
Config menu> Select lang
Coraye is available in 3 languages
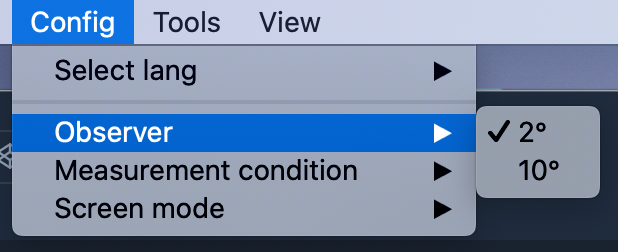
Config menu> Observe
The standard observer depends on another factor which is the angle of observation or the field of view. Two values were retained by the CIE (2 ° and 10 °). Observe 2 ° is used in the field of printing where the color is looked at closely (ex: magazine)
Observe 10 ° is used in the industrial field where the color is looked at from afar (ex: car)
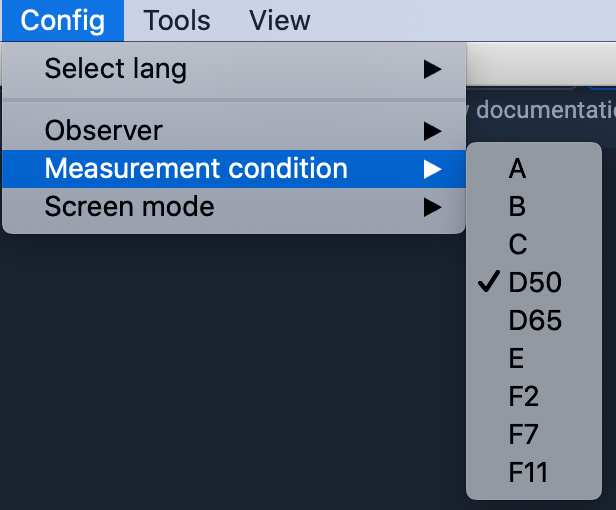
Config menu> Measurement condition
This option allows you to define the default value of the illuminant that will be used when calculating the icc profiles.
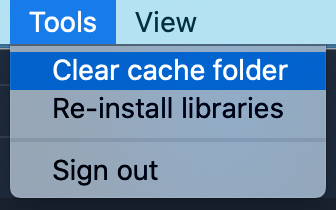
Help menu
Help menu> Clear cache folder
This option allows you to delete all the files located in the left column.