Creation of a printable color chart in RGB mode
Here is how with a few clicks it is possible to convert a spot color swatch to a printable RGB swatch.
Introduction
In our example we will use a Pantone TCX color chart (not supplied with the Coraye software) and convert it with the Adobe RGB1998.icc RGB profile.
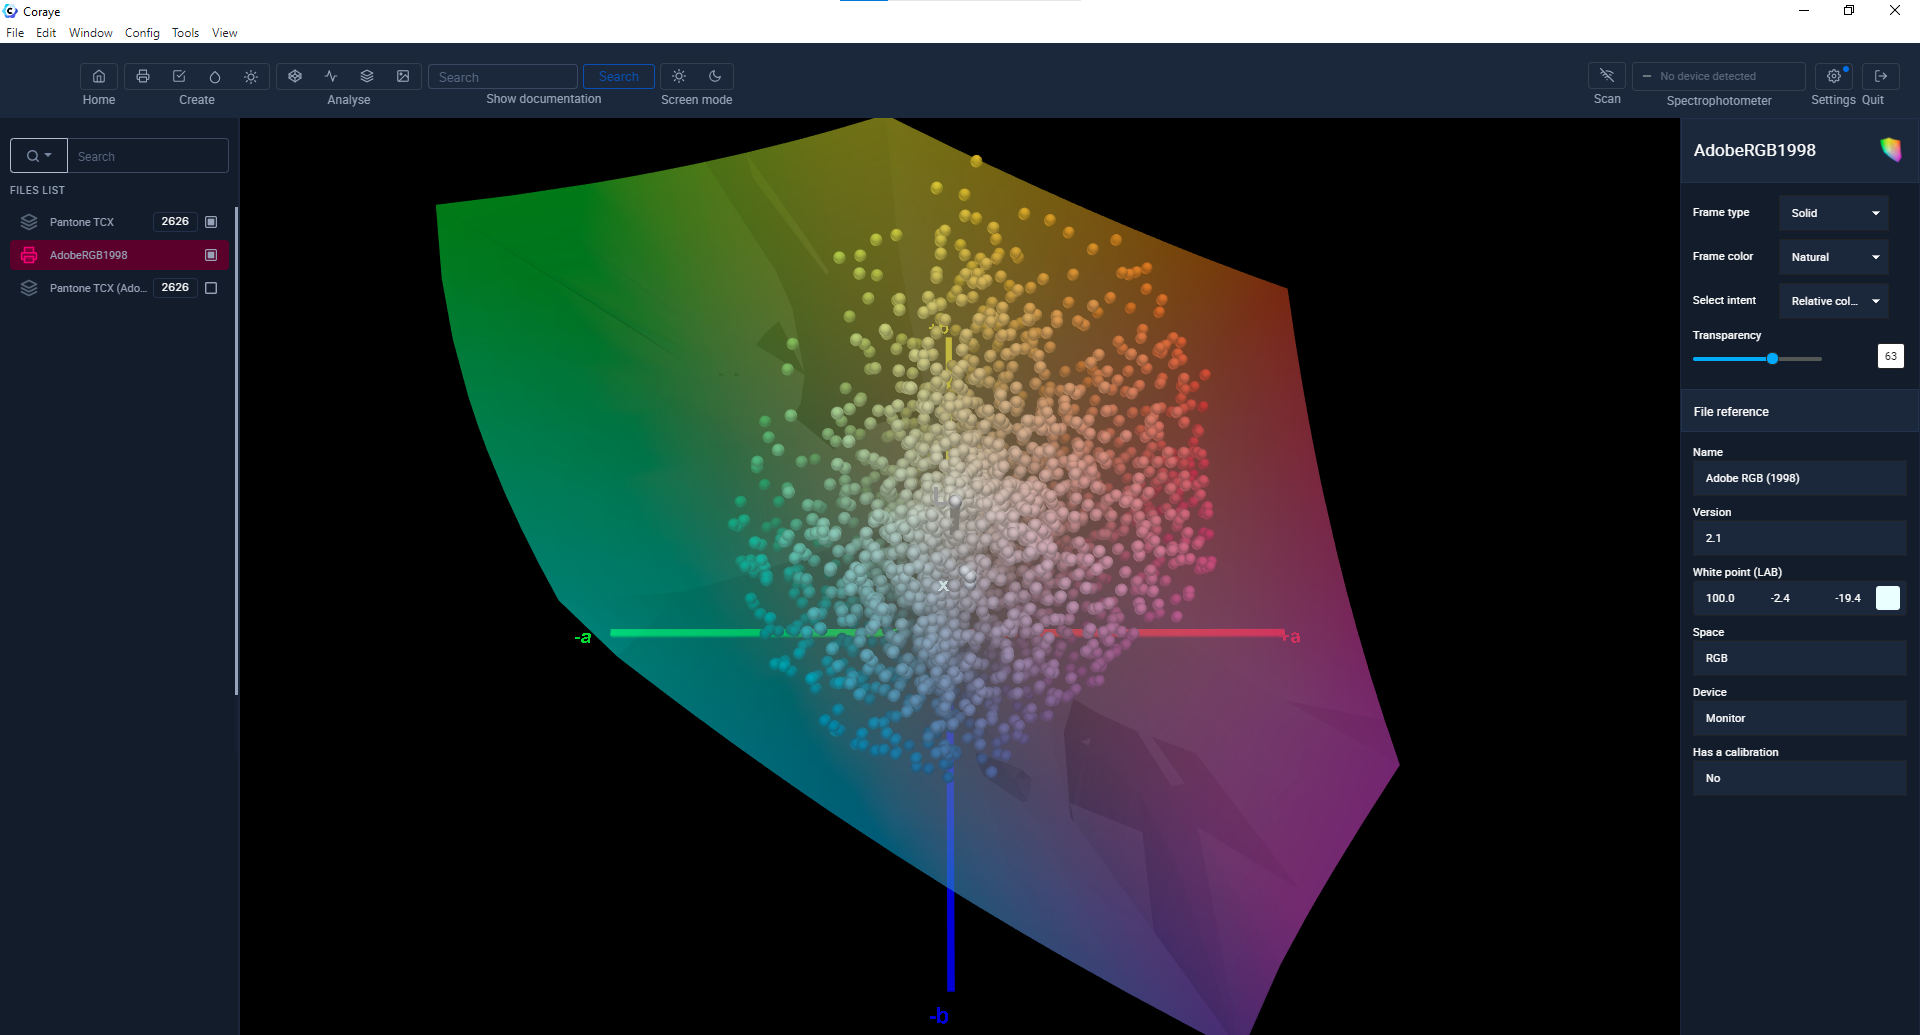
But first of all, let's compare the gamut of this PANTONE TCX color chart with the Adobe RGB 1998 profile.
We can see that all the colors in the color chart are contained in the reference space of Adobe RGB 1998.icc.
On the other hand, if we compare the PANTONE TCX color chart with the colors that an Epson SC-F10000 sublimation is able to reproduce on a polyester fabric, we can see that some colors of the pantonier are not reproducible.
Note: The media profile used is one of the textile profiles supplied in the Epson Edge RIP of the Epson SC-F10000 printer
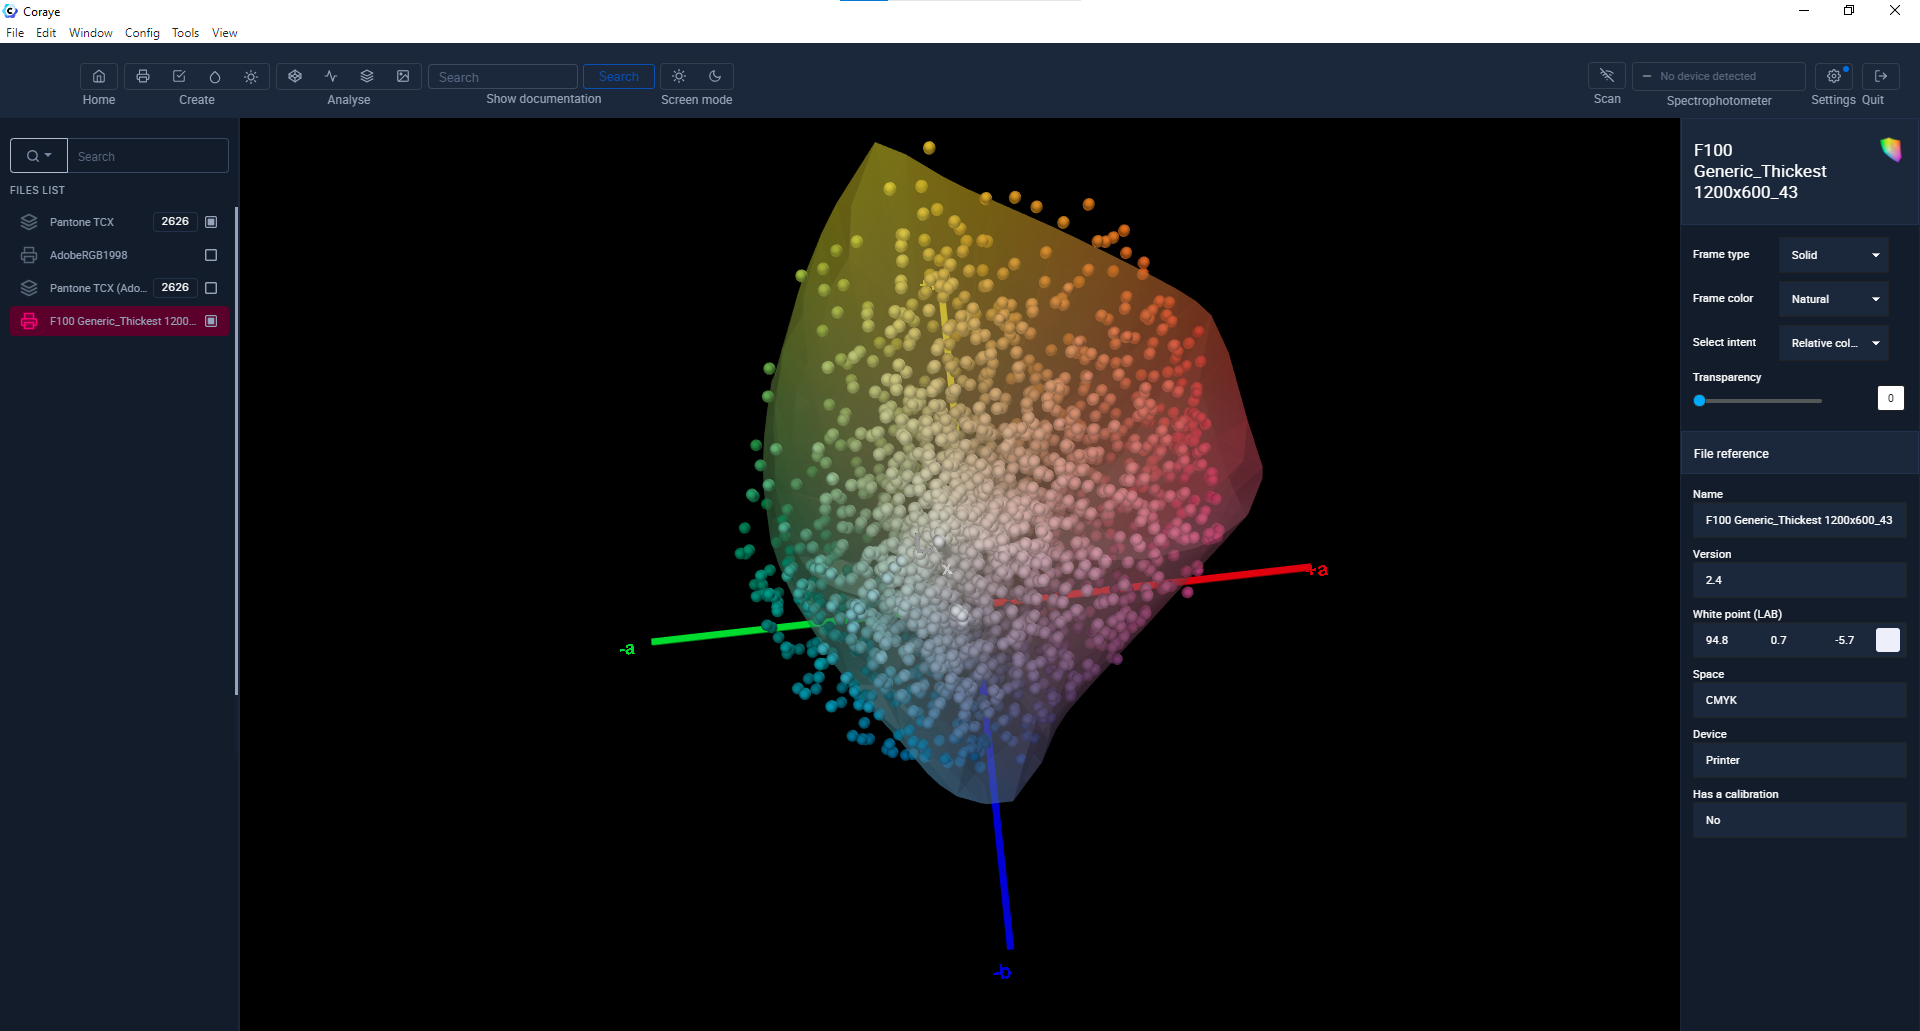 Comparison of the media profile of an Epson SC-F10000 with a PANTONE TCX color chart
So if your printing software does not support spot colors or if you use a simple driver to print, it may be useful to convert your color chart and print it to know the RGB values you should use to obtain the color you want to reproduce in the final print.
Importing the PANTONE TCX file and the Adobe RGB 1998.icc profile into Coraye
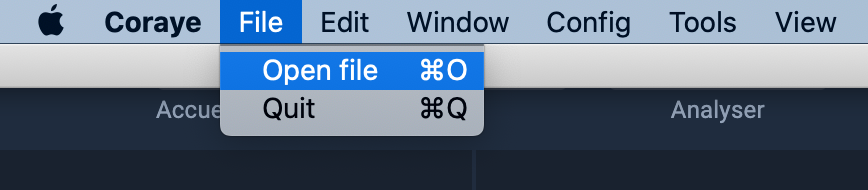
Select the Adobe RGB 1998.icc profile and the Pantone TCX color table that you can get from the PANTONE website if you have purchased the paper color chart.
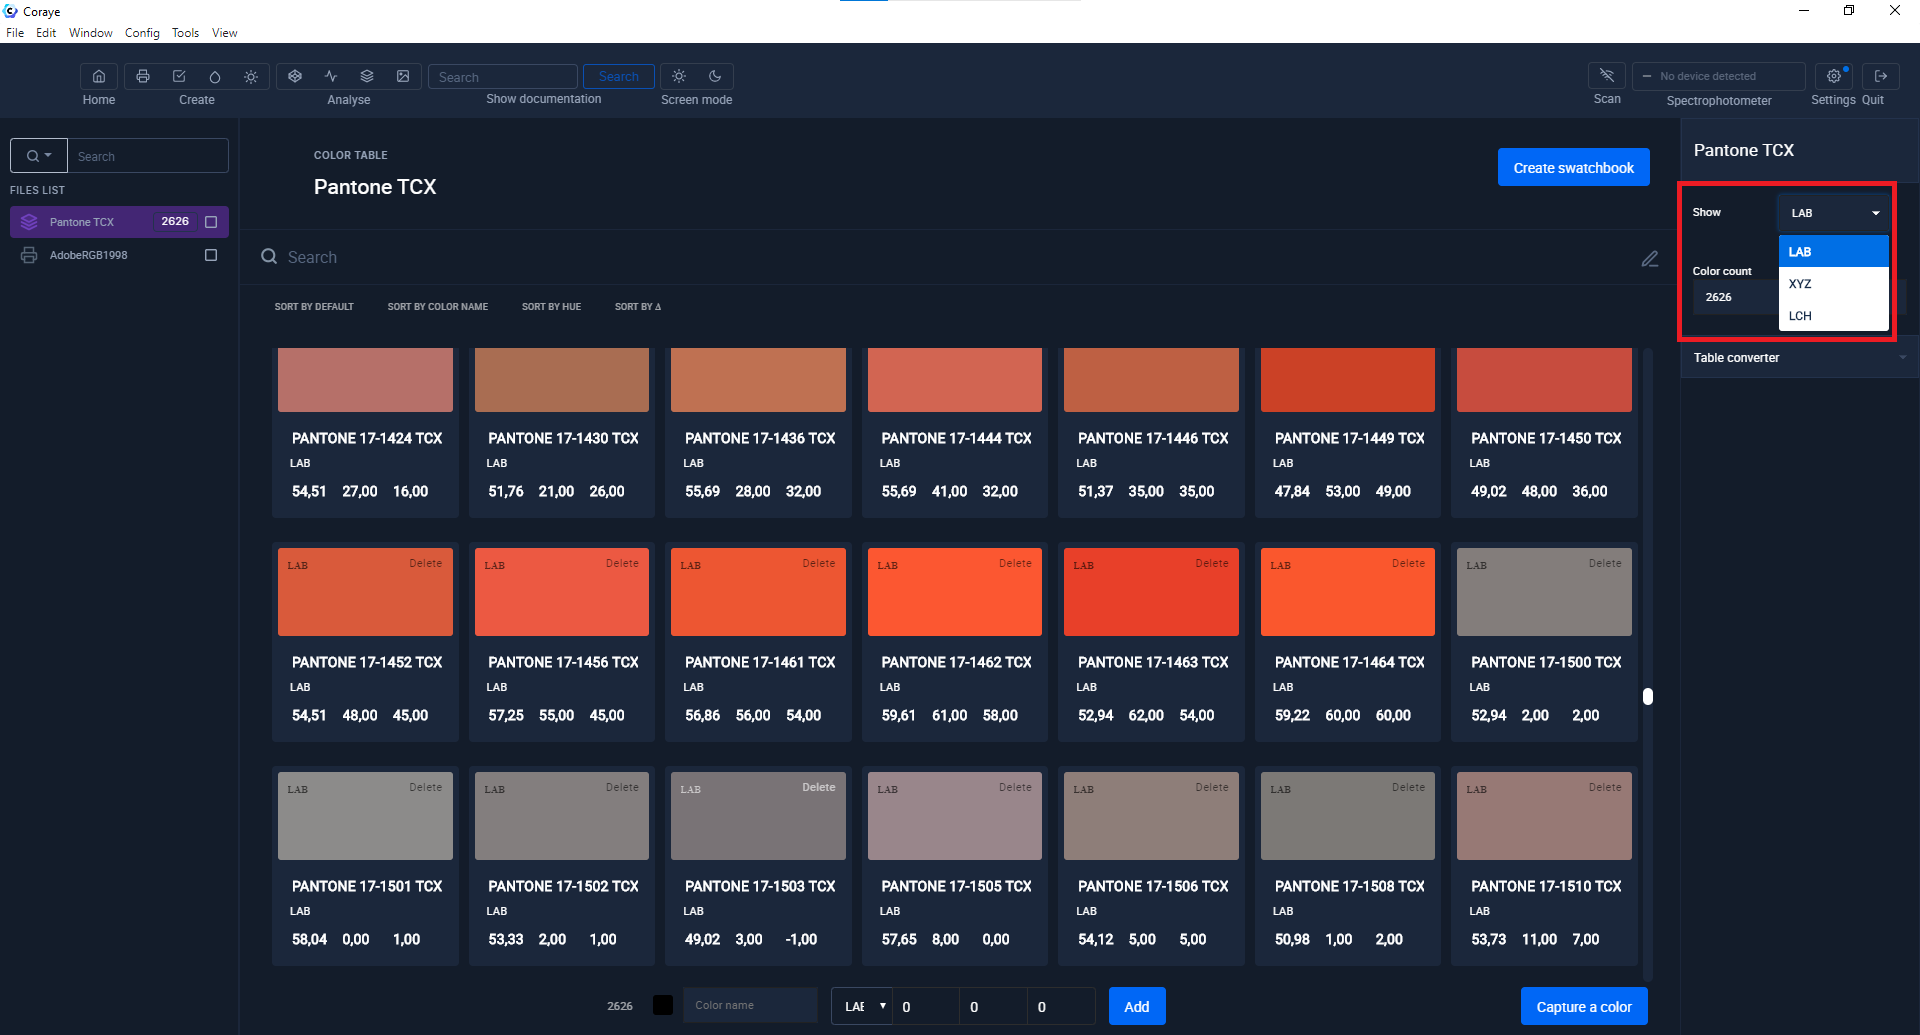
In the Coraye Color Table module, you can visualize the Lab, XYZ and Lch values of each of the colors in the color chart, but not yet the RGB values, because remember, the RGB values are dependent on the RGB profile that we are going to use .
Converting Colors from Swatches to RGB
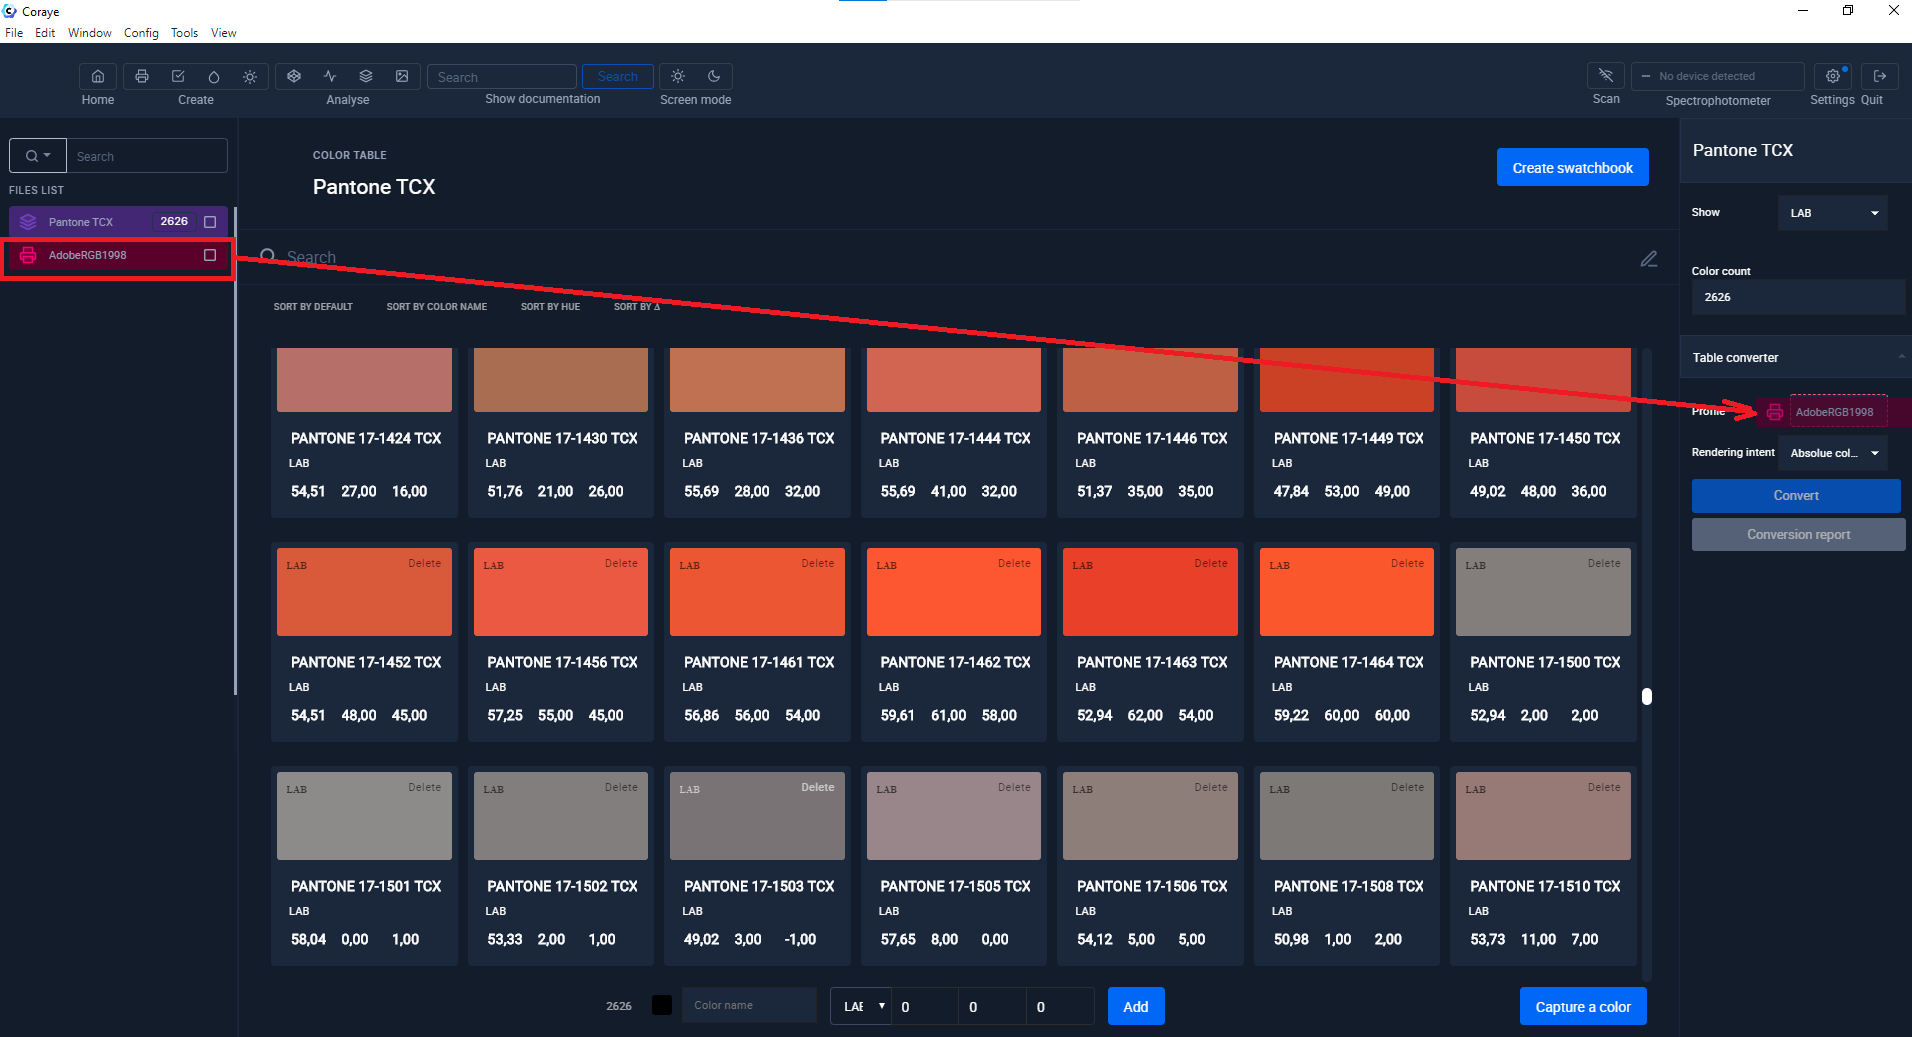
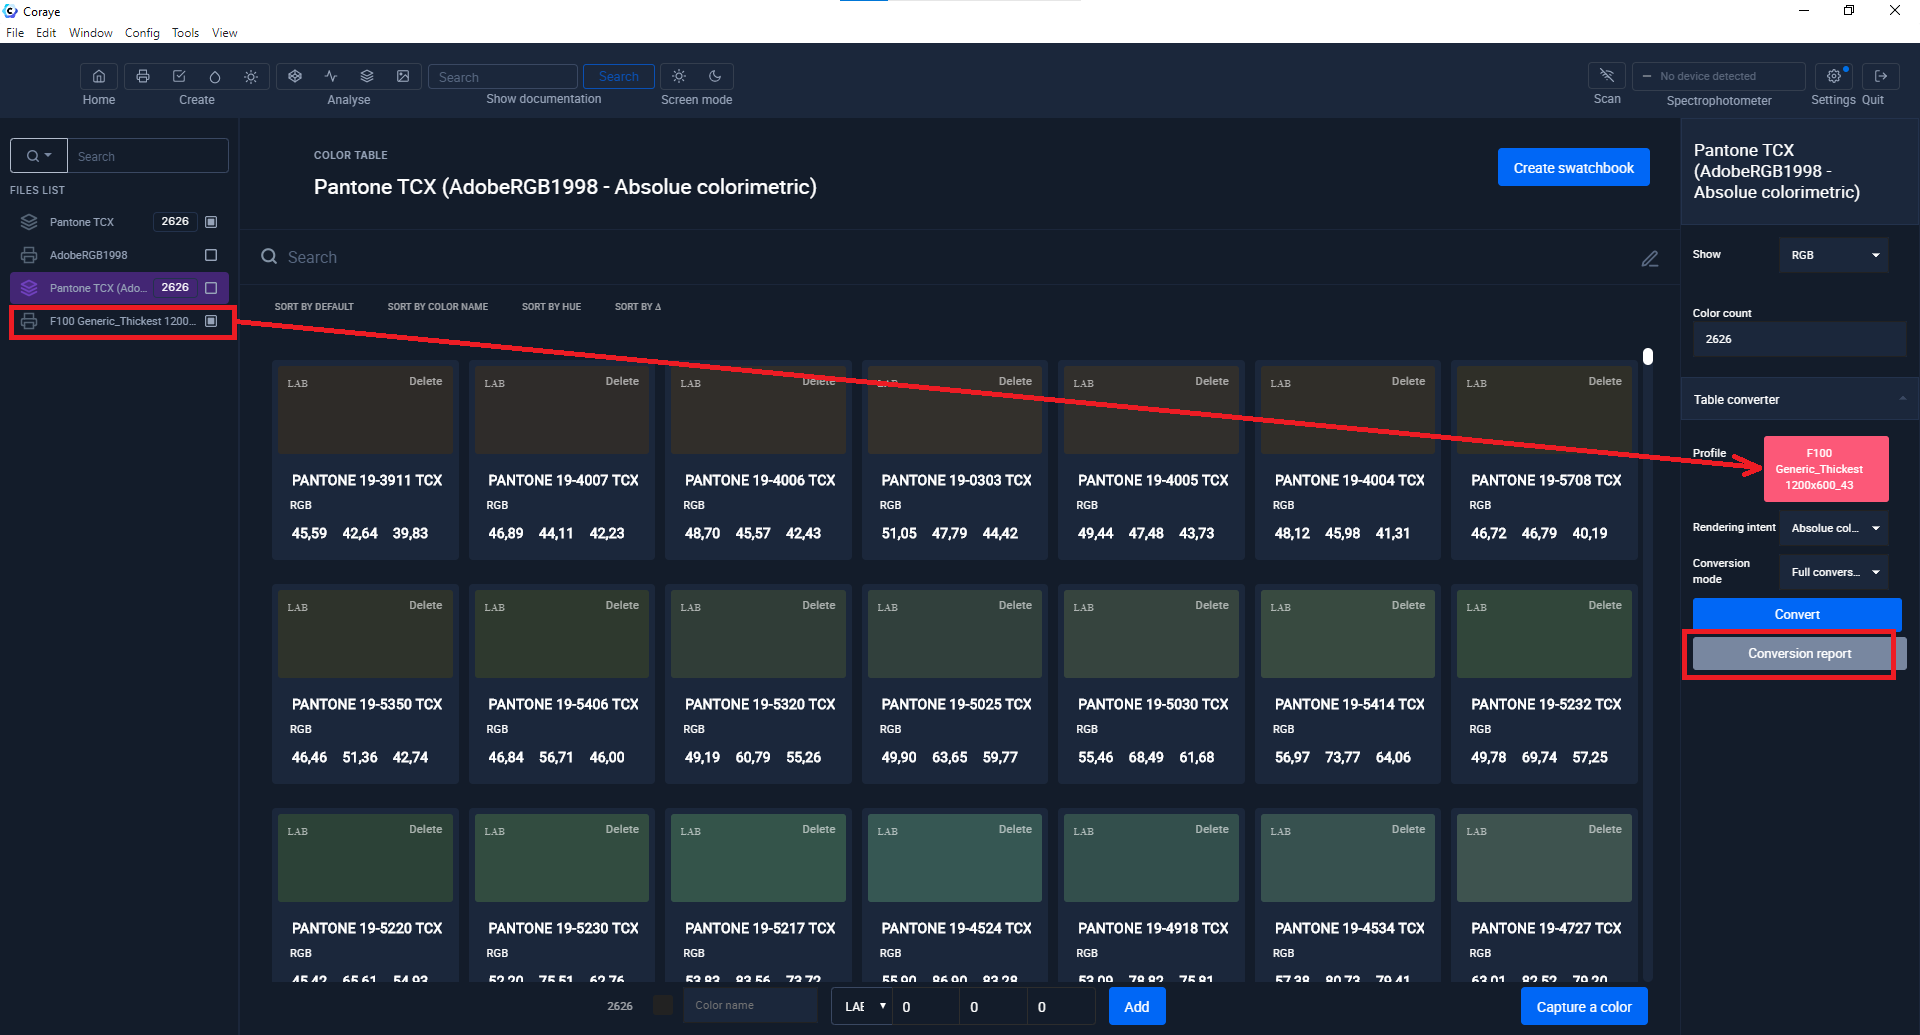
Select the color chart in the left column
Click on the "Table converter" tab in the right column
Drag the Adobe RGB 1998.icc profile located in the left column and drag it into the "Profile" space located in the column of right.
Click the "Convert" button
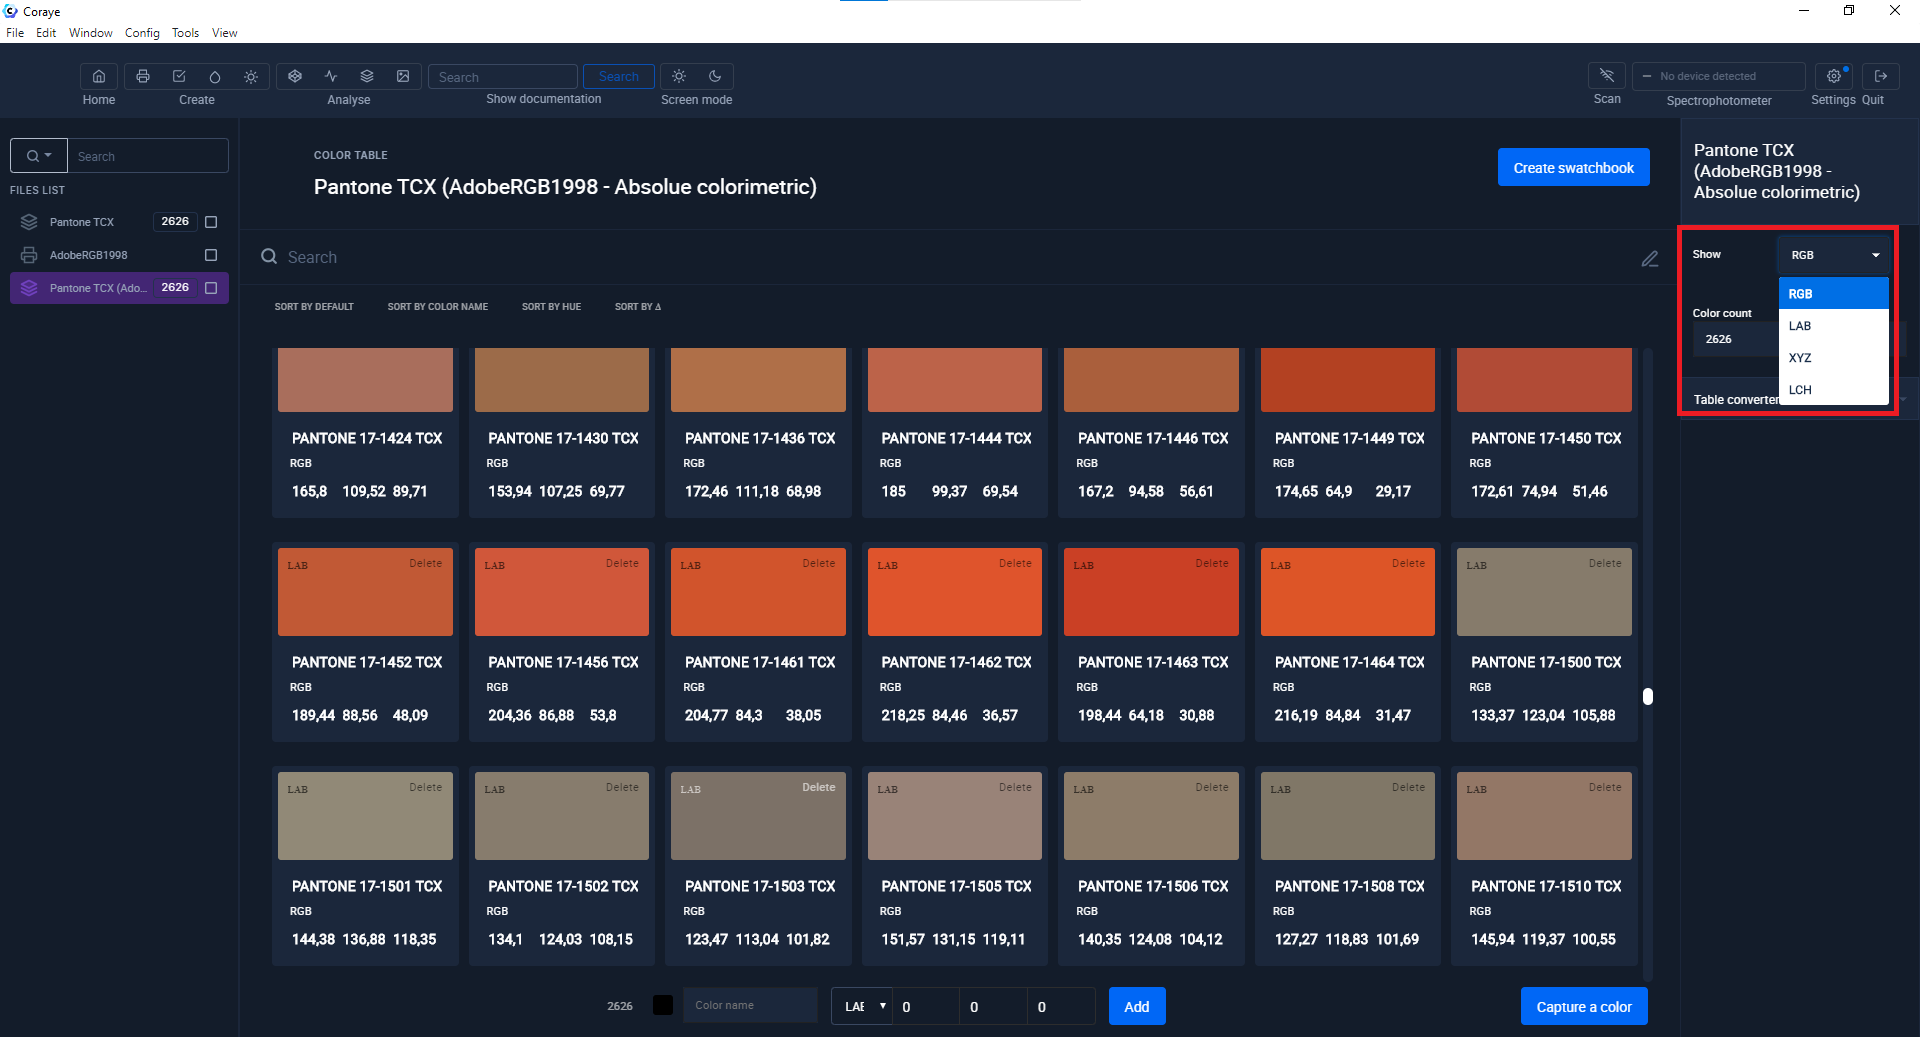
A new color table will appear in the left column, this one will contain the Lab, Lch, XYZ values and the RGB values of the colors converted with the Adobe RGB 1998 profile .icc
Note that if your workspace was another profile (such as sRGB.icc for example) you would have had to use this other profile to convert the table and the RGB values would have been different.
Creating a report containing the RGB values
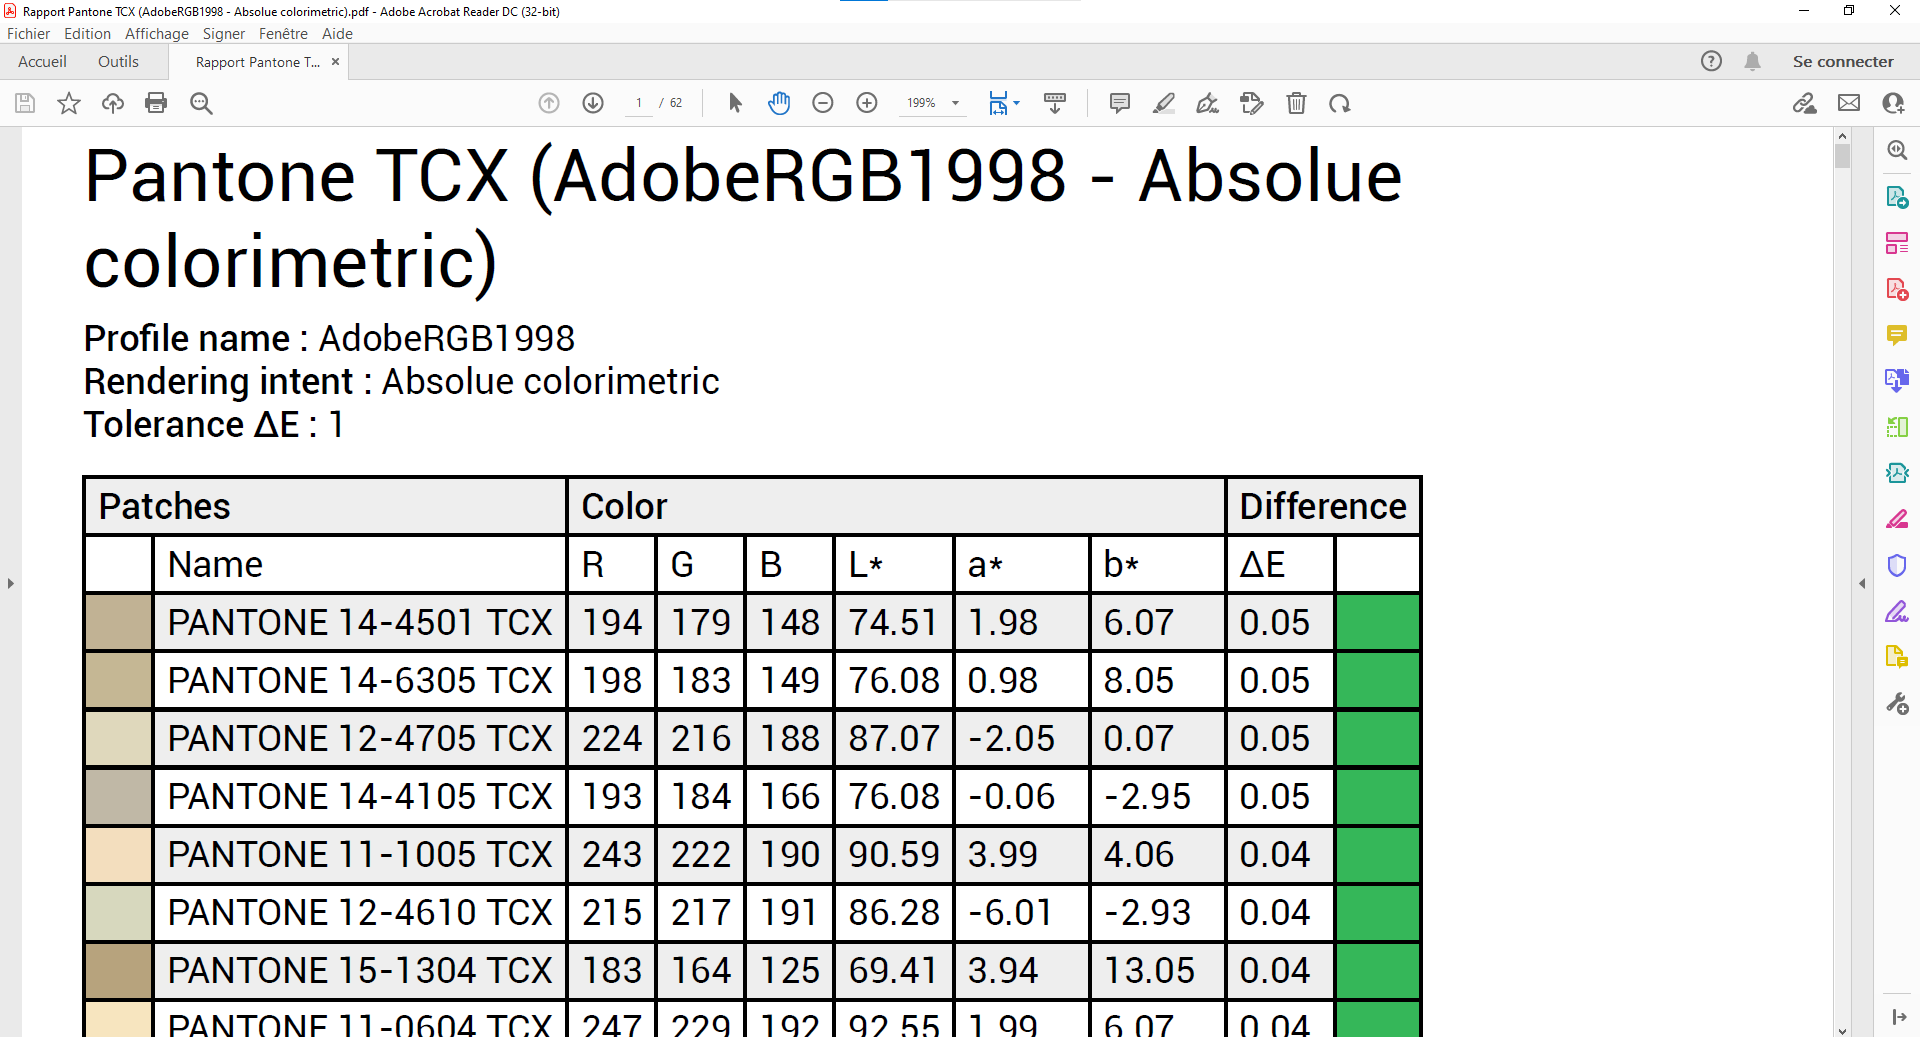
Before clicking on the "Convert" button, you can create a conversion report containing the Lab and RGB values of each of the colors in the color chart.
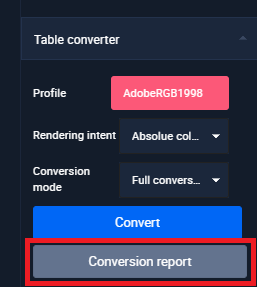
When the report appears, click on the "PDF REPORT" button
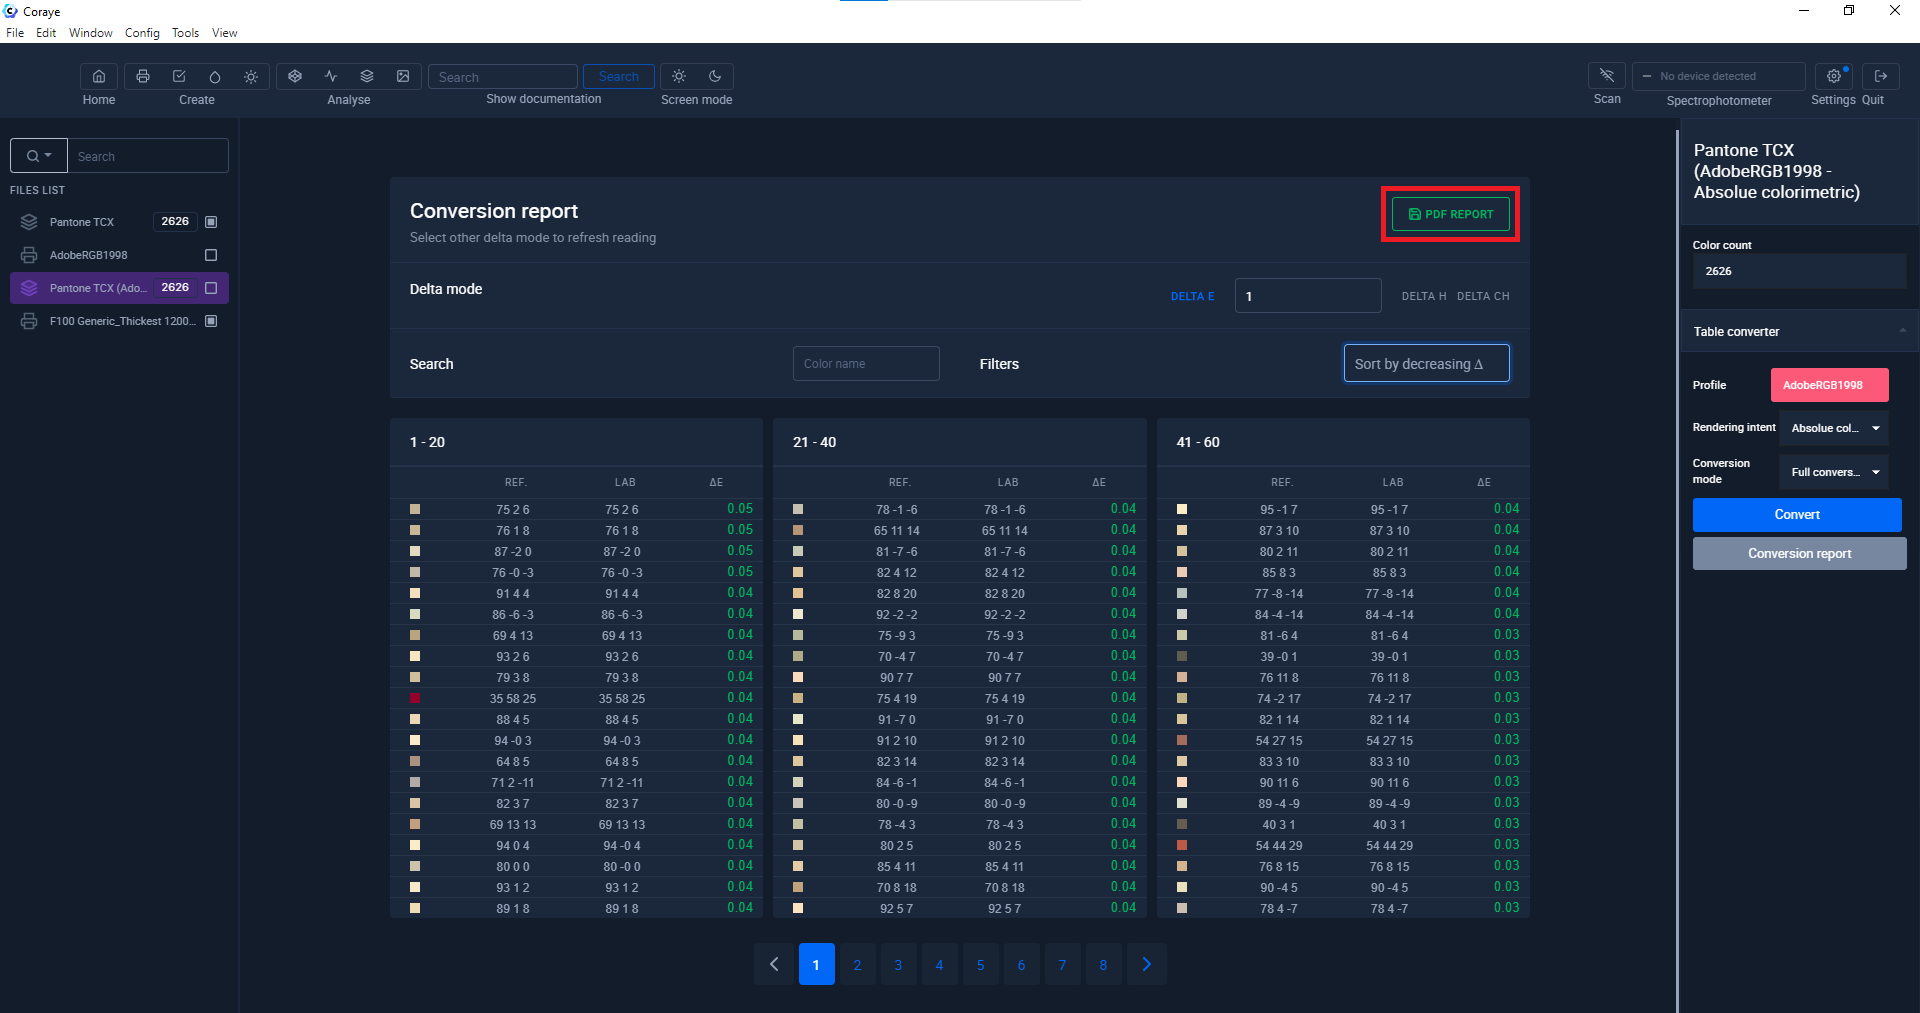
You can retrieve the list of colors from the color chart in RGB and Lab to give it to designers
Creation of a printable color chart
Before creating this color chart, you have the possibility to sort the colors of the color chart
To find out more, see chapter: Sorting table colors
Select the swatch containing the RGB values and right click to select "Create Swatchbook"
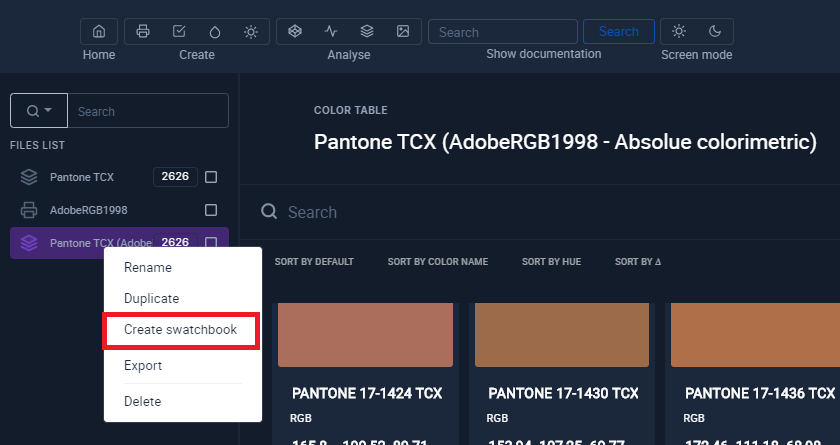
In our example, we will choose to create a color chart in the form of a table
For more information, see the chapter: Create a printable color chart
Display of sample values
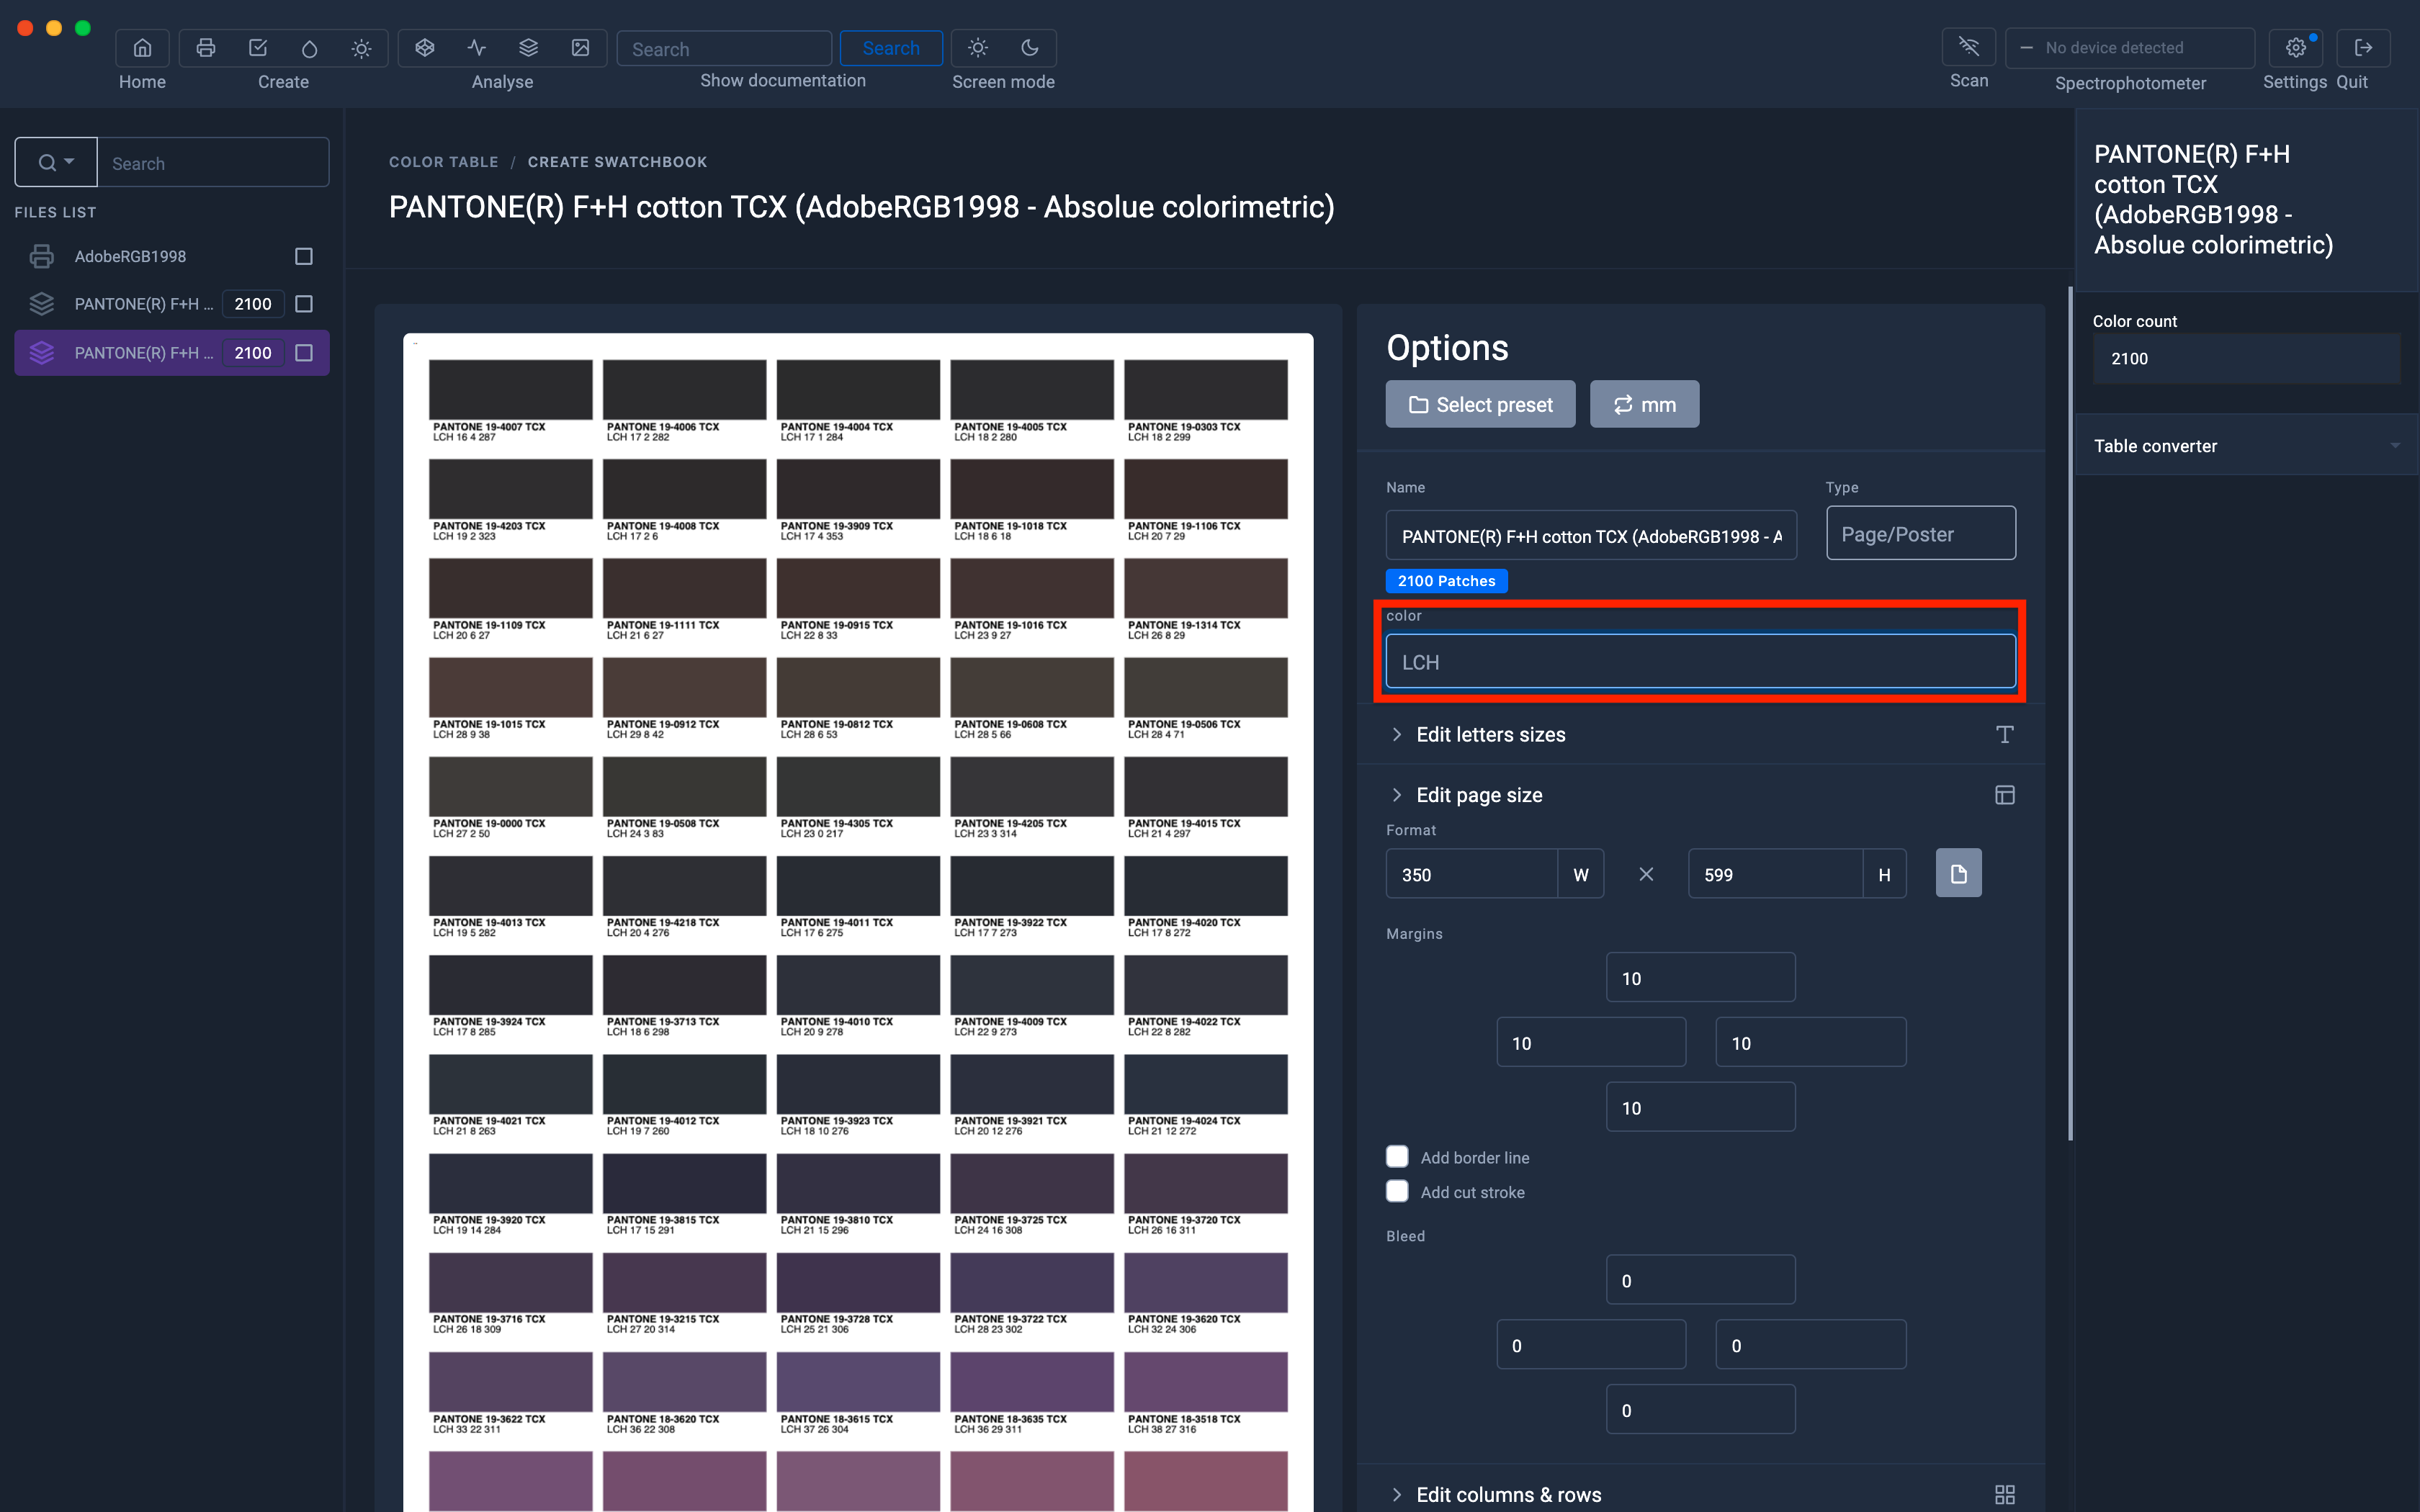
It is possible to customize the color chart by printing the LAB, RGB, CMYK, LCH or XYZ values under each sample of the range.
The RGB or CMYK values will only be present if the table has previously been converted with an RGB or CMYK profile.
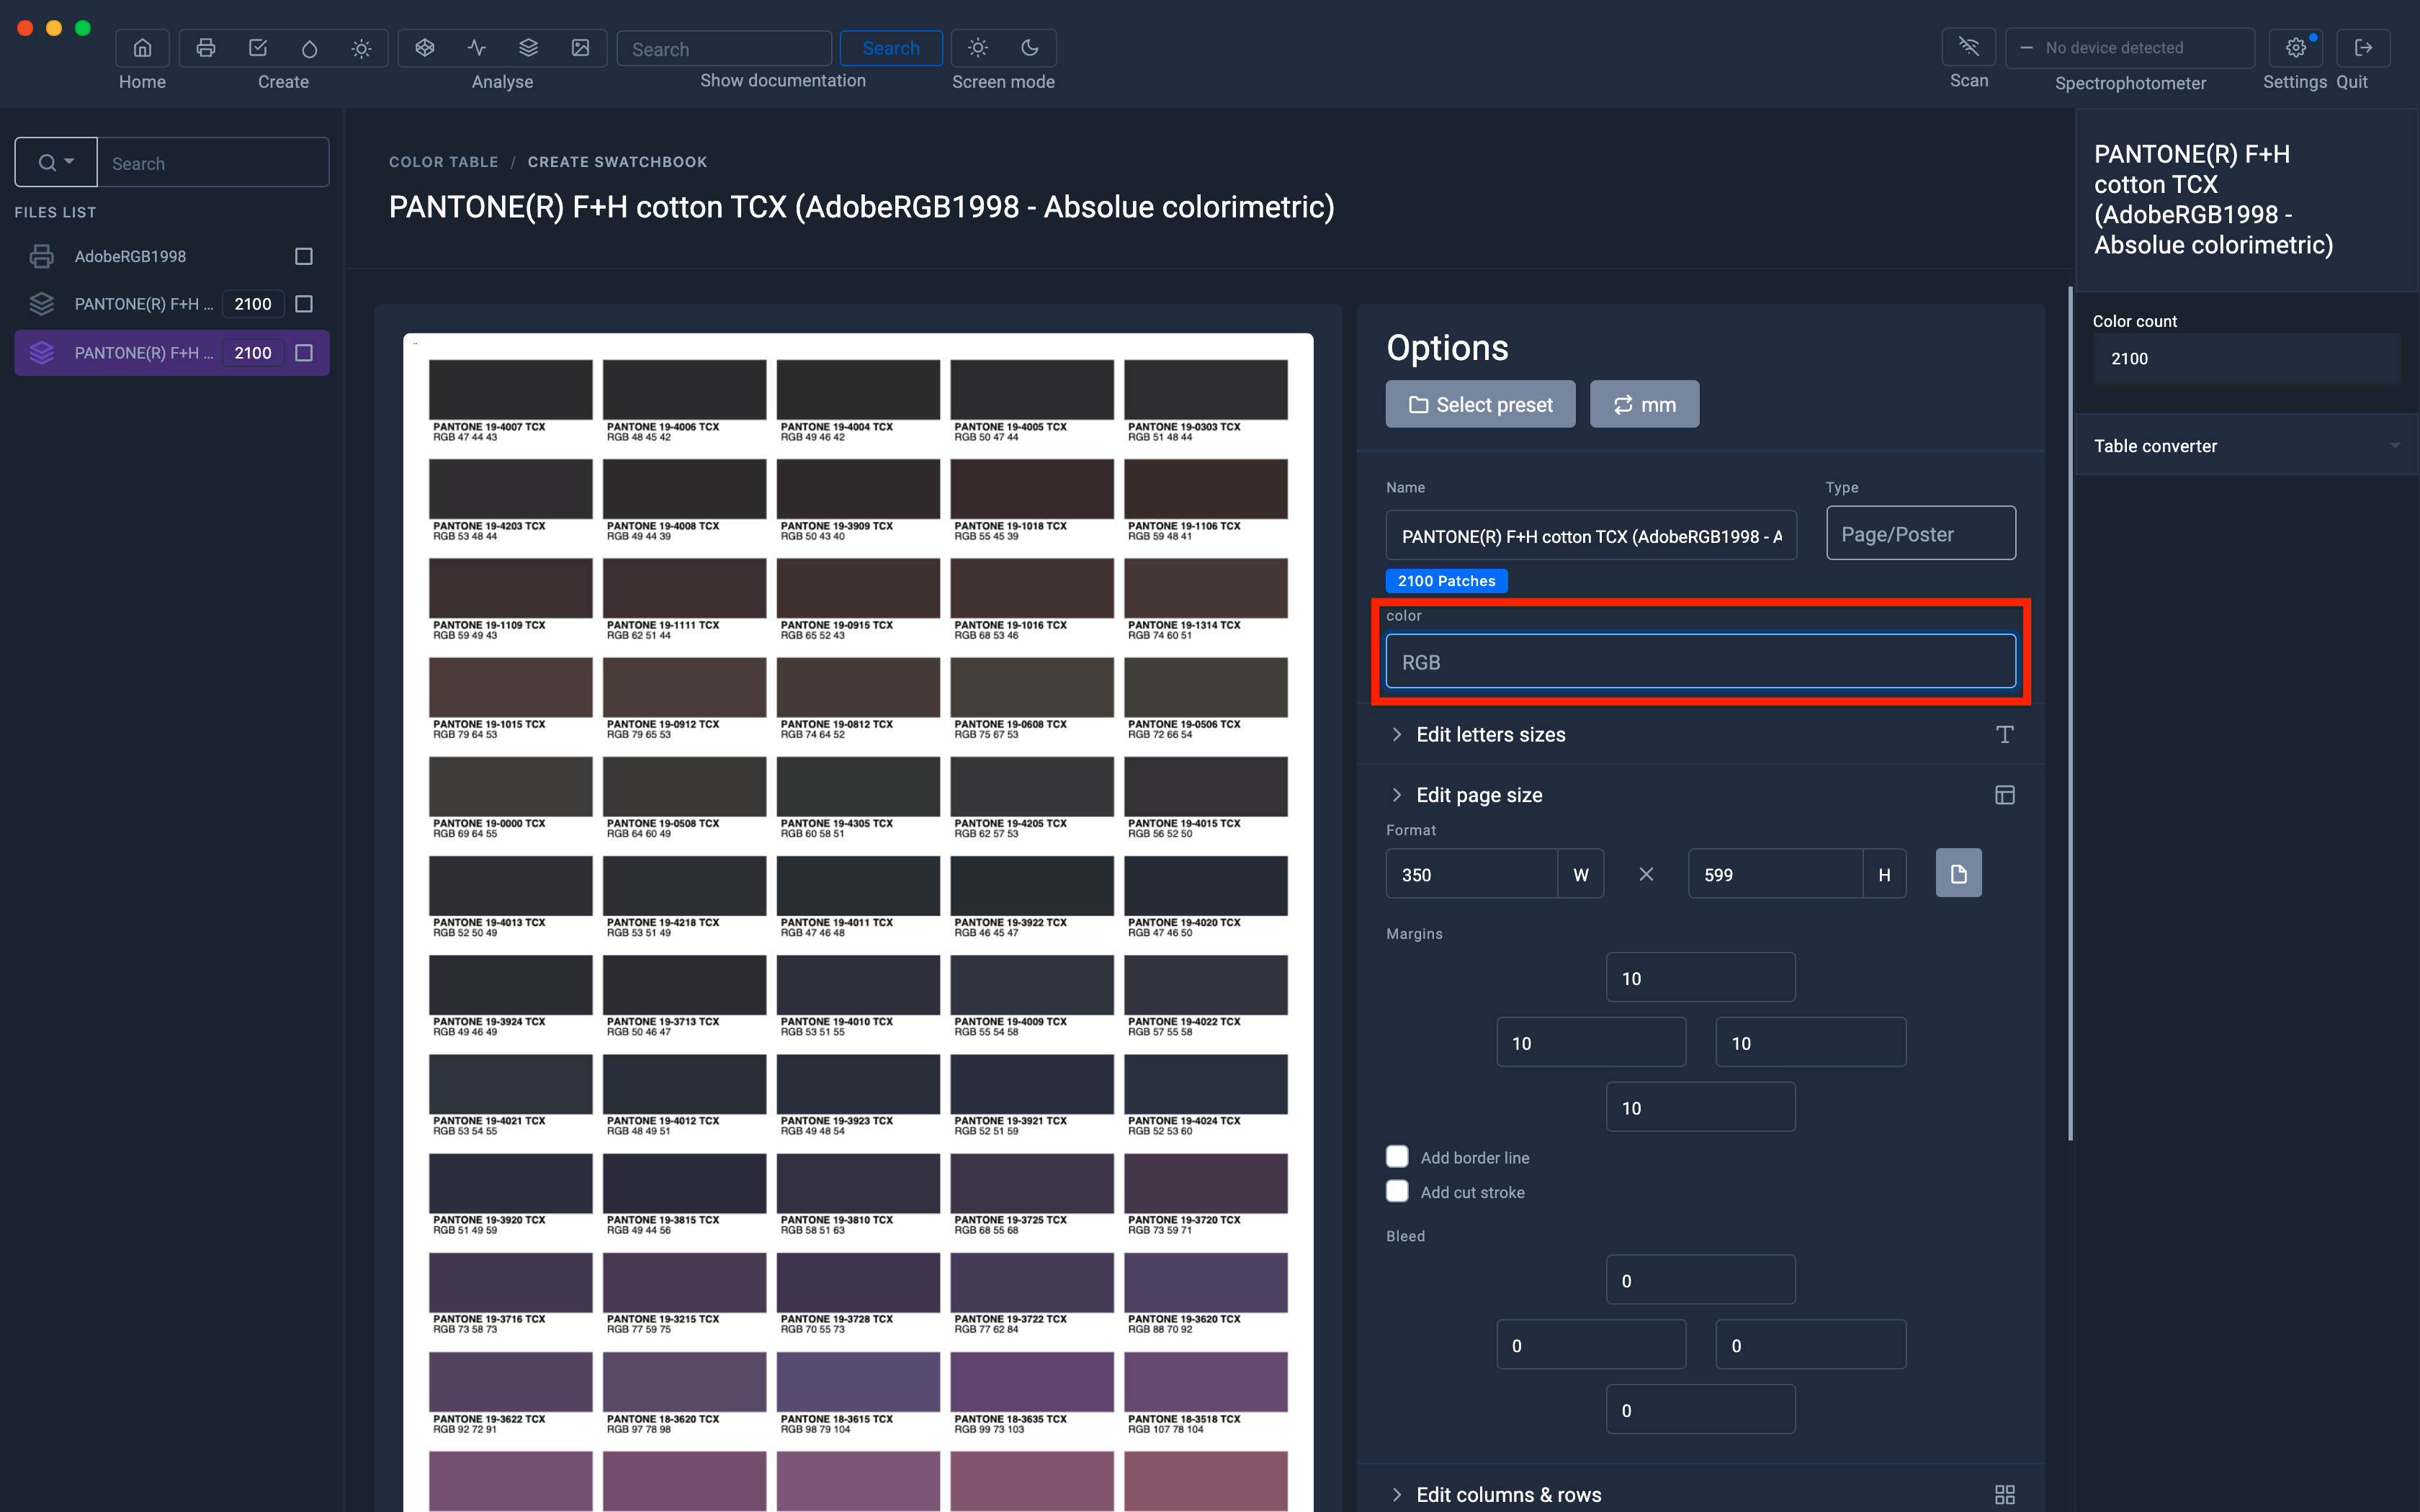
In this example, the Pantone TCX table contains the RGB values corresponding to the Adobe RGB 1998 color space because it was converted with the Adobe RGB 1998.icc profile.
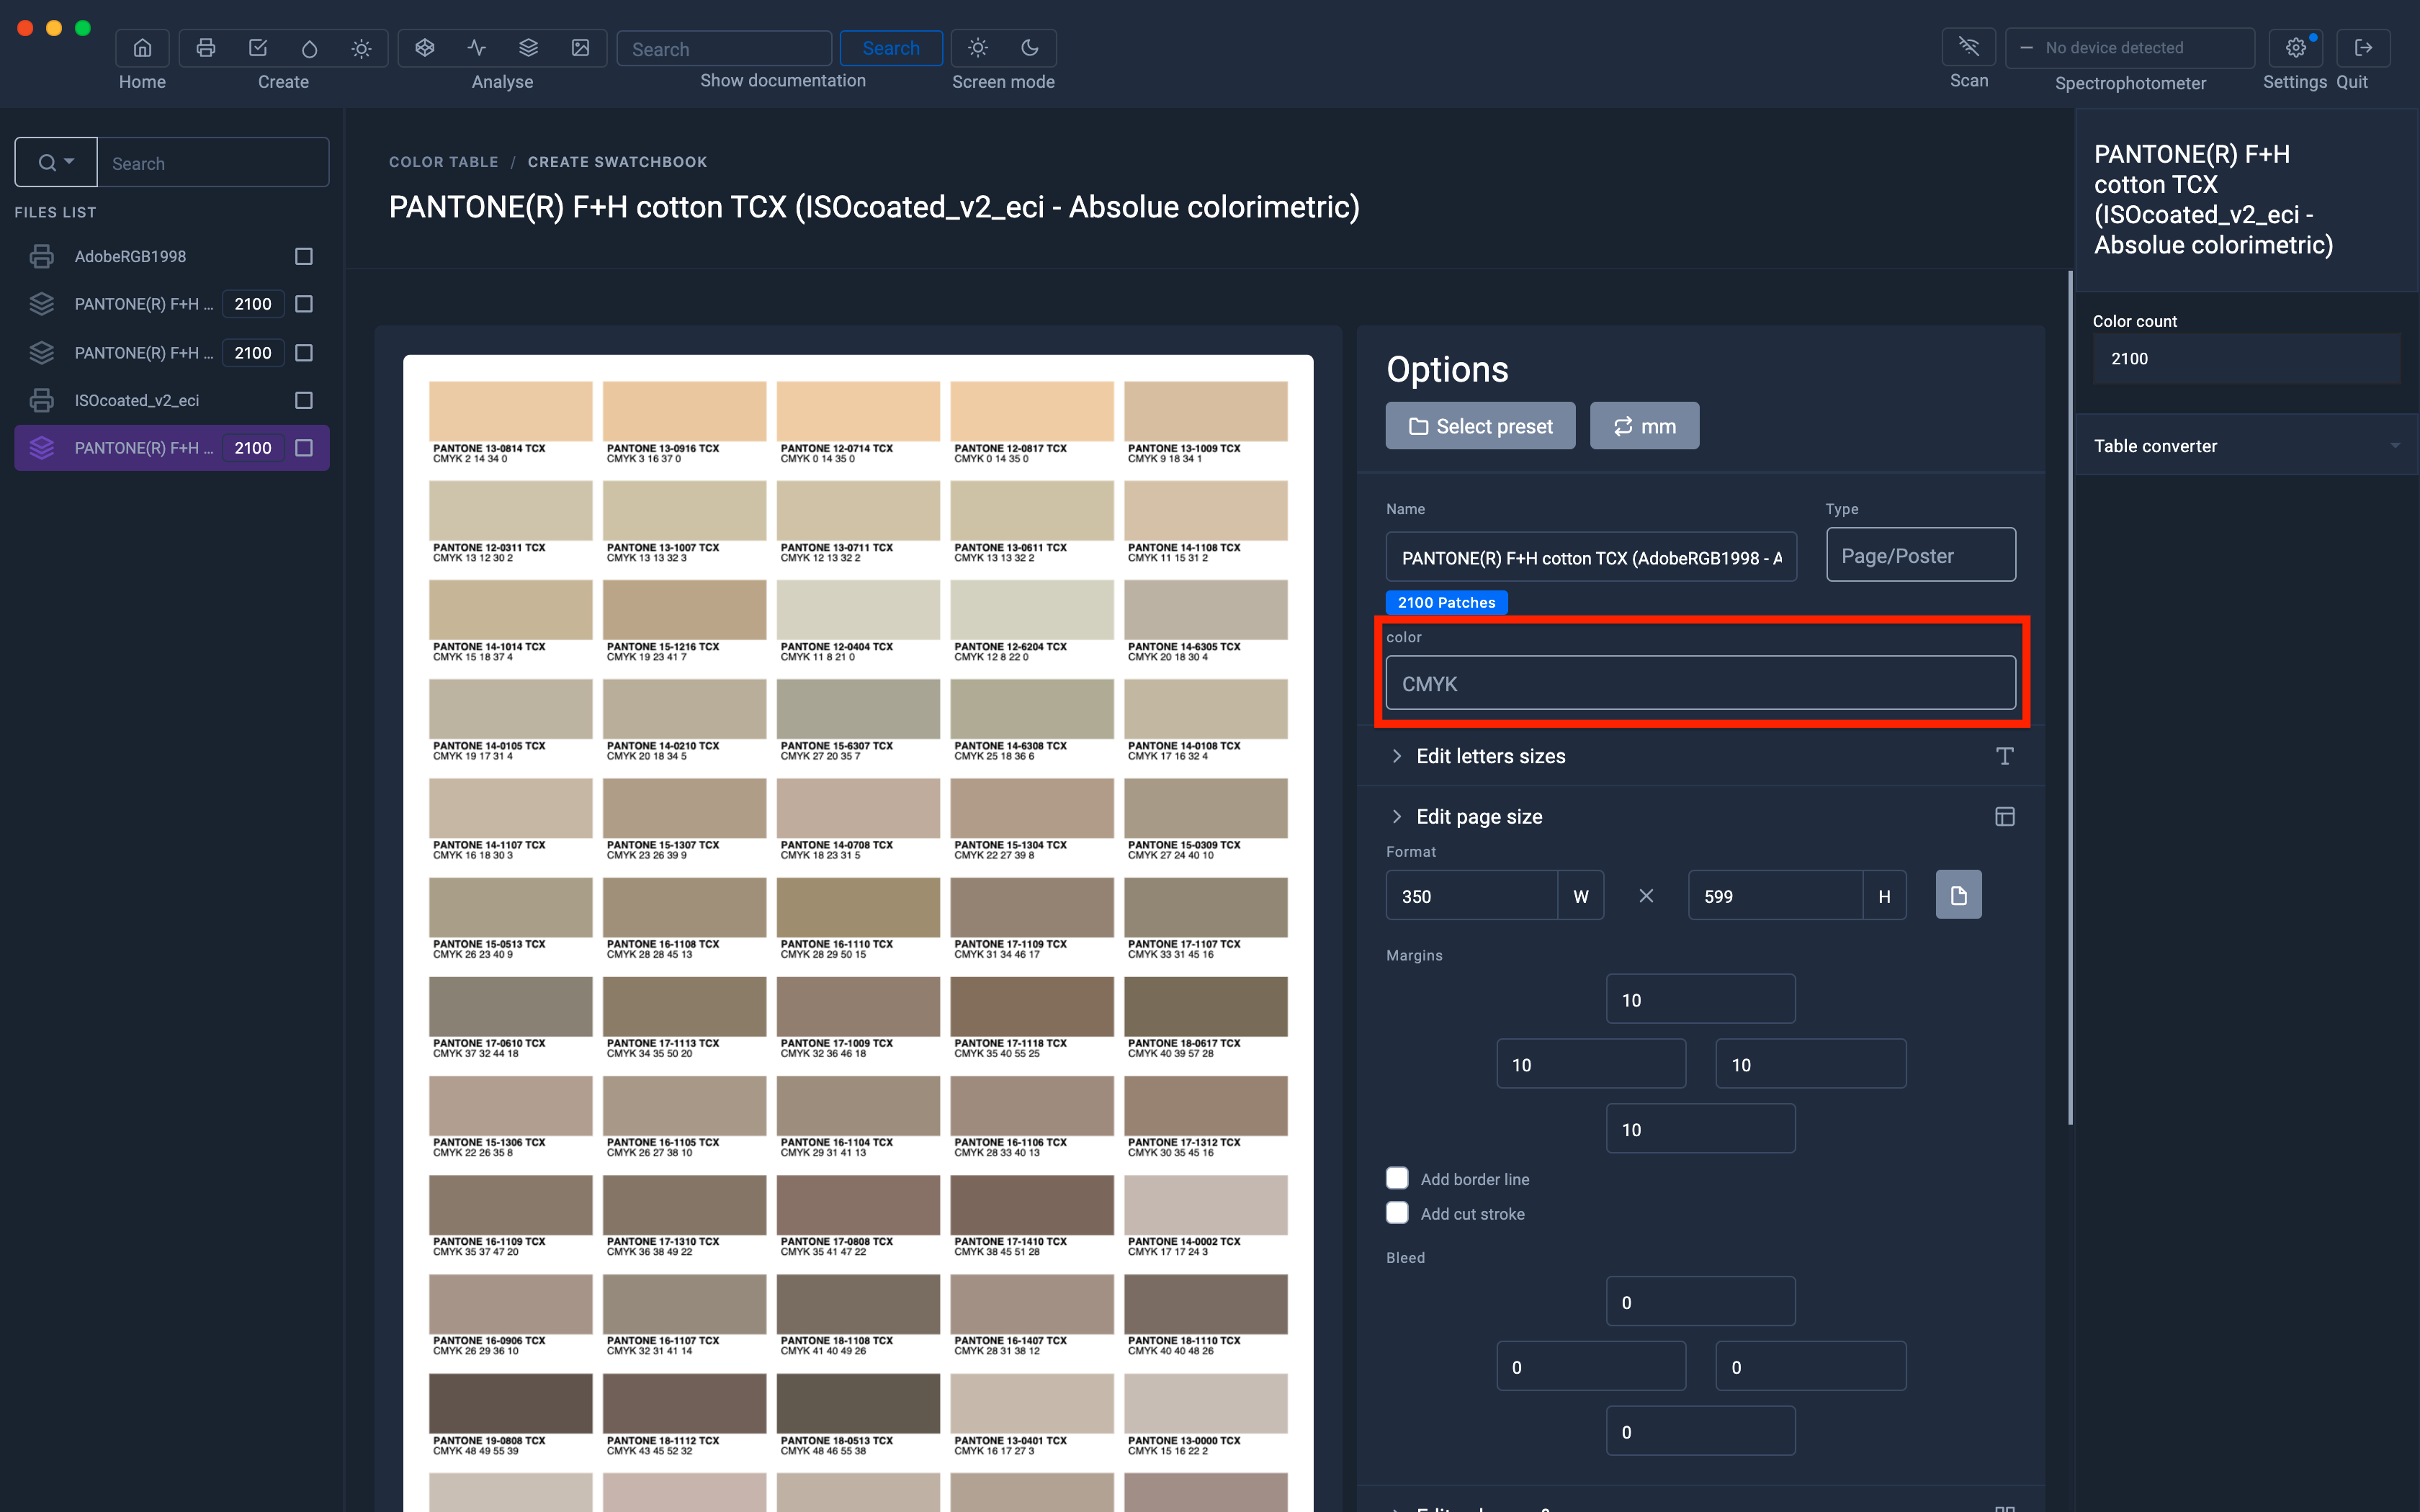
If this had been converted with the CMYK profile, ISOcoated_v2_eci.icc, the CMYK values would then have been available.
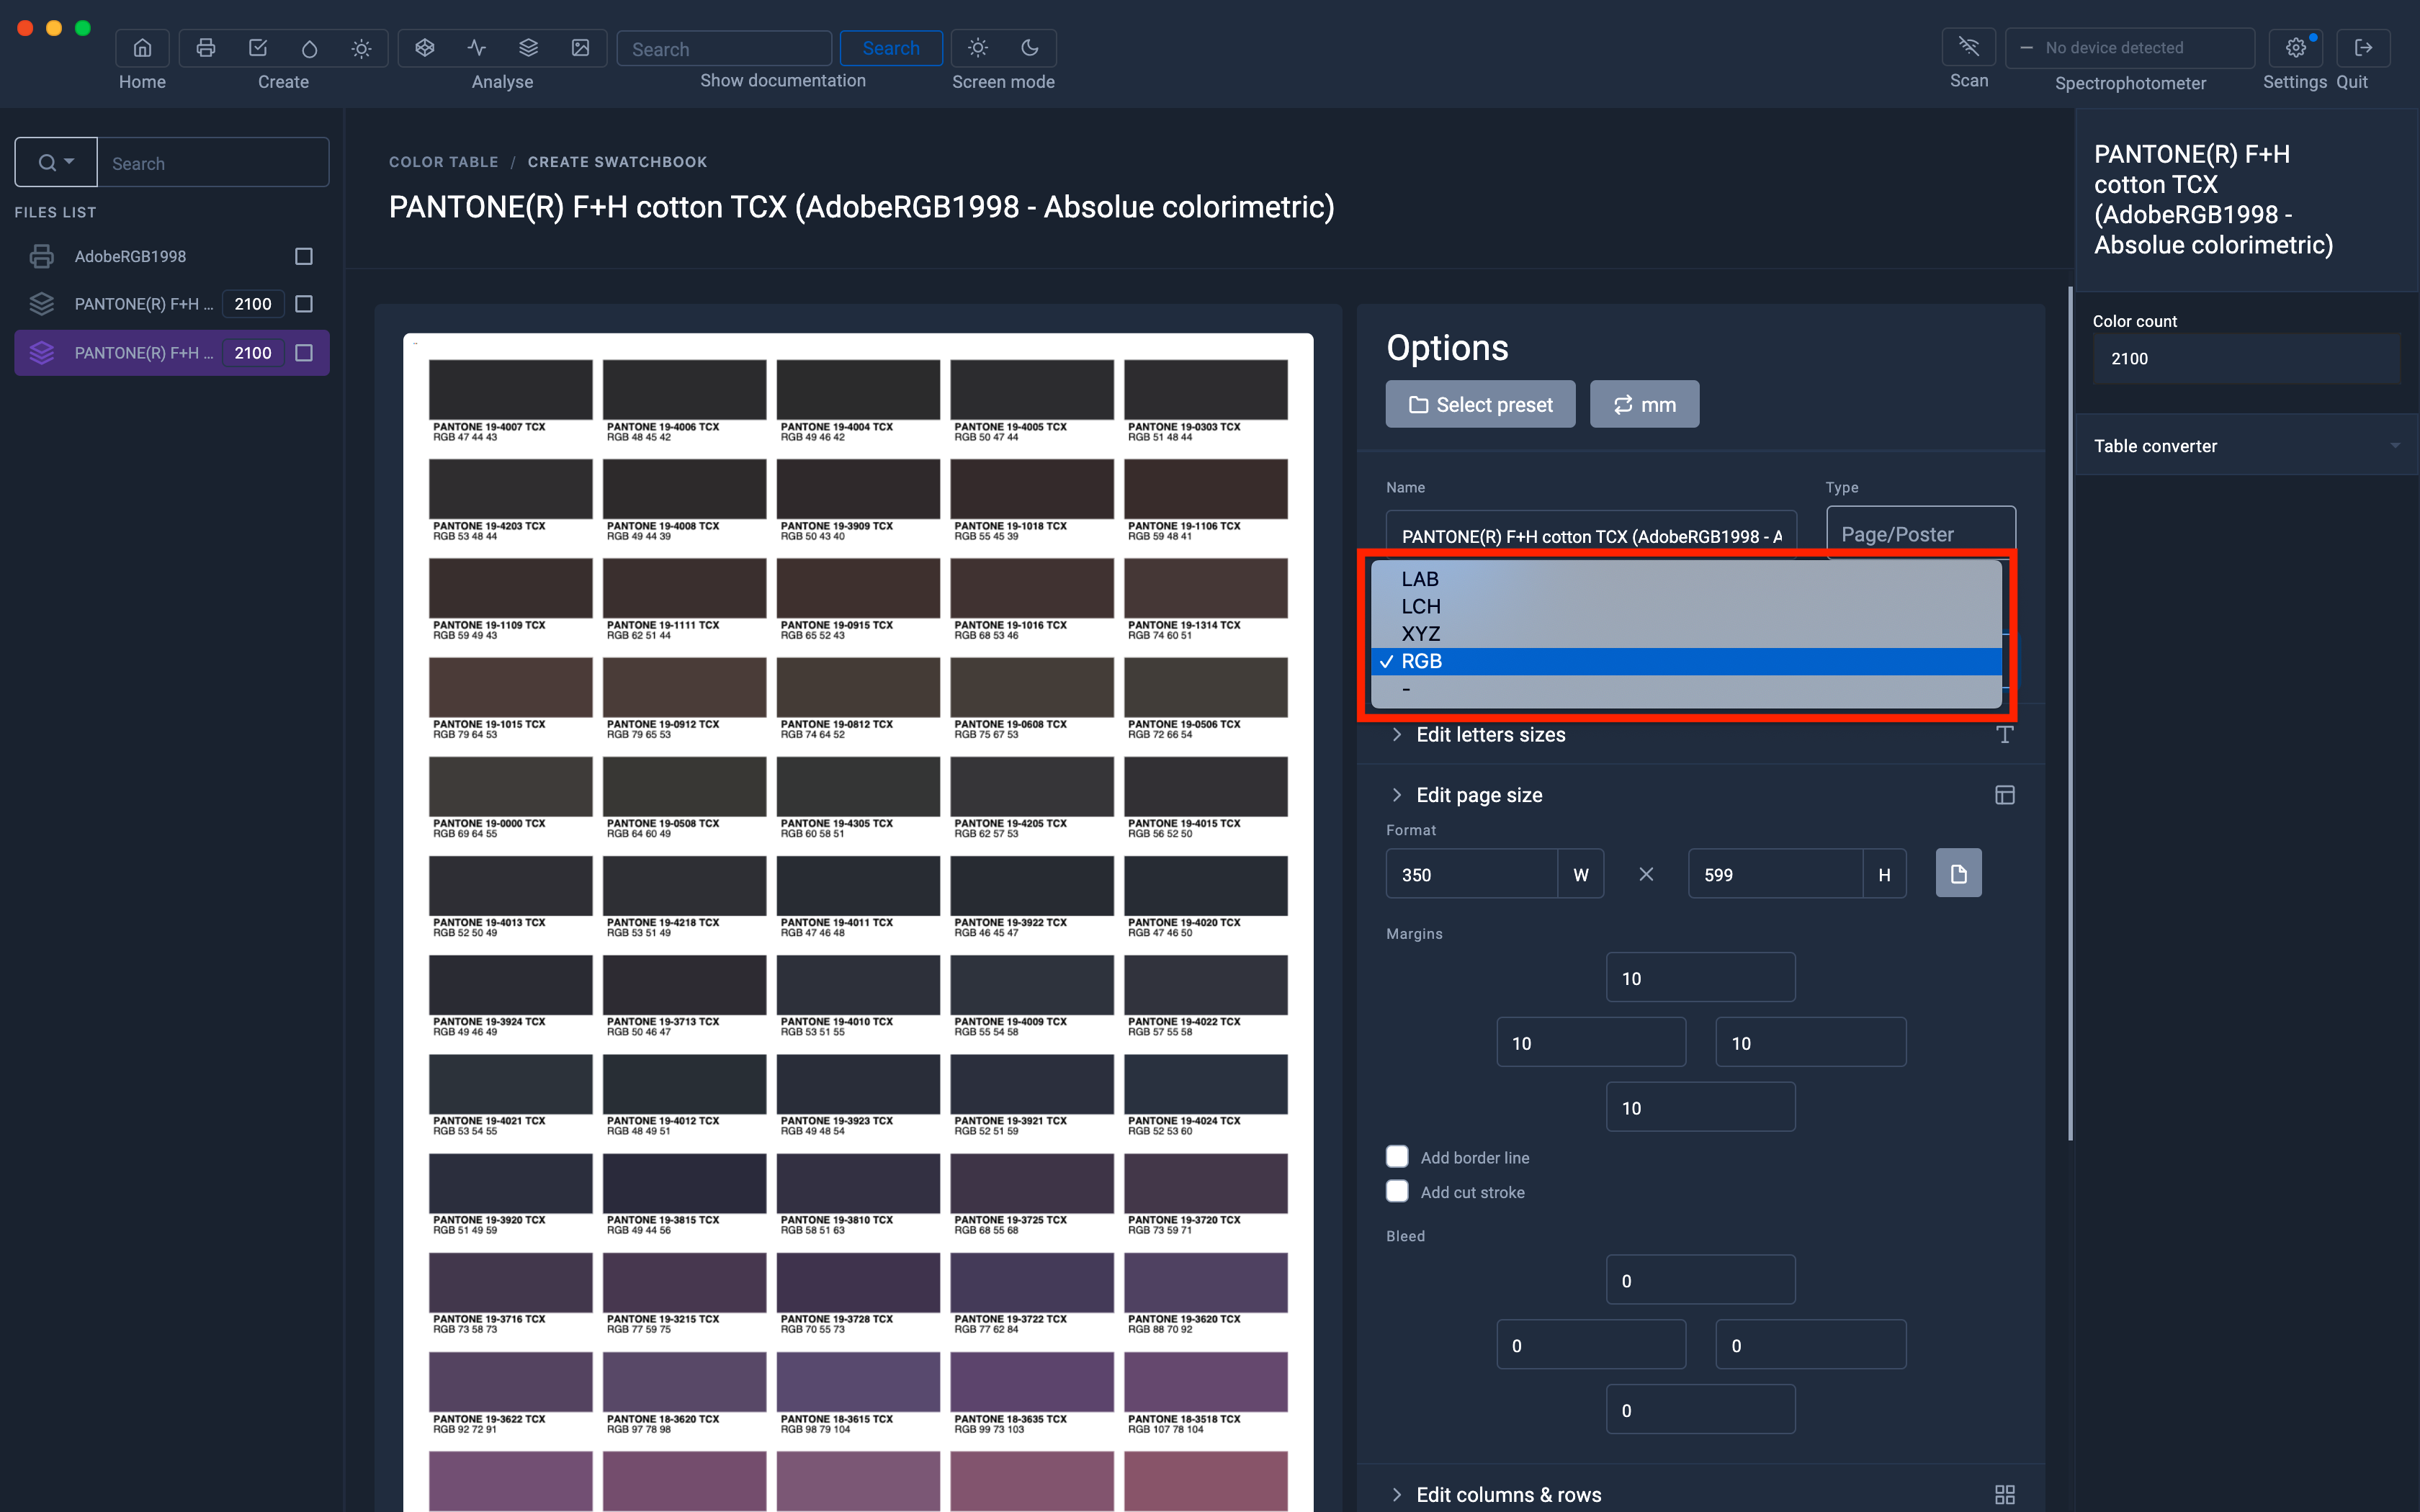
Displaying Colors in Lab Mode

It is also possible not to display the values...

Color display in Lch mode
In this example, the Pantone TCX table contains the CMYK values corresponding to the ISOcoated_v2_eci color space because it was converted with the ISOcoated_v2_eci.icc profile
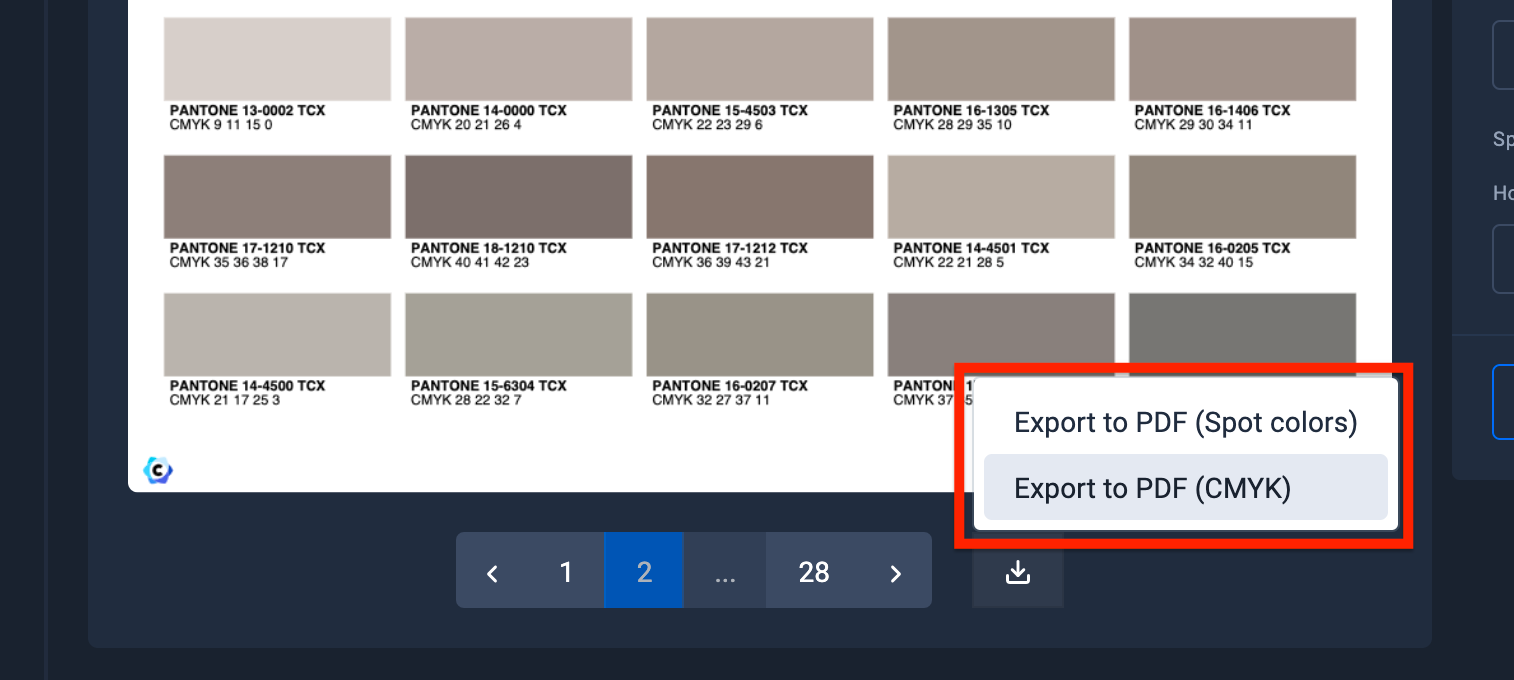
Export to PDF (RGB)
Since the pattern has been converted to RGB, it is possible to export it as a PDF in RGB mode or containing only spot colors.
Note that if it had been converted to CMYK, it would have been possible to export it in CMYK mode.
In our example, we are going to export it in RGB mode by selecting the "Export to PDF (RGB)" option to recover your color chart in the form of a PDF containing the colors in RGB.

If the table contains information in CMYK, it is possible to export it as a PDF in CMYK mode
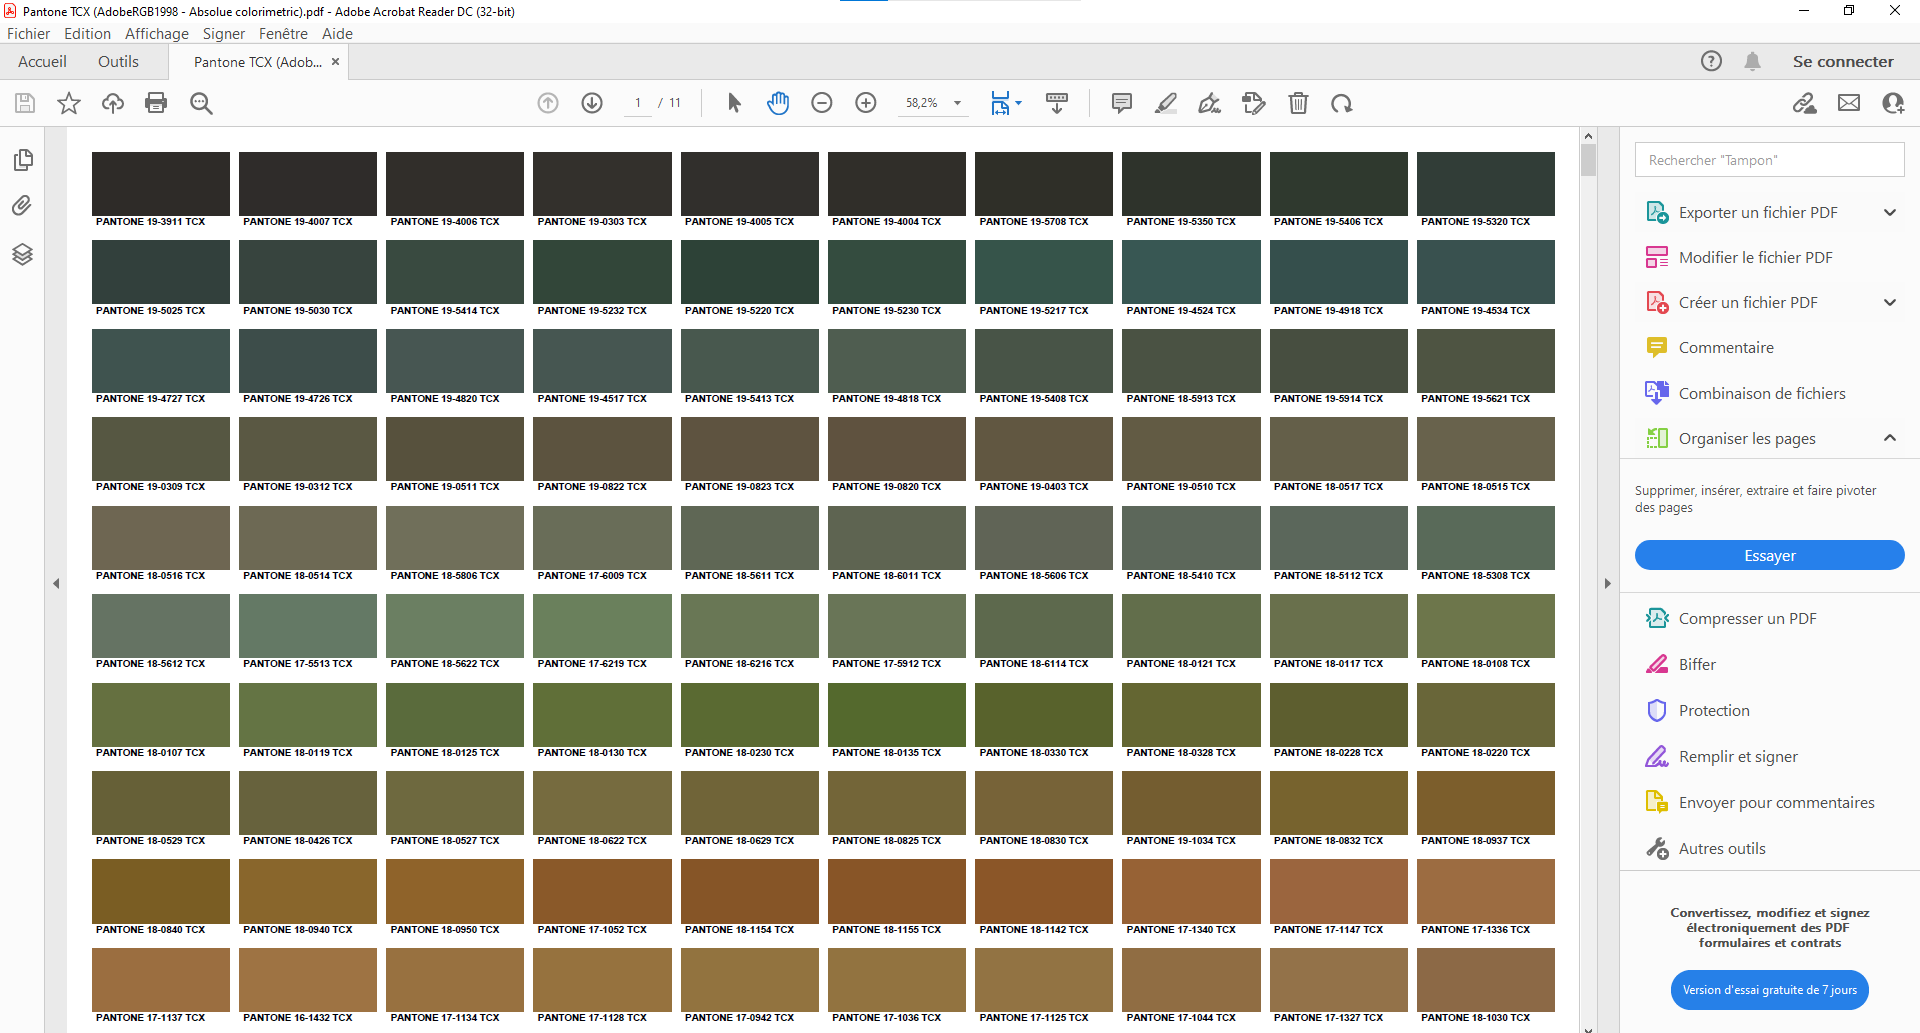
Preview PDF in Acrobat
Color chart printing
Here is an example of the color chart printed on an Epson SC-F10000 sublimation on a polyester fabric.

Bonus: Printable Color Report
Even before having started to print, it is possible with Coraye to anticipate the colors of the color chart that you will be able to reproduce or not.
All you have to do is select your color chart, drag the icc profile from your printer media and click on the "Conversion report" button
The color ratio appears
The values of deltat E> 2 appear in red and the values <2 appear in green.
This means that the greater the value of delta E, the more we will see a difference in color when printing.
It can be considered that a color with a deltat E value of less than 2 will be acceptable.
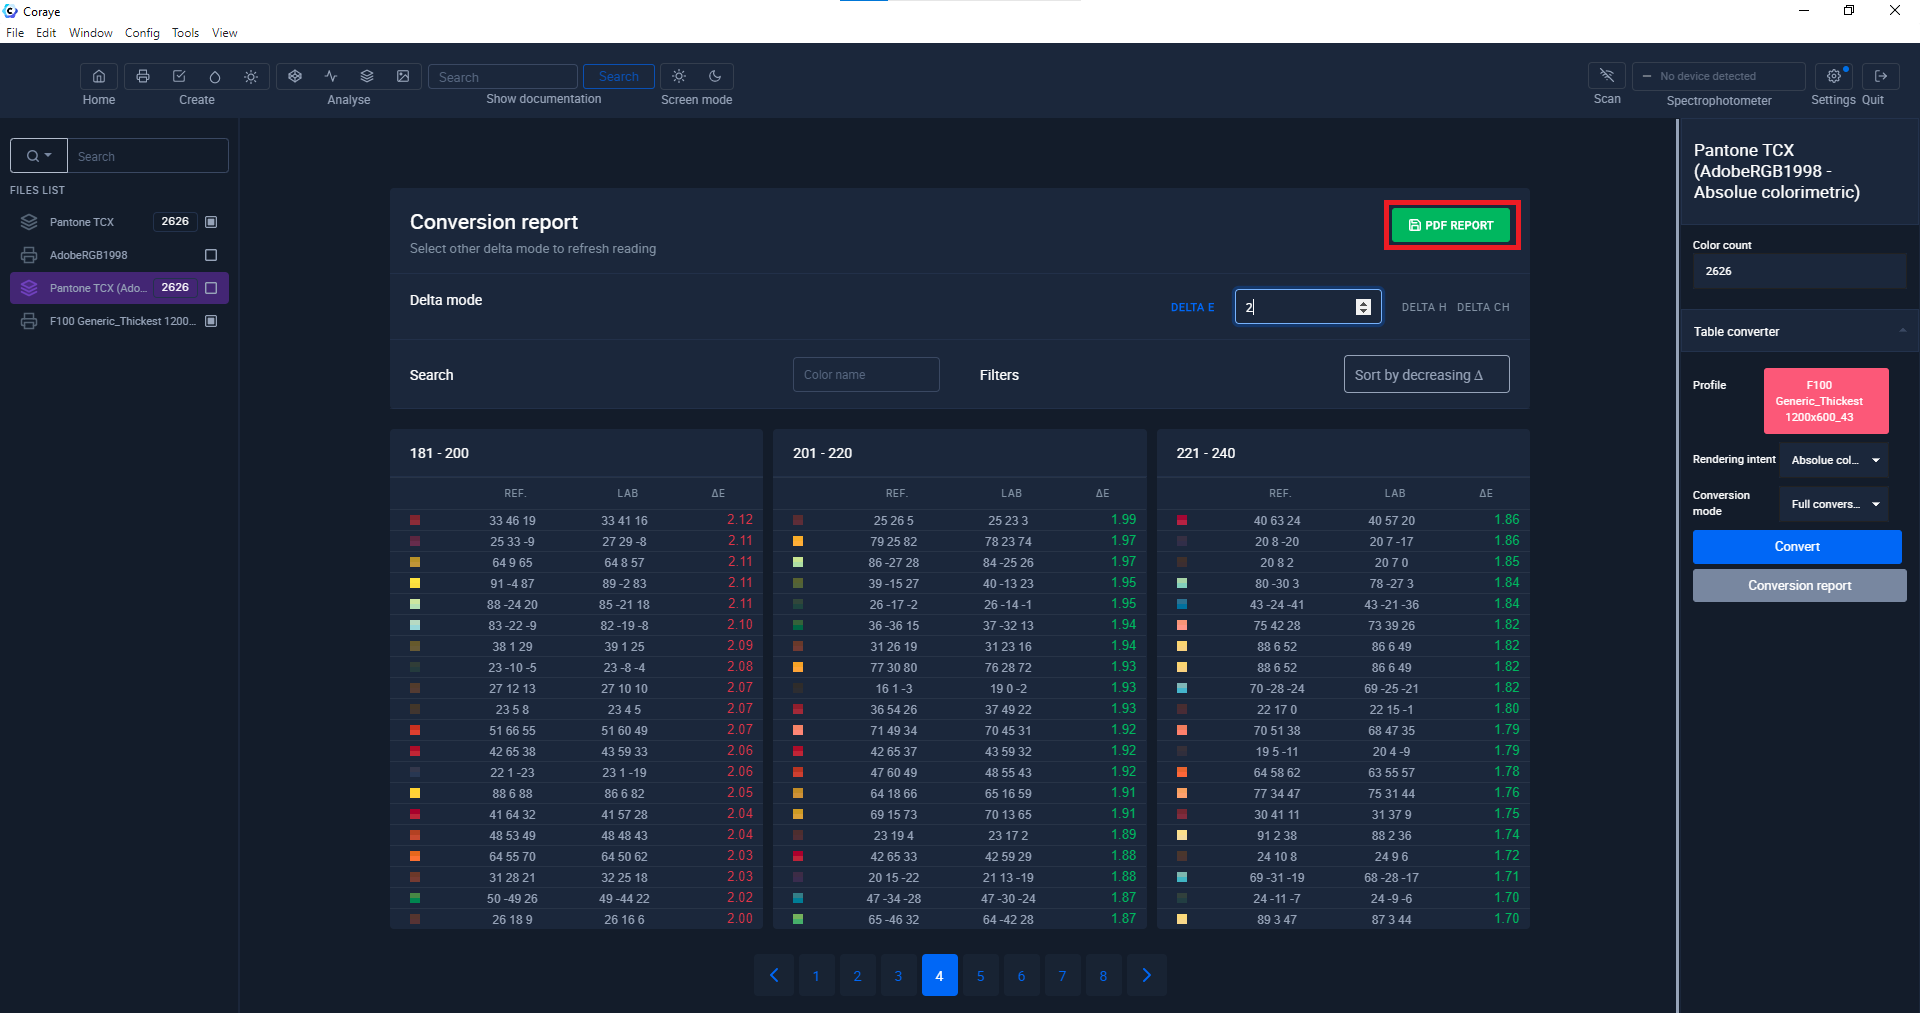
By clicking on the "PDF REPPORT" button, you will obtain the list of printable or non-printable colors with the value of delta E.
WARNING: do not take into account the RGB or CMYK values of this table because only the volume of the media profile is of interest to determine whether the color will be printable.
Fig: Comparison of the media profile of an Epson SC-F10000 with a PANTONE TCX color chart
