Create a baseline from a custom RGB or CMYK color table
As part of quality control, you need to control certain colors in a print.
Coraye allows you to customize your control ranges using a color table containing only the shades to monitor.
The method is the same as for creating a reference made from spot colors except that you will use RGB or CMYK modes instead of "Spot" mode.
Importing a custom color table
In our example, we are going to use the "Avery Dennison 500 Event Film" color chart that we made by measuring a vinyl color chart.
This color chart only contains spectral and Lab values, but we want to monitor its color reproduction on a digital press printing in RGB with the ADOBE RGB 1998 reference profile.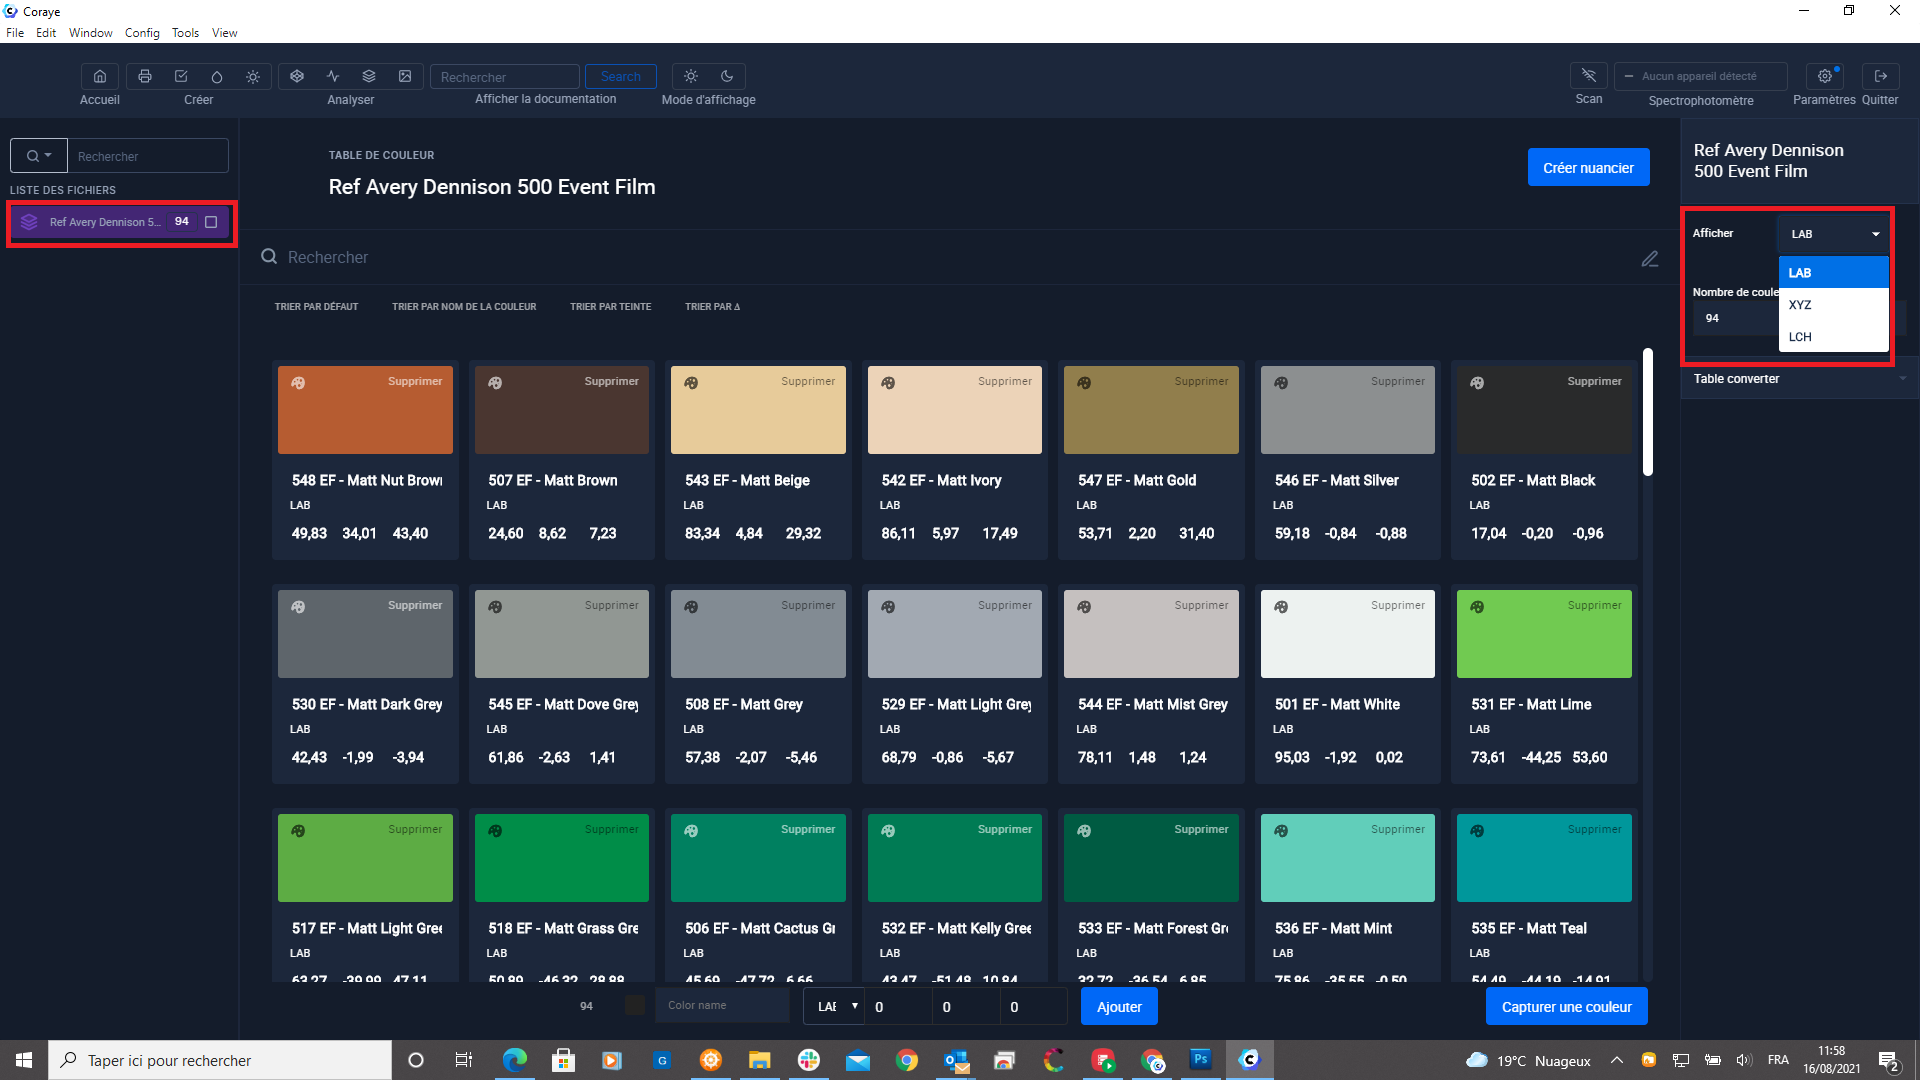
This table, not containing a reference RGB value, it does not allow us to create an RGB repository for the moment
Adding RGB or CMYK values to the reference table
To create RGB values in the table, we will use the Adobe RGB 1998 ICC profile which is the reference profile used when printing.
We are therefore going to import the ADOBE RGB 1998.icc profile into Coraye, then convert the table with this profile.
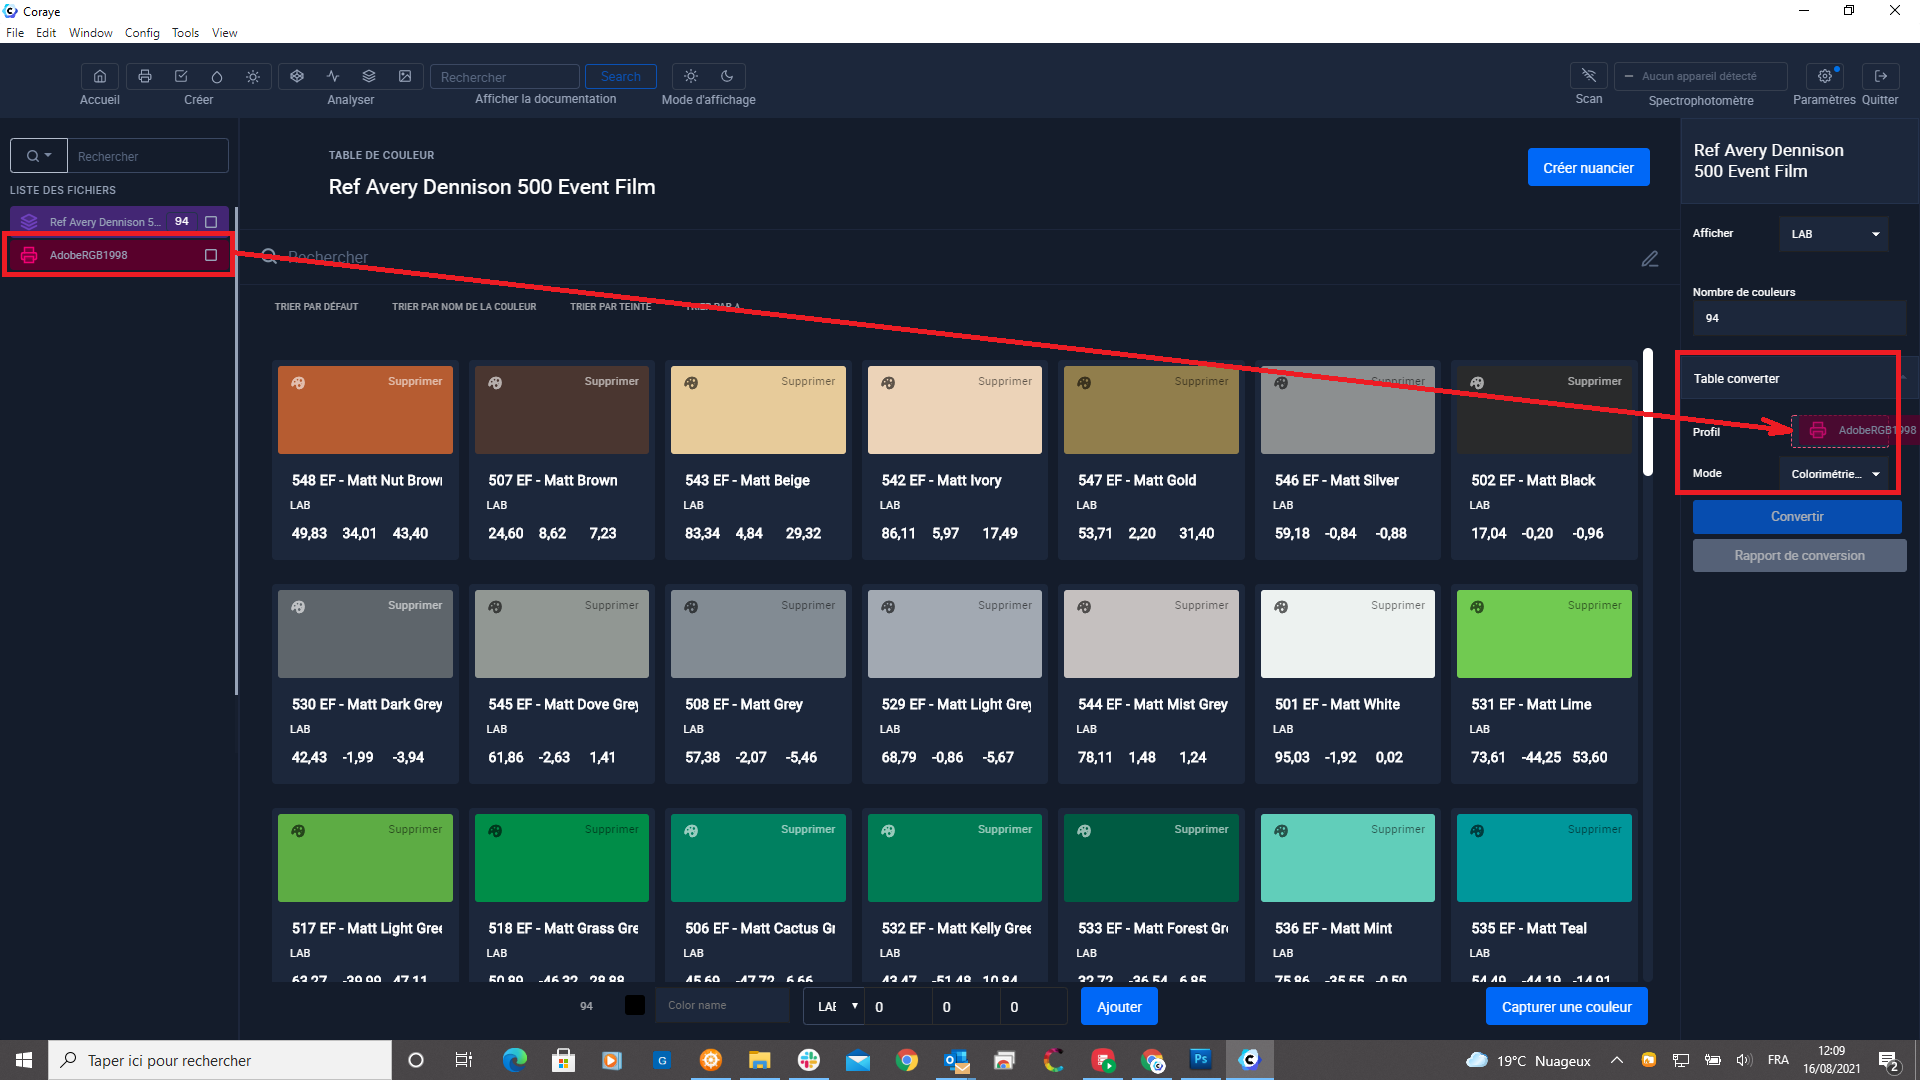
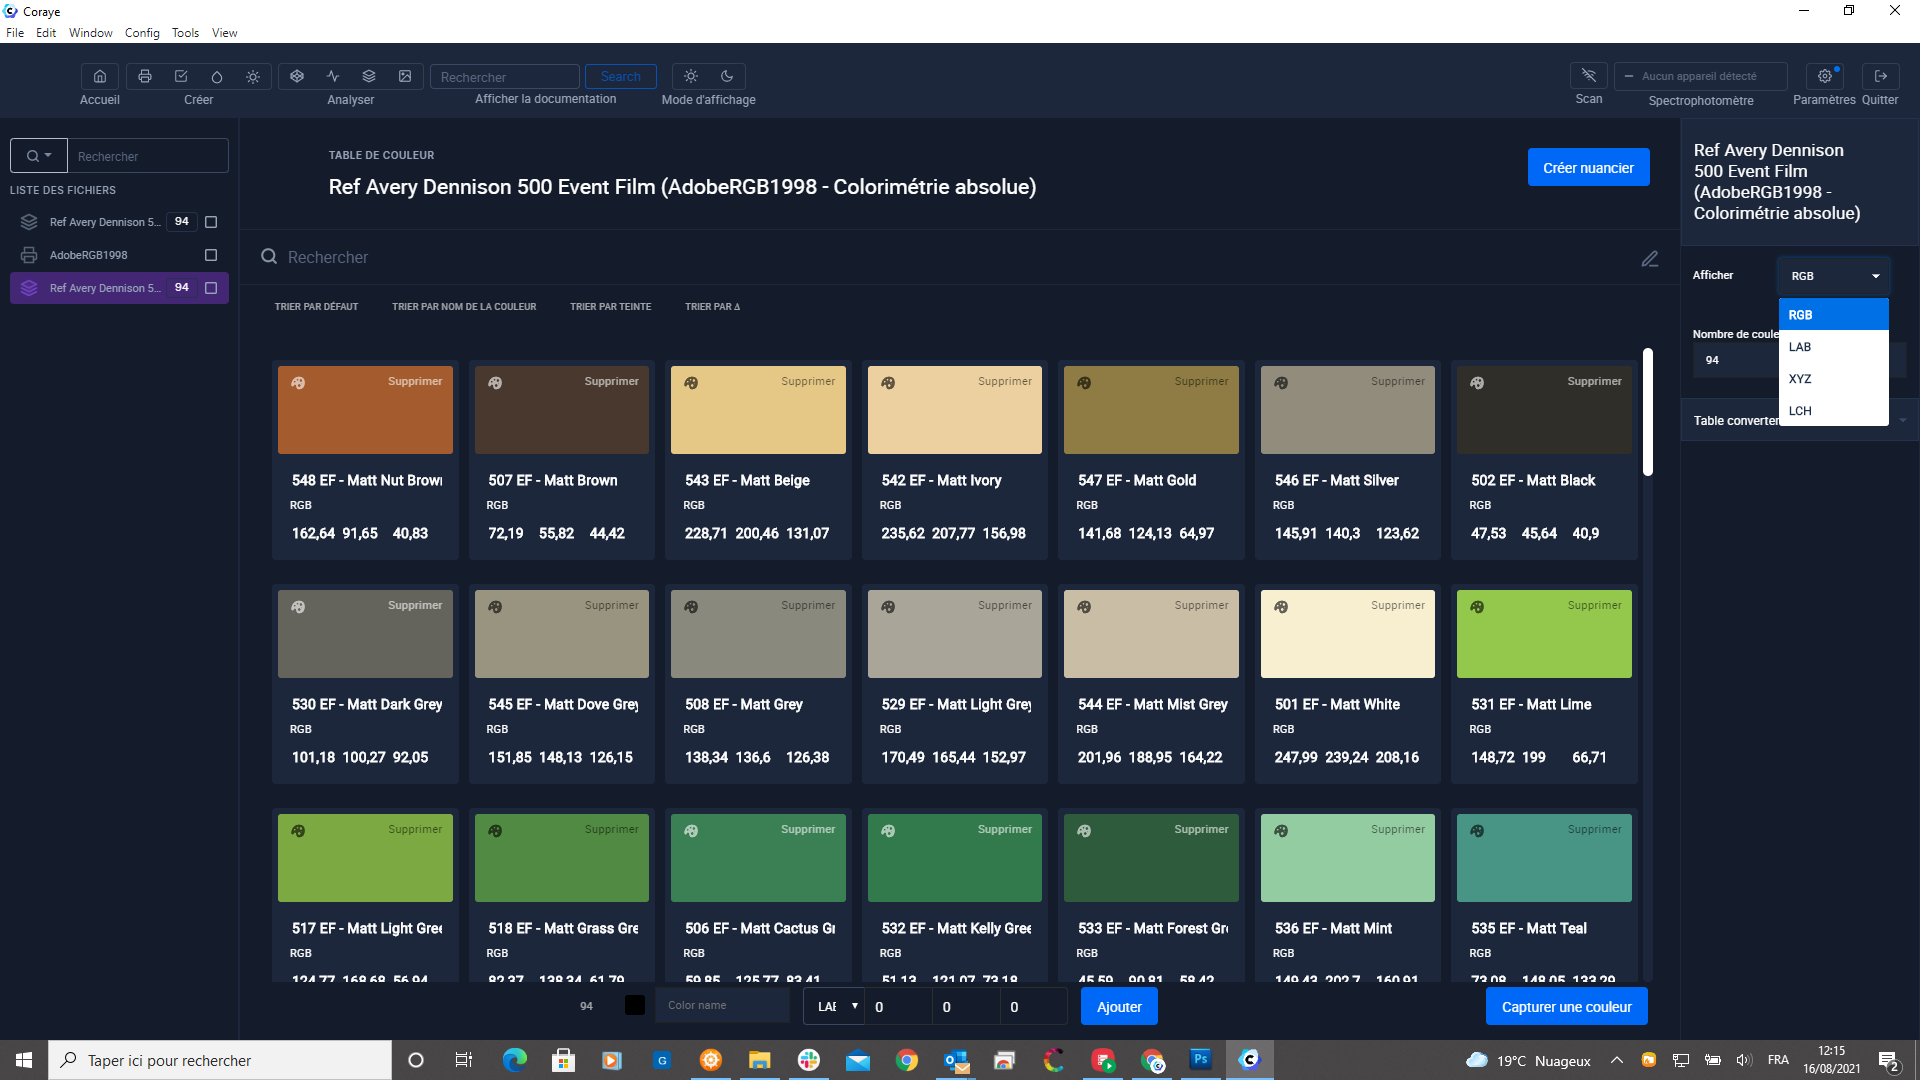
We will get a table containing RGB values associated with all the colors in the table.
To create a CMYK repository, you must perform the same operation, but with a CMYK profile
Creation of the RGB reference range
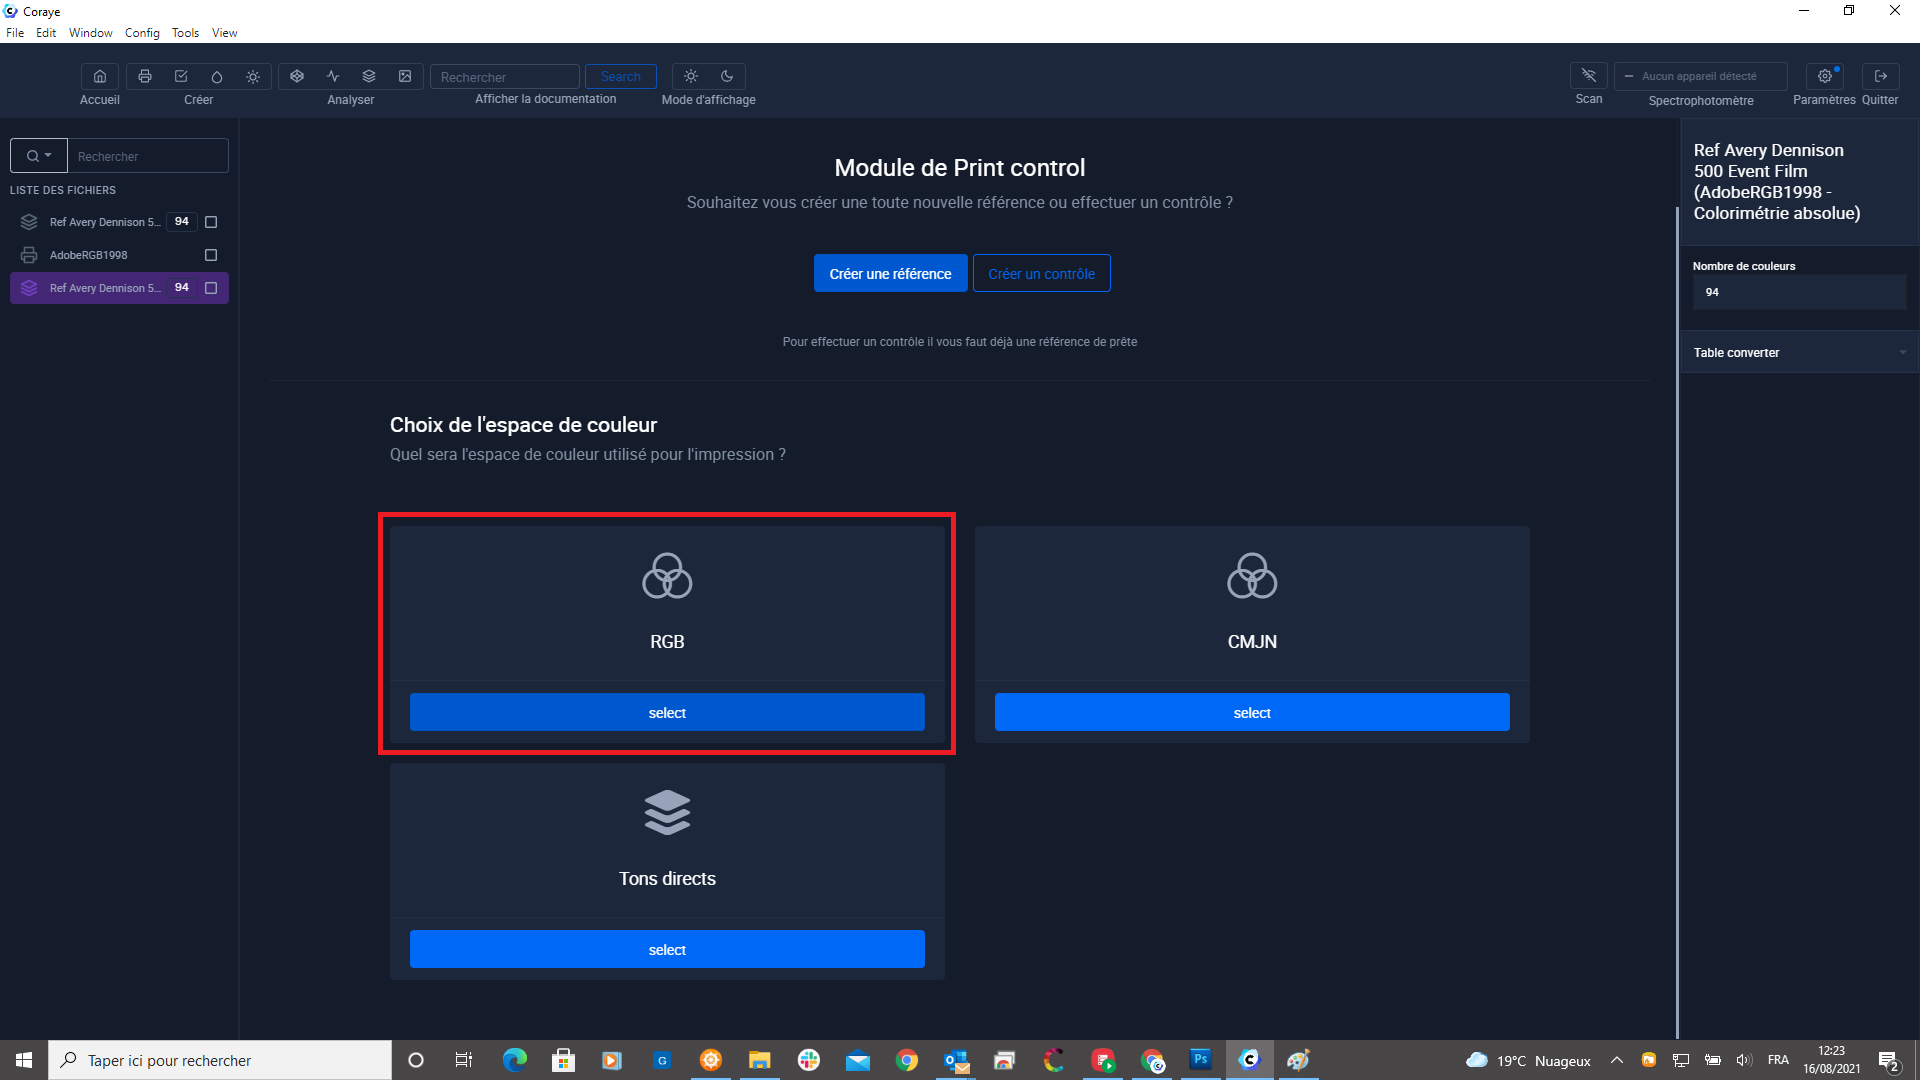
The next step is to launch the Print module.
Then click on the "Create a reference" button.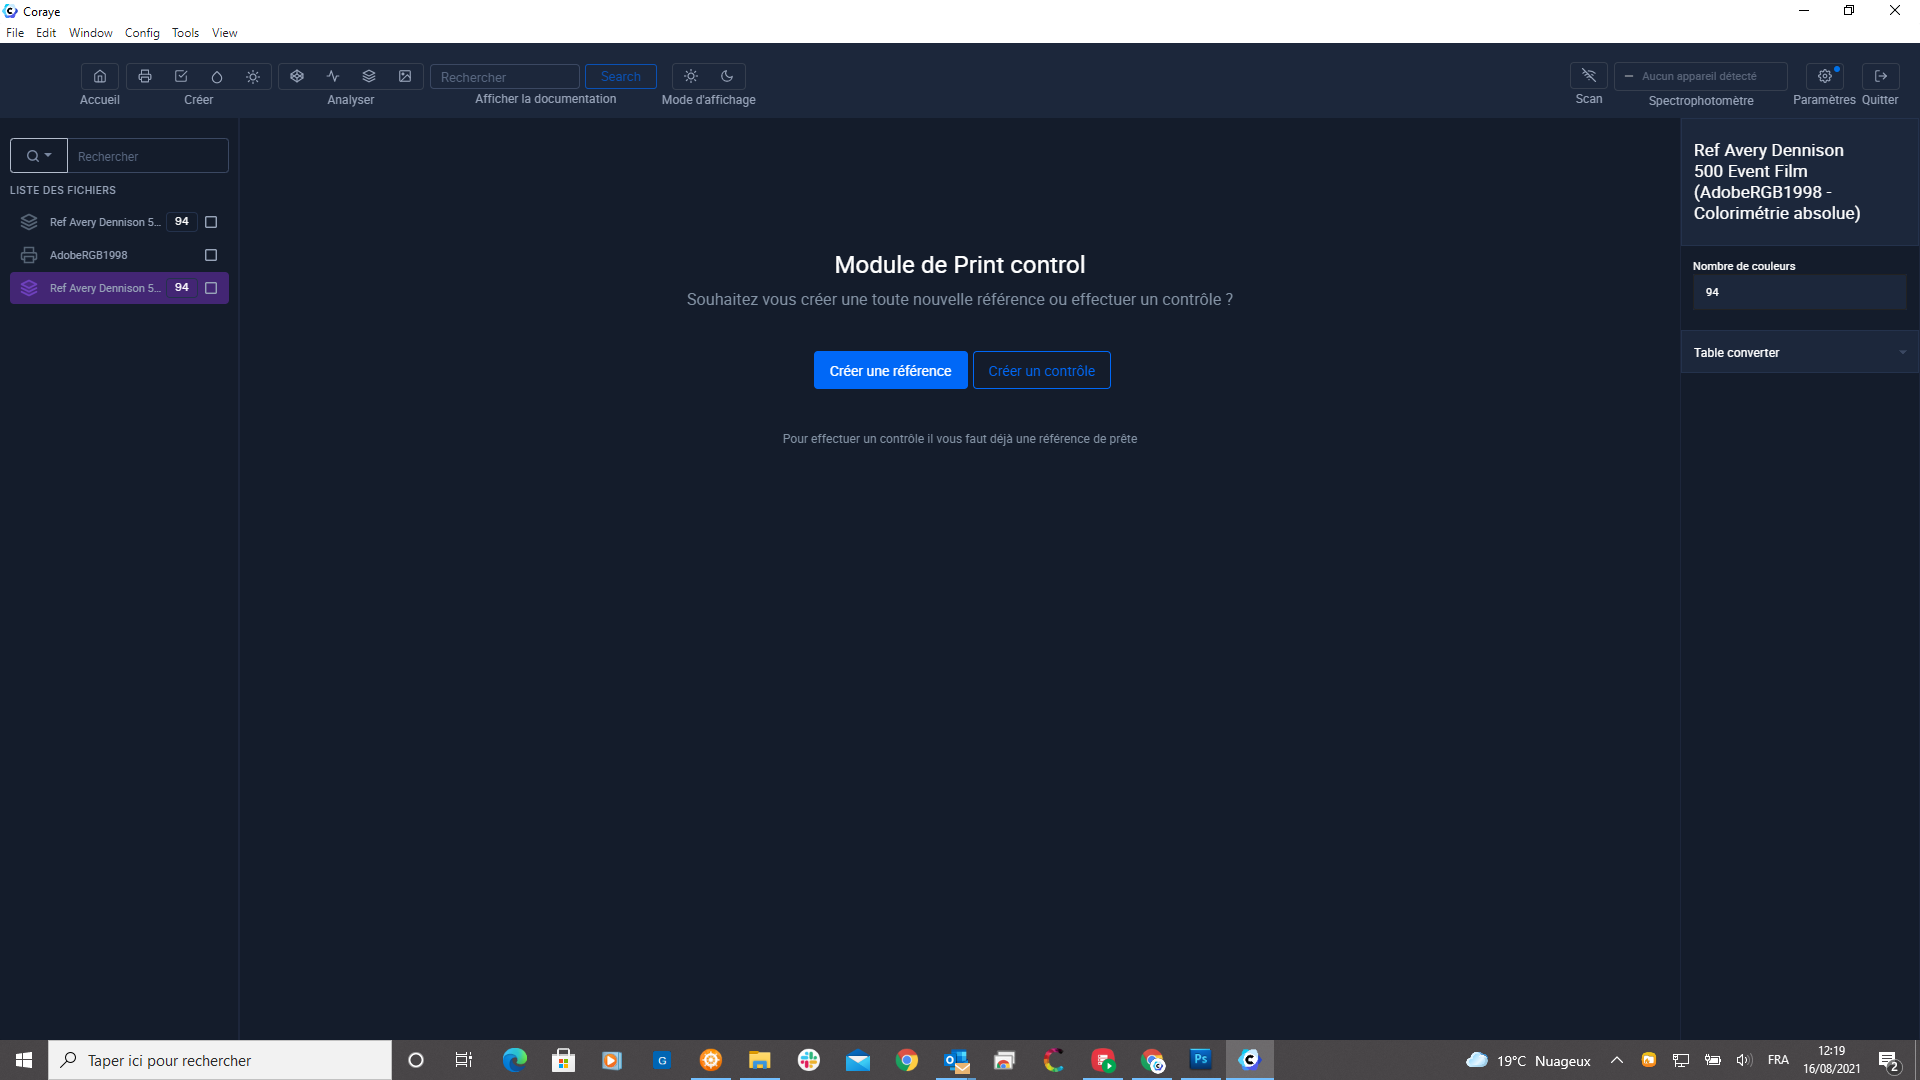
Then select the RGB space
To create a CMYK repository, you must perform the same operation, but with a CMYK profile
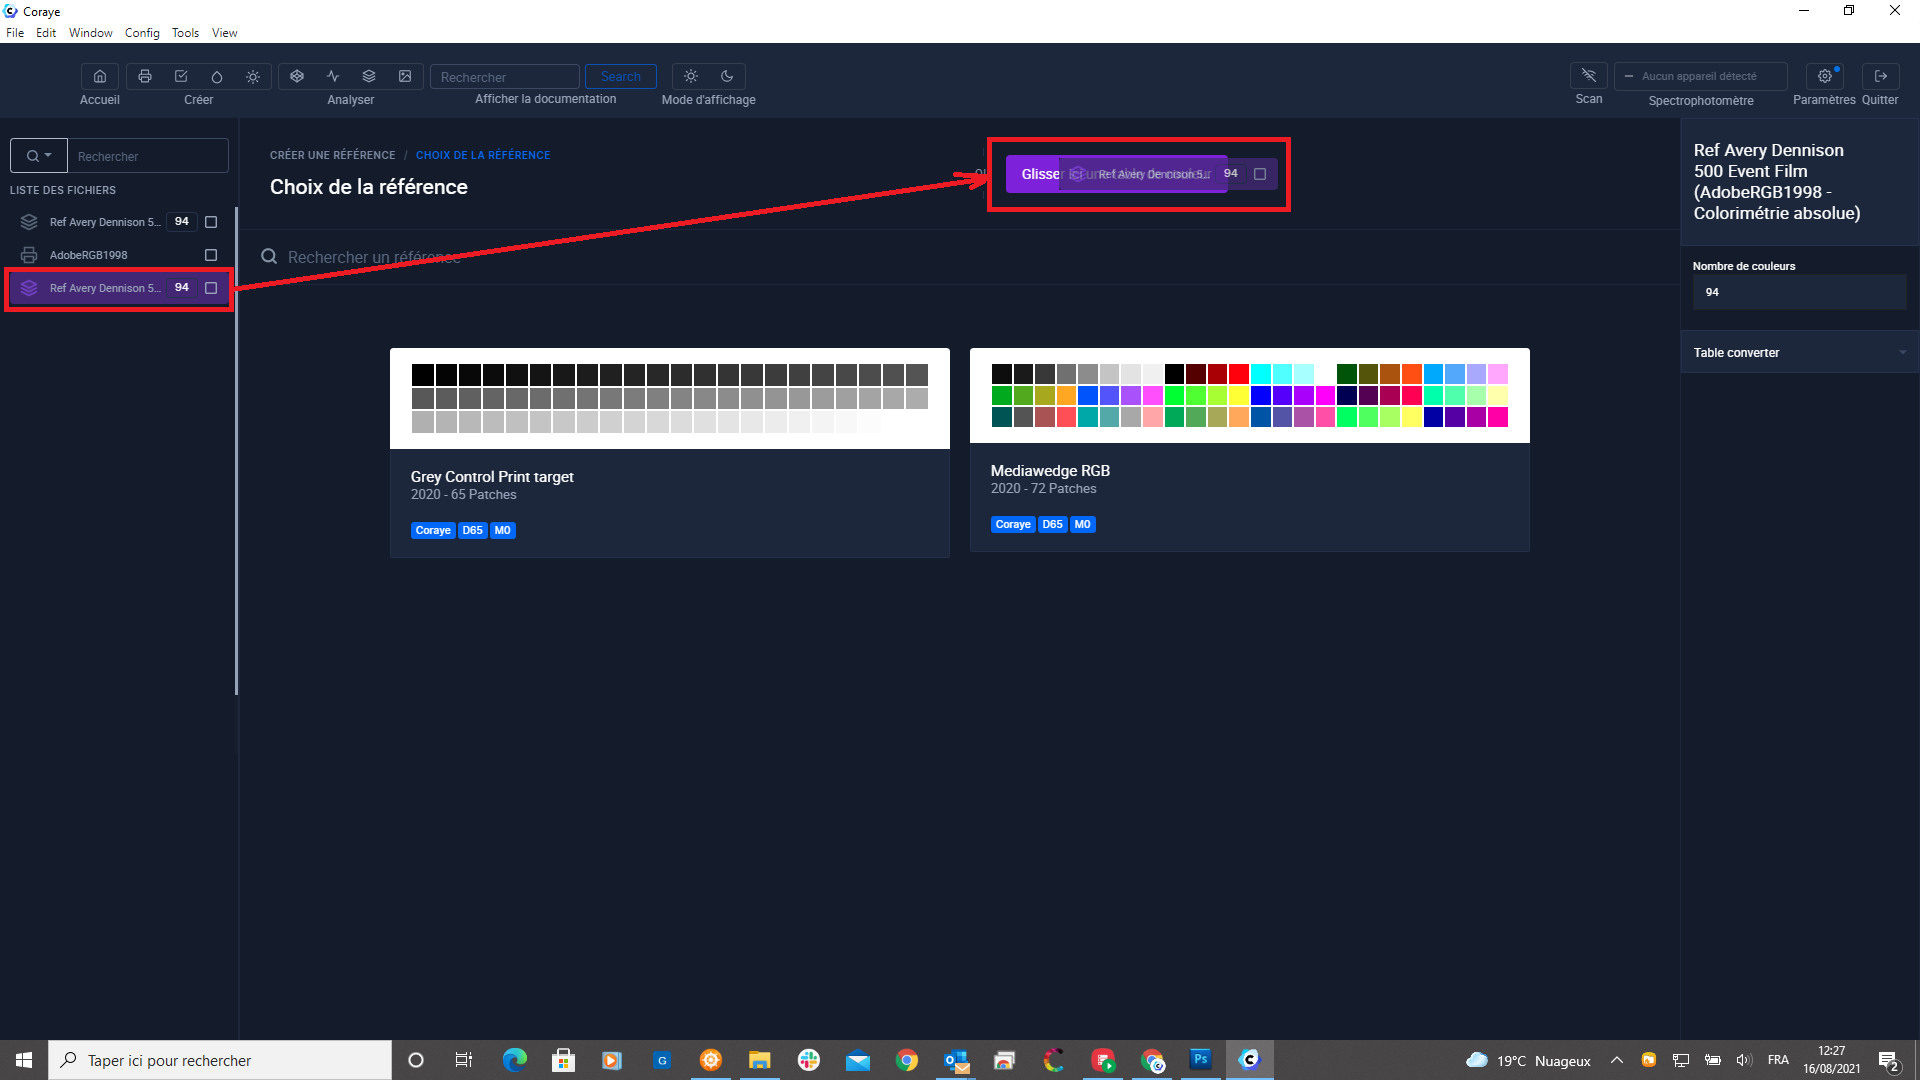
Drag the table containing the RGB values into the "Drag a color table here" area
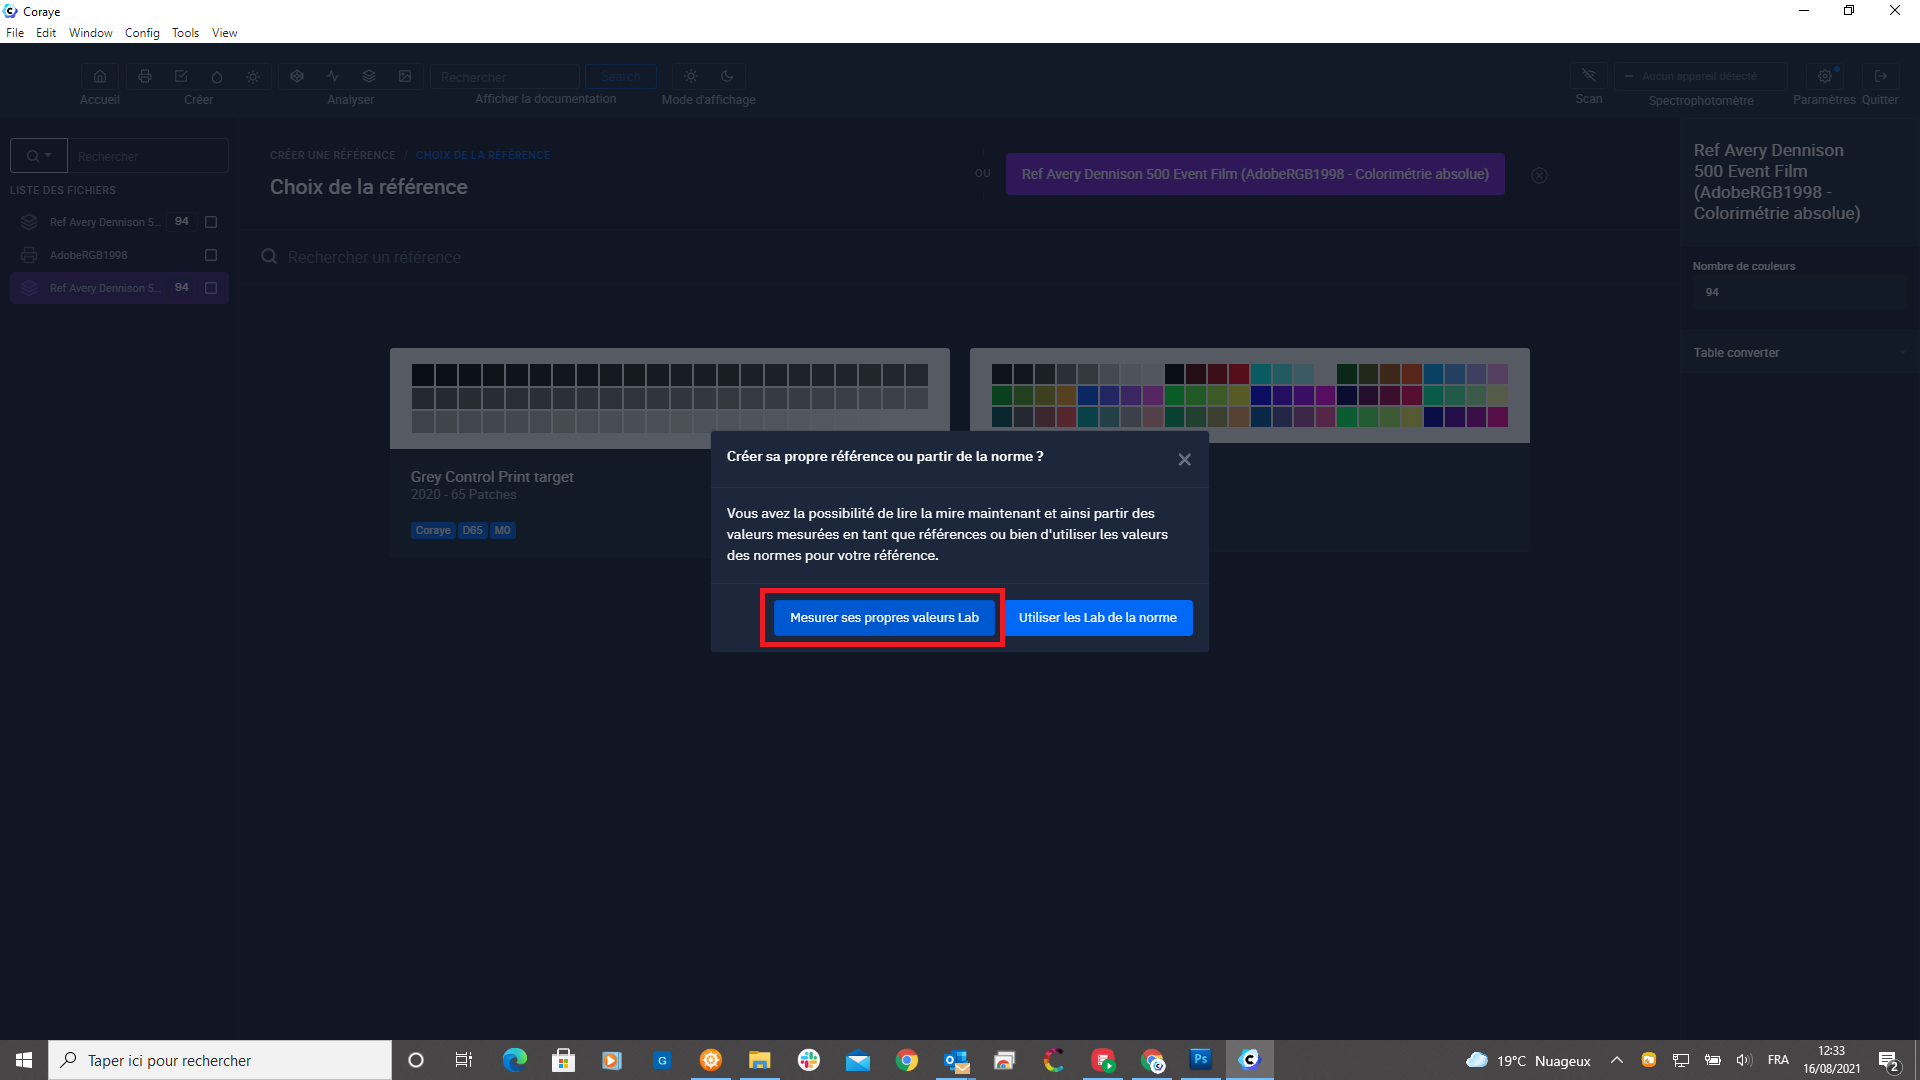
Since the Adobe RGB 1998 reference space is larger than the colors your printer is capable of reproducing, we will create the reference from a gamut that we will print and then measure later.
So the reference colors will be the Lab values actually reproduced by the printer.
Click on the "Measure own Lab values" button
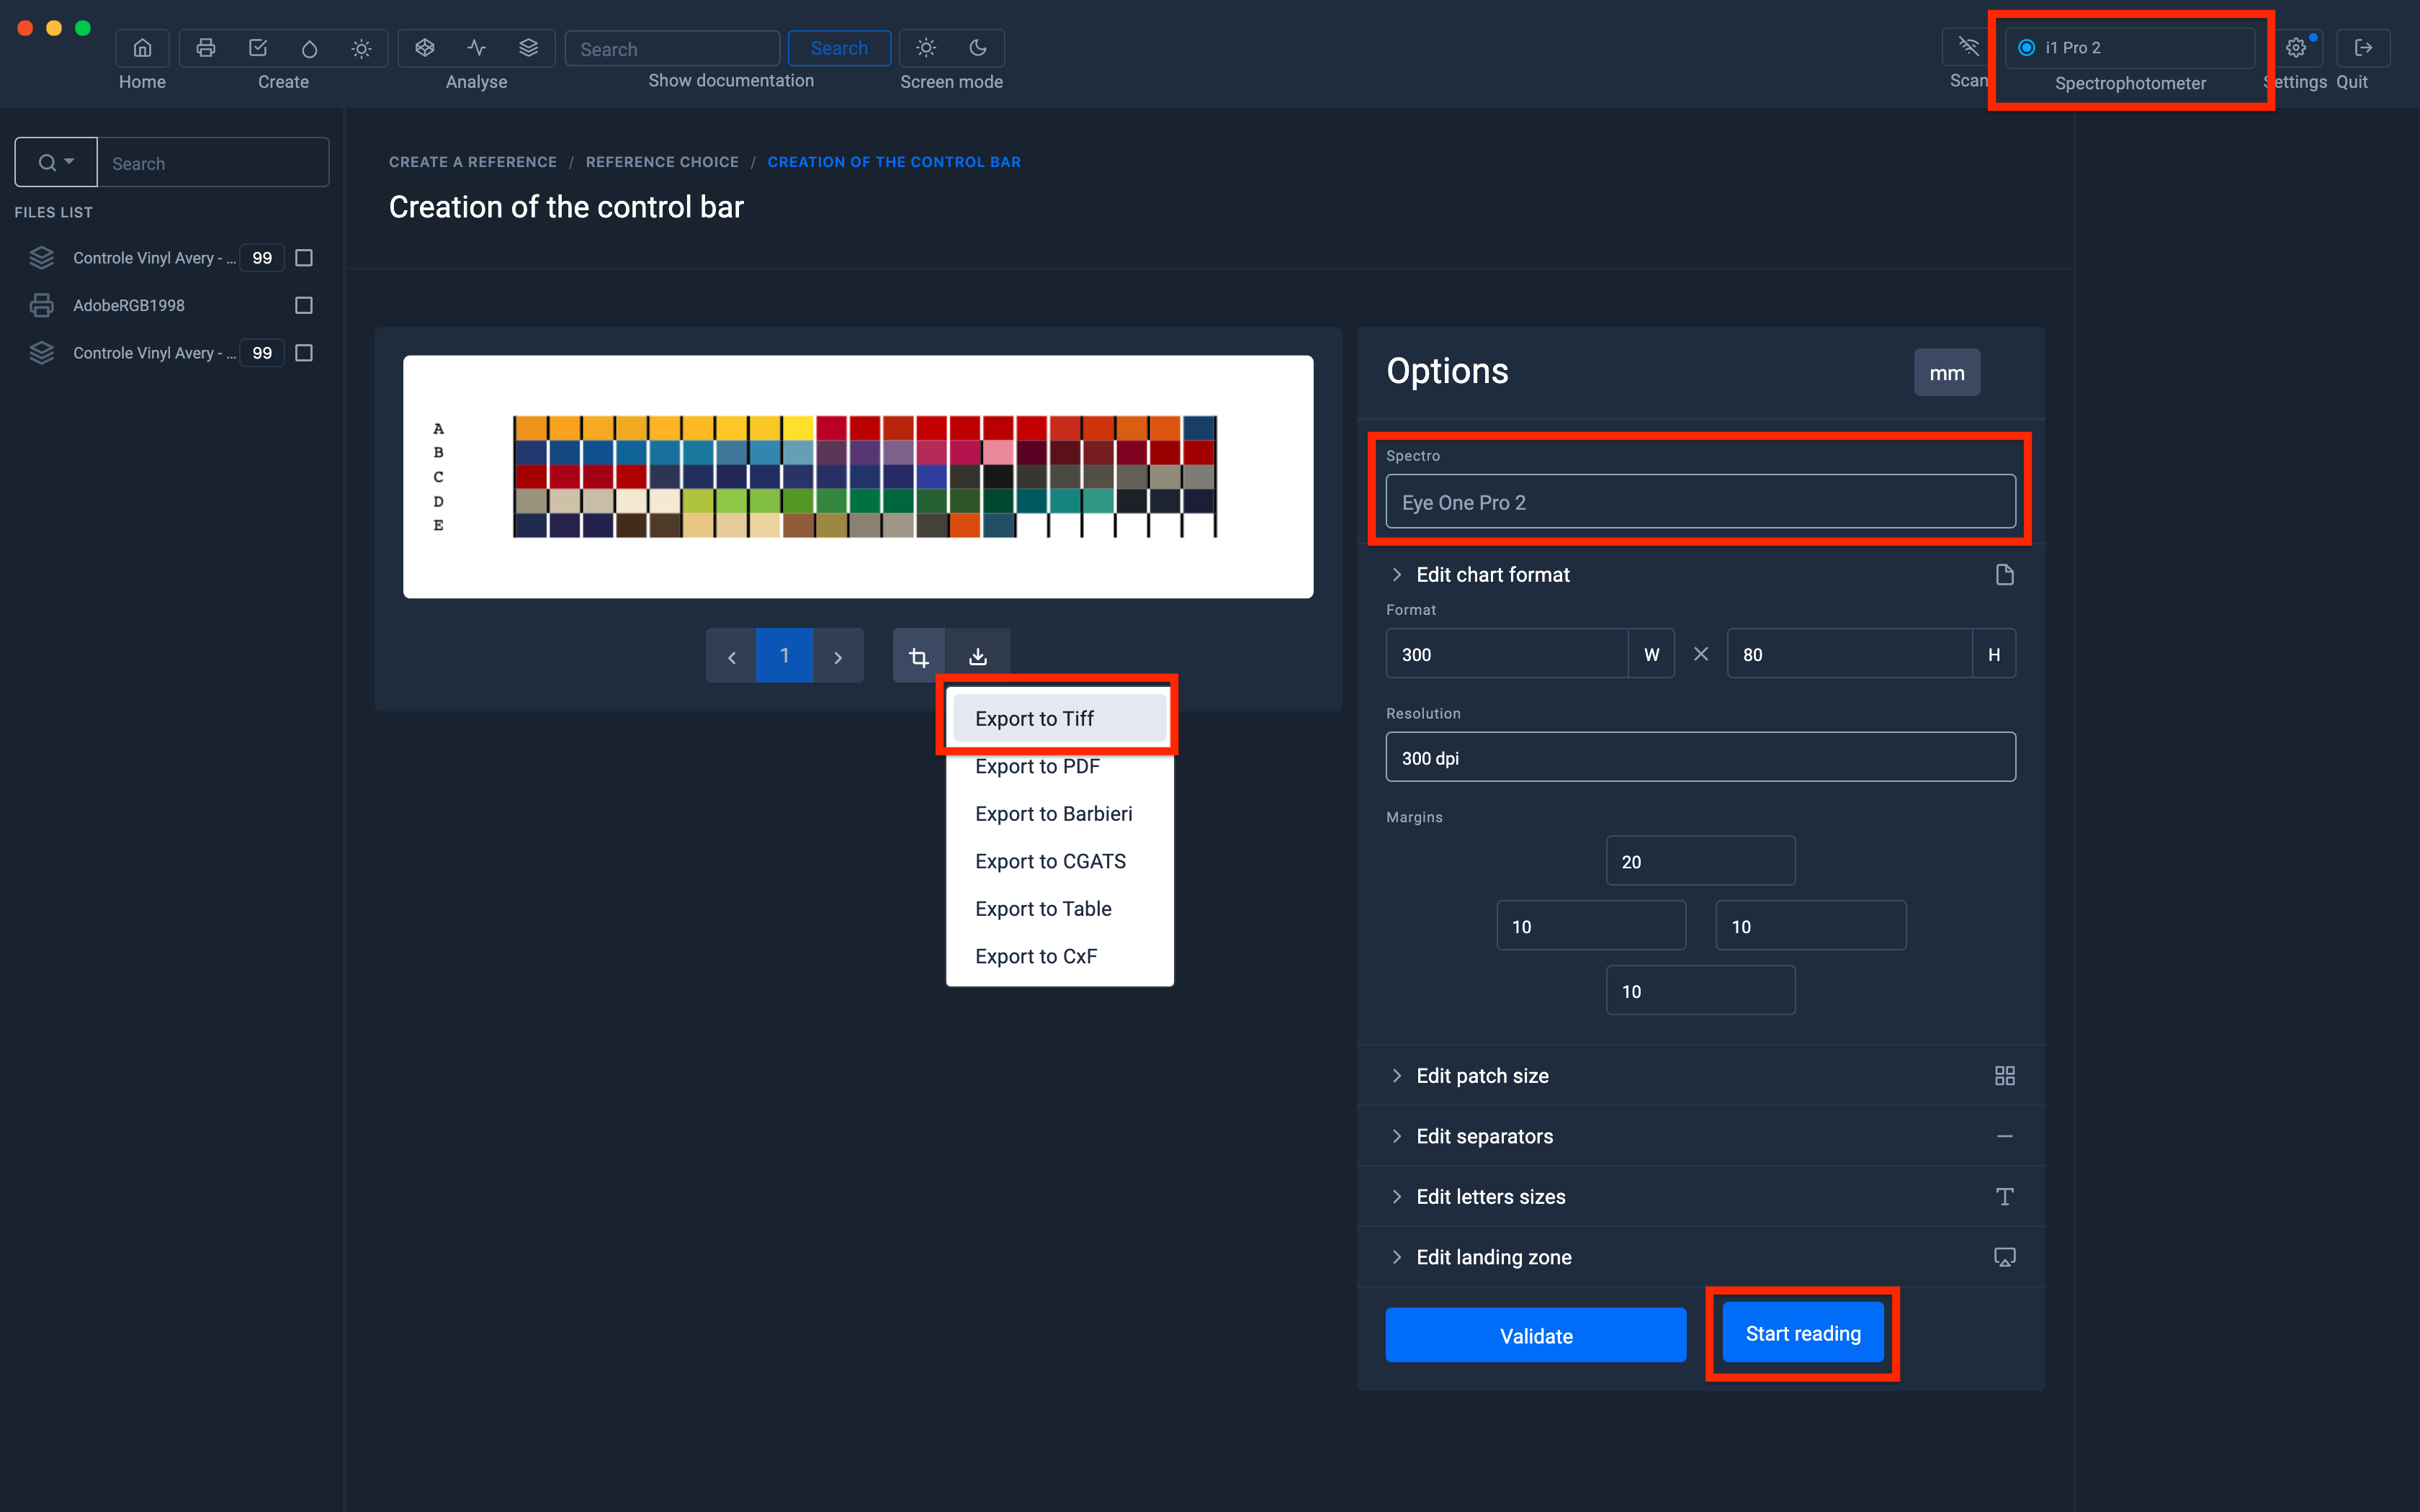
Choose the format of the range according to the spectrophotometer you are using
To find out more, see the chapter: Customizing charts
Export the range in Tiff (RGB) format to print it on your freshly calibrated printer.
When the range is printed, click on "Start measurement".
The range is saved in Tif or Pdf format depending on the printing system.
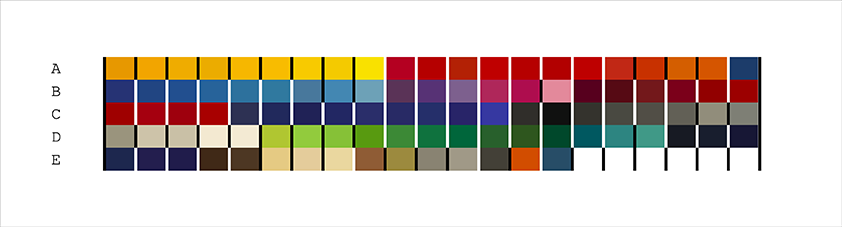
Select the measurement parameters according to the spectrophotometer you are using
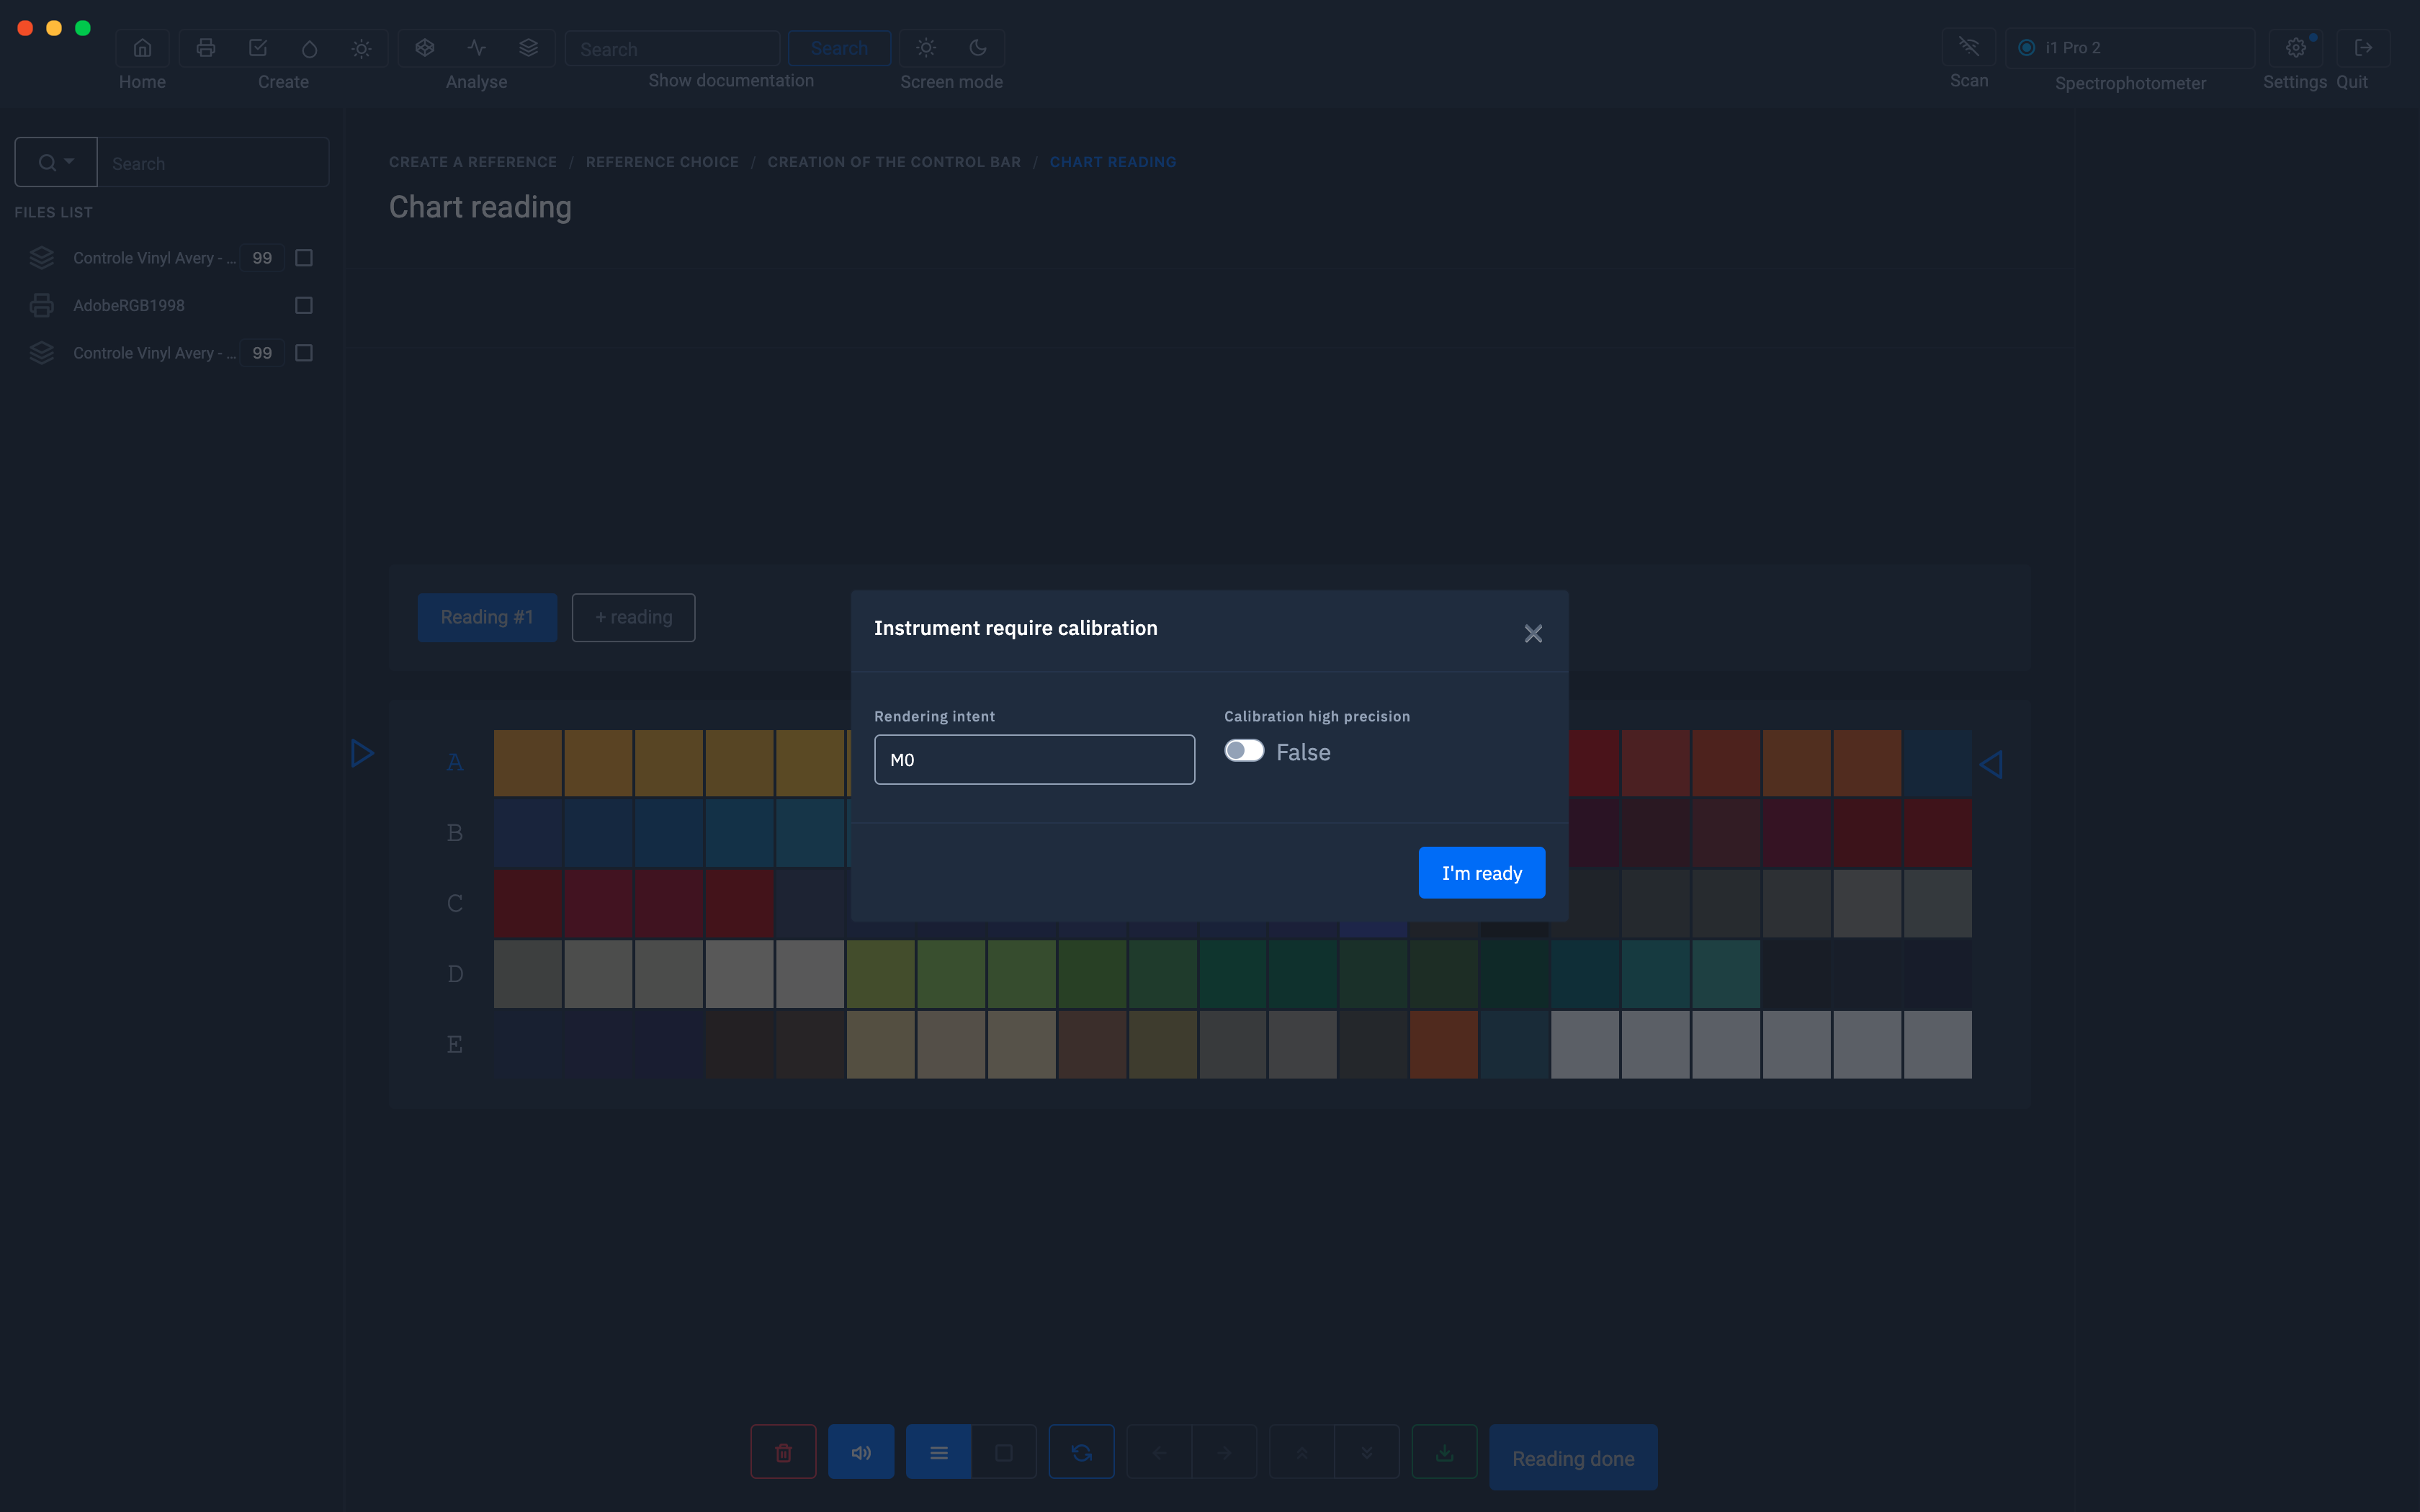
Click on the "Start calibration" button.
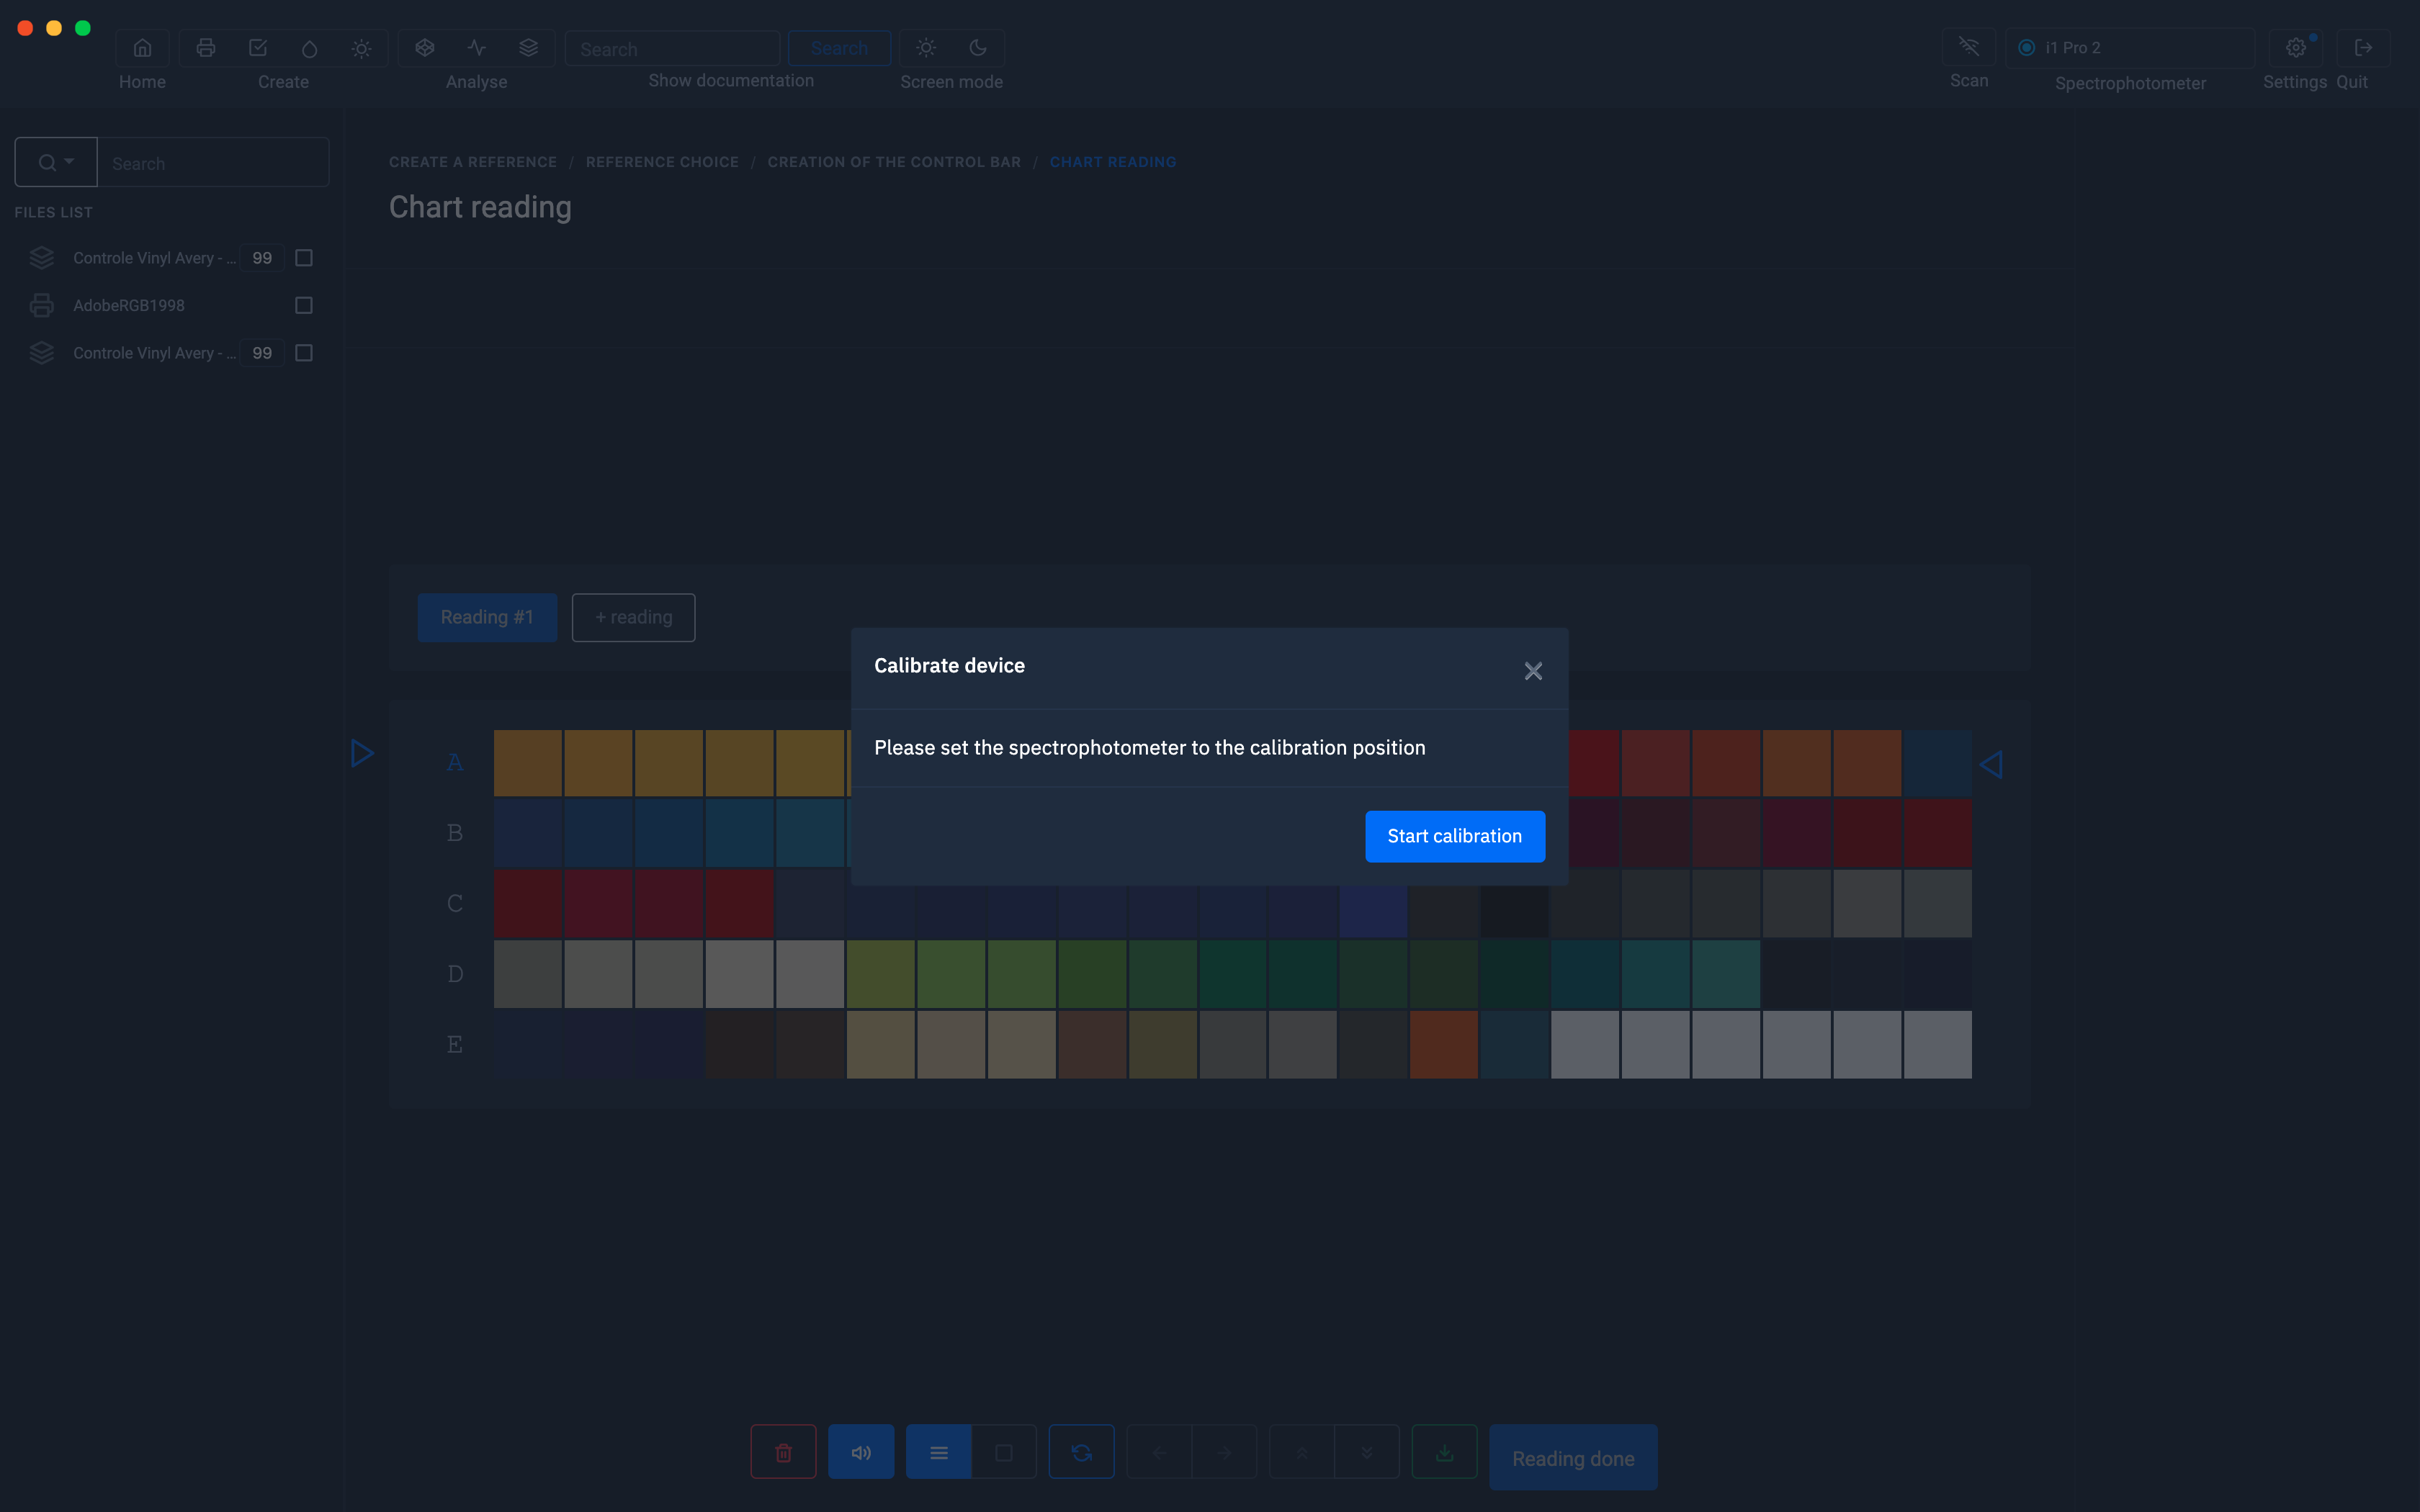
Measure the lines of your range

When all lines are measured, click on the "Measurement Complete" button
In the information window, only the name of the setting is mandatory.
The other information is optional.
Then click on the " Save and exit " button.

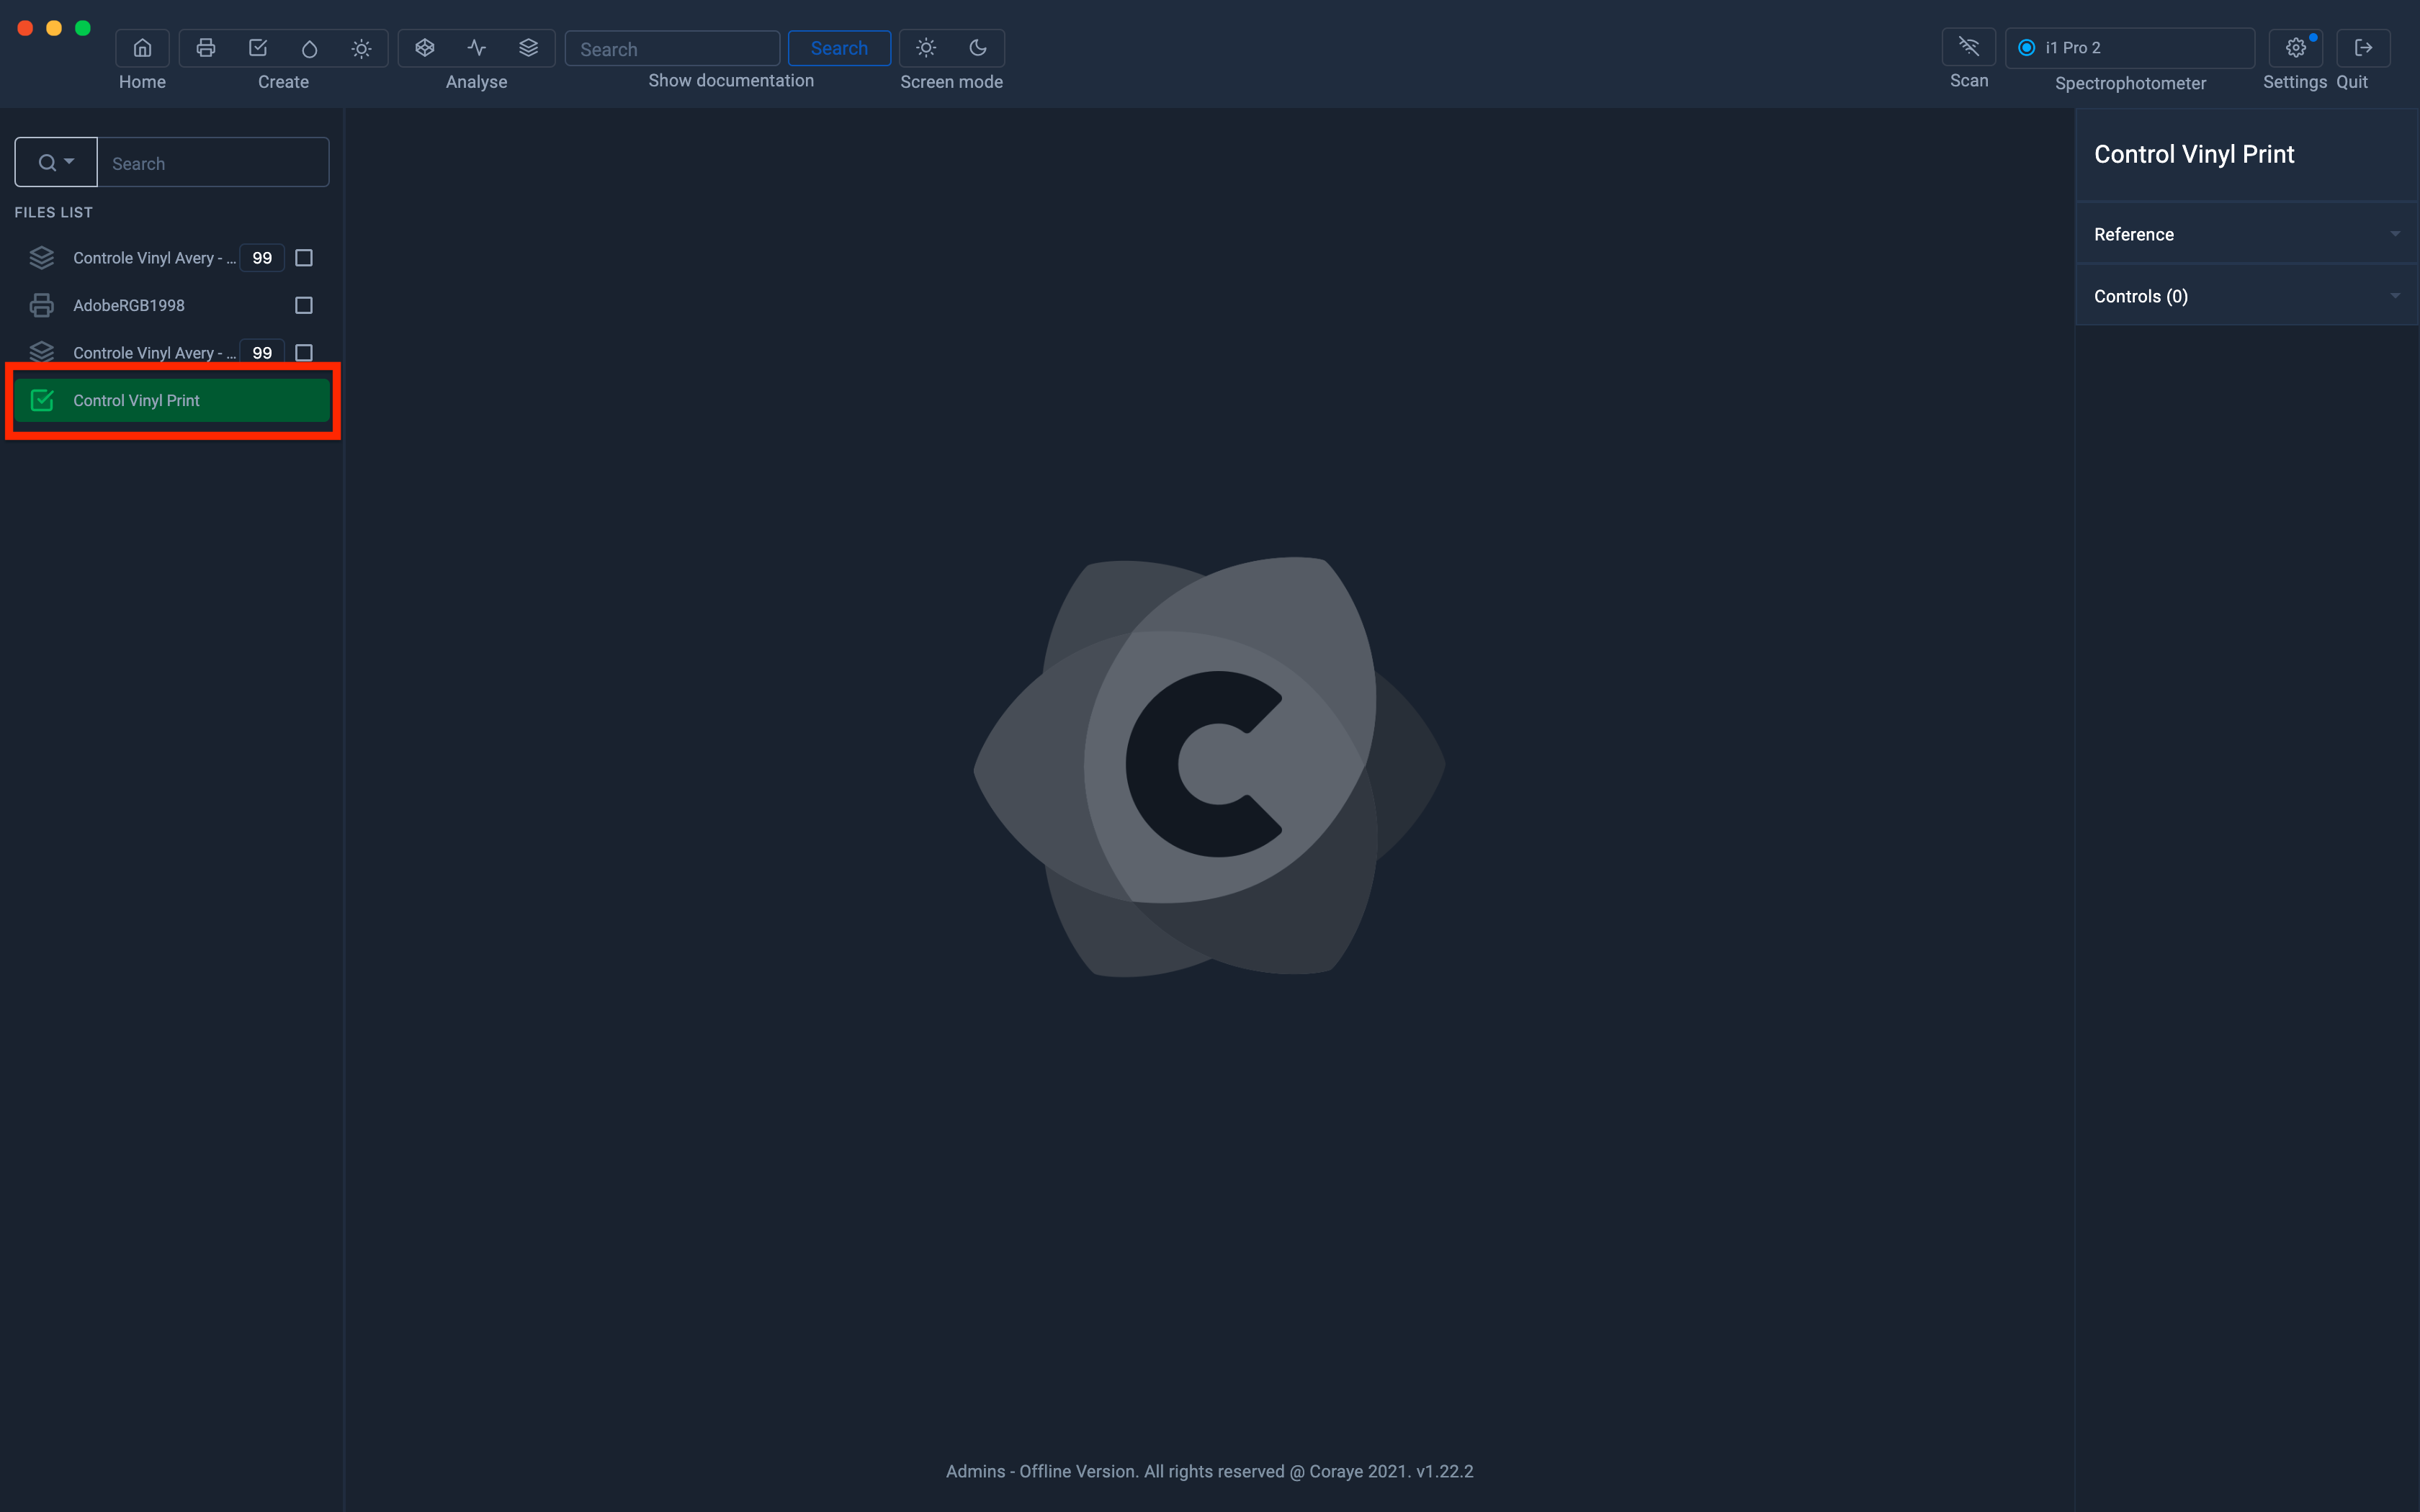
The new Print Control file appears in the left column.
The next steps are to edit the tolerances and check the prints.
For more information, see chapter: Editing tolerances
To find out more, see the chapter: Checking a range