Barbieri Gateway & Chart Generator
Another way to interface with Barbieri spectrophotometers is to exchange files with the Gateway software developed by Barbieri.
The whole process is based on import / export of data via CGATS file format.
Create your target
You do not need to create a new test pattern with "Test Pattern Generator" every time you need to use Gateway. You can still use the same staff. But it would be interesting to create four different targets with their data.
- RGB calibration target
- RGB characterization target
- CMYK calibration target
- CMYK characterization target
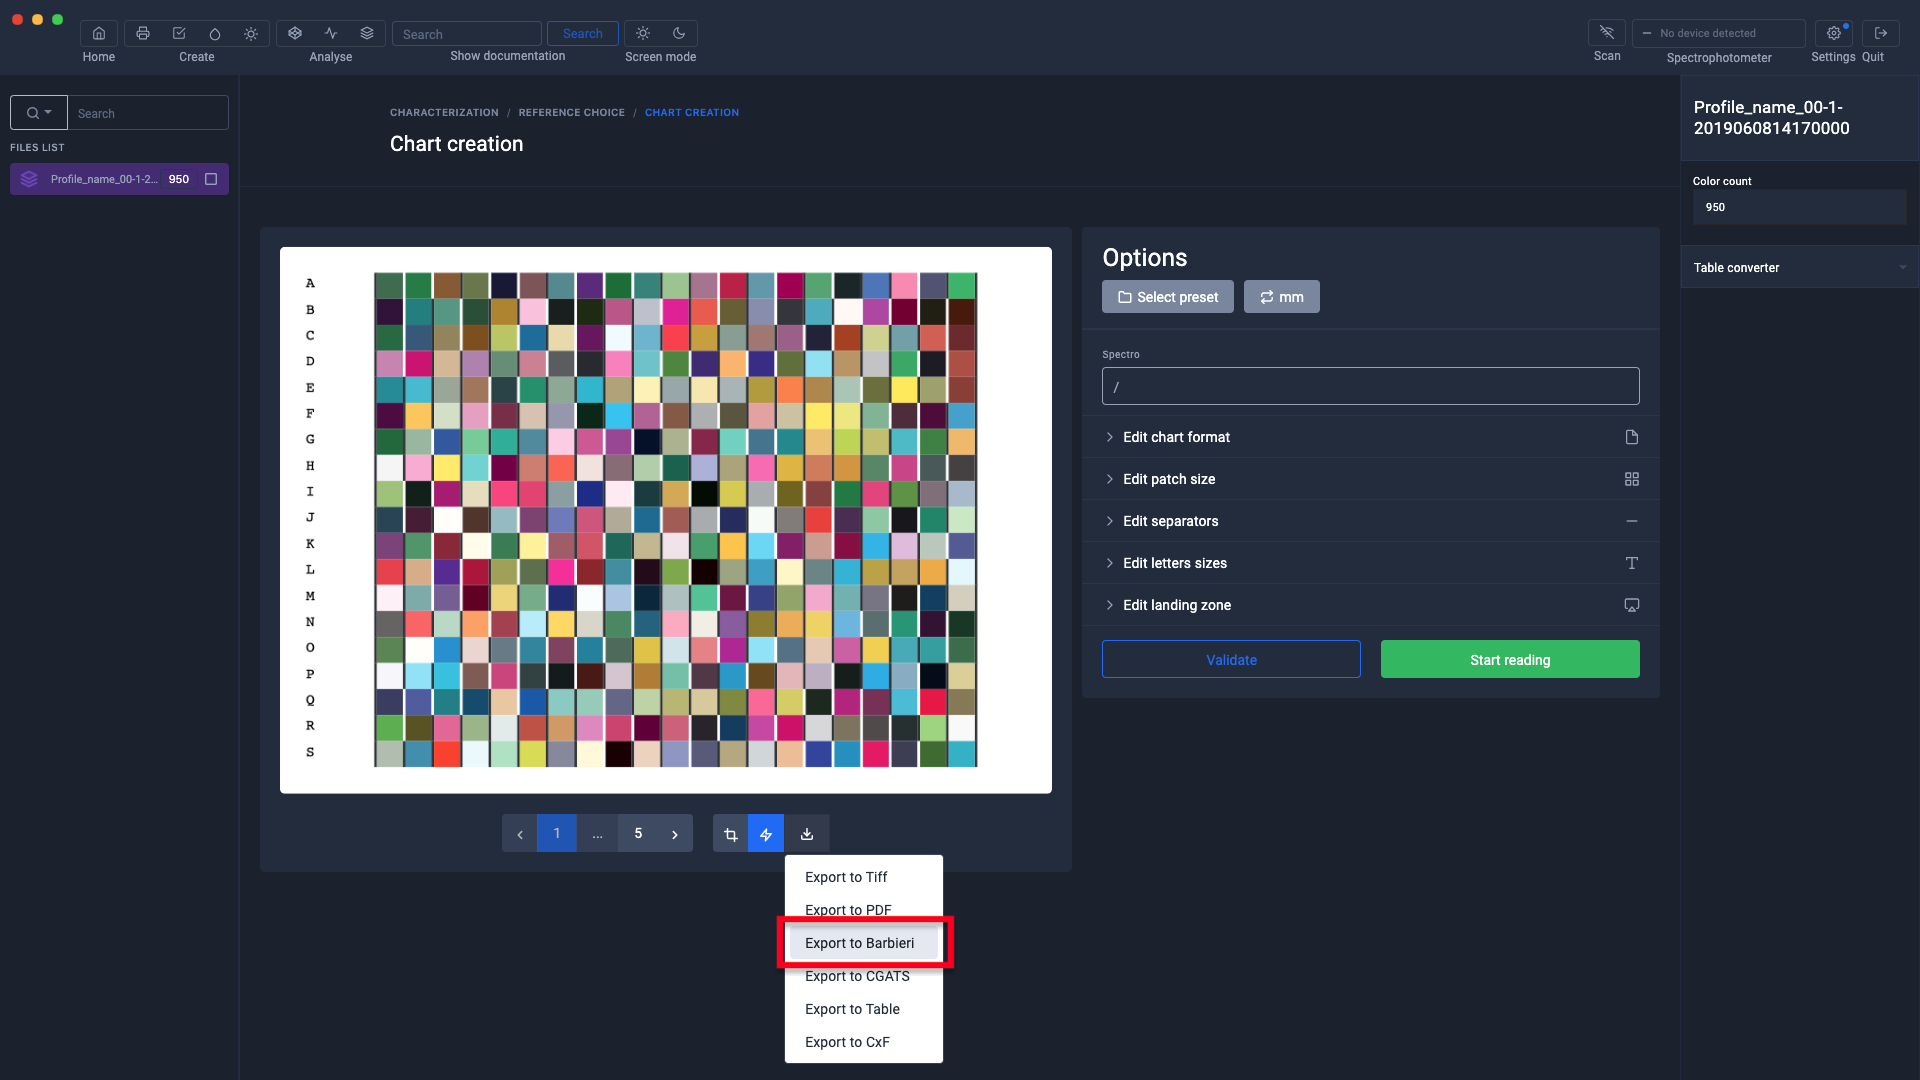
With Coraye, create your target by following the process described in “Creating a media profile”.
But this time, instead of directly clicking on the "Next" button.
Click on "Export to Barbieri".
To find out more, see the chapter: Creating a profile from a standard test pattern
For more information, see the chapter: Create a profile from a calibration
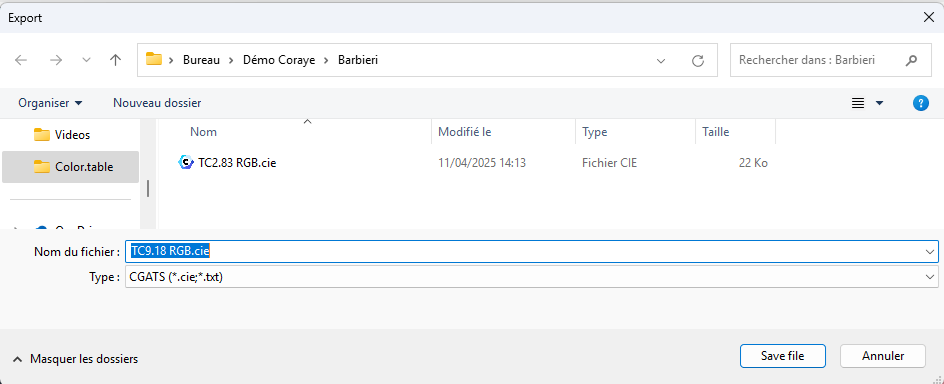
Save the chart in a folder to import it later into the Barbieri Chart Generator software.
Open the Barbieri Chart Generator app
The Chart Creator application is installed at the same time as the Barbieri Gateway software which you can download from:
https://www.barbierielectronic.com/service-support/#Software_downloads
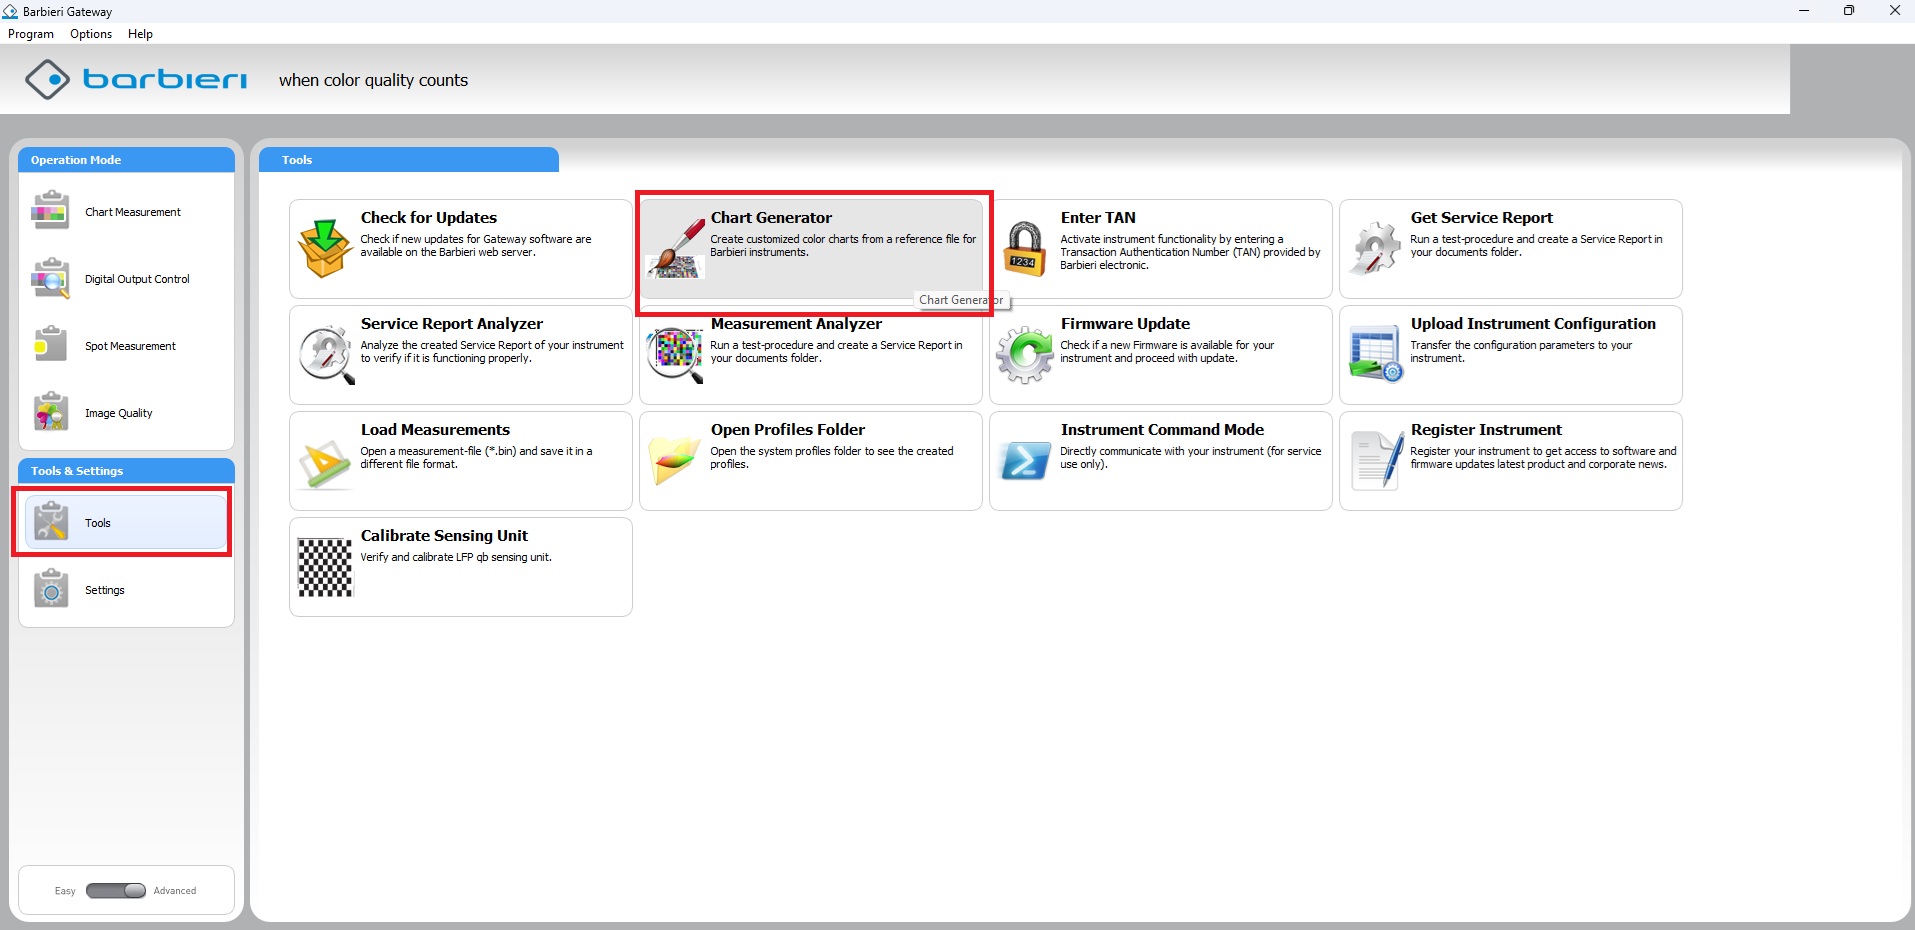
Launch the Chart Generator software.
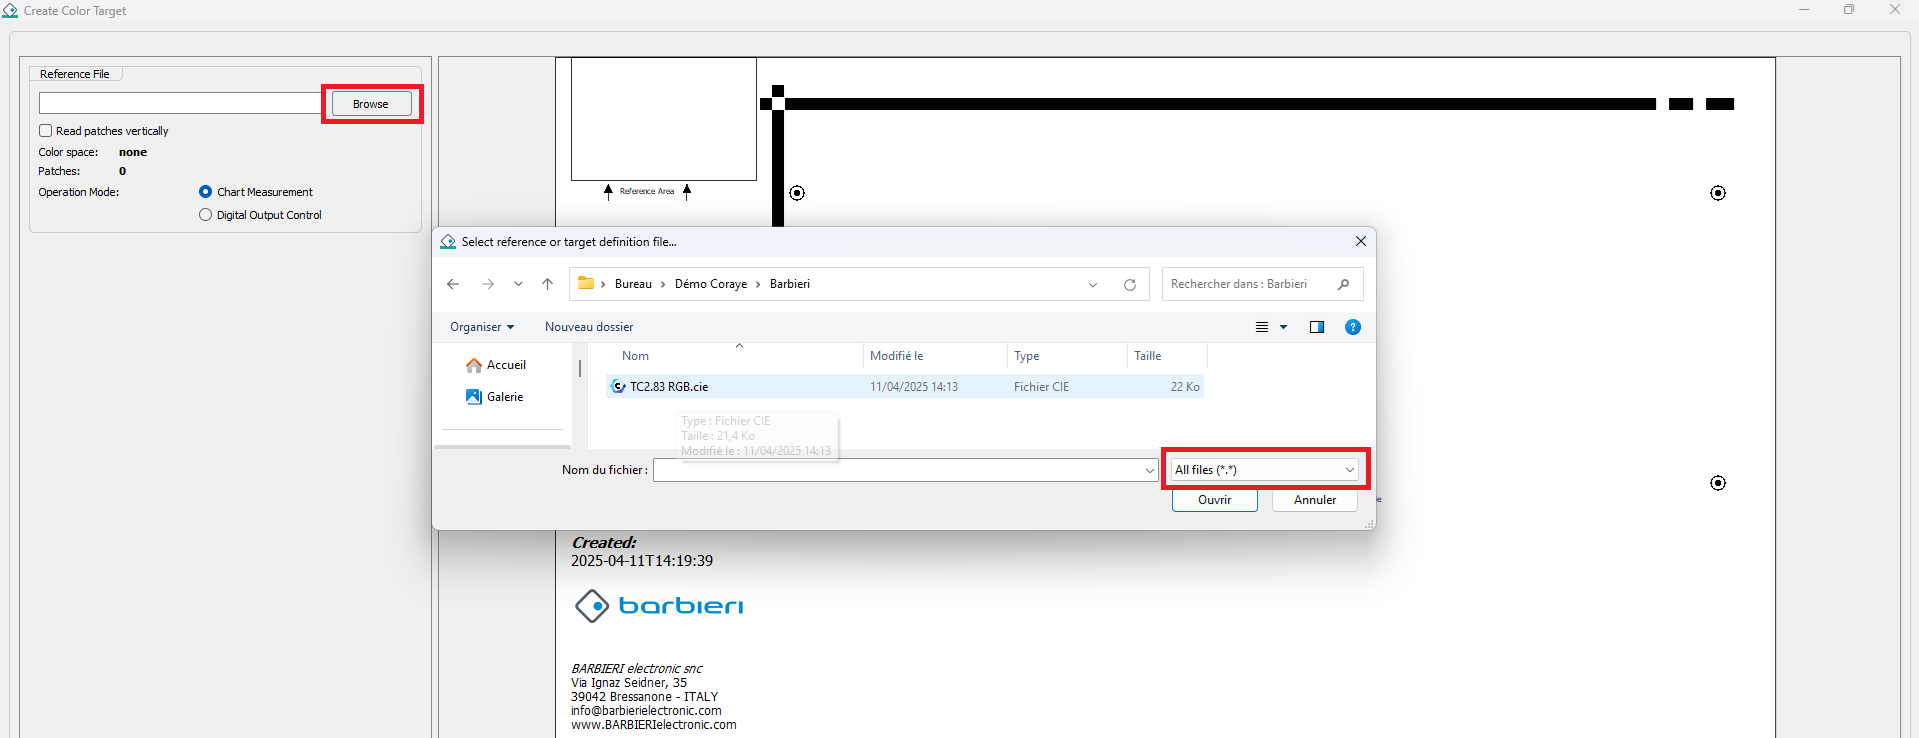
Select "All files" then browse to select the CGATS file created by Coraye.
Select the Barbieri spectrophotometer model and paper size to print the test chart.
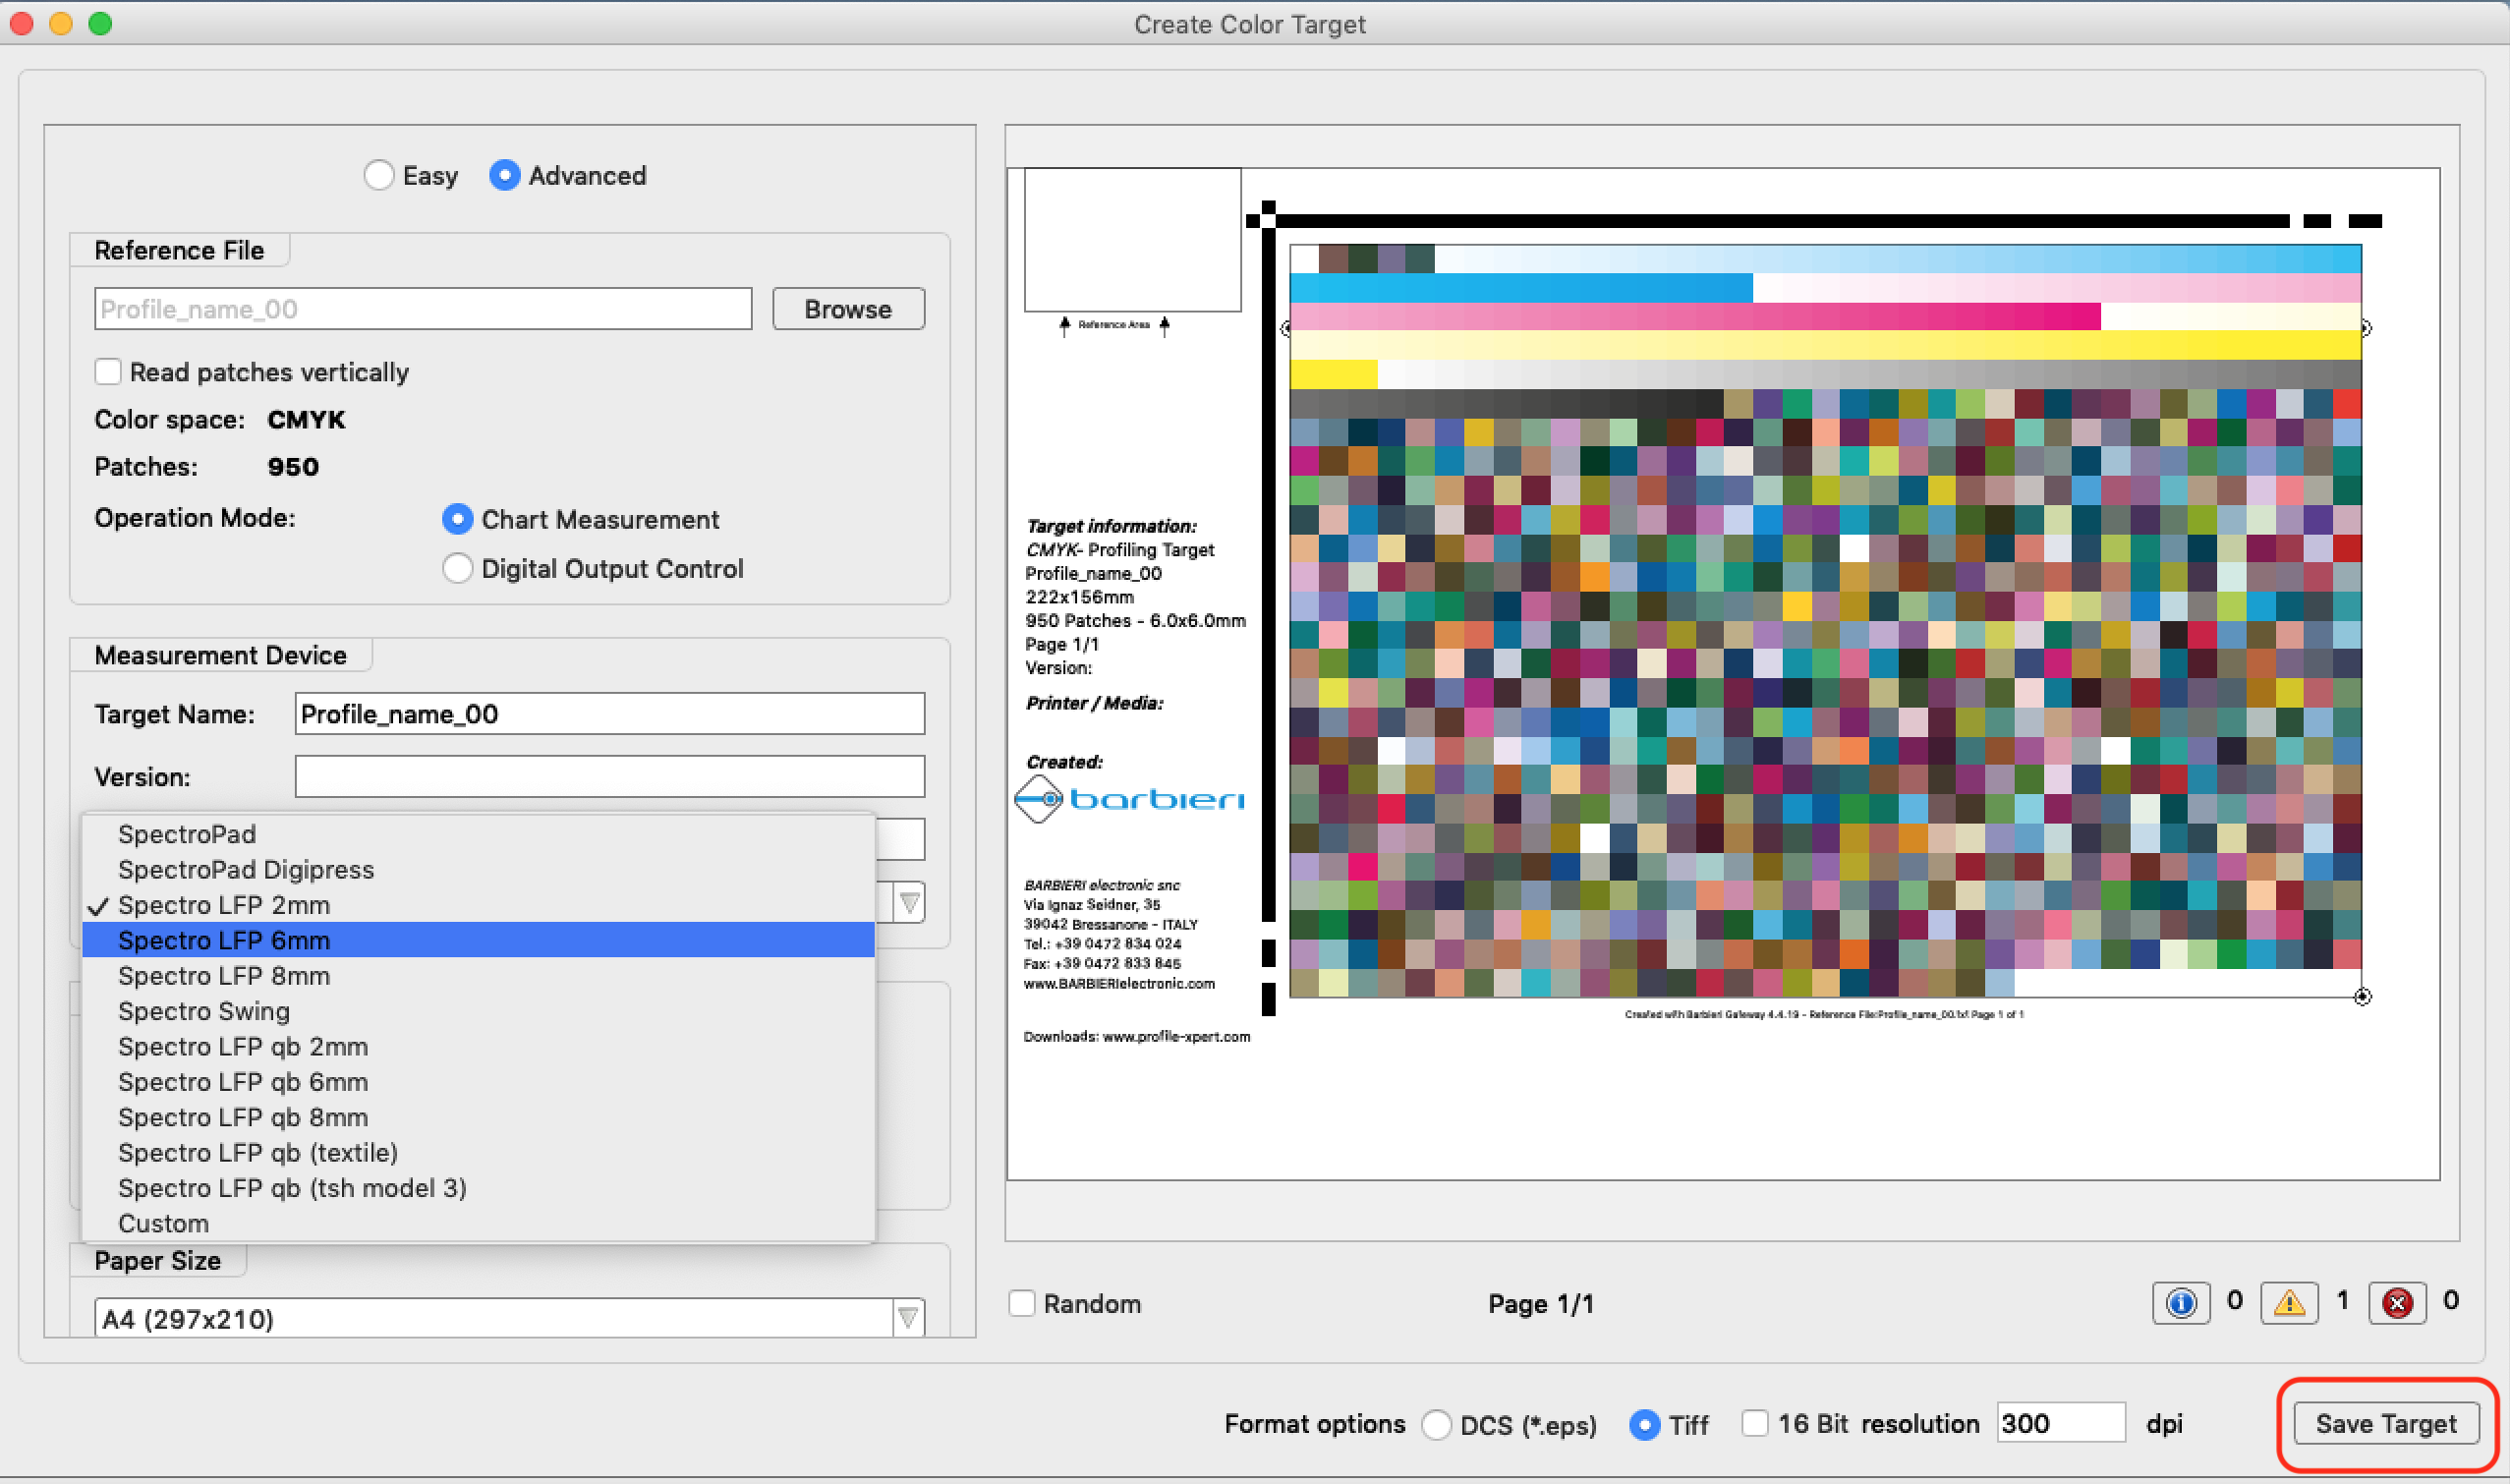
Click on " Save test pattern to create the test pattern and associated data.
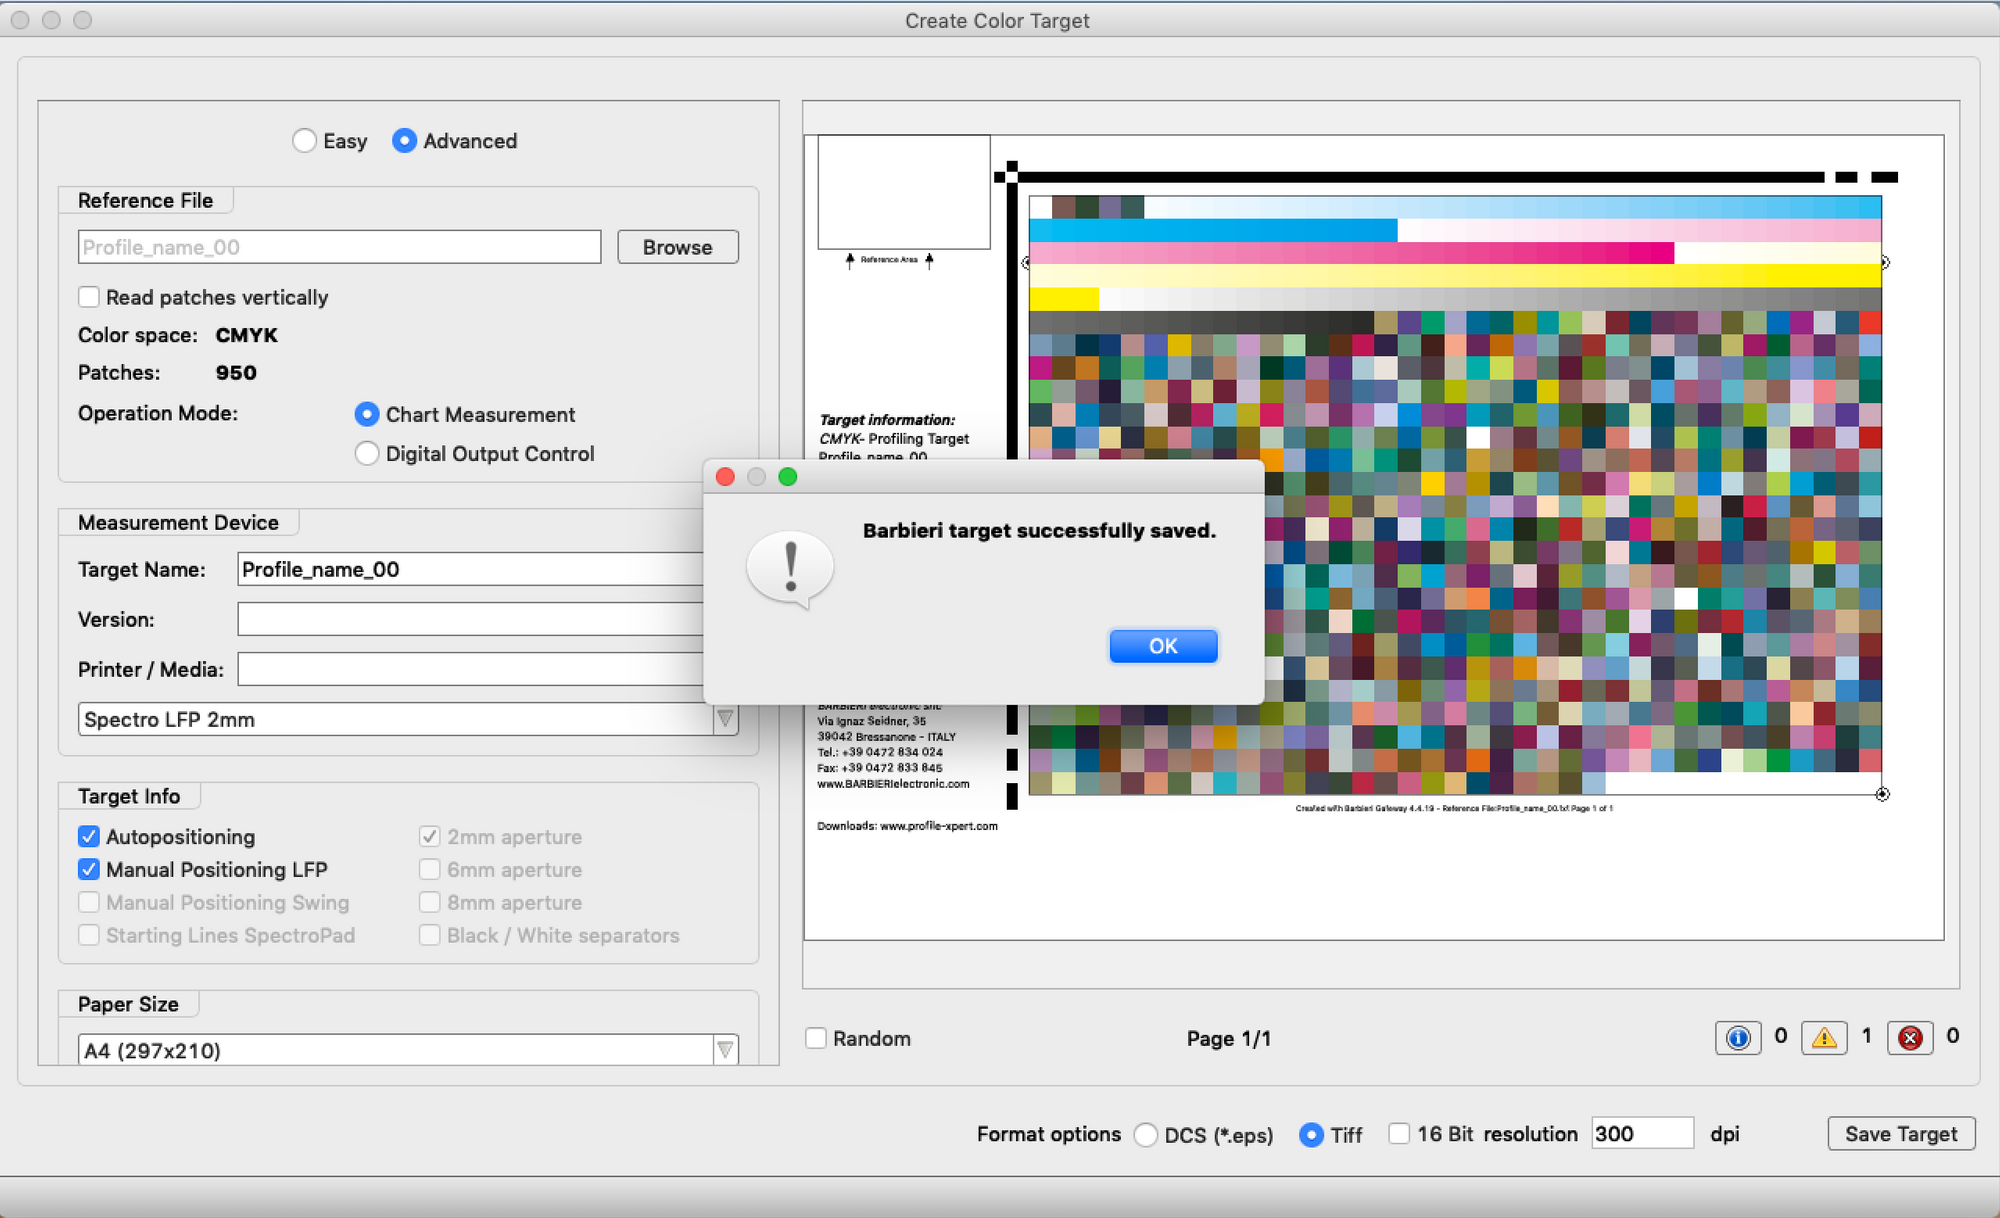
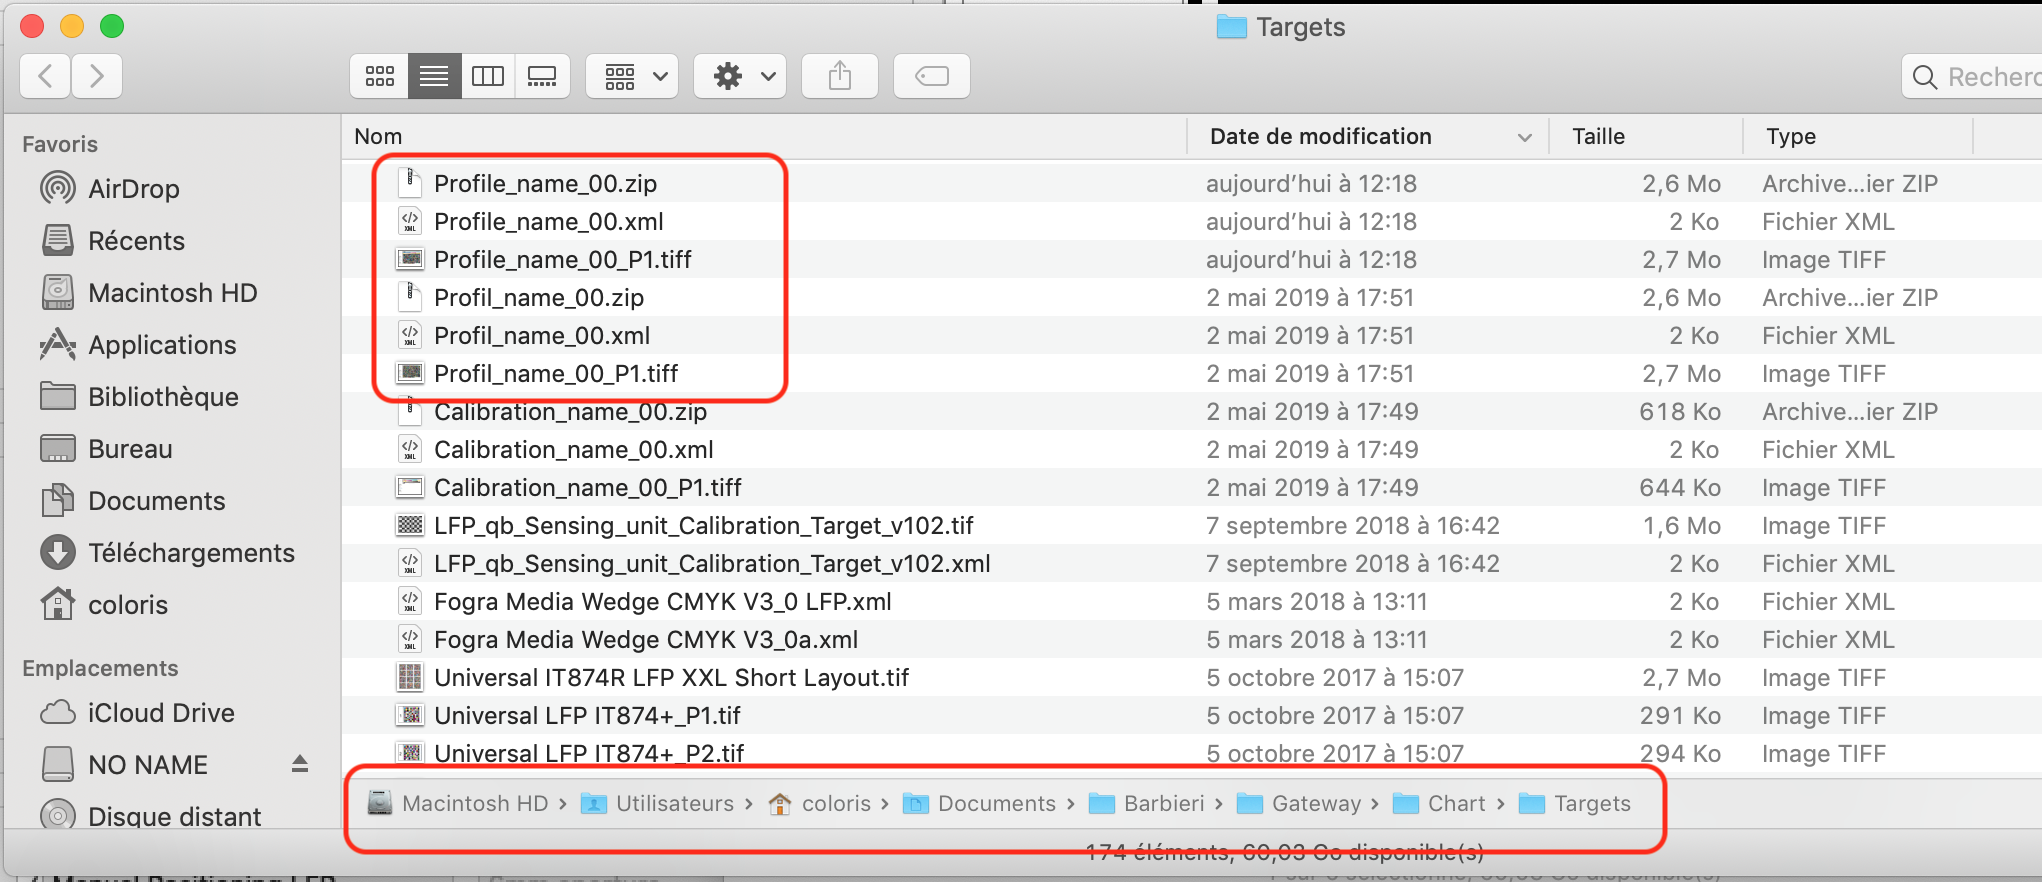
The data and patterns to be printed are stored in the " Pattern " folder. The default path is ../User/.../Documents/Barbieri/Gateway/Chart/Targets/
Print the Barbieri charter
The CMYK chart that we have generated is intended for the creation of a CMYK profile which will be used to characterize a printer controlled by a RIP.
Do not forget to deactivate the color management to print this test chart.
Print the test charts (Tiff Format).
Measure the Barbieri chart with the "Gateway" software
Start the Gateway software and create a new job.
You don't need to create a new "Job" every time you need to use Gateway. You can still use the same job. But it would be interesting to create four different jobs for:
- RGB calibration chart
- RGB characterization chart
- CMYK calibration chart
- CMYK characterization chart
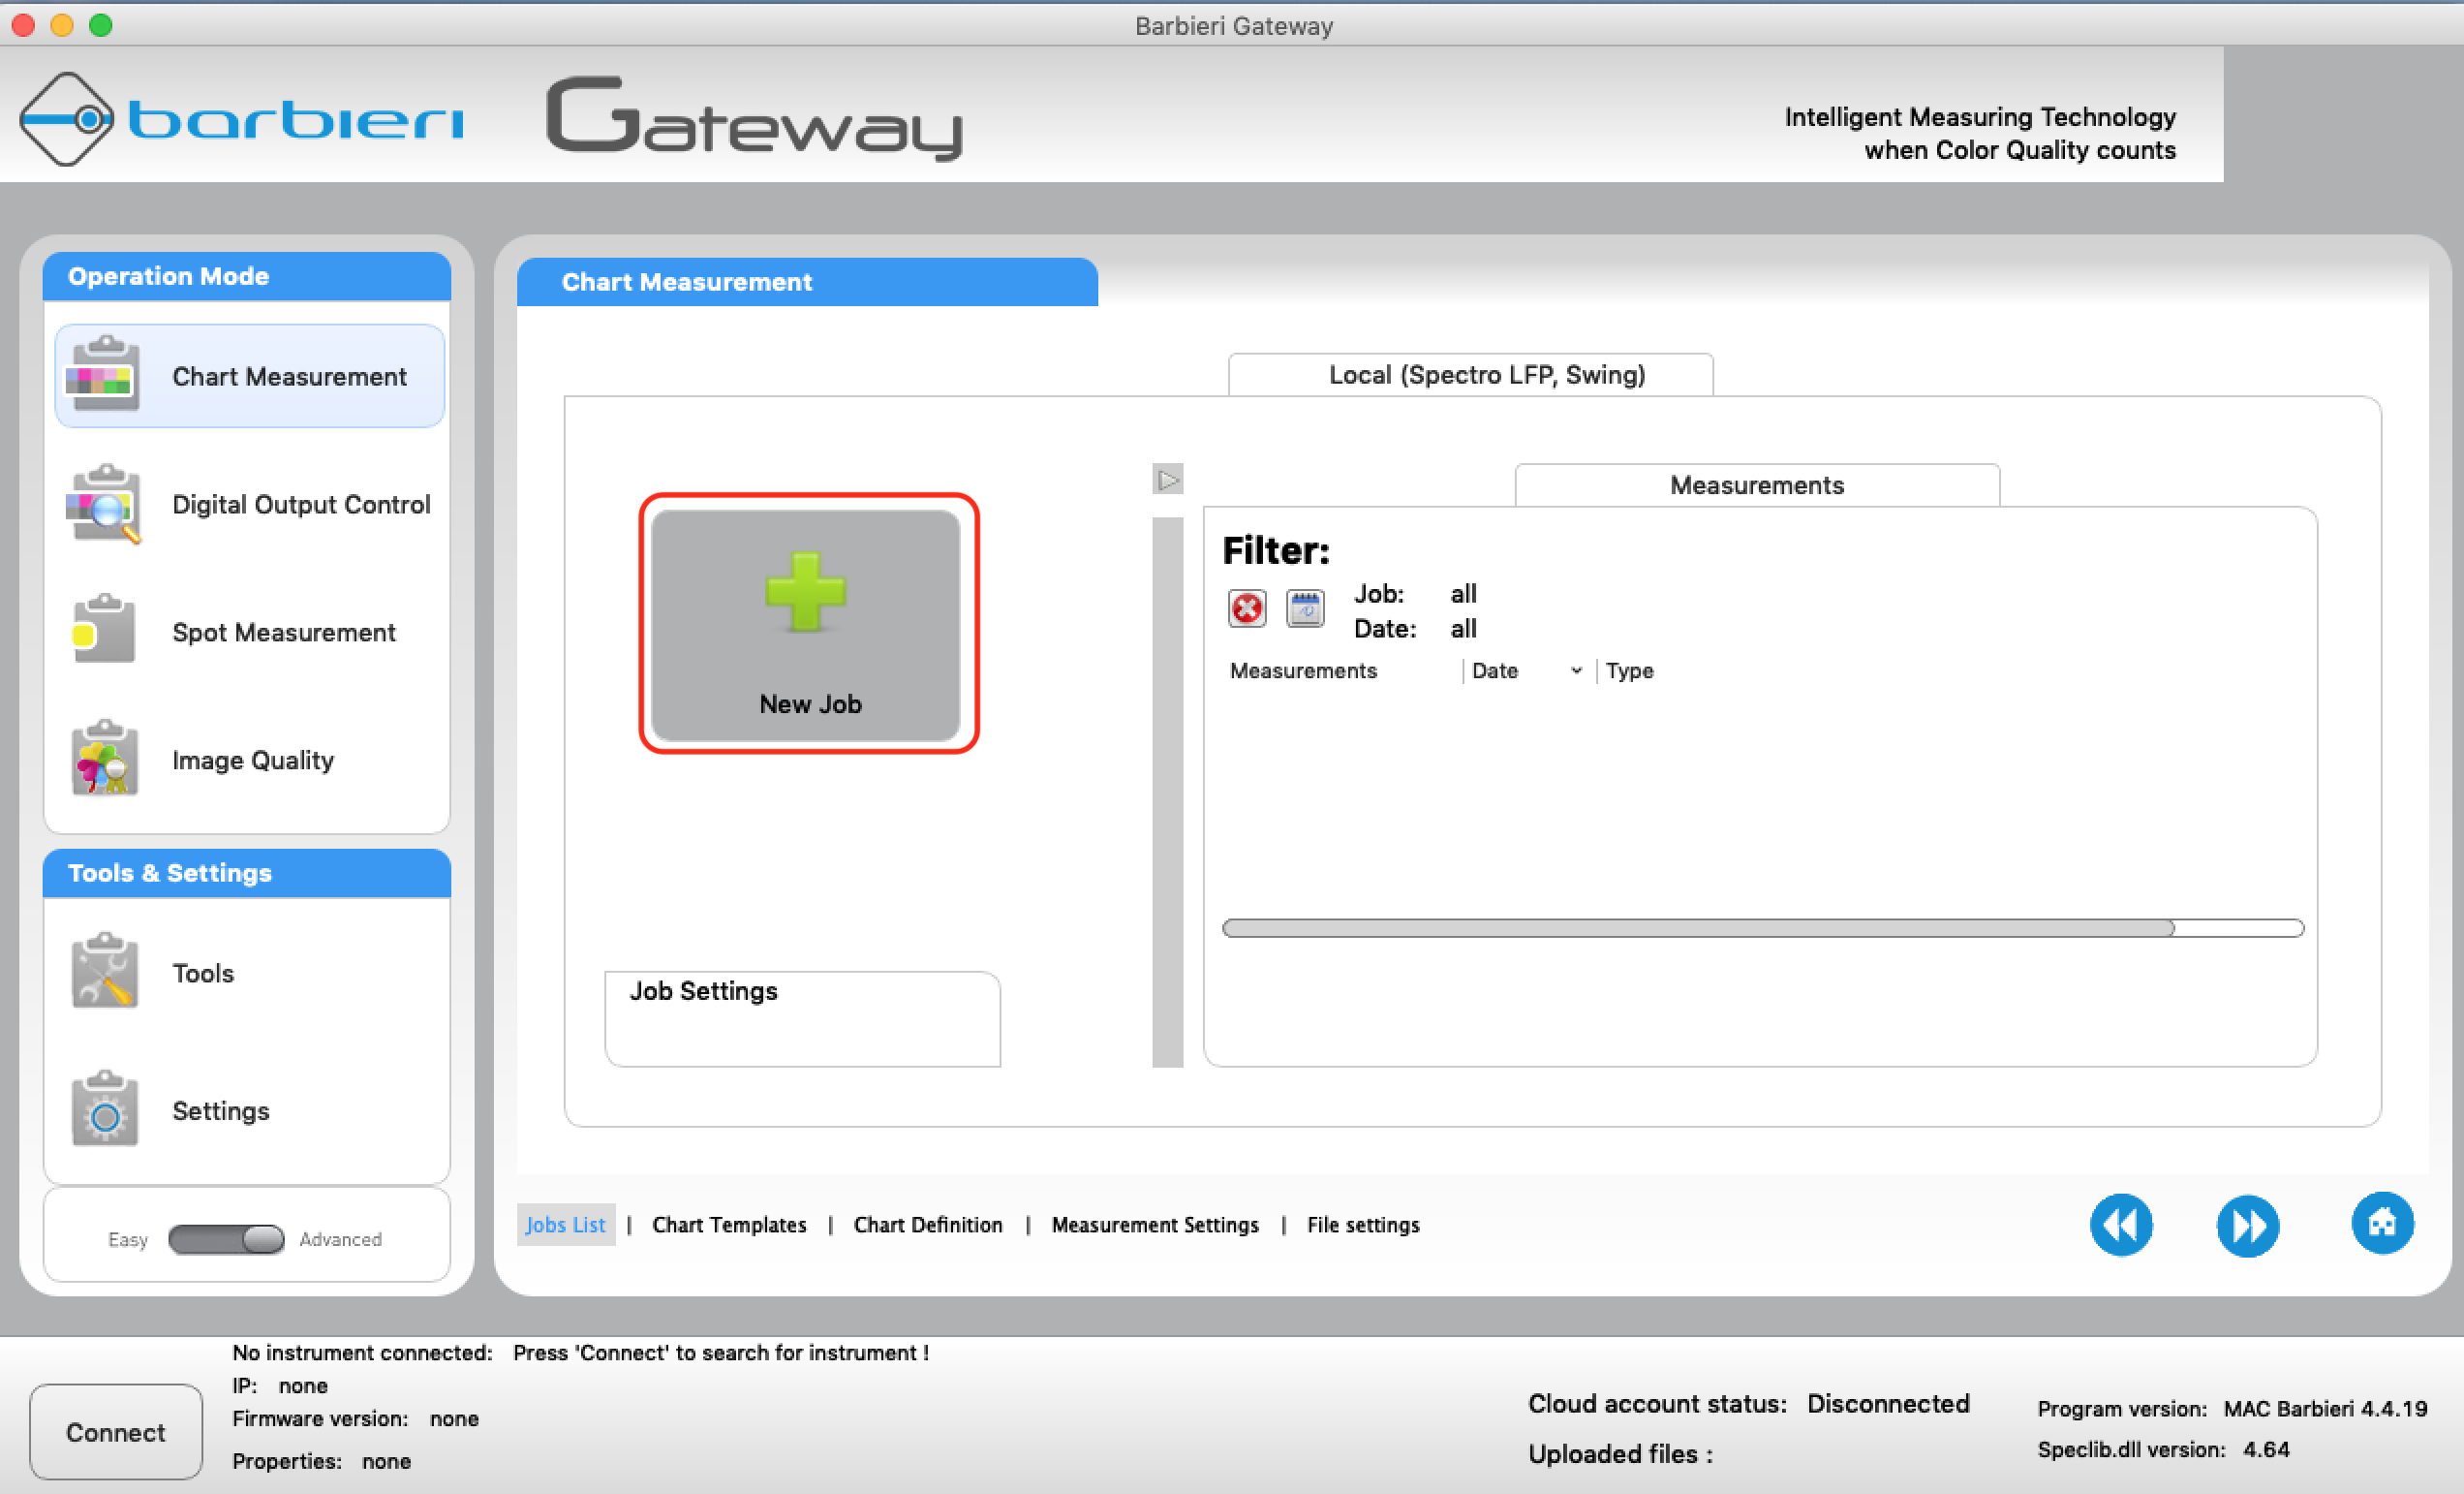
Click on the "Custom" folder
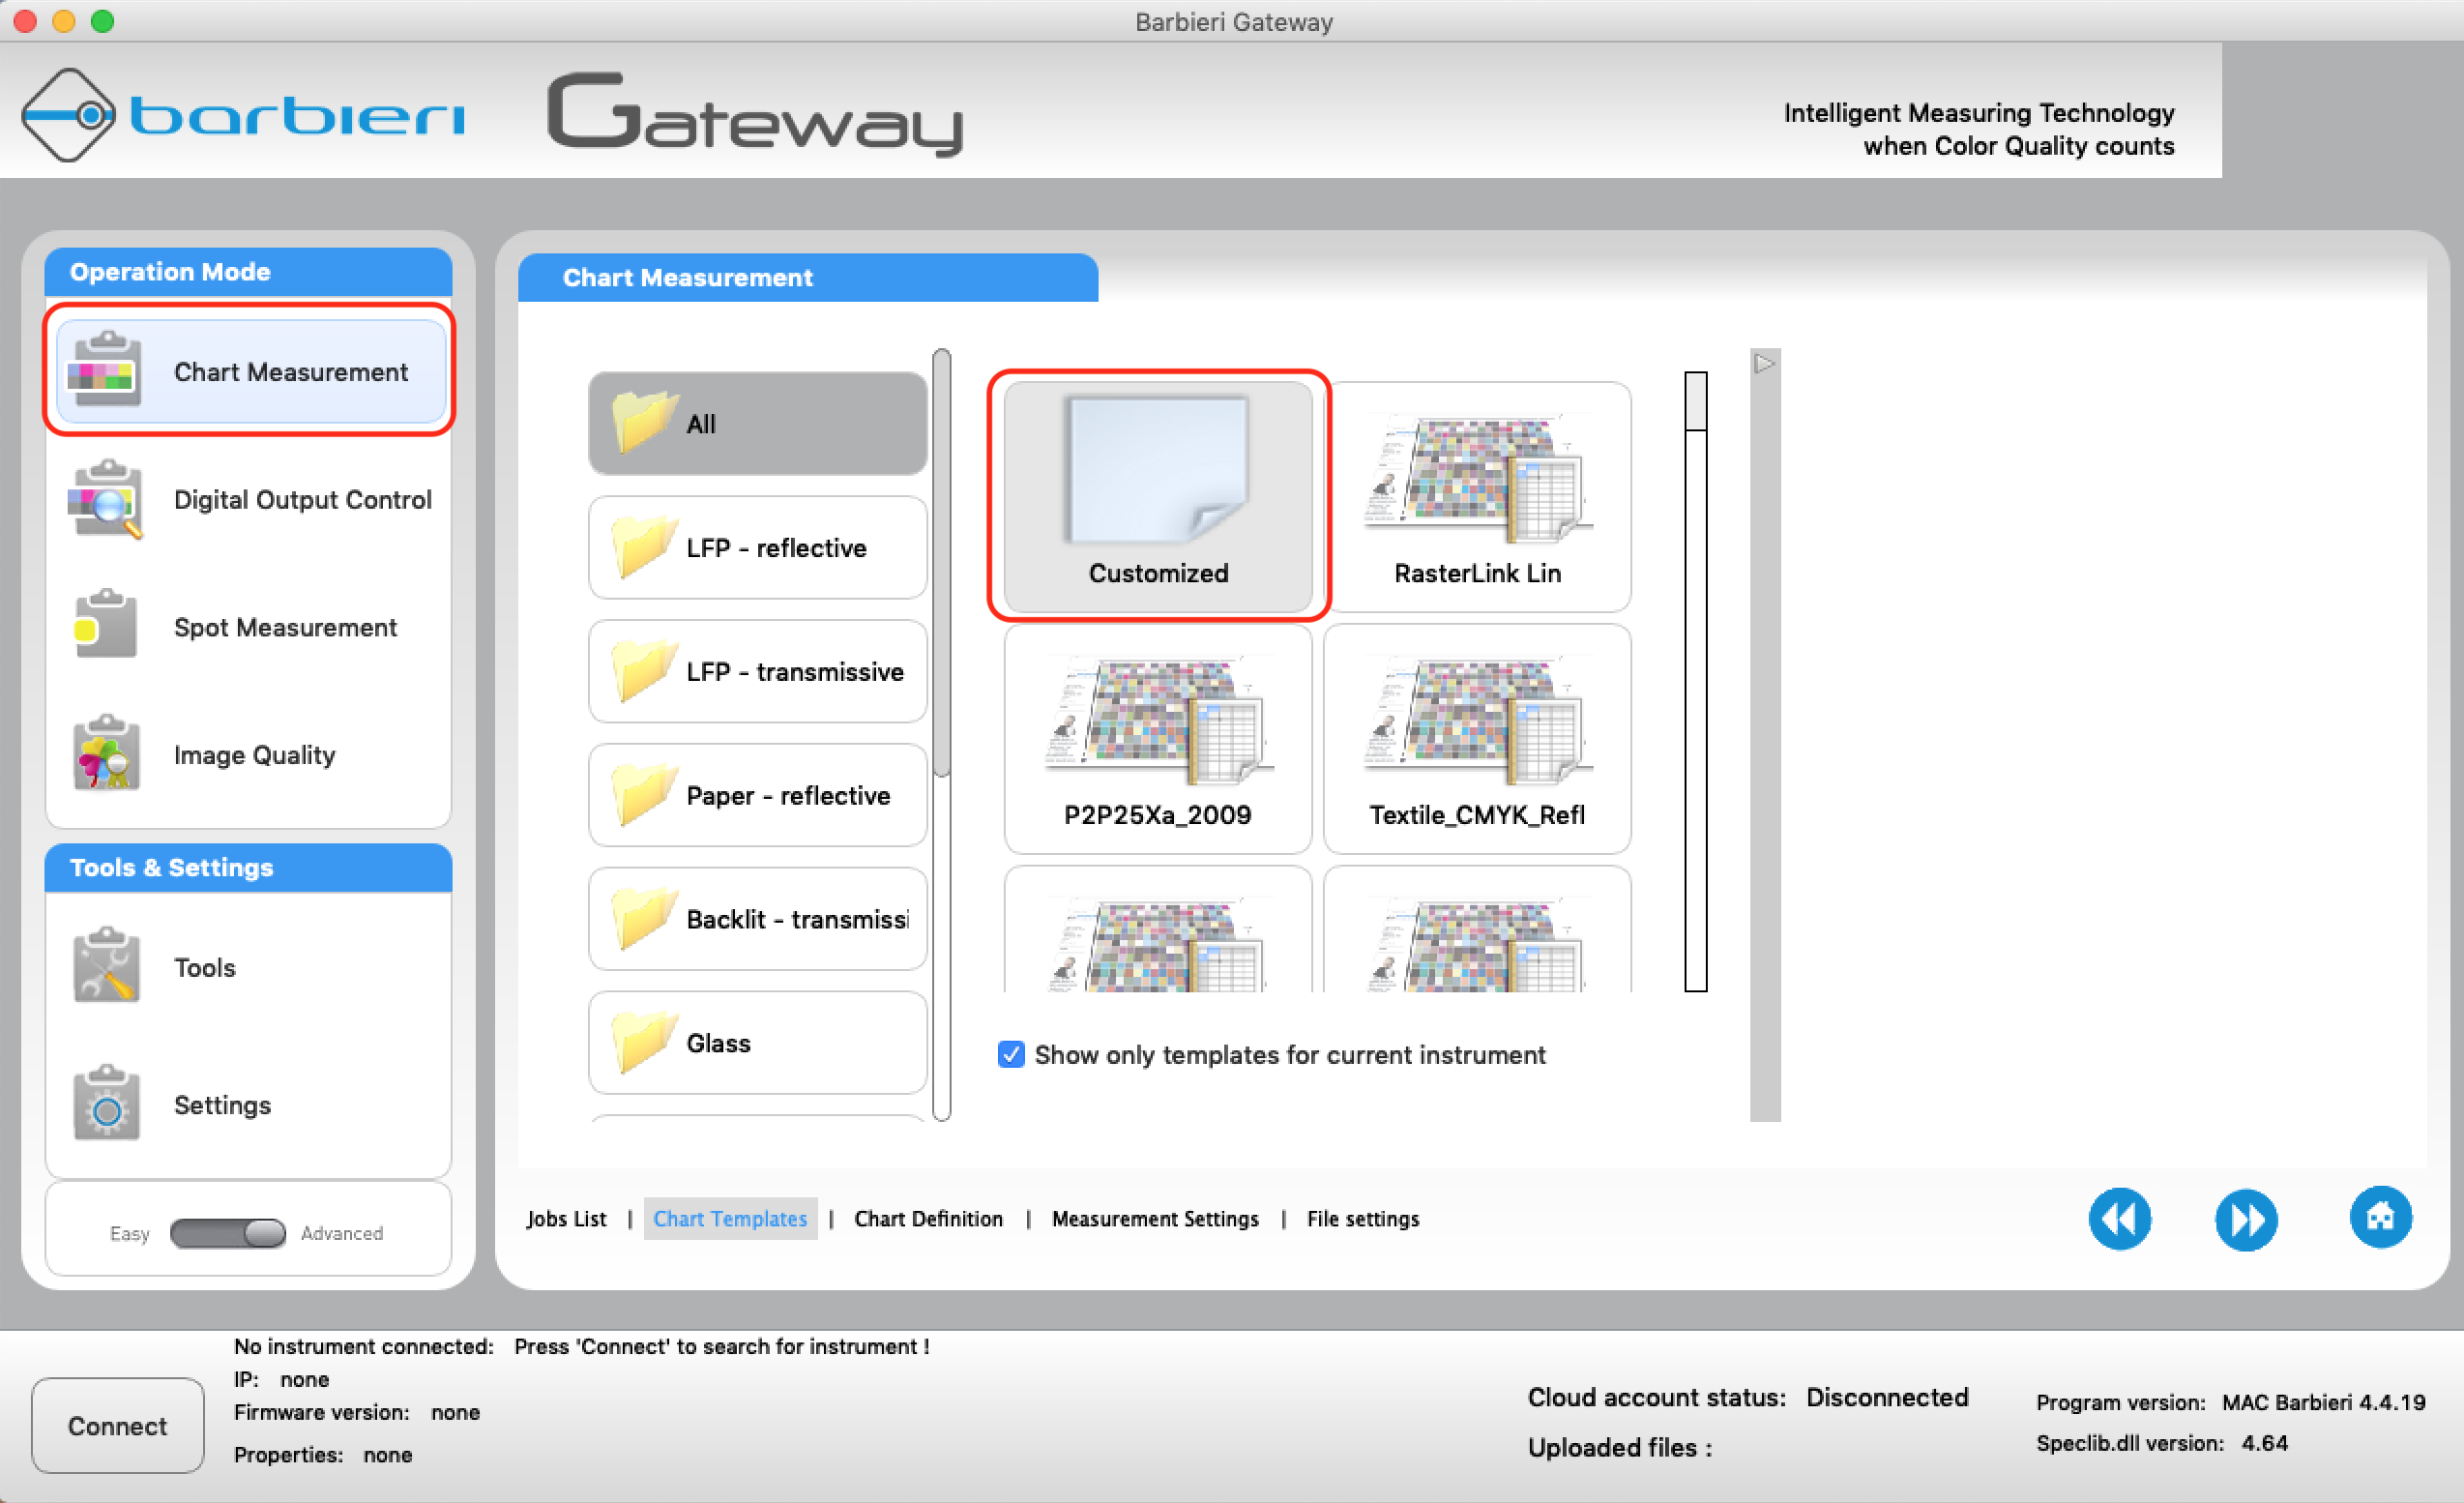
Select the Barbieri target created previously with "Chart Generator".
Define the measurement parameters
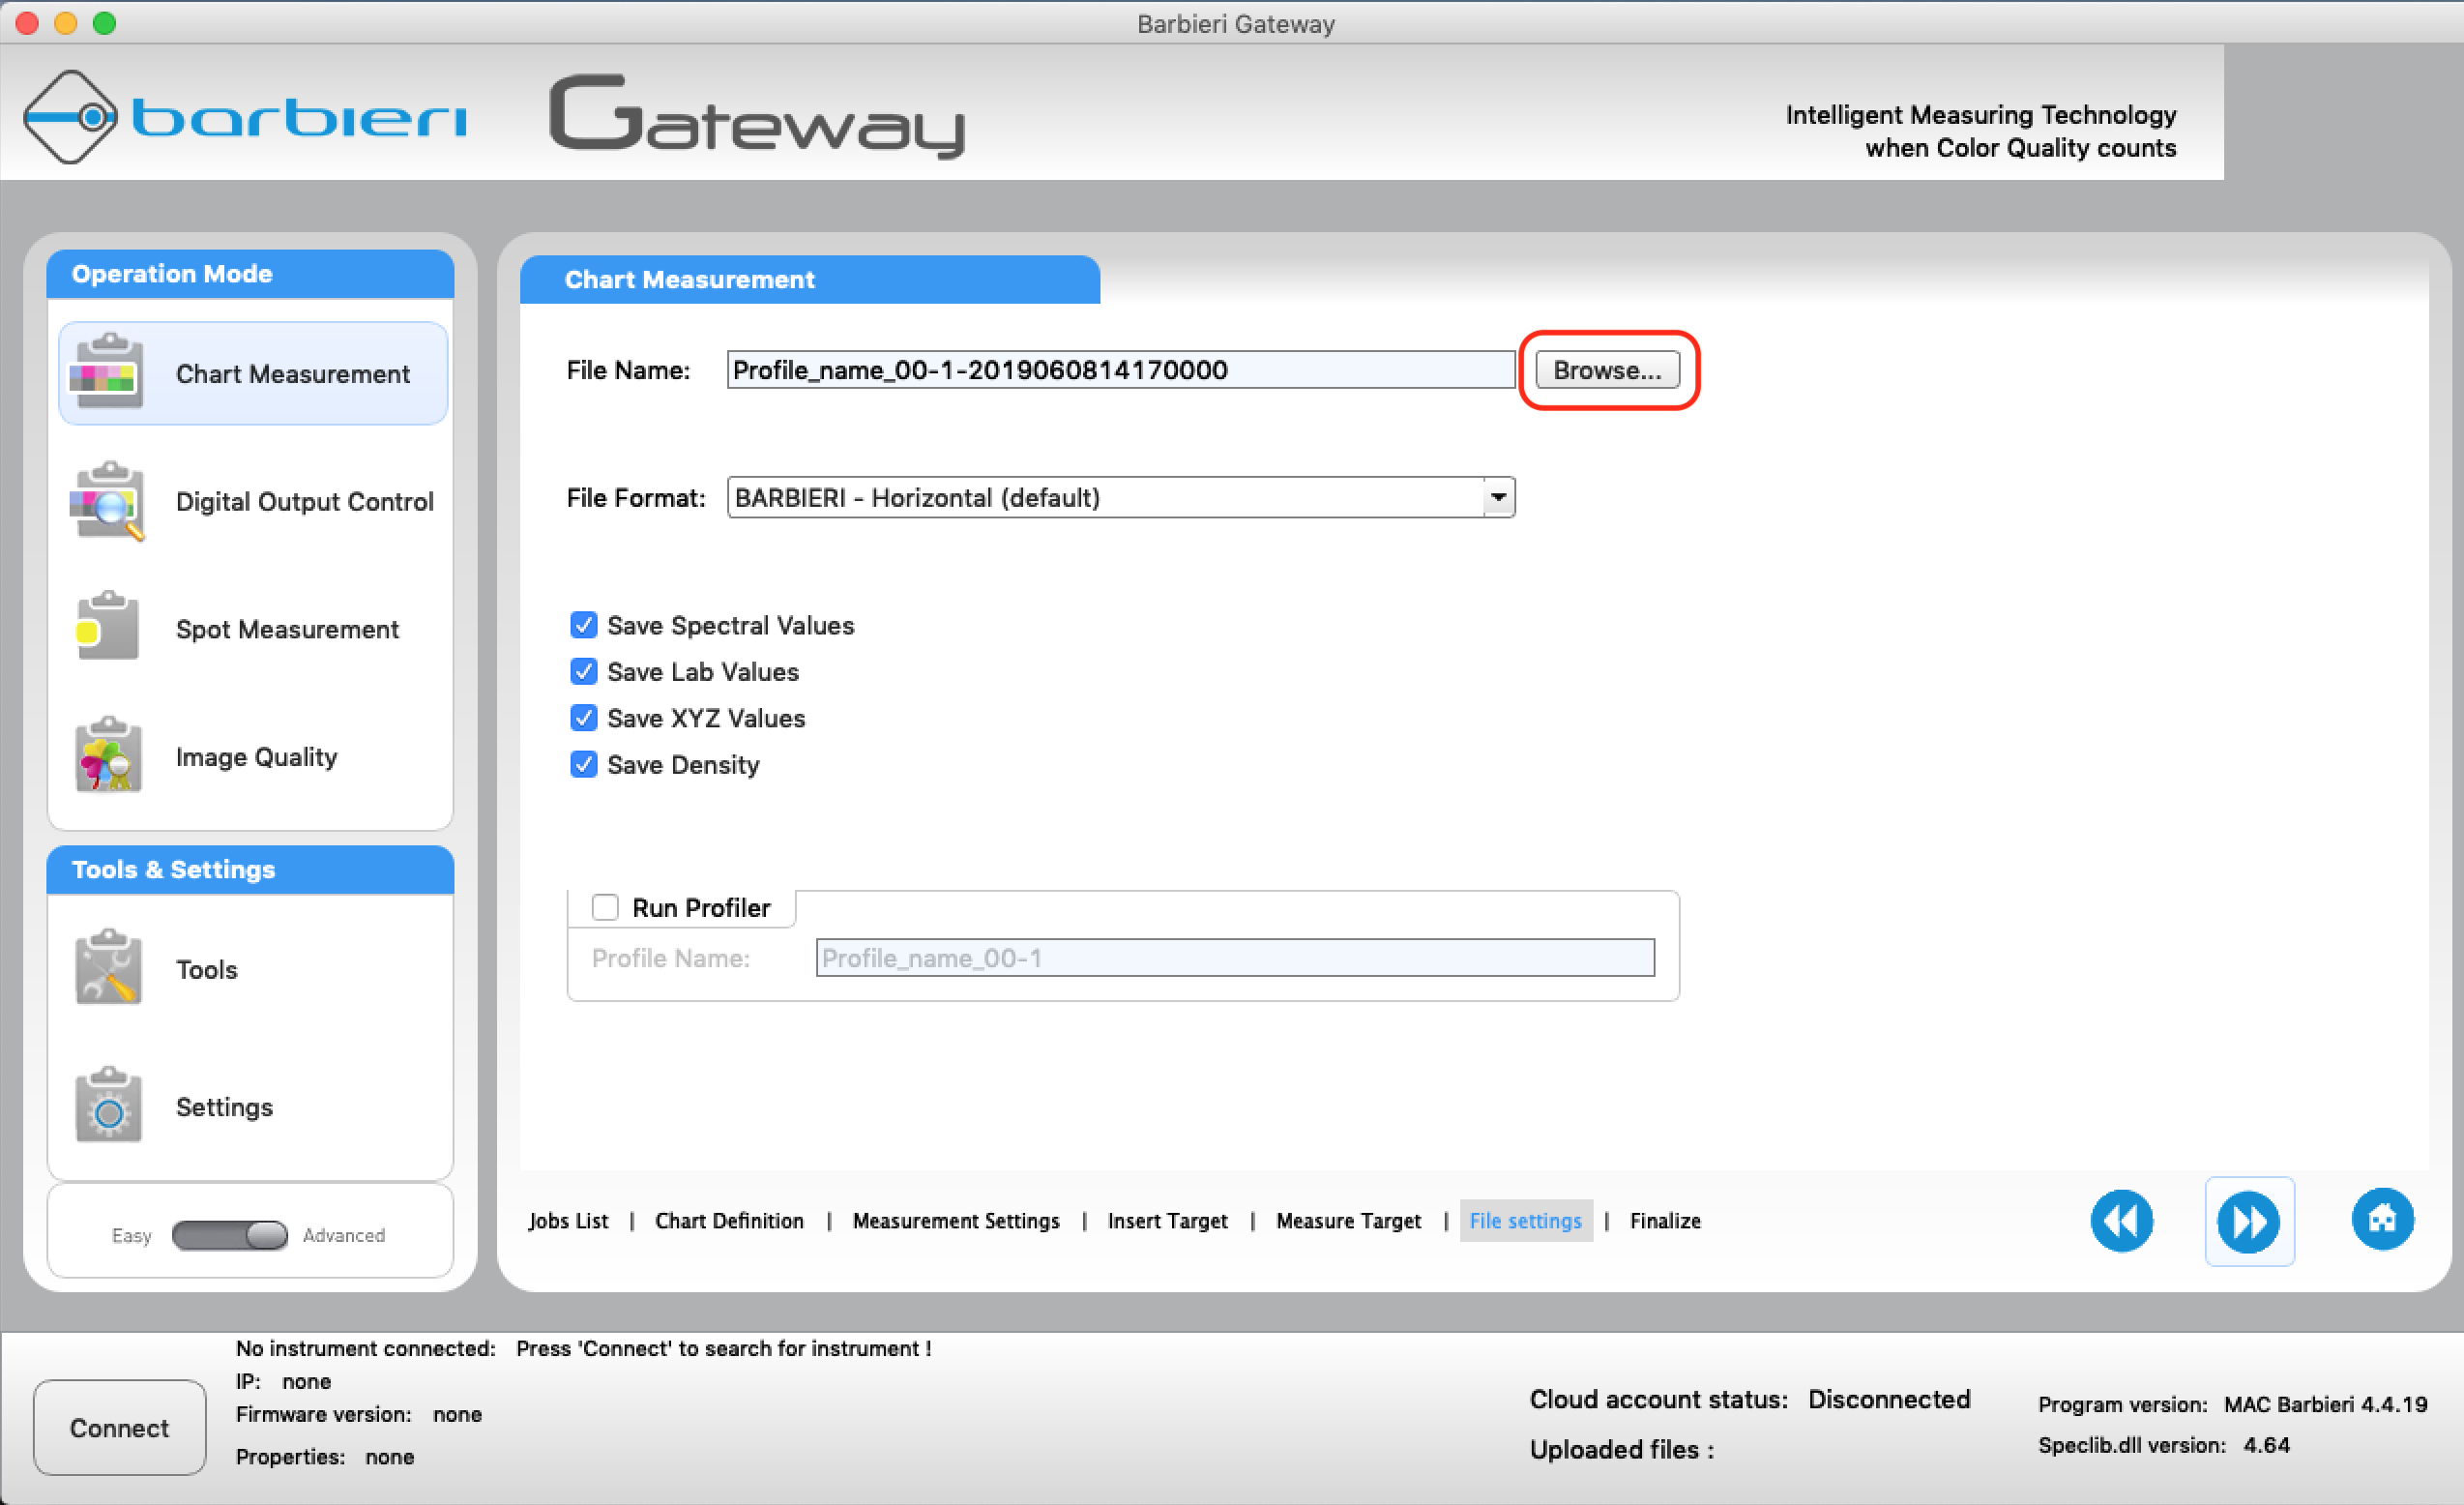
Define the file parameters

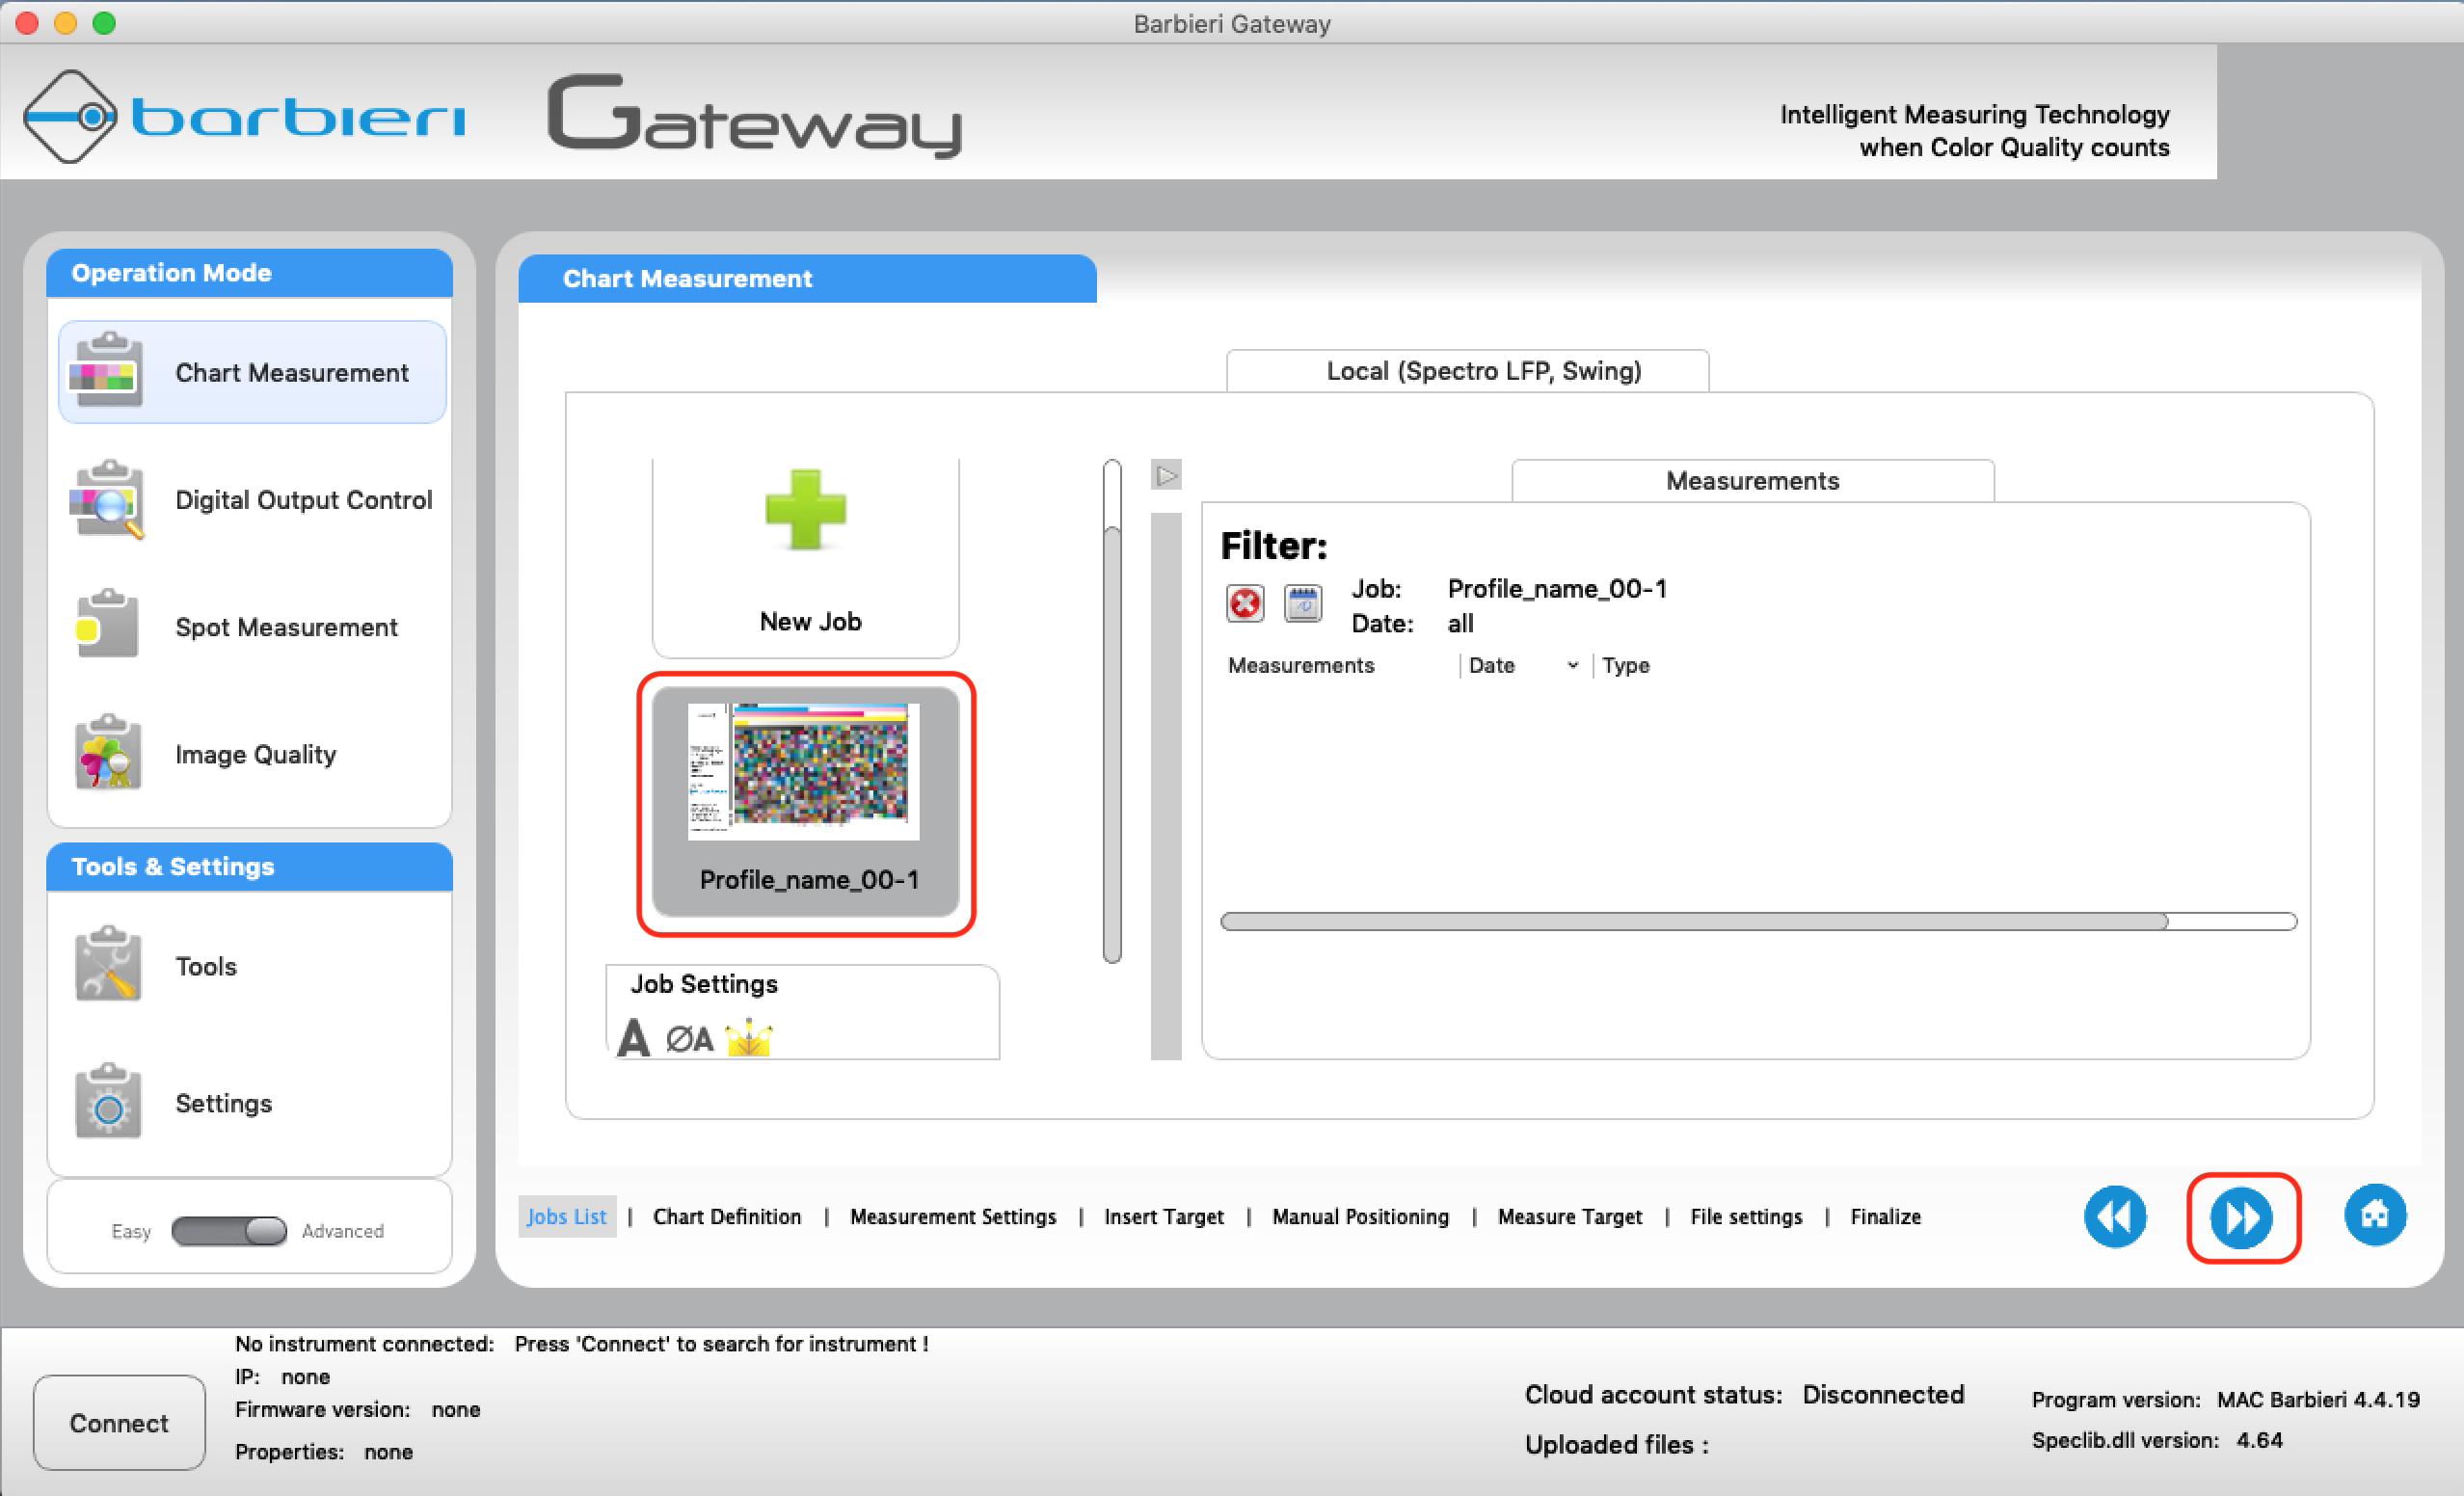
Once the job has been created, double-click on it to start the reading procedure.
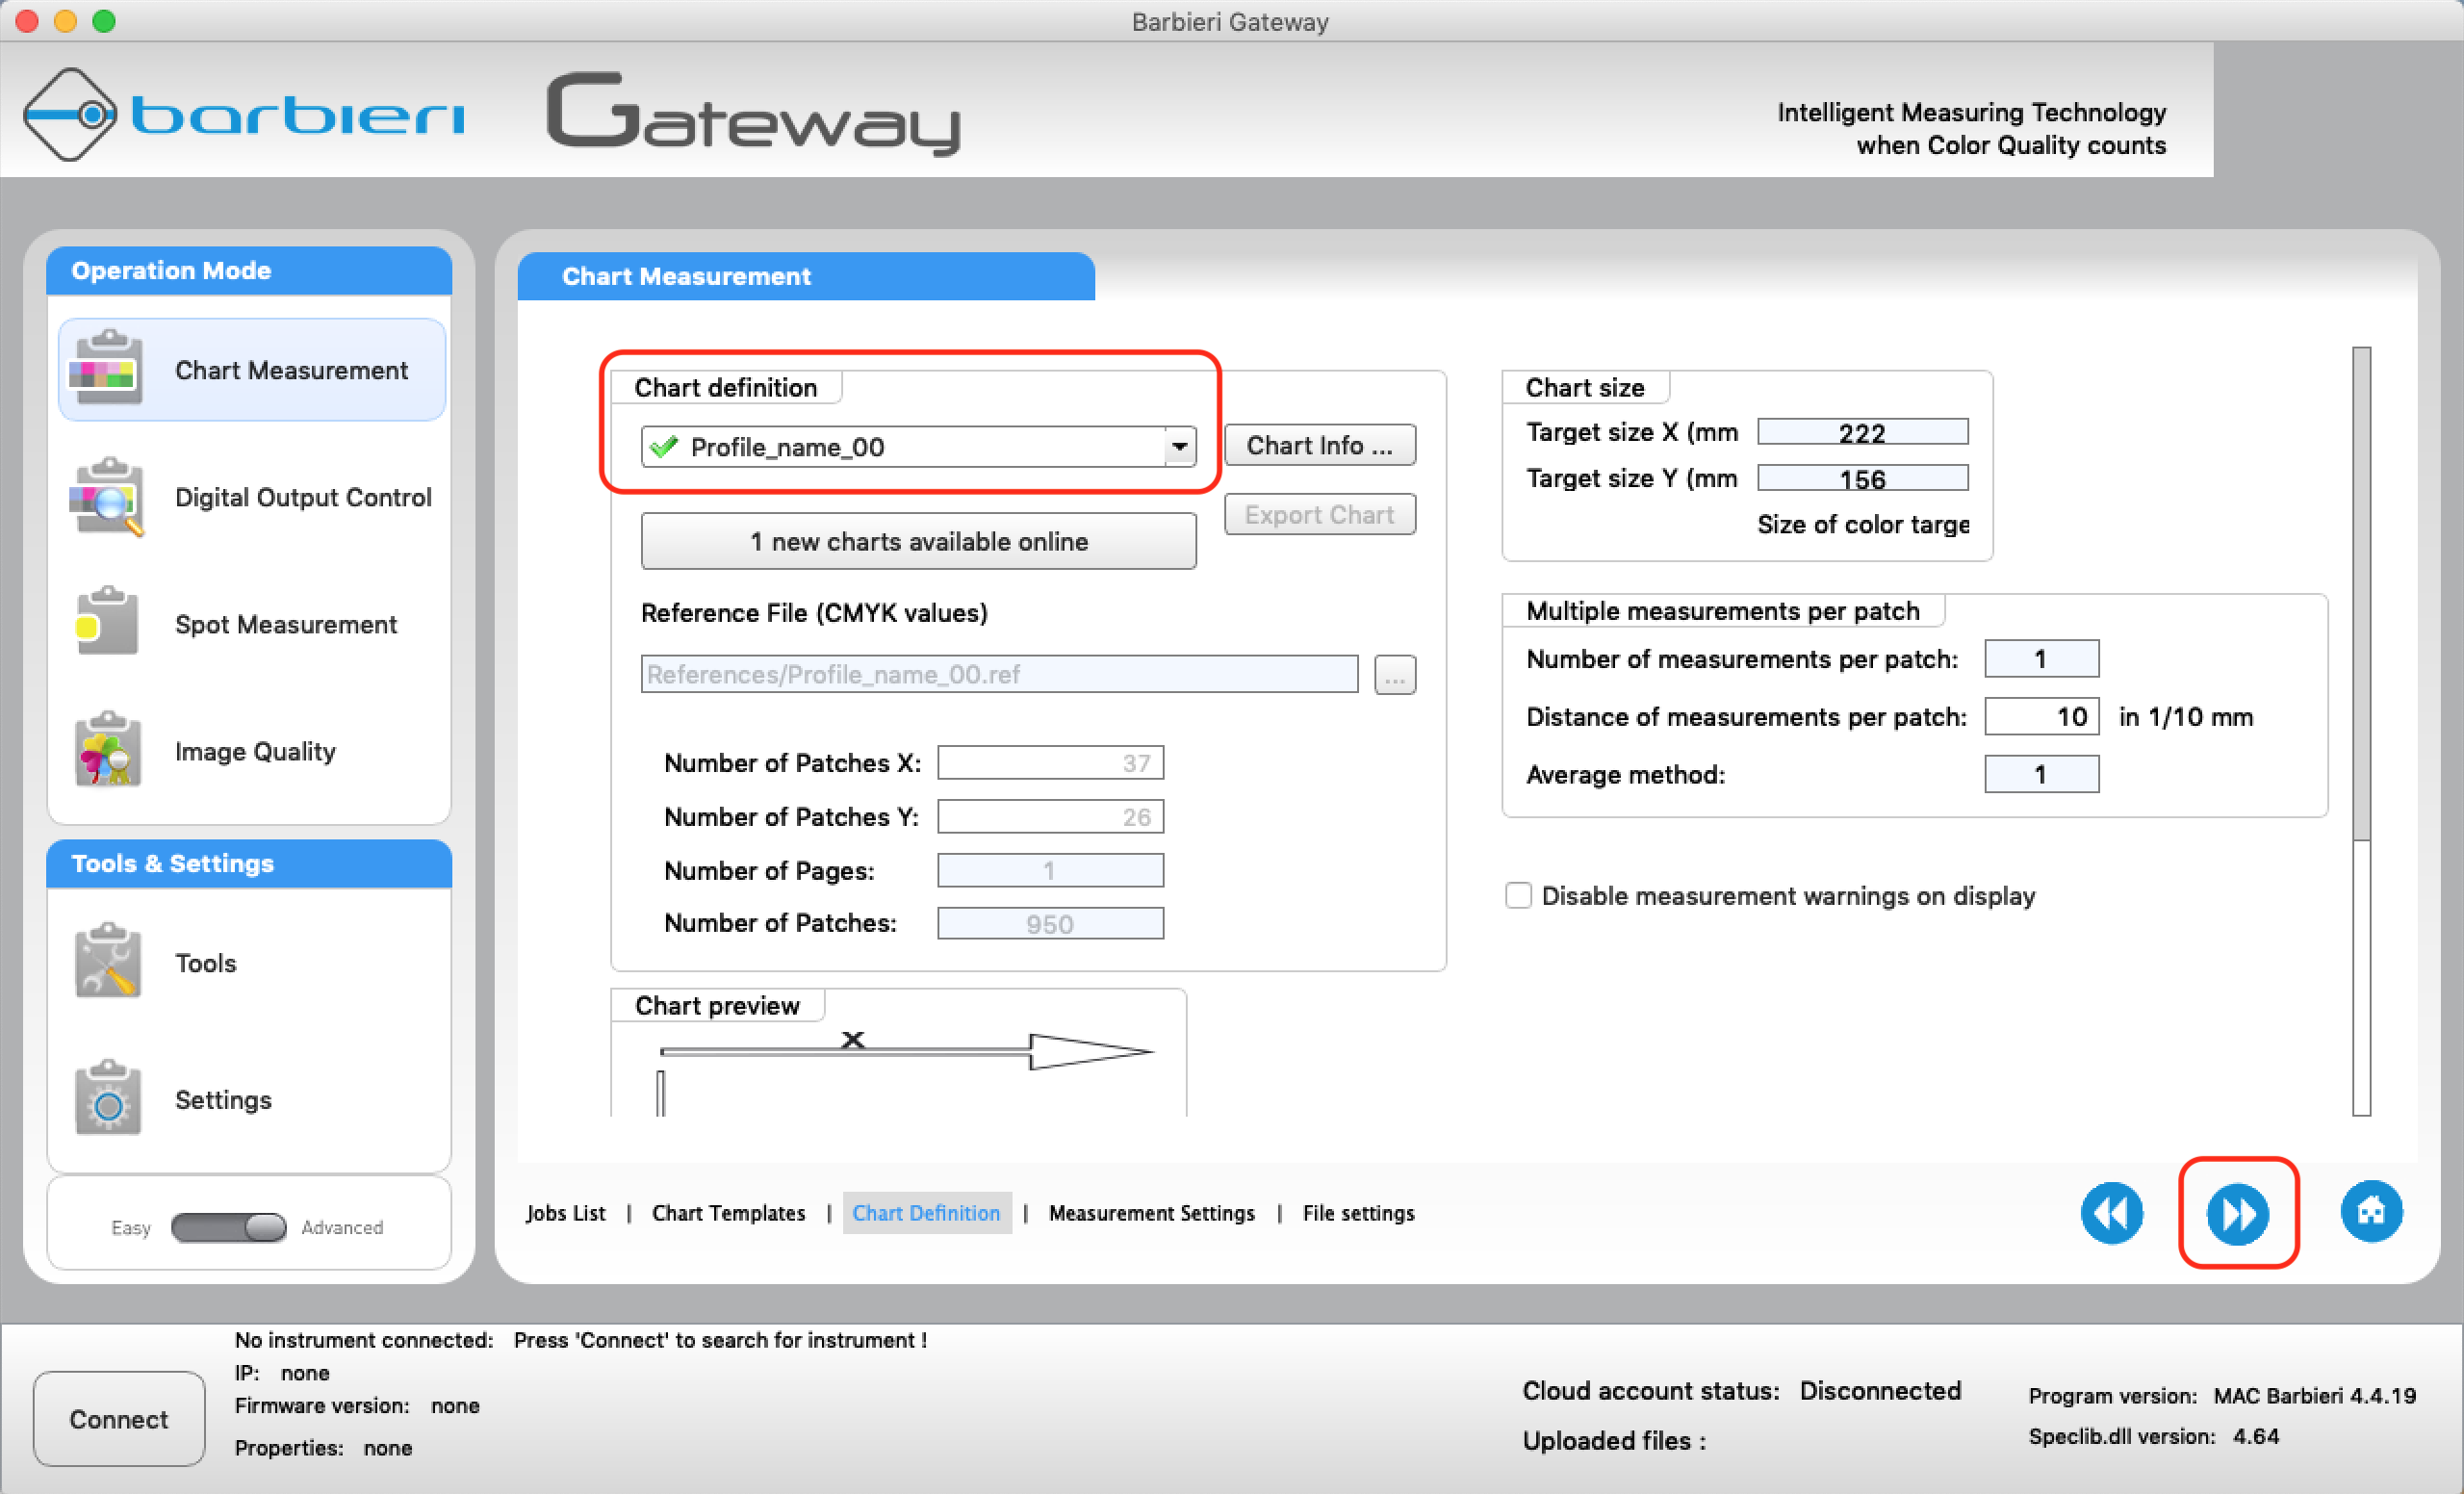
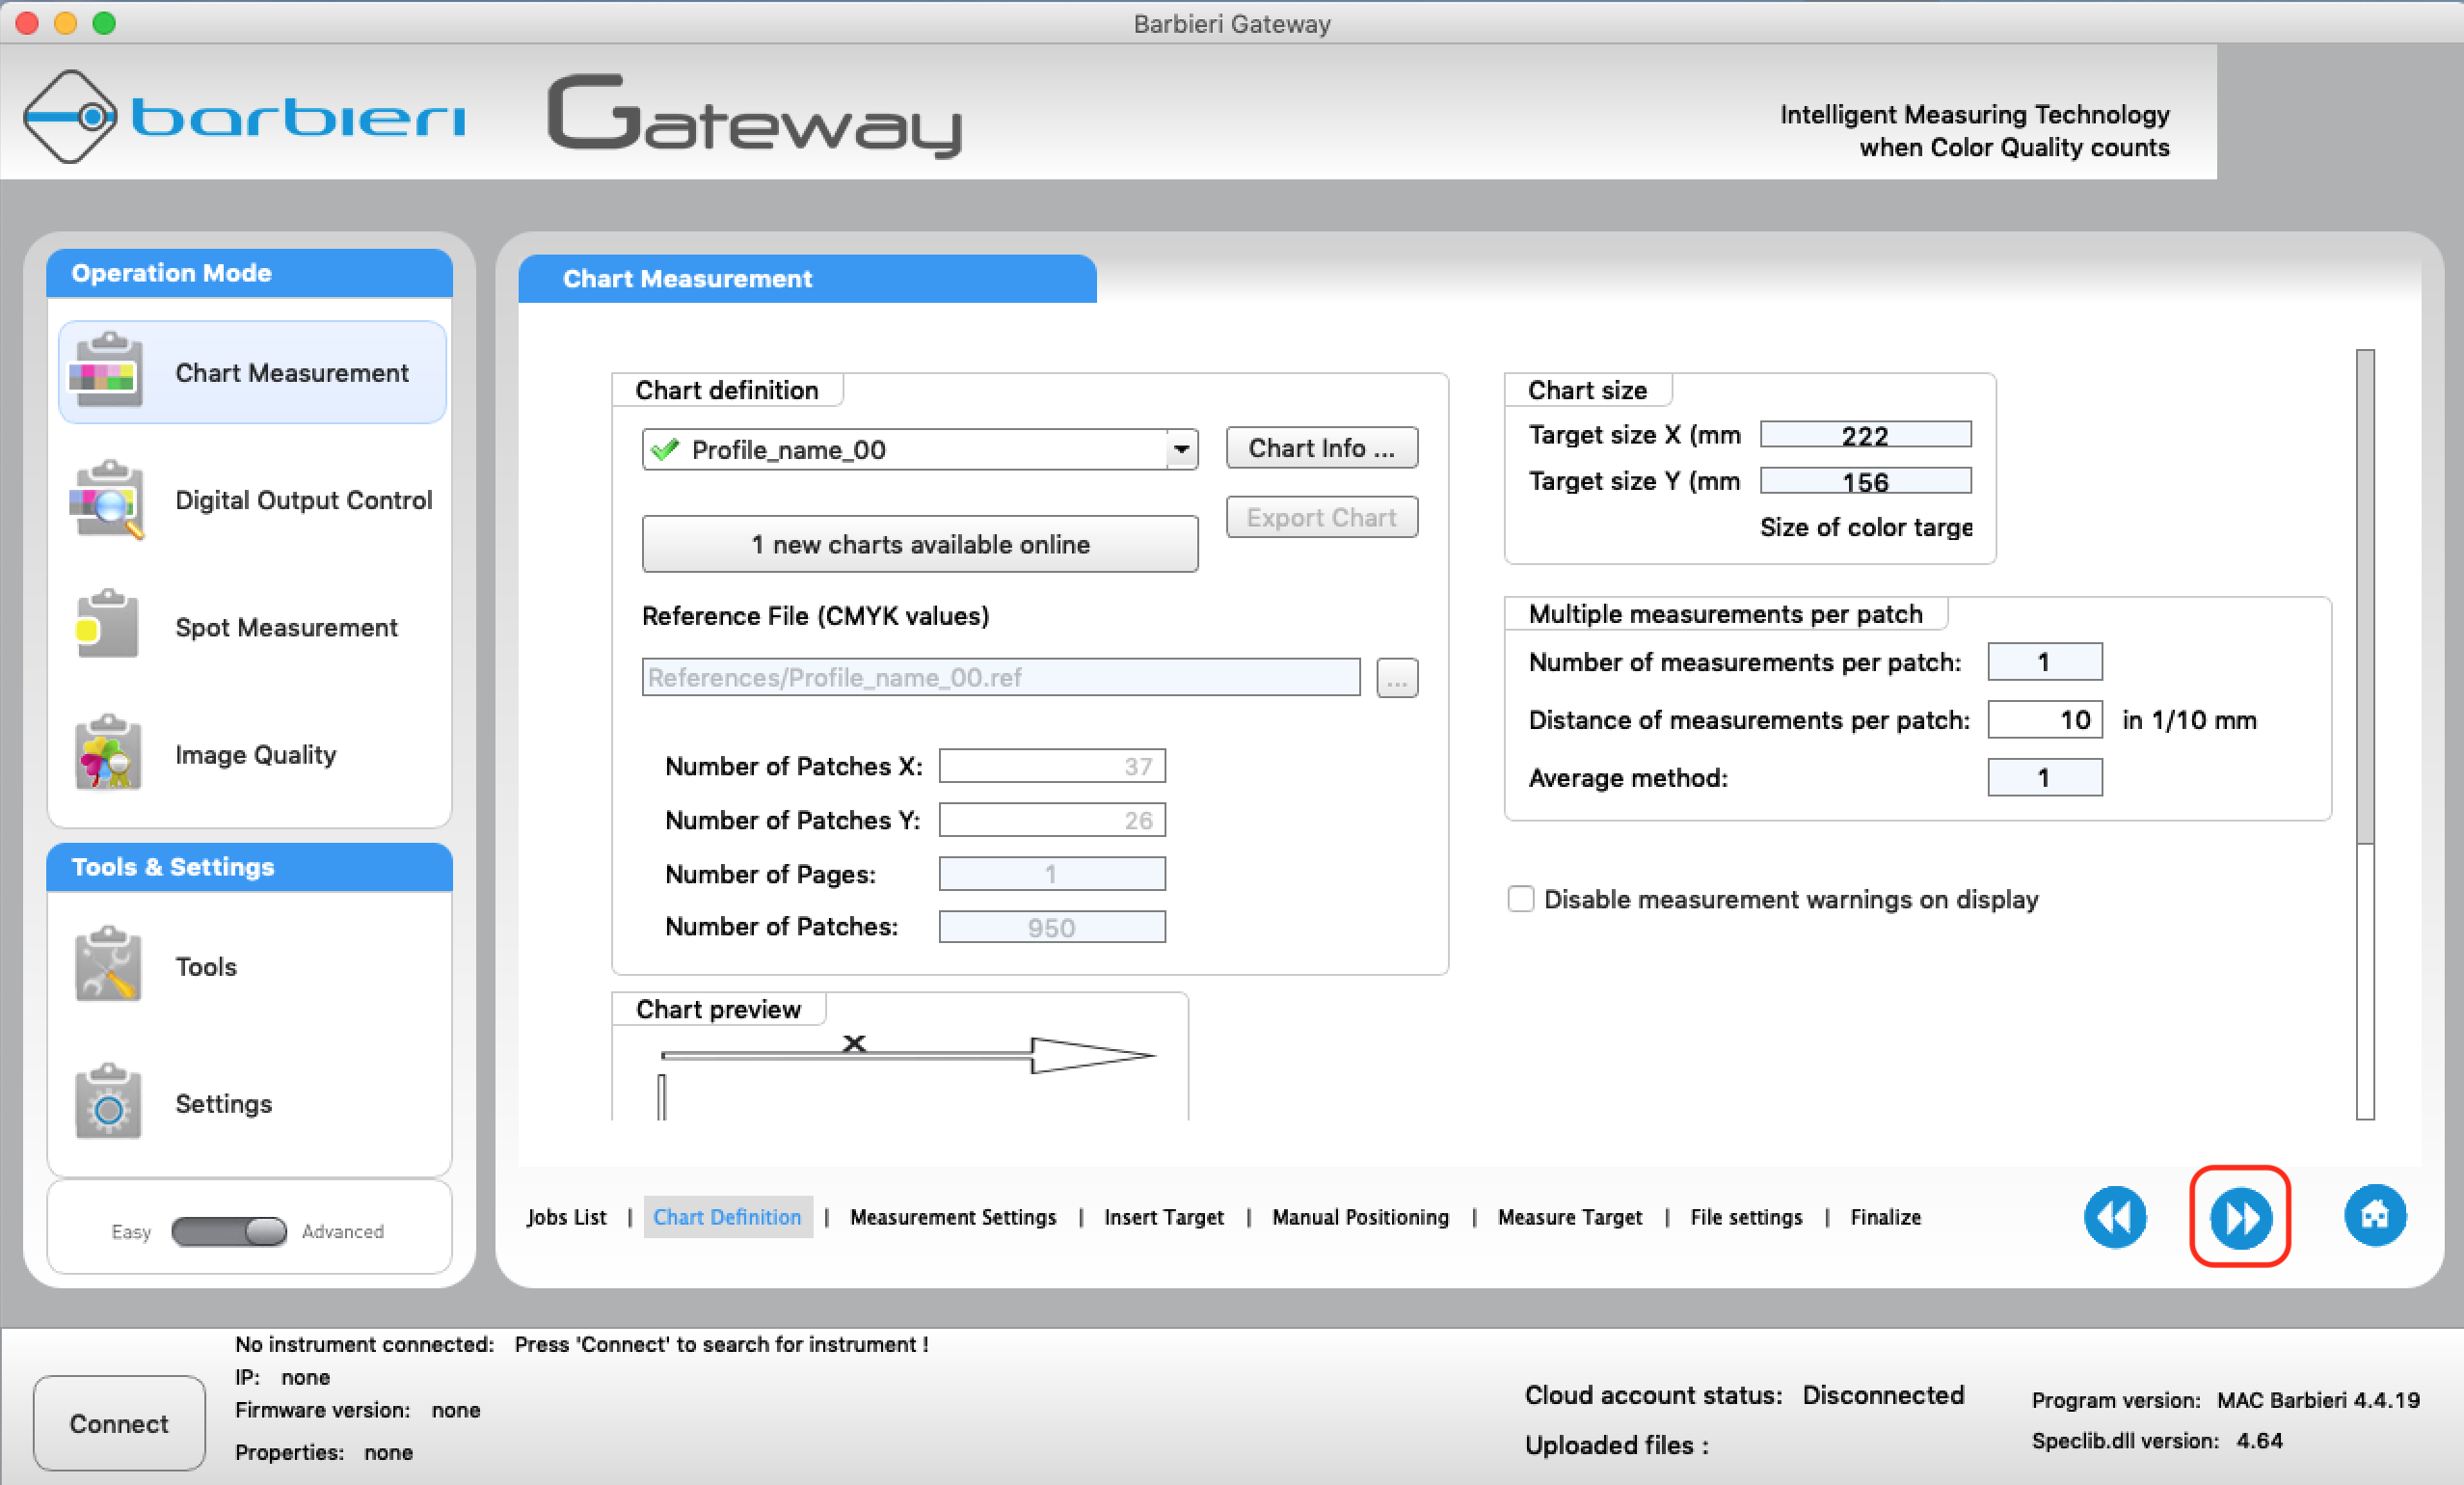
Check the definition of the staff
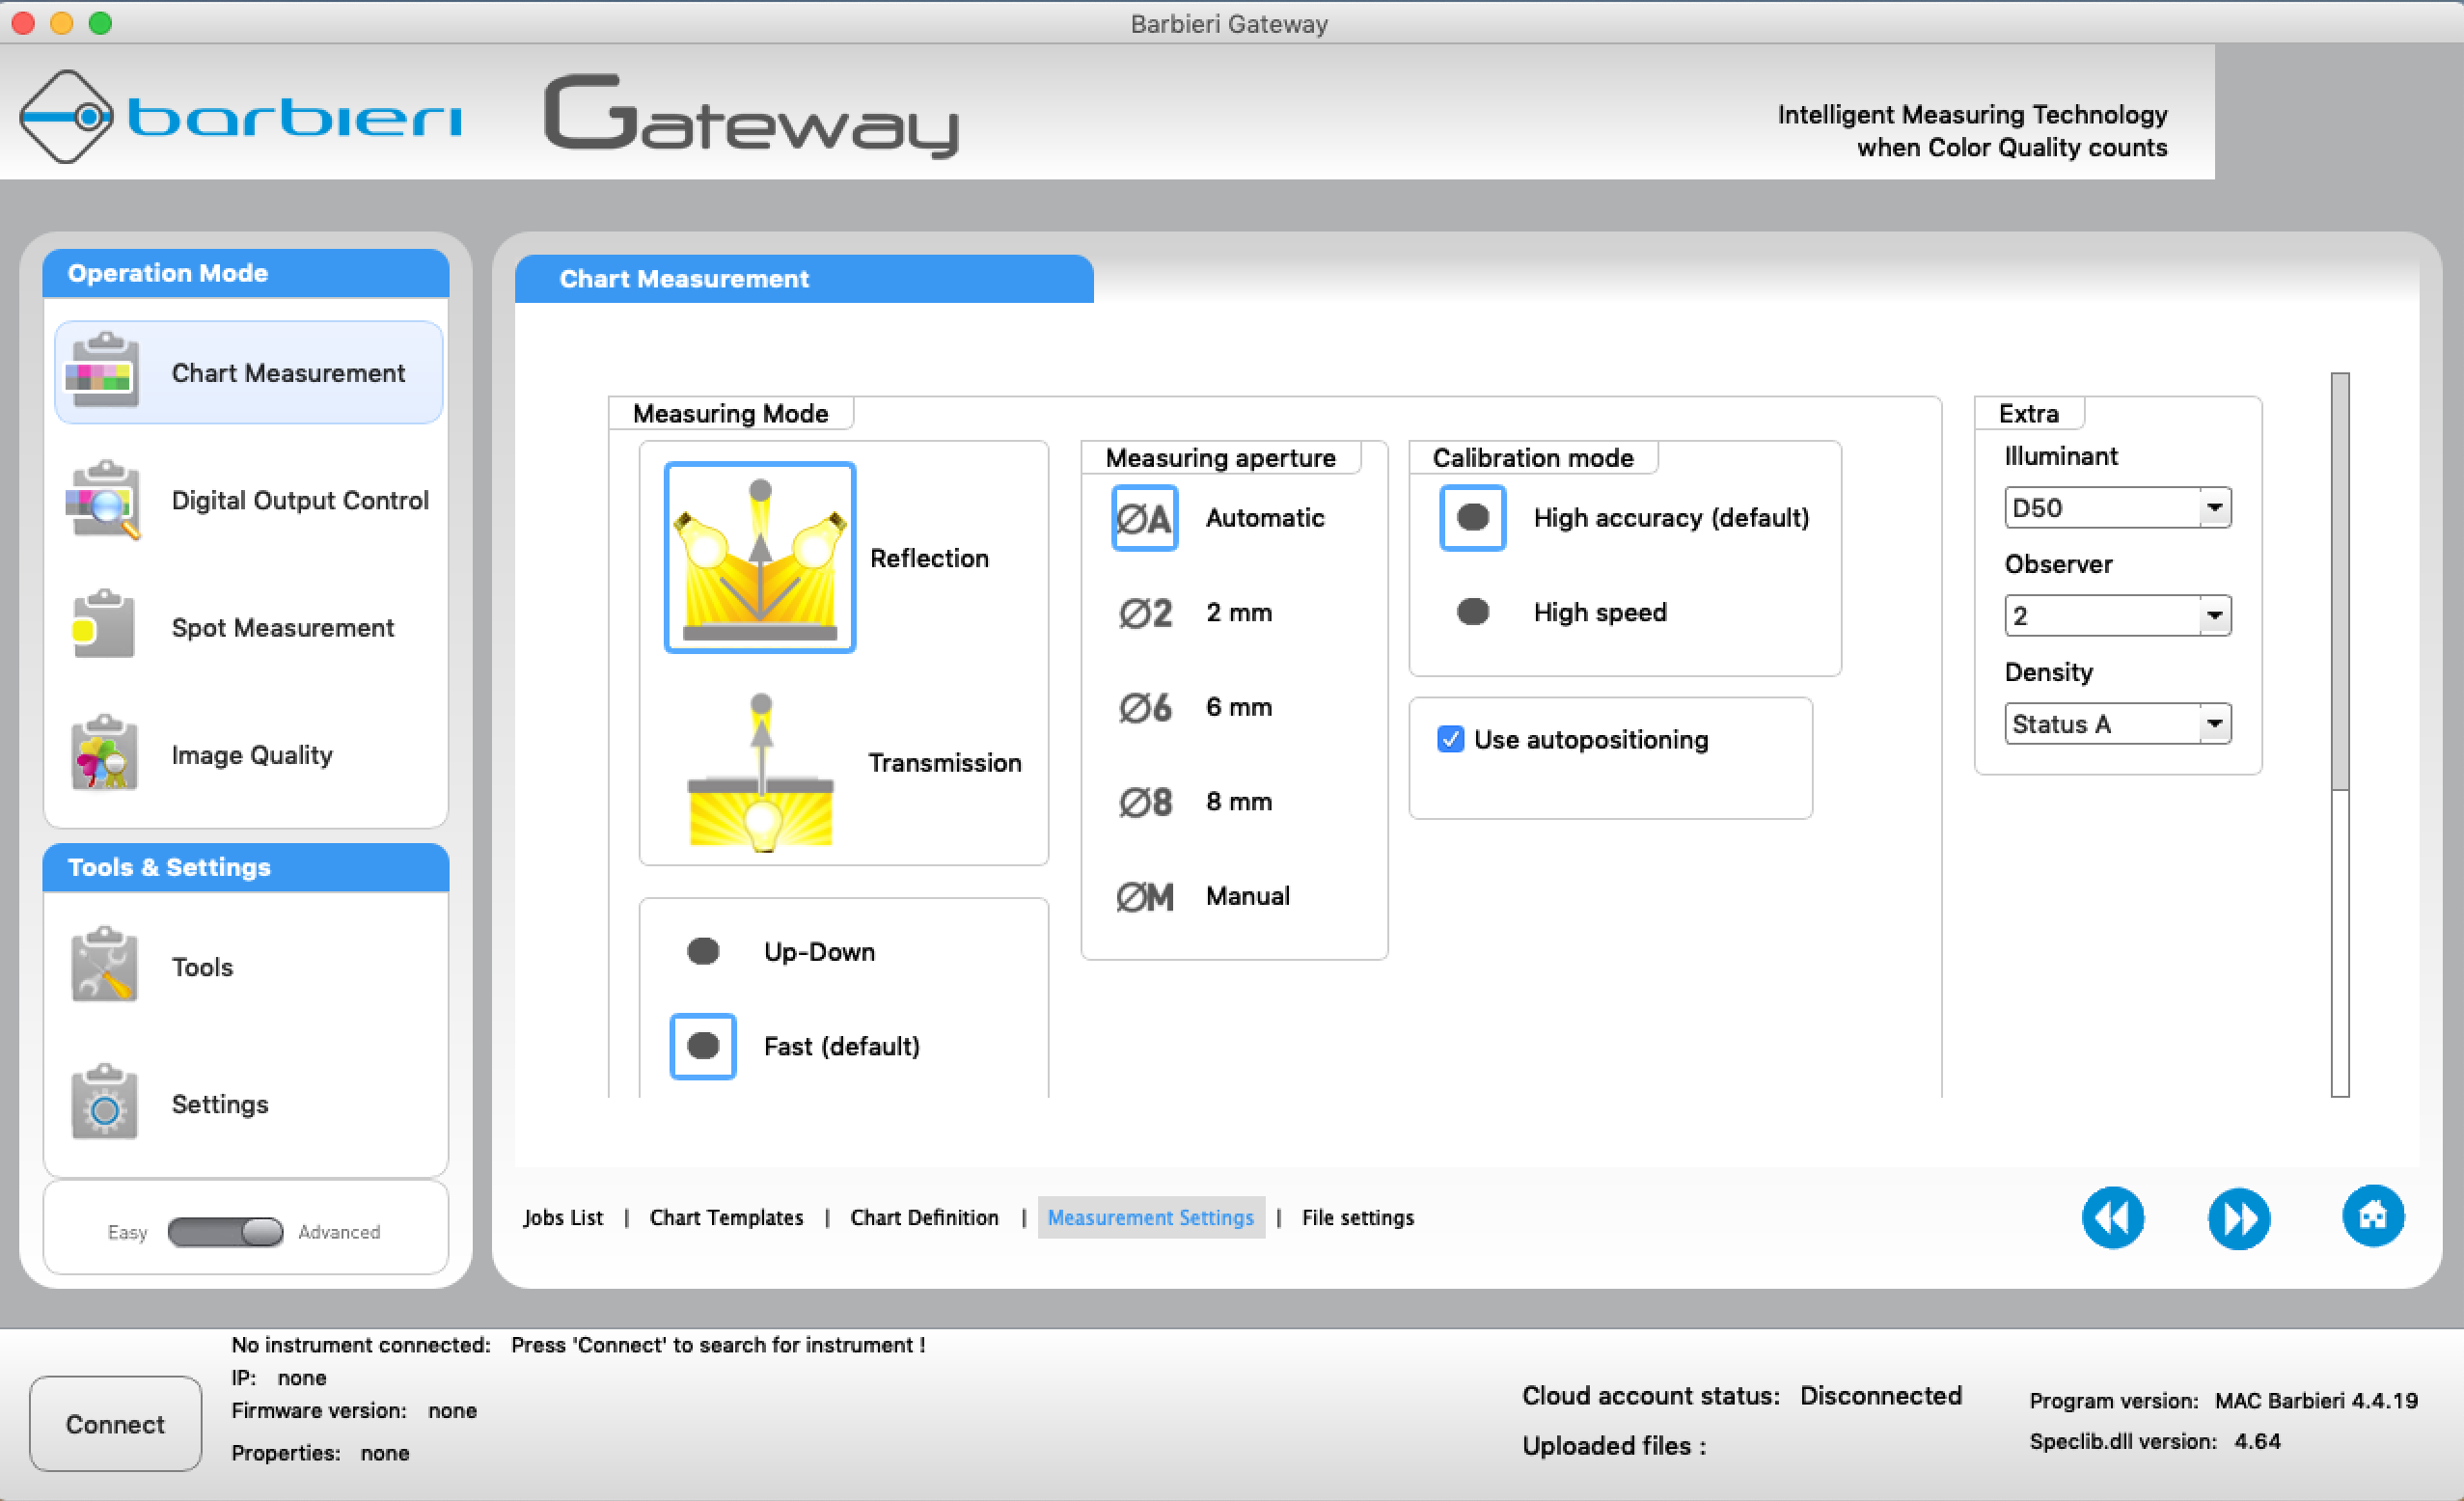
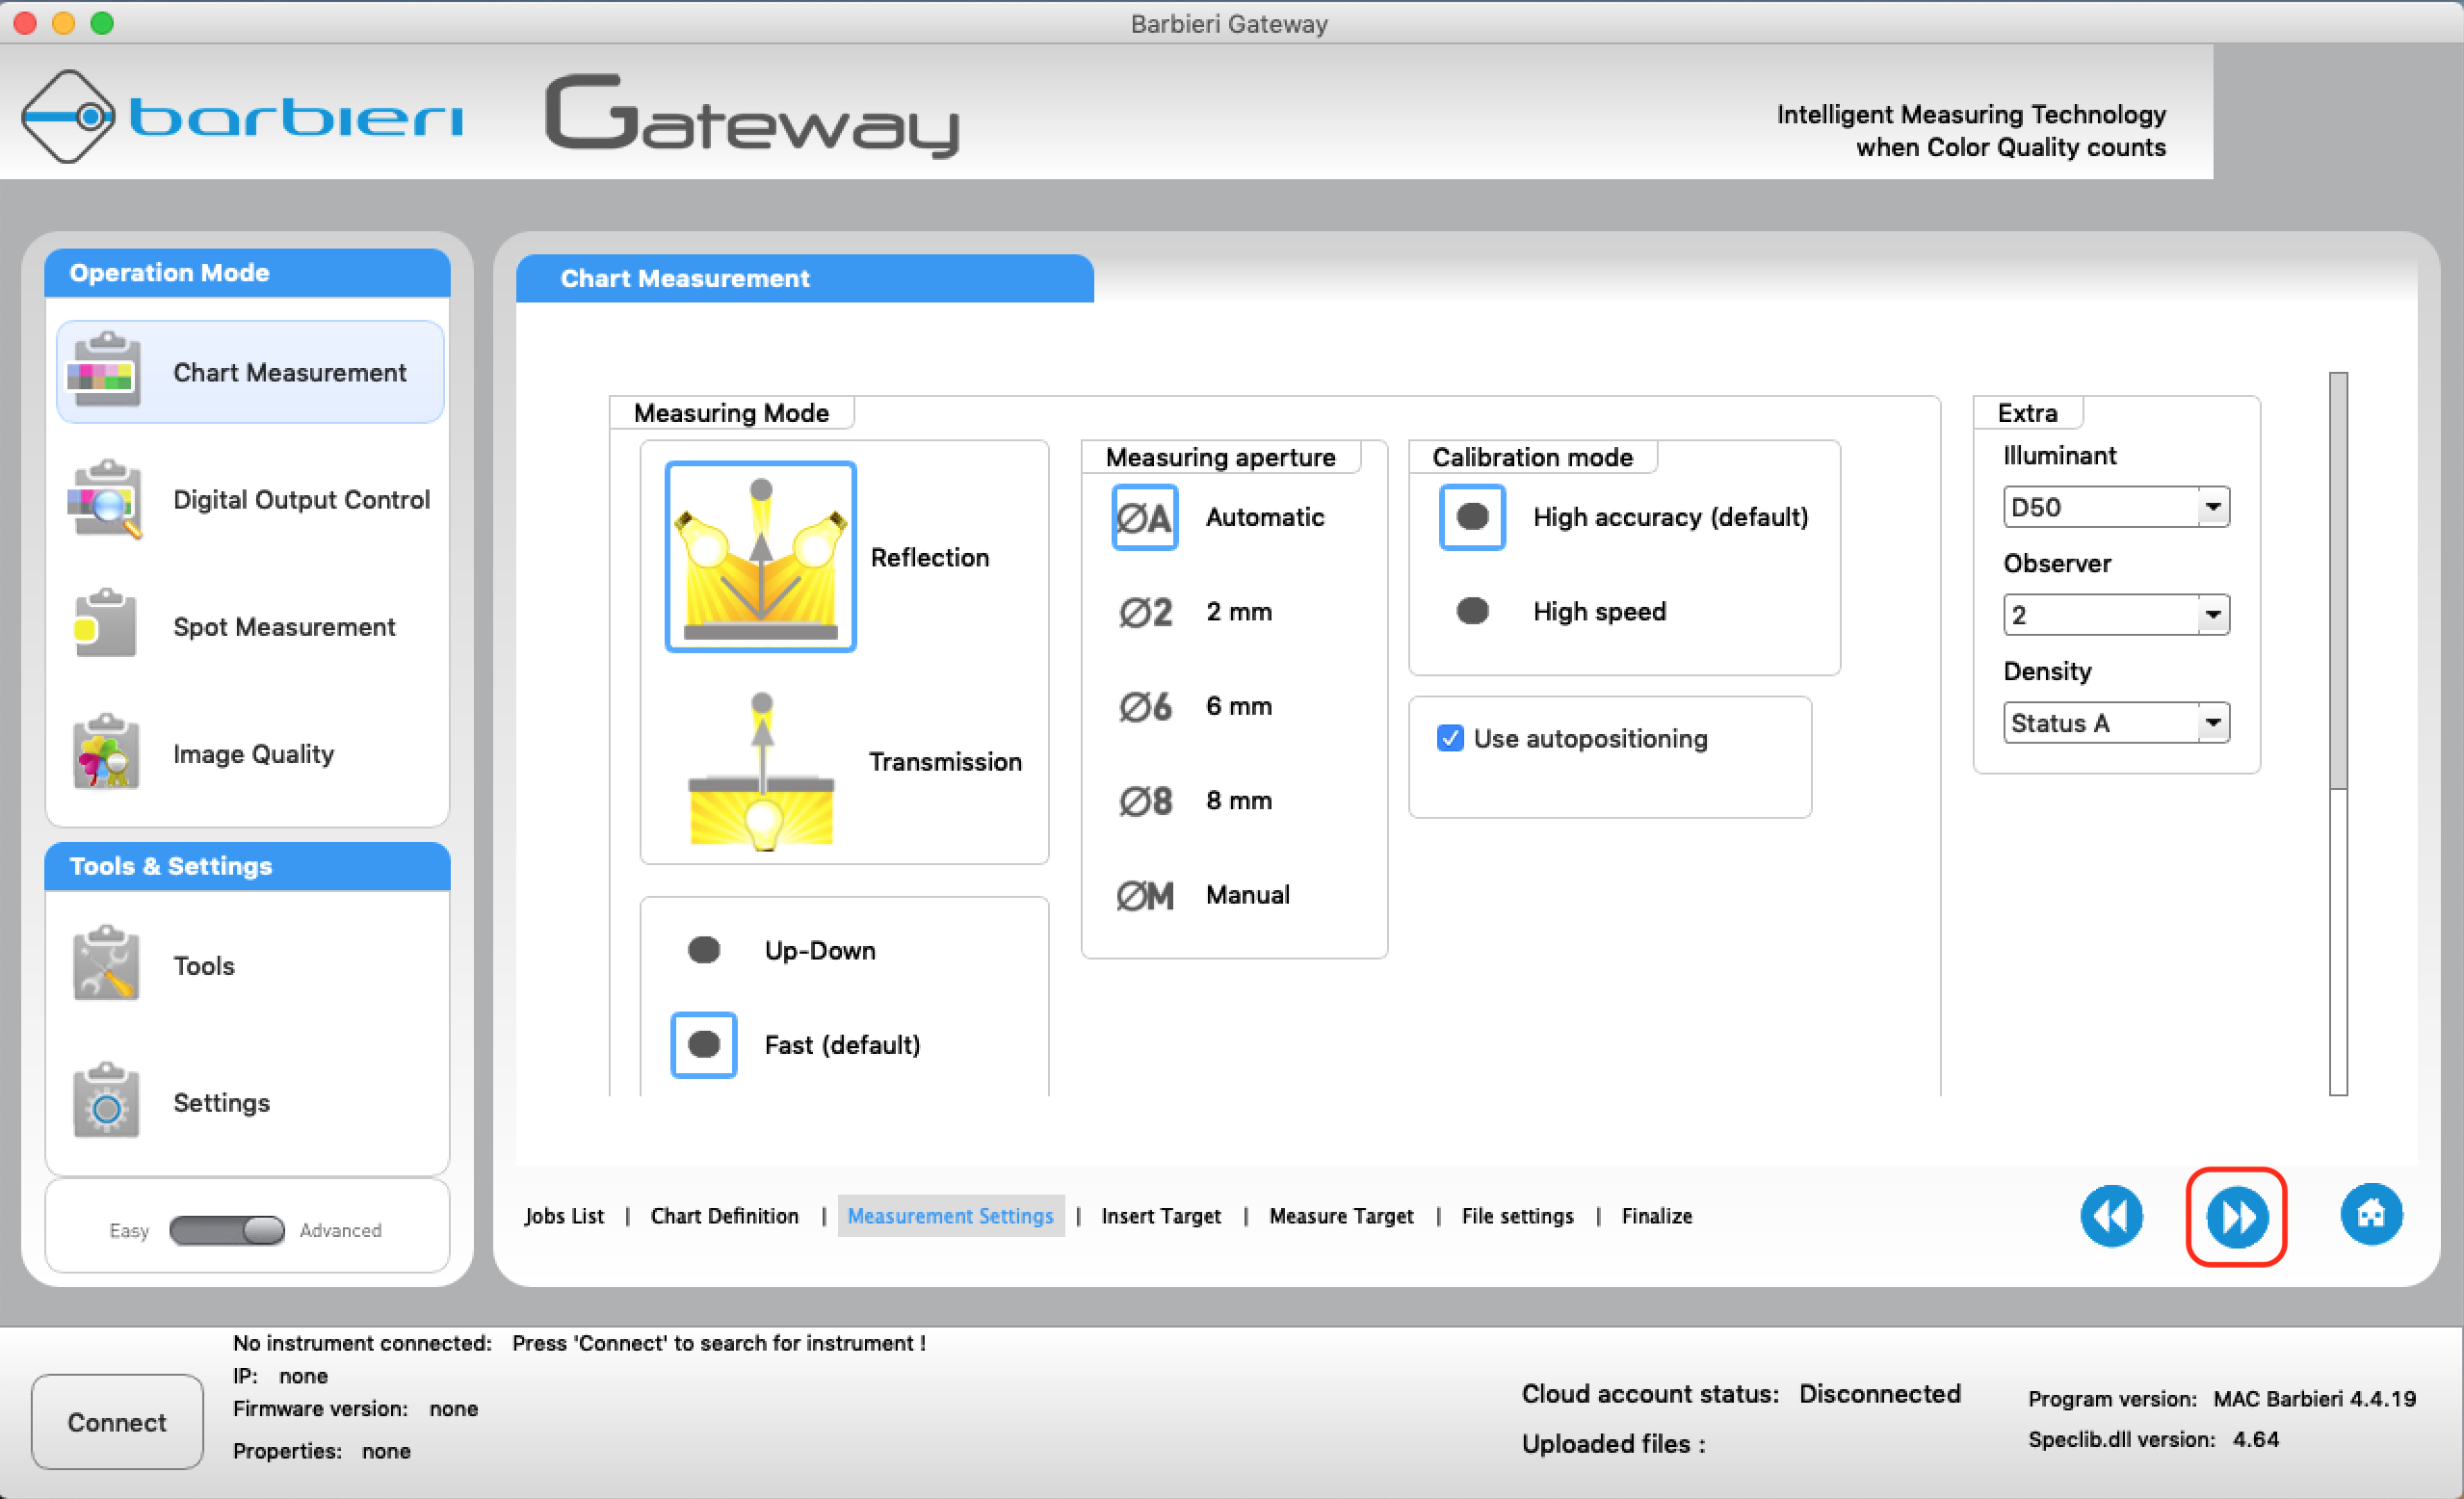
Check the measurement parameters
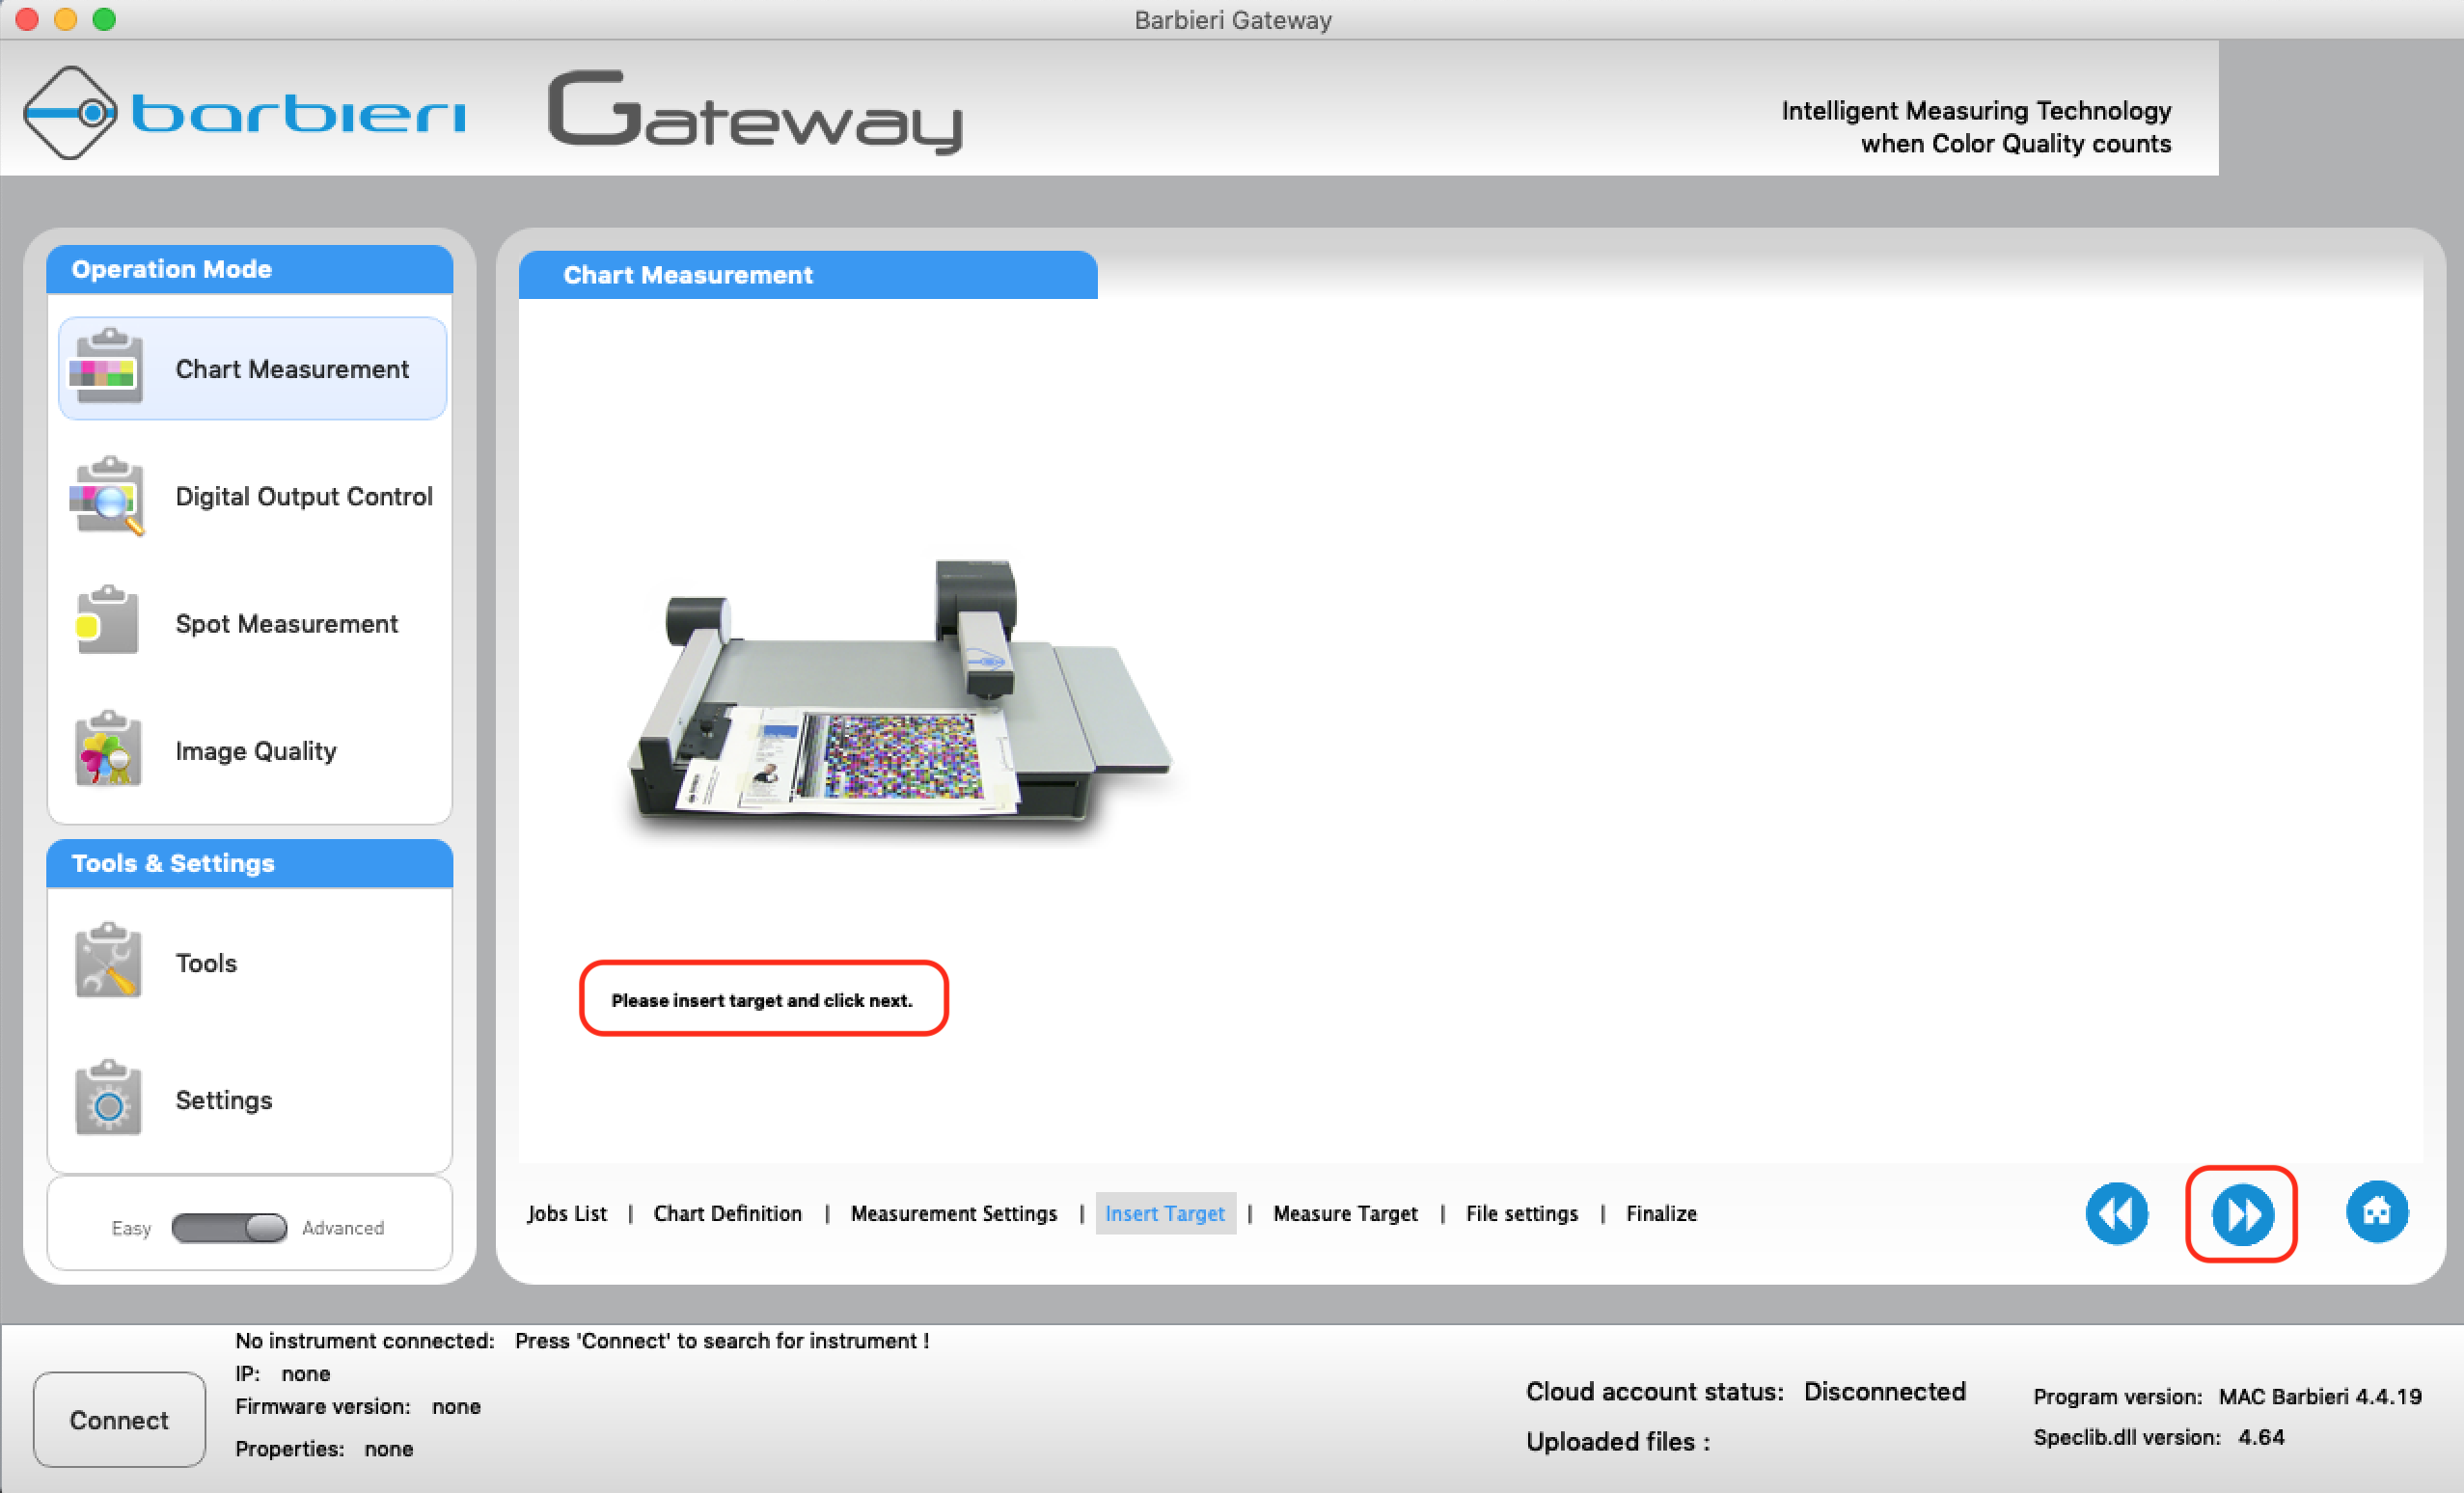
Install the holder with the printed staff on the Barbieri spectrophotometer.
Click on "Start" to start the measurement.
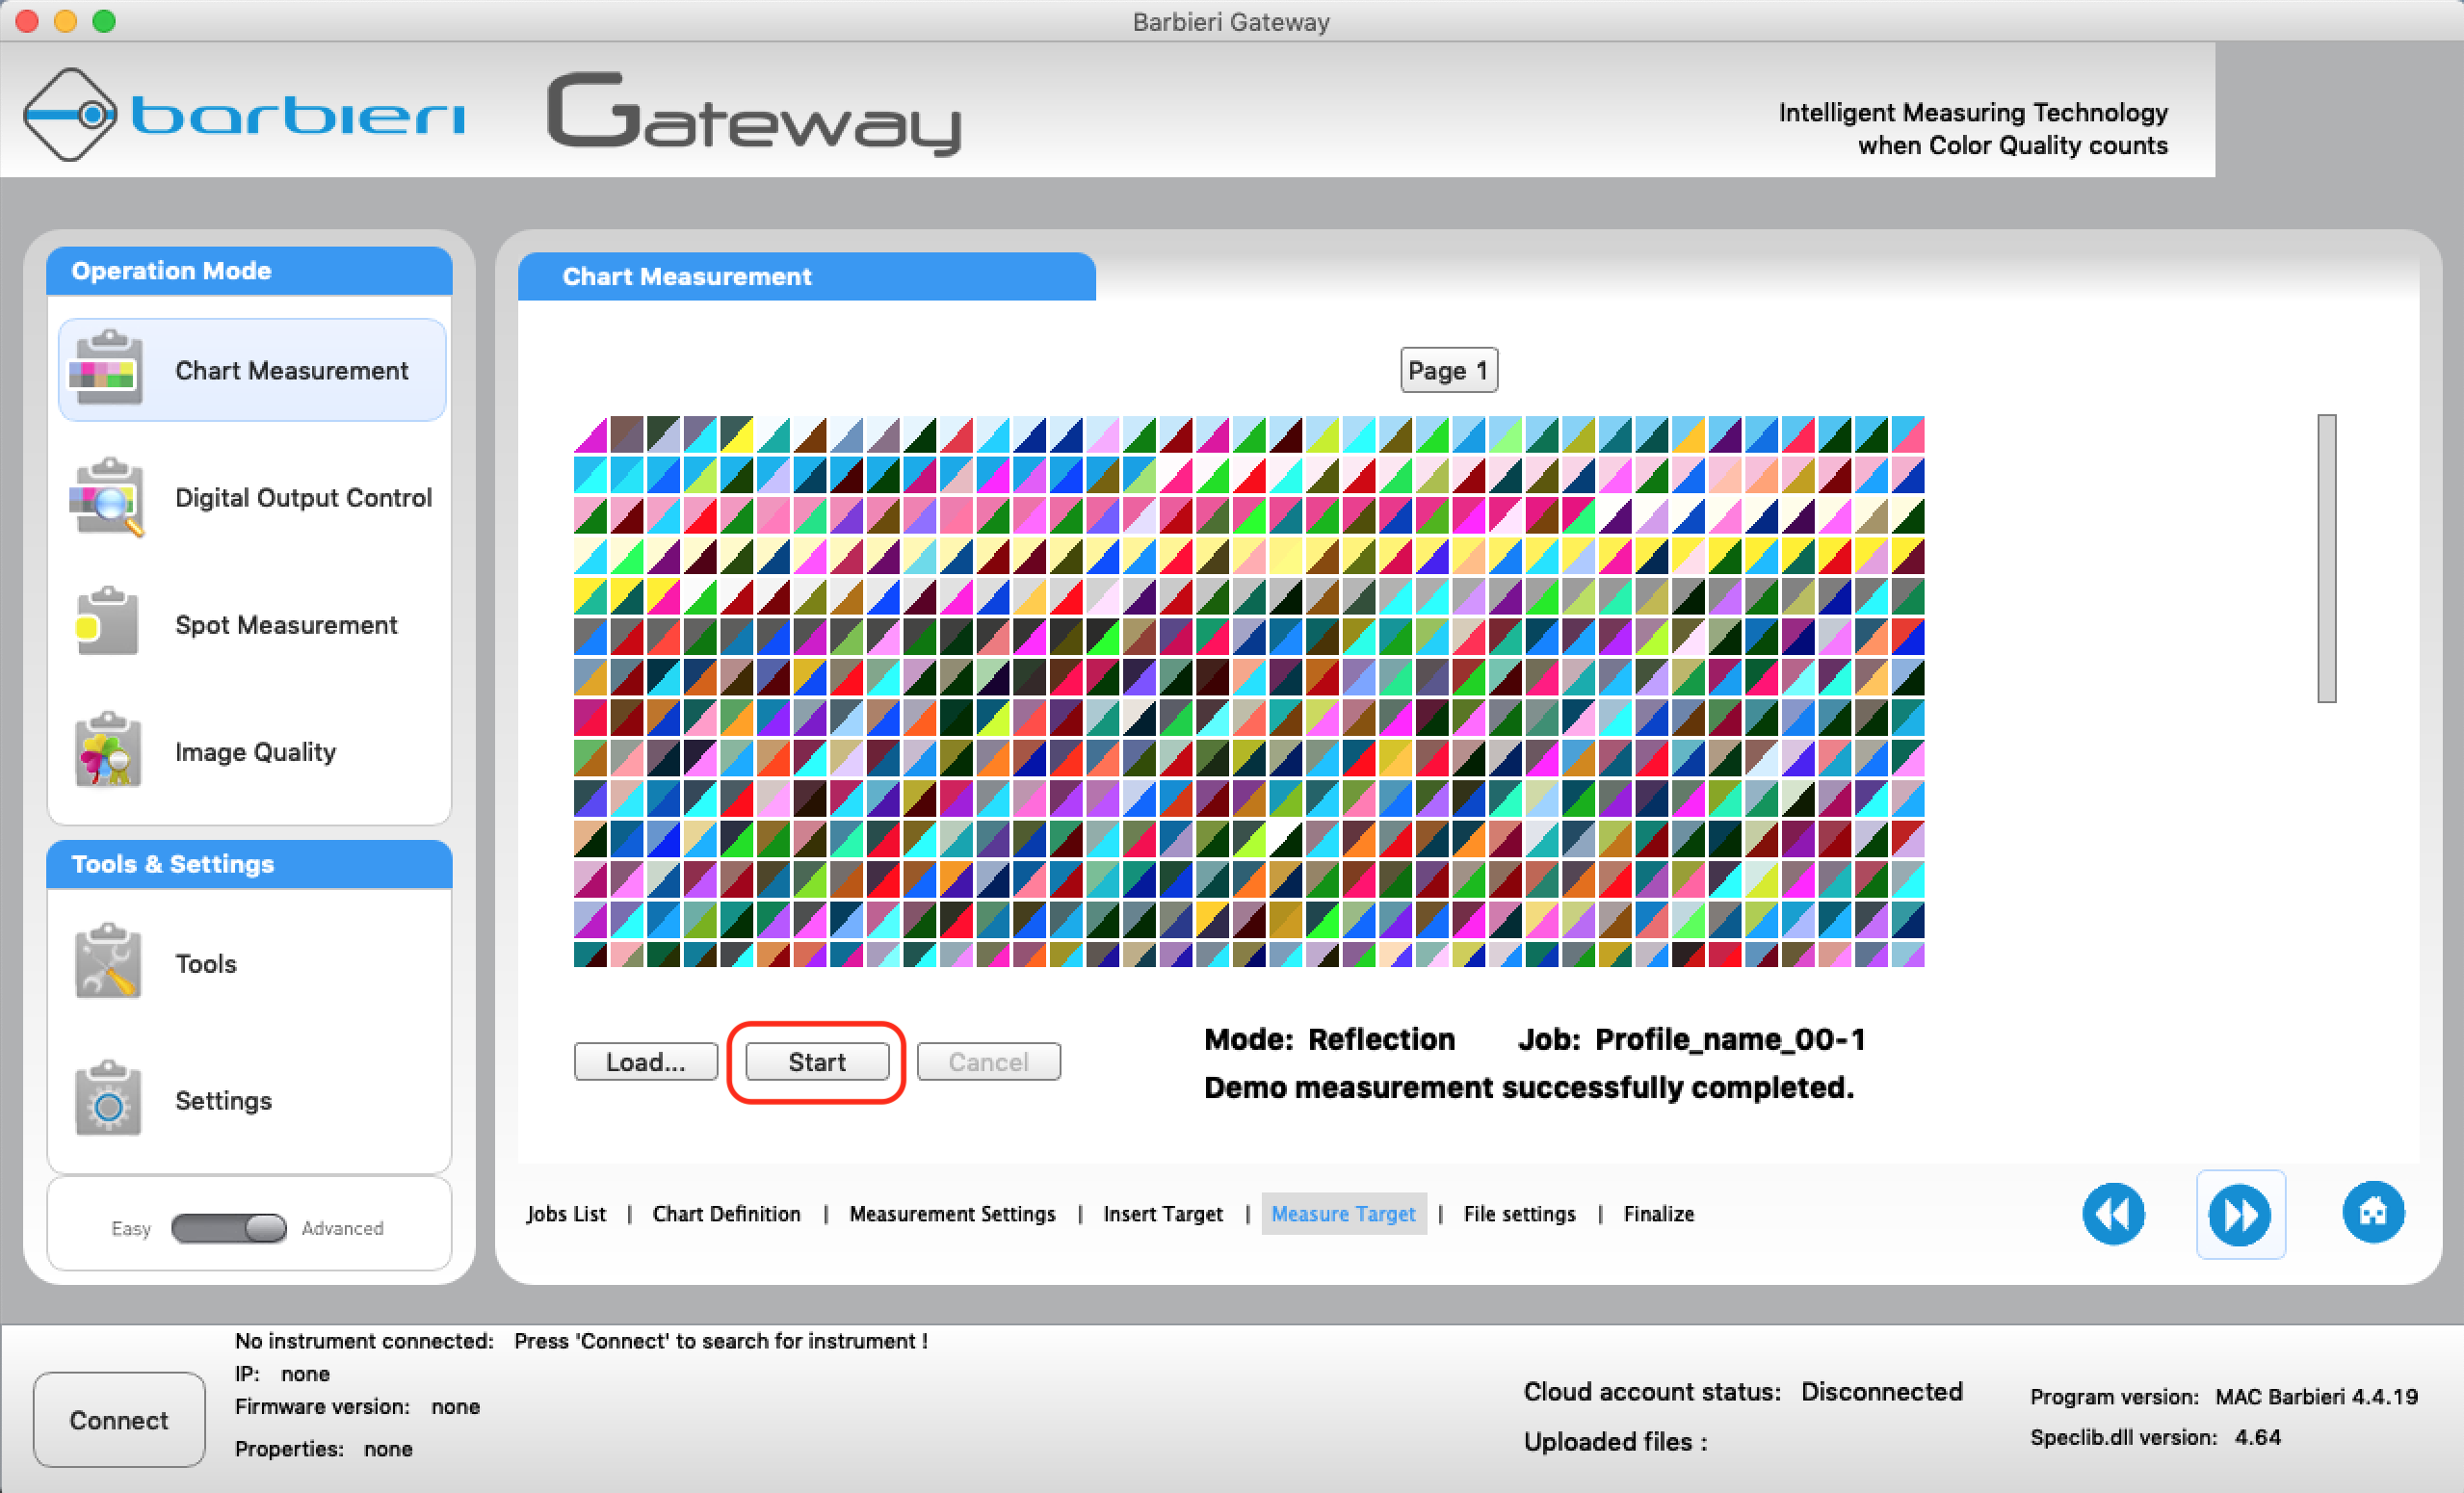
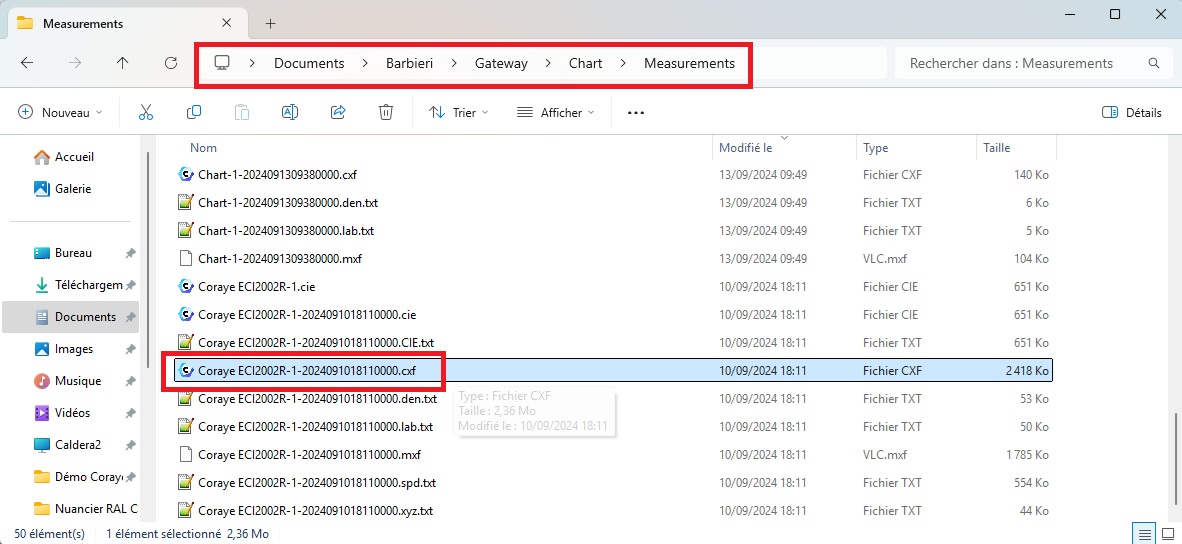
At the end of the measurement, the measured data are stored in the "Measurements" folder
The default path is ../User/.../Documents/Barbieri/Gateway/Chart/Measurements/You can access this folder with the "Browse ..." button.
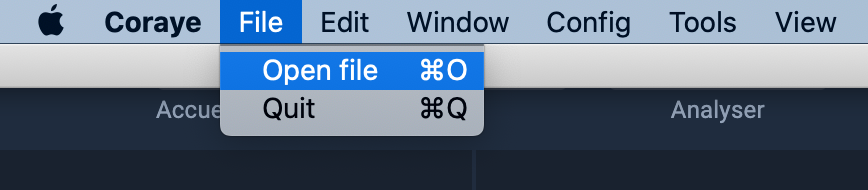
Import the ".cxf" file into Coraye
Coraye uses .cxf (Color eXchange Format) files to create an ICC profile from Barbieri's Gateway software
Now click on "Import a reading" in the calibration or characterization procedure and continue to obtain the "cxf" file created by the Gateway software (.cxf).
Once the chart imported into Coraye appears in the left column, click on "Start measurement"

Since the spectrophotometer is not connected, click on "Skip Instrument"
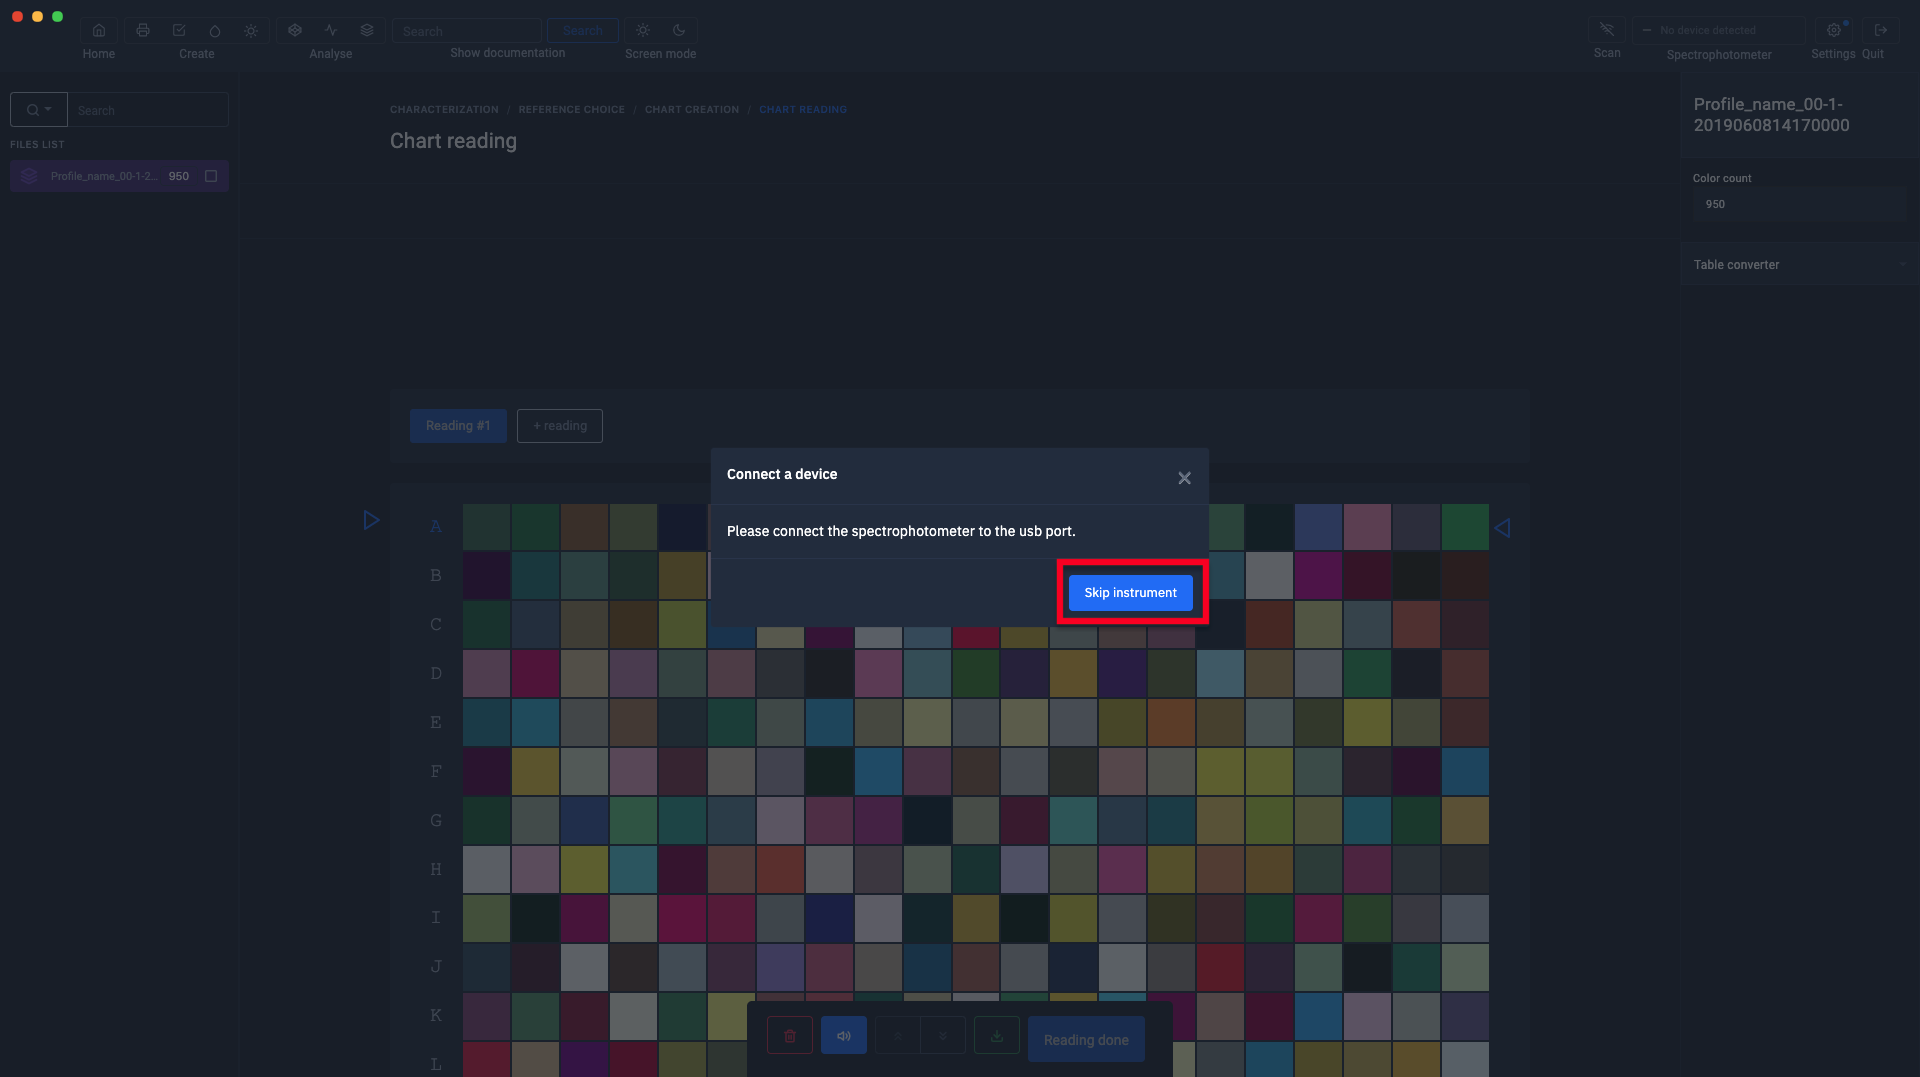
Drag and drop the previously loaded pattern file into the pattern in the middle.
When the green ticks appear on the right of the staff, click on the "Measurement completed" button.

You can find the rest of the procedure in the chapter " Parameters for creating the icc profile " of the tutorial "Creating a profile from a standard test pattern"
For more information, see the chapter: Parameters for creating the icc profile