Control of an illuminant
Illum Reader is a function that analyzes light.
Its purpose is to check the quality of your light in a light booth or under your viewing conditions.
Prerequisites
This feature can only work with the following spectrophotometers:
- Konica Minolta MYIRO (Optional Ambient Light Adapter)
- XRite Eye One Pro
- XRite Eye One Pro (EFI ES 1000)
- XRite Eye One Pro 2 (EFI ES 2000)
- XRite Eye One Pro 3 (EFI ES 3000) and XRite Eye One Pro3 PLUS
Attention some XRite I1 Pro OEM cannot measure the illuminant
How to use Illum Reader
Click on the icon "Create Light" in the toolbar of Coraye
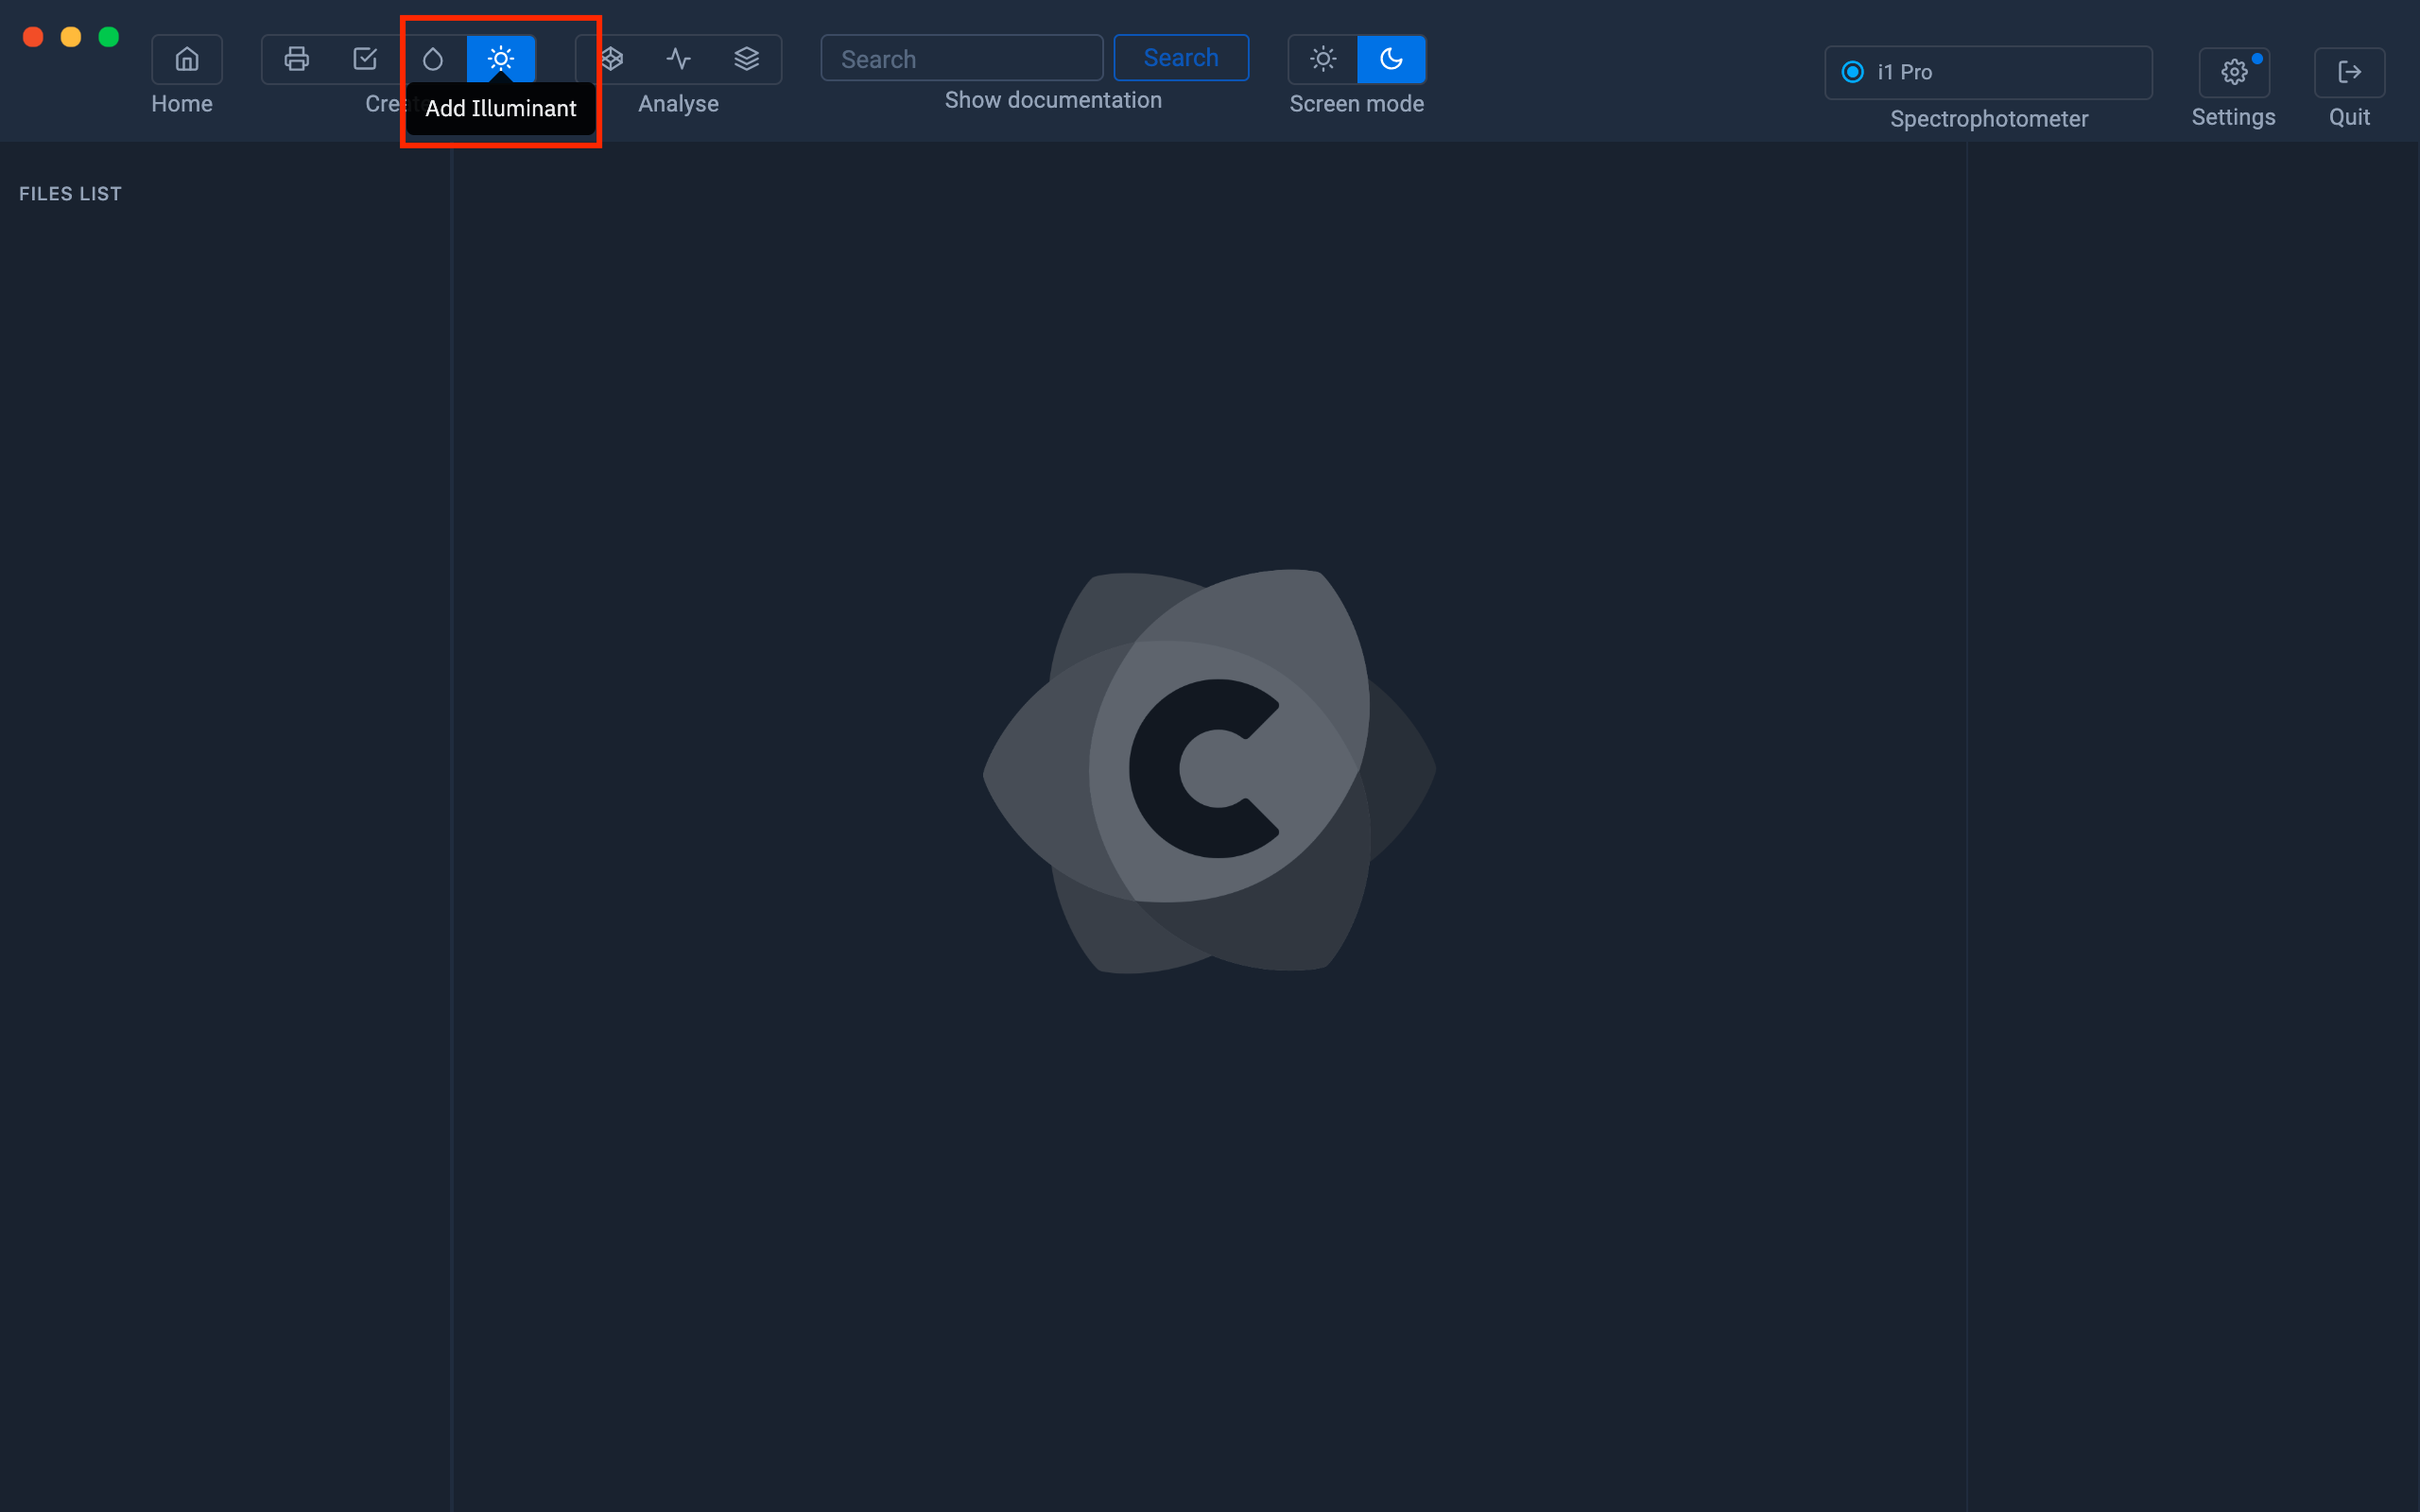
Make sure your spectrophotometer is connected.
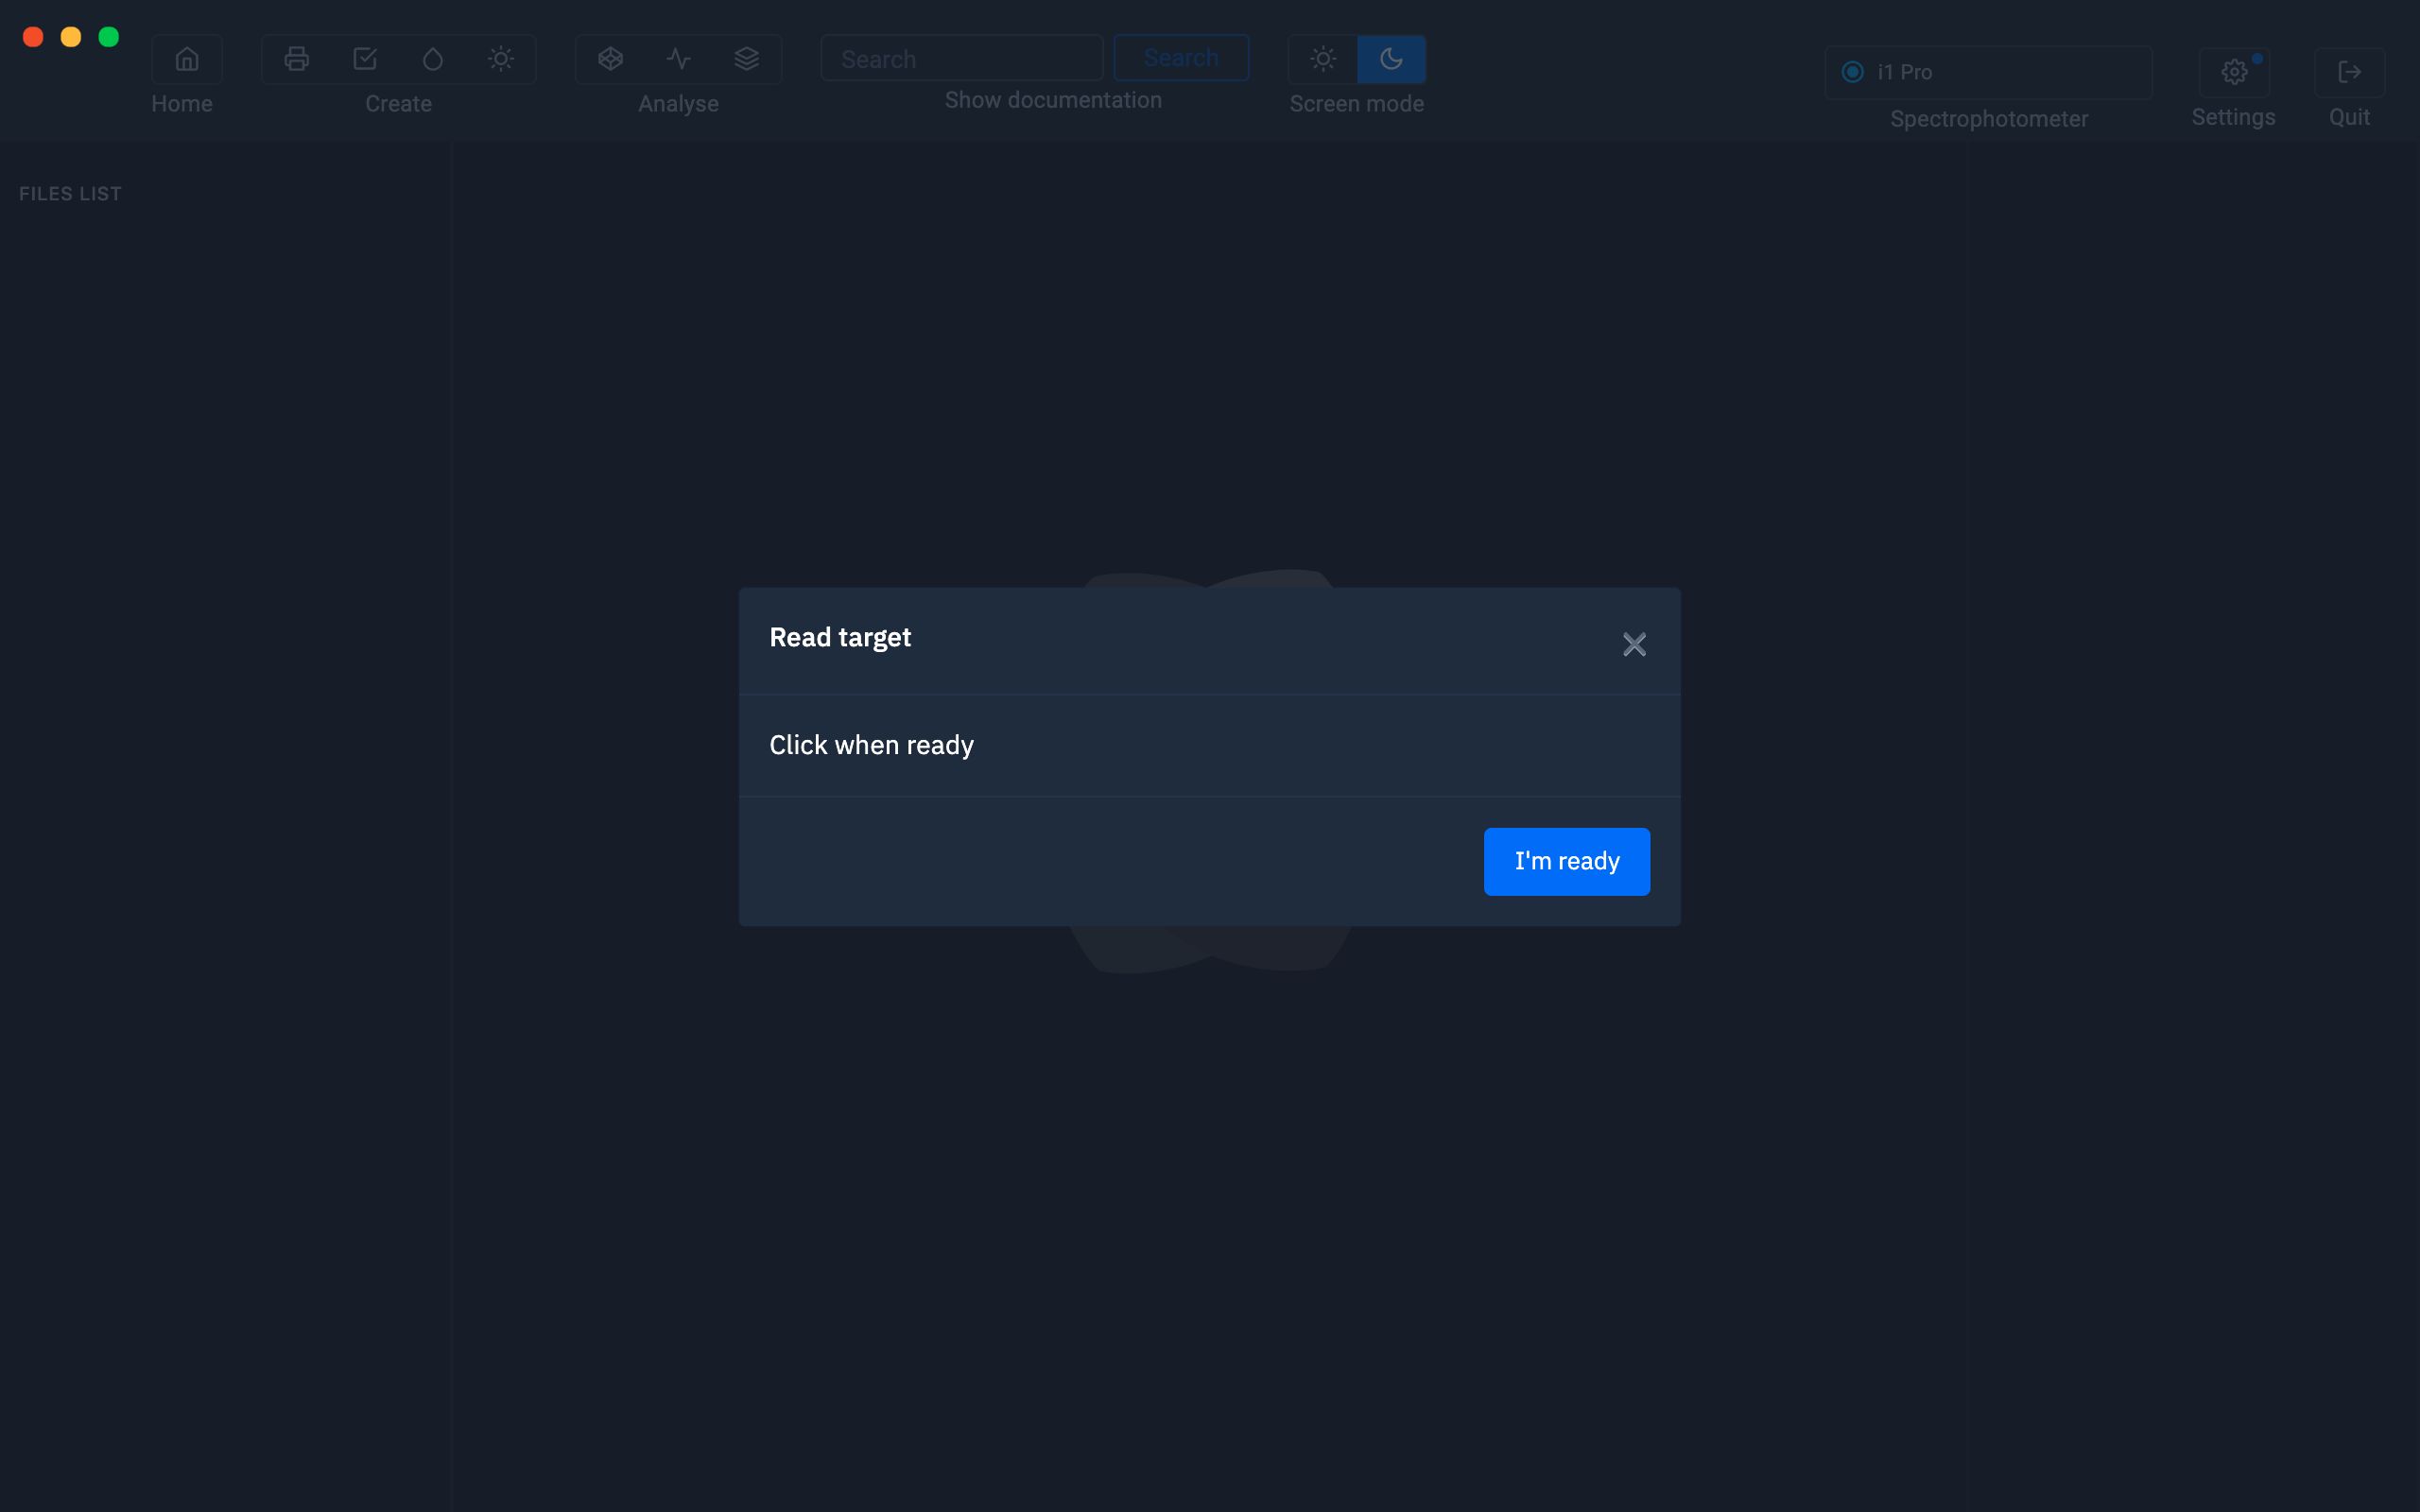
When the "Read the test pattern" window appears, click on "I'm ready".
A new window will appear to calibrate your spectrophotometer.
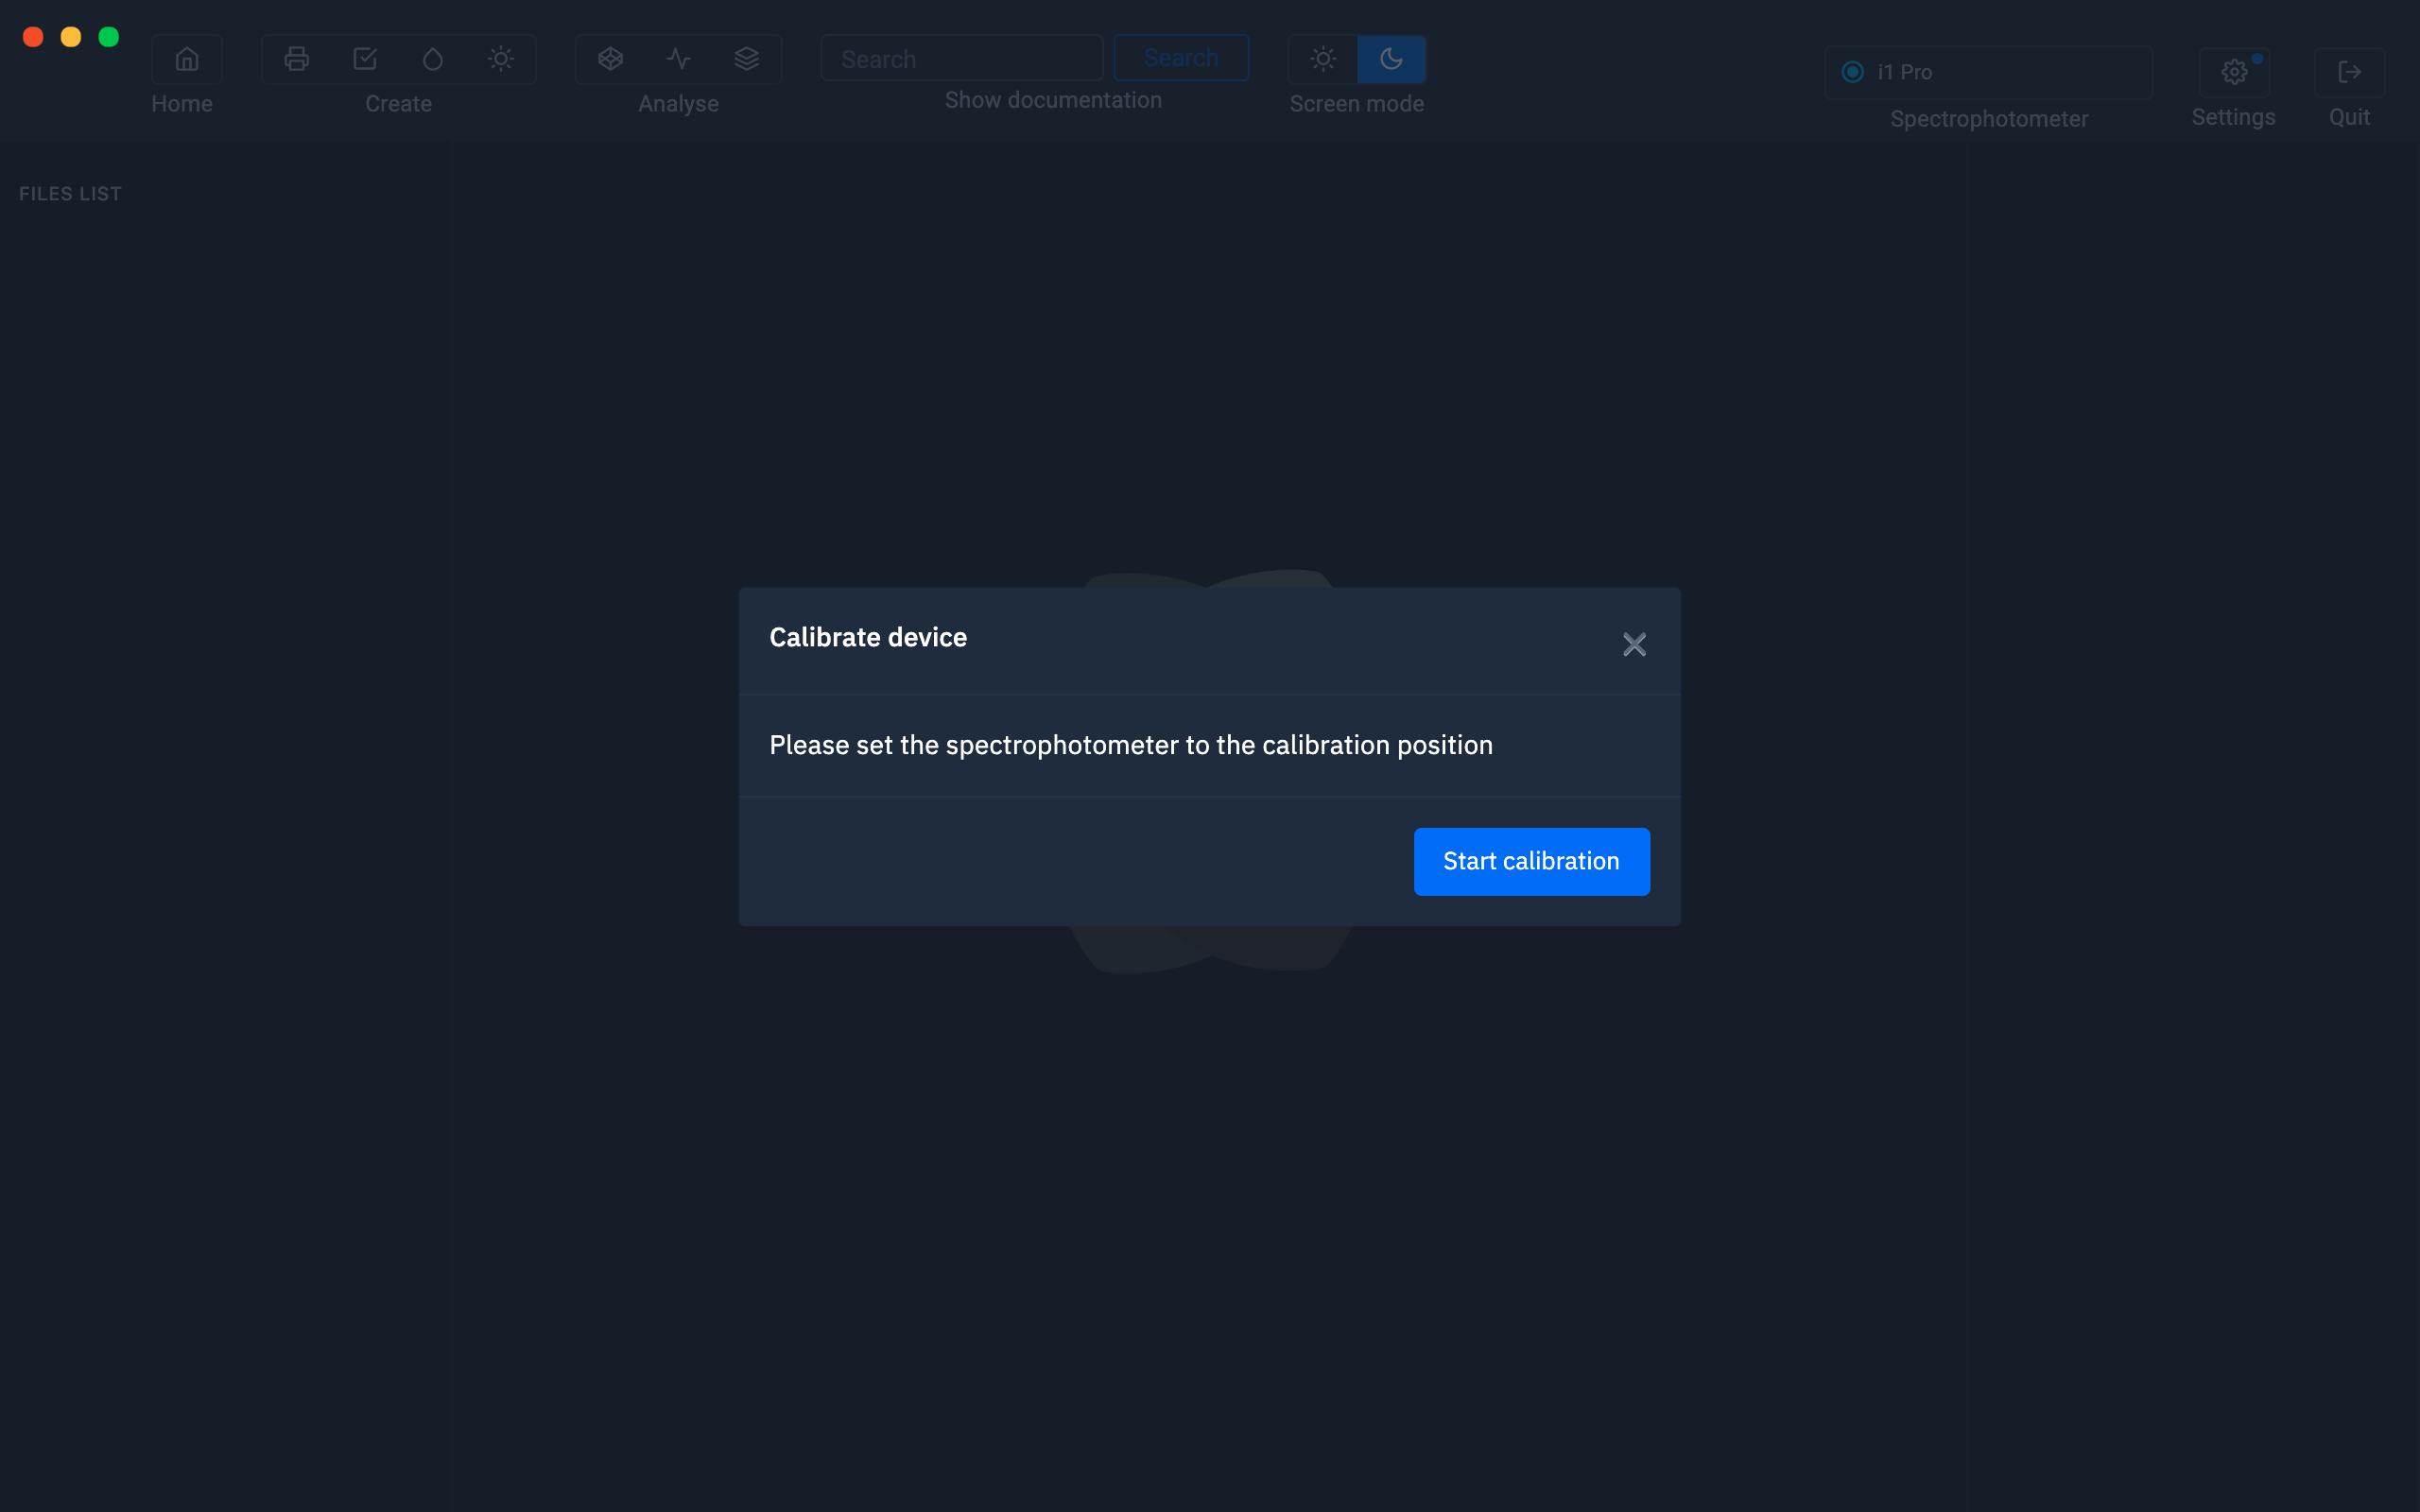
Place the spectrophotometer in its calibration position in its calibration position.
|
Konica Minolta MYIRO |
 |
| XRite I1 Pro 3 |
|
| XRite I1 Pro 2 | 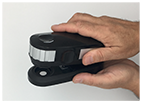 |
| XRite I1 Pro | 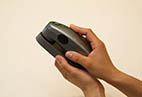 |
Then click on the Start calibration button.
When the calibration is complete, a new window will appear.
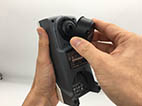
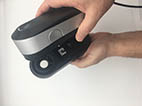
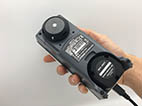
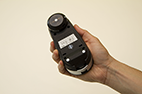
Attention, you must use the cap to read the light with
the Konica Minolta MYIRO, the XRite Eye One Pro 1, 2, 3 and 3 PLUS.
|
Konica Minolta MYIRO |
|
|
XRite Eye One Pro 3 and 3 PLUS |
 |
| XRite Eye One Pro 2 |
|
| XRite Eye One Pro |  |
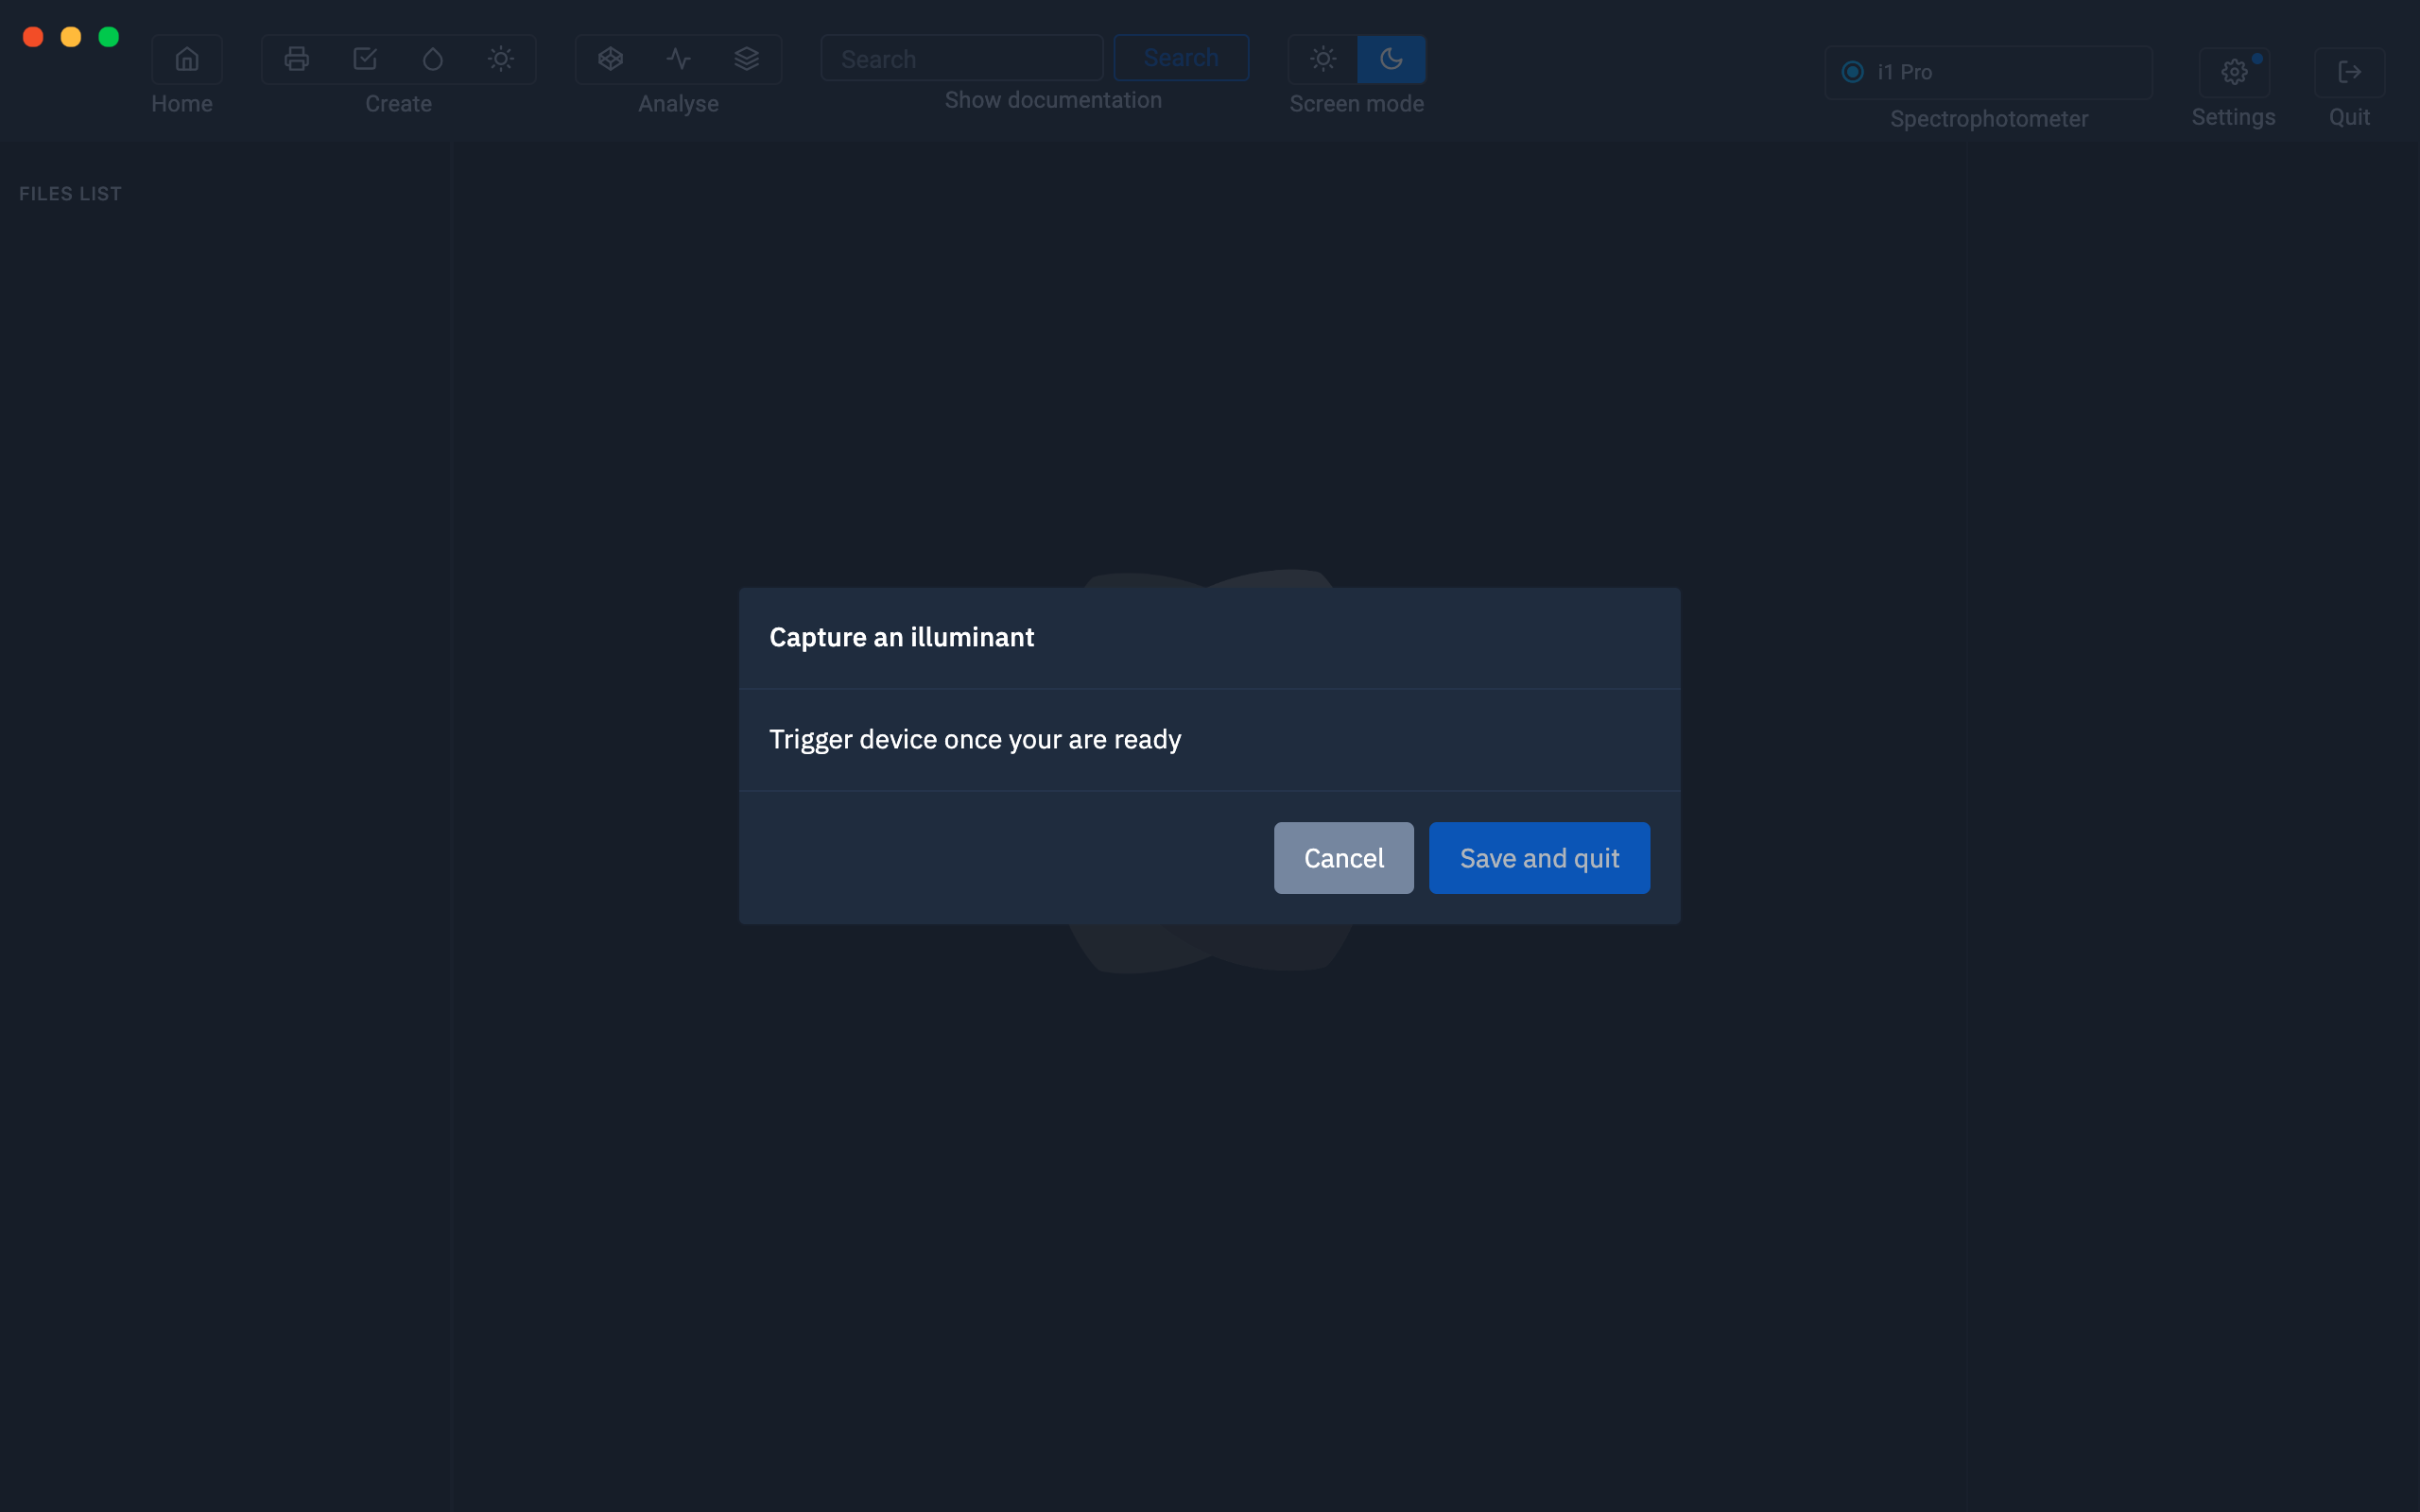
To capture the light, it is now sufficient to measure directly with the spectrophotometer.
Successive measurements will be displayed one below the other.
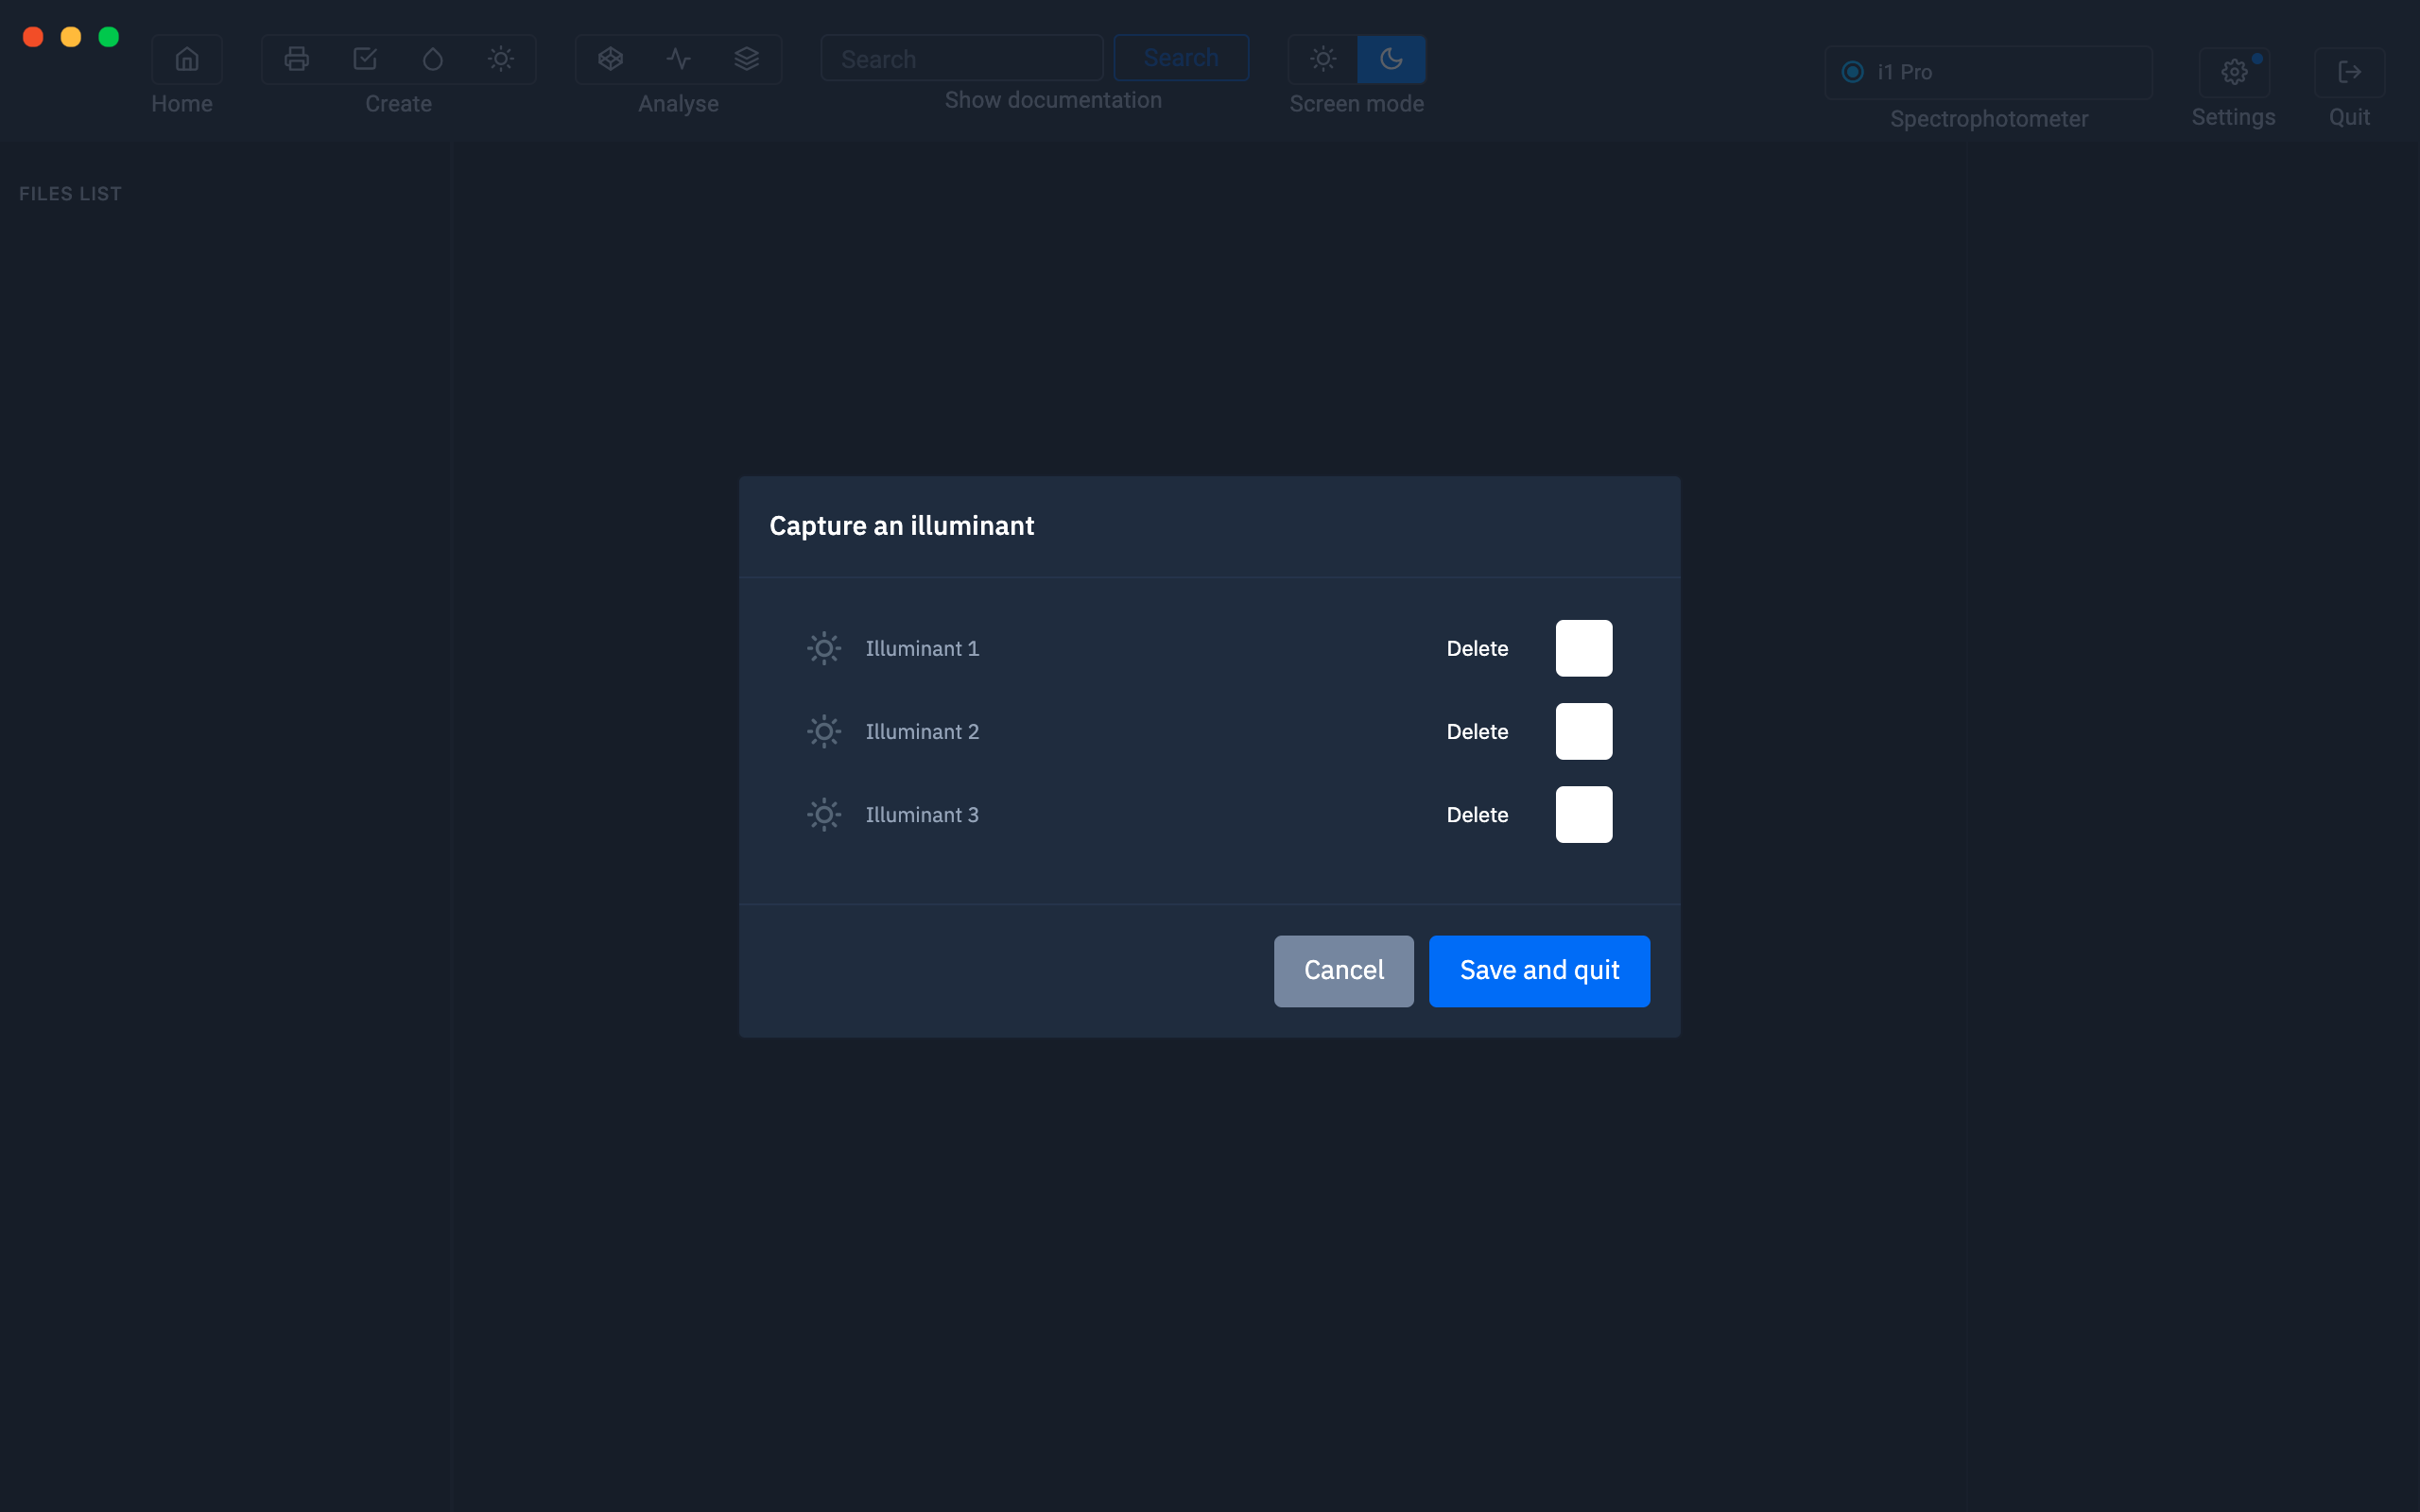
You can take multiple measurements and rename them as you want.
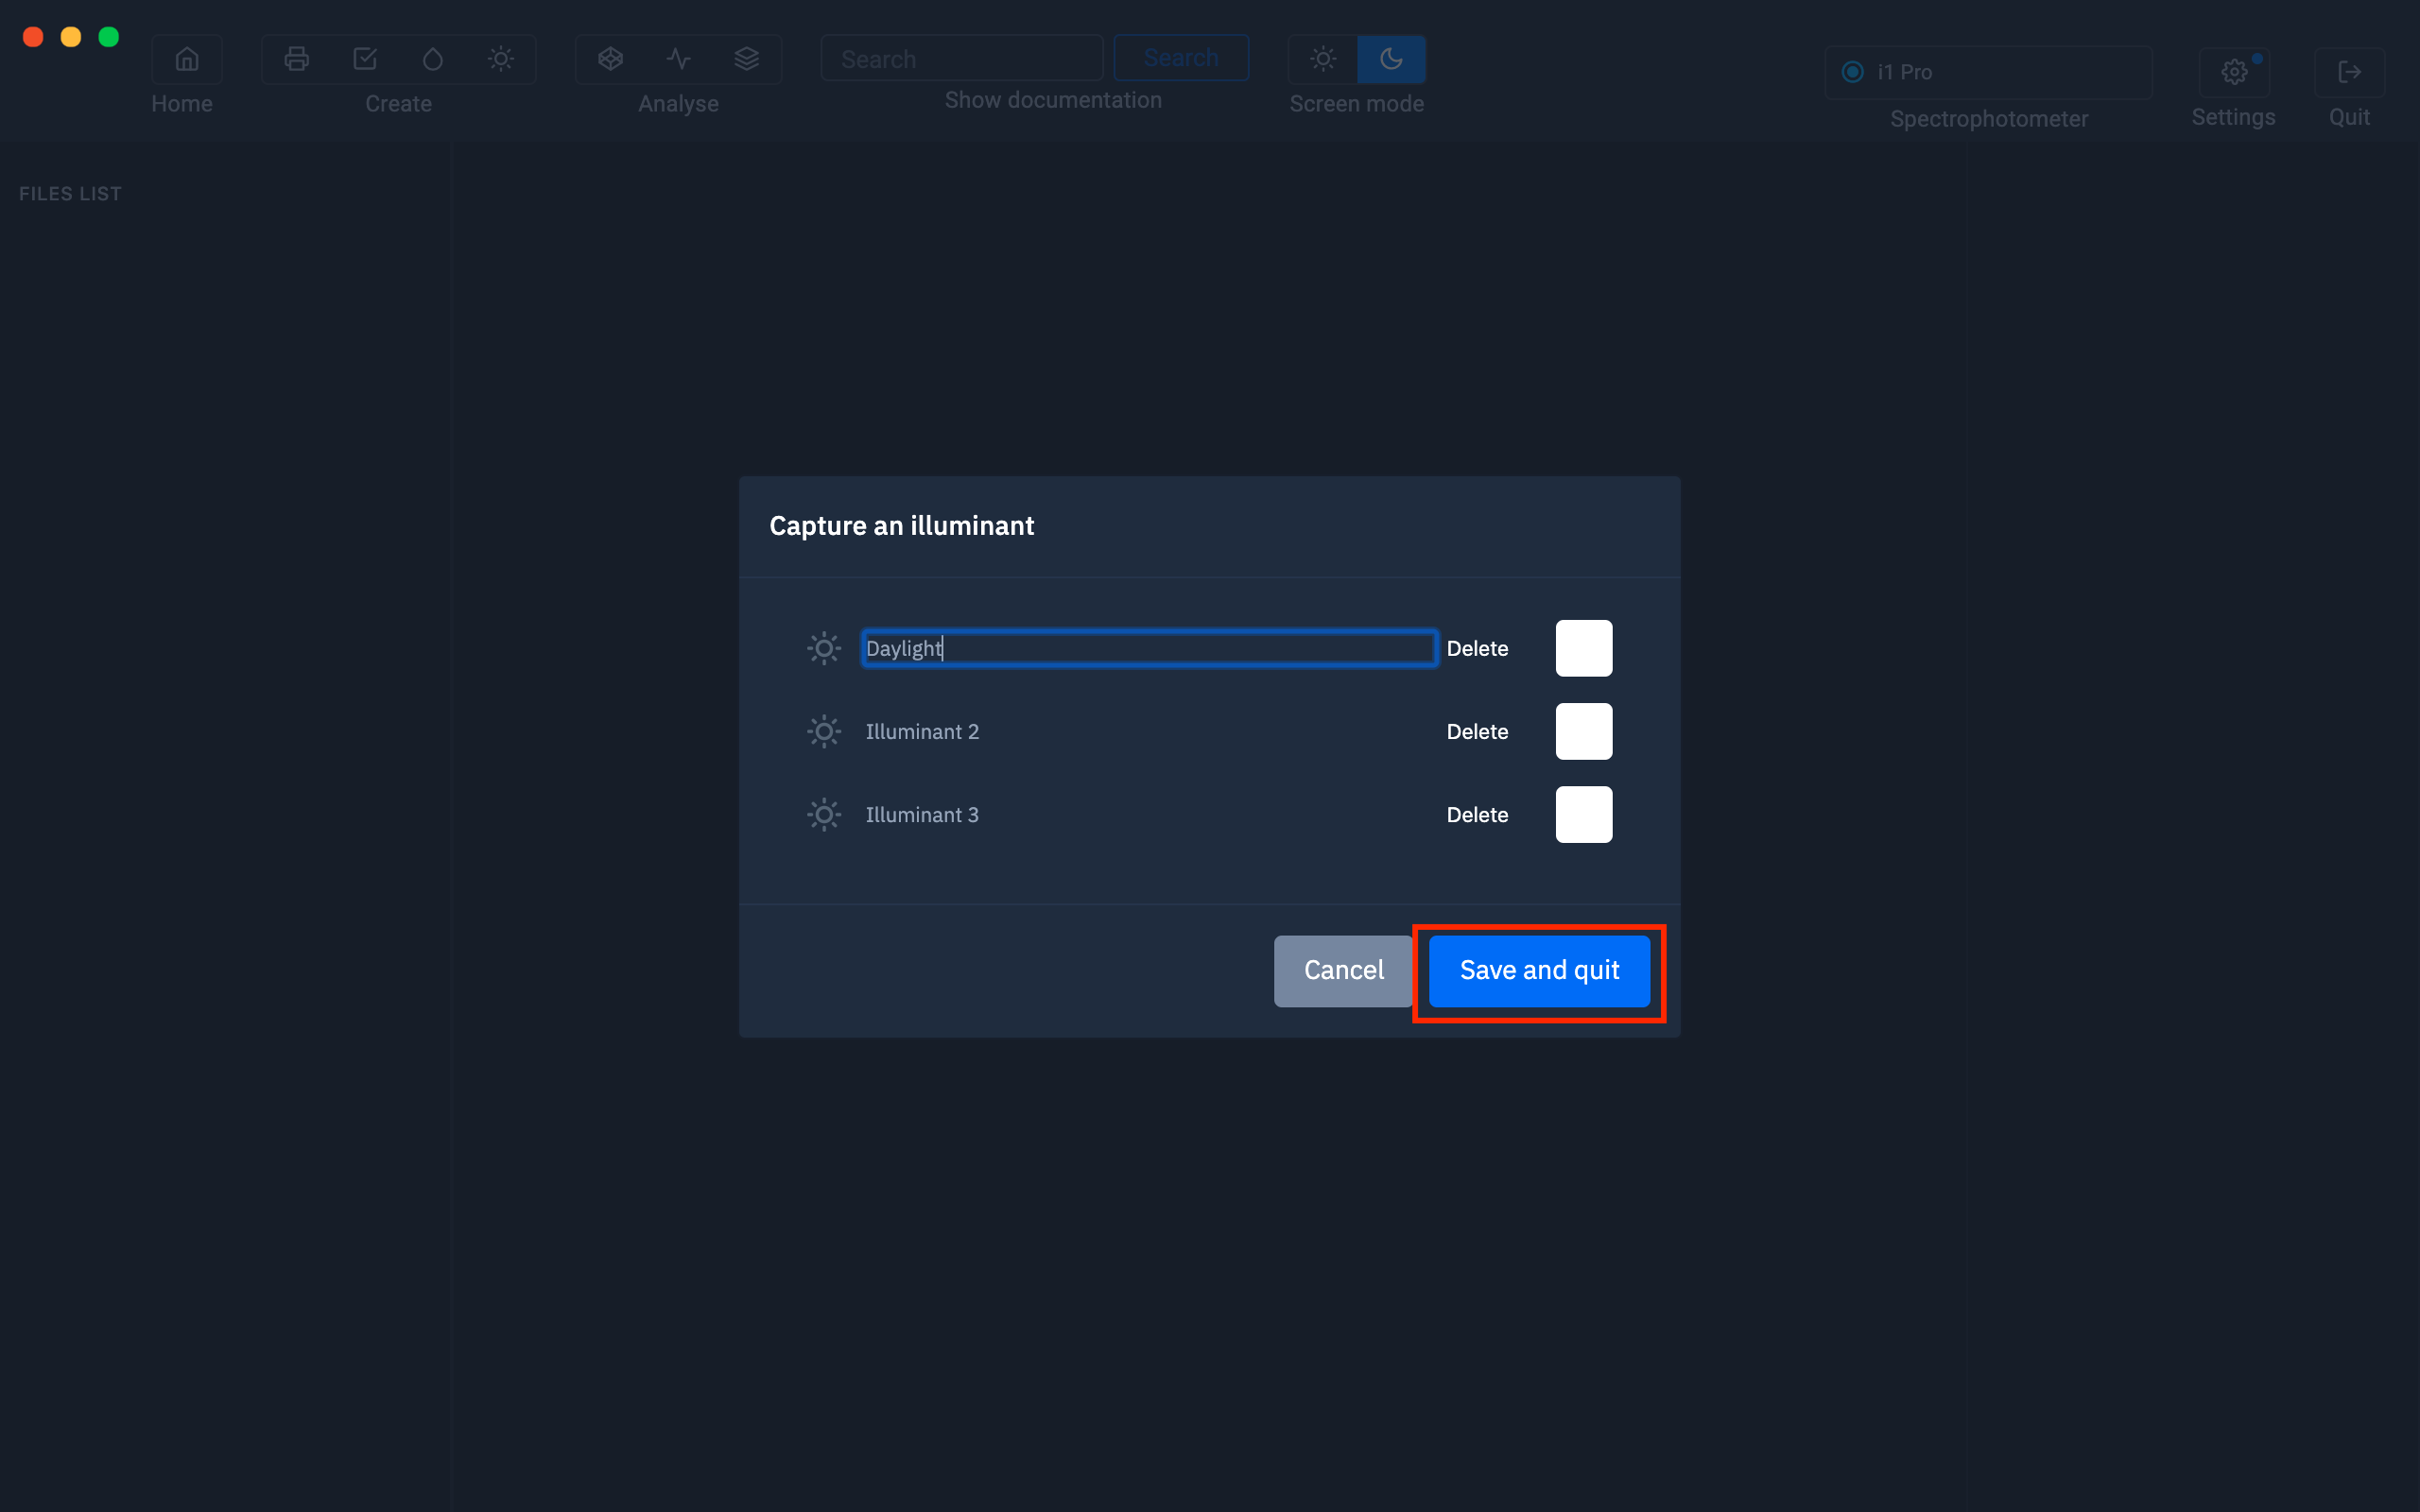
When your measurements are complete, click on “ Save and exit”.
Your light samples will be added in the left column.
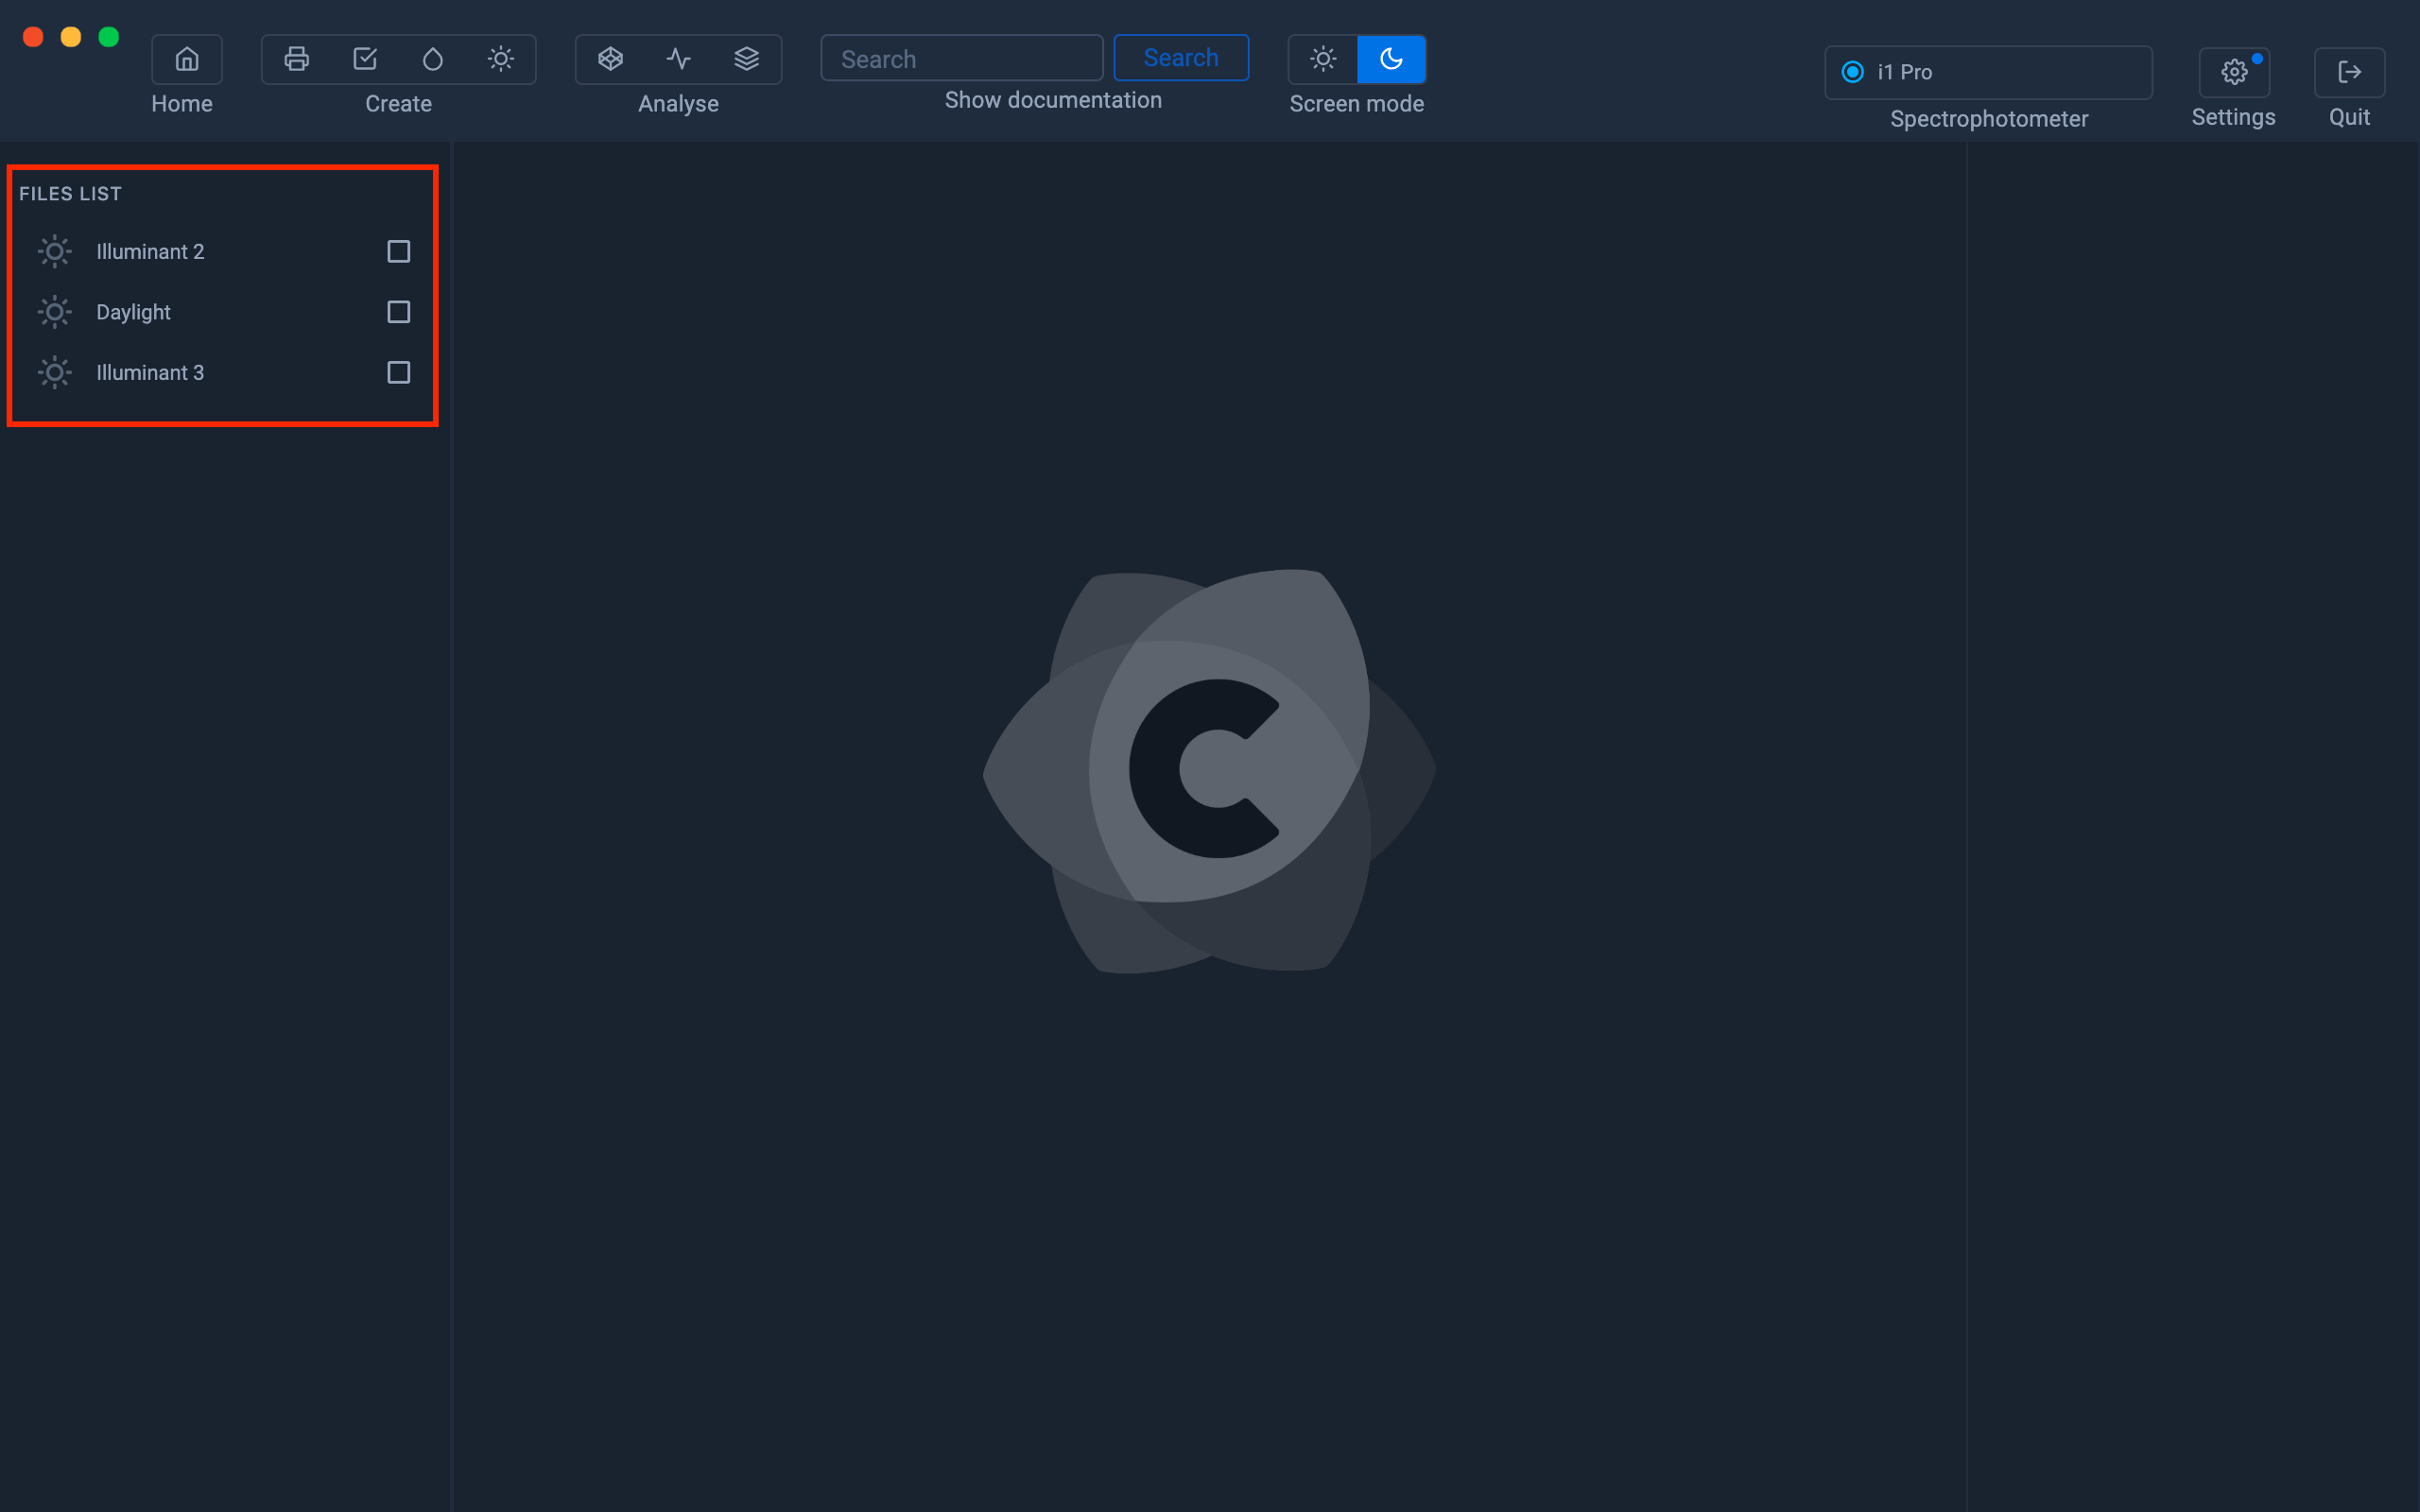
How to manage your light samples
Right click on the color to rename, duplicate and delete.
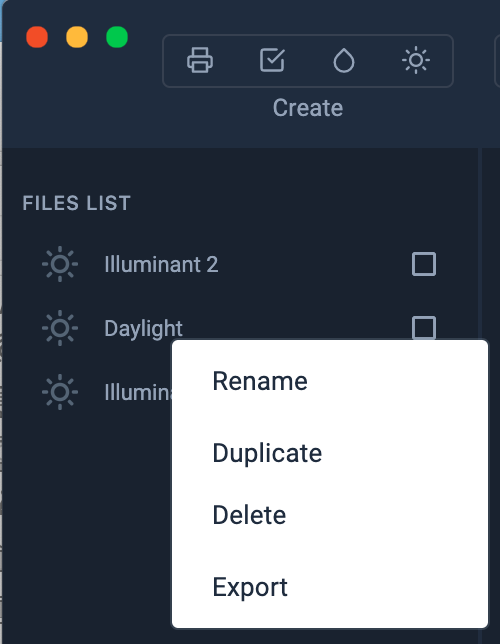
These .sp files are useful for sharing and saving your light samples.
To save your measurement, right click on the measured light in the left bar, then select "Export" to save as a .sp file.
As you see, you can also rename, duplicate or delete the file when you click on it.
What are the values associated with the measured sample?
When we measure a light, we can get information like CCT, CRI, Ra, MI, Brightness, Lab and x, y.
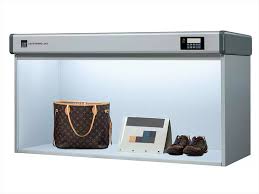
Example:
Control of a Just Normlicht D65 viewer set to 2000 lux

The CRI (Color Rendering Index (CRI)) is an indicator used to quantify the quality of light based on its ability to render the colors of objects naturally, compared to an ideal light source (daylight or reference light).The higher the CRI, the more the light is able to faithfully reproduce colors, which allows objects to be perceived more realistically.It is calculated on a sample of 15 reference colors:

The CRI is expressed on a scale from 0 to 100:- A CRI of 100 means that the light source renders colors in a perfectly natural way (like natural light or sunlight)
.- A low CRI, below 50, indicates a light that distorts or makes it difficult to perceive colors.
This index is particularly used to evaluate the quality of lighting in contexts where color perception is important, such as in art galleries, retail stores, photography studios, or even in medical environments
Ra uses the same calculation method as CRI, but is calculated on the first 8 reference samples

The metamerism index measures the sensitivity of a light source to cause color differences between two objects that appear the same under one light, but are different under another light source. A low index indicates that the colors remain consistent under different lights, while a high index means that the colors change perceptibly with light, creating a phenomenon of metamerism.
The reference samples are the same as for the calculation of the CRI.
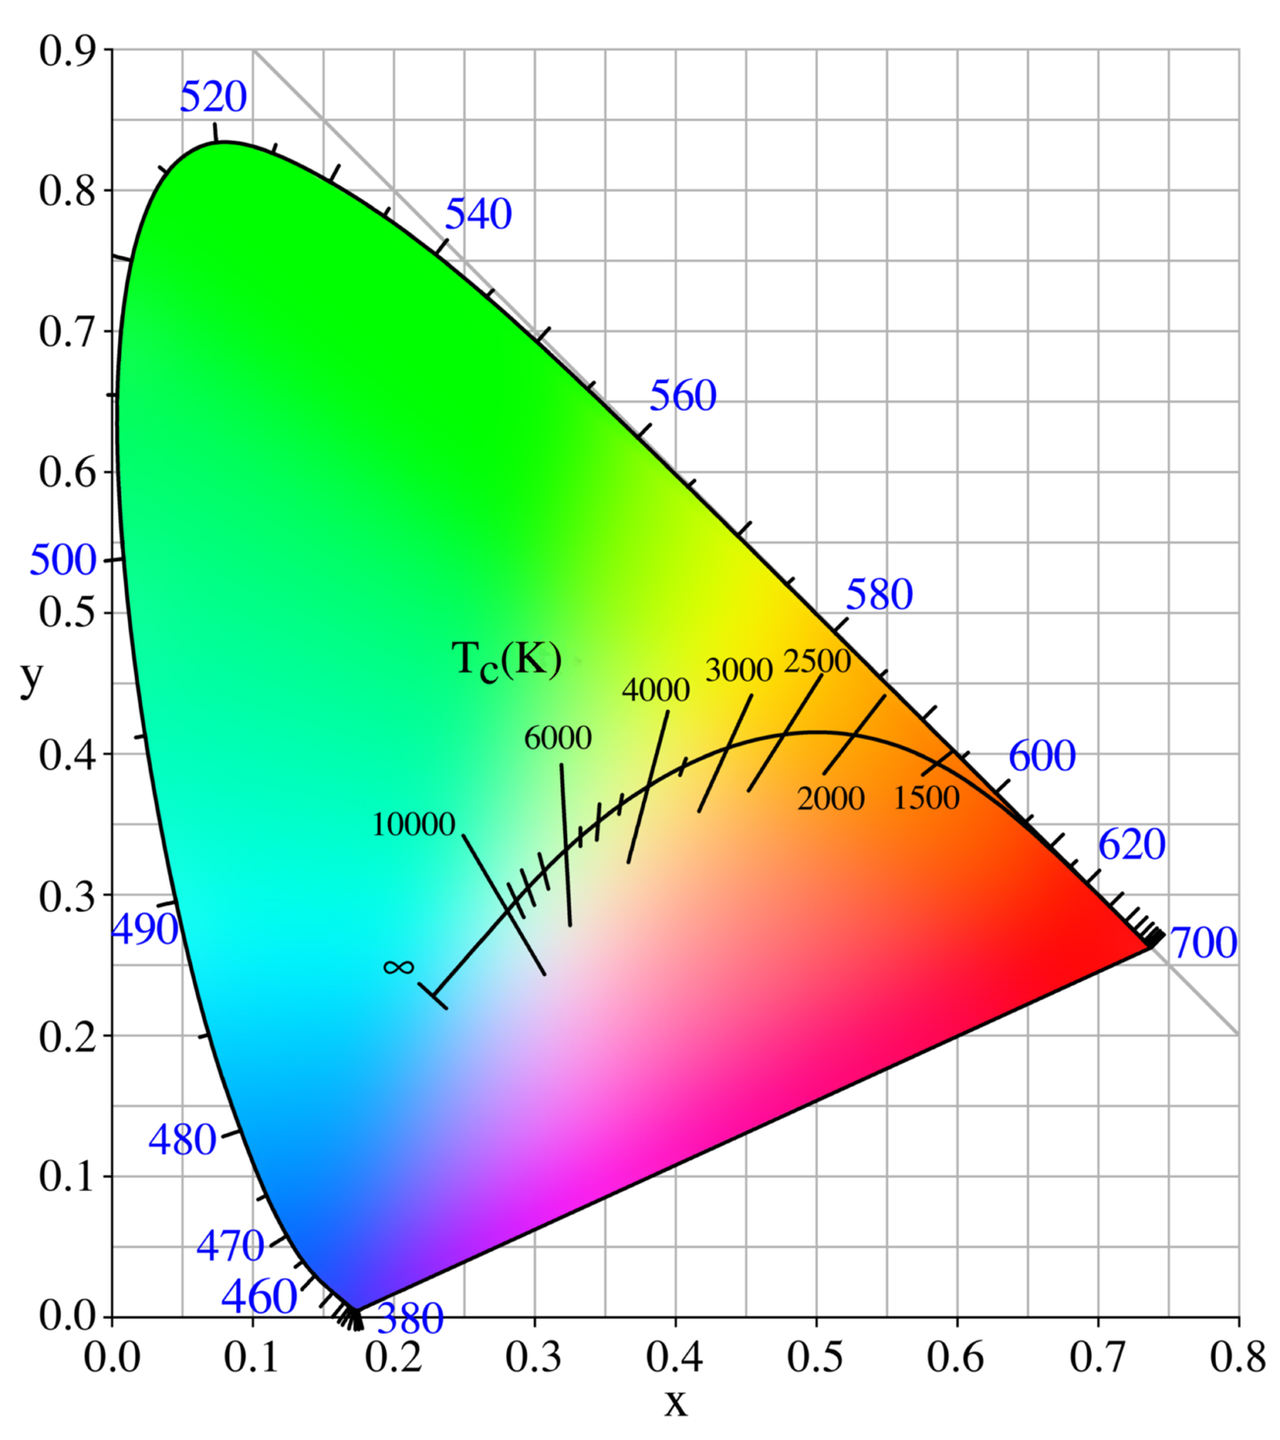
The color temperature of a light source is the temperature of an ideal blackbody radiator emitting light of a color comparable to that of the light source.
Color temperature is a characteristic of visible light that has important applications in the fields of lighting, photography, videography, publishing, manufacturing, astrophysics, horticulture and other fields.
In practice, the color temperature only makes sense for light sources which in fact correspond quite closely to the radiation of certain black bodies, that is to say a light ranging from red to orange to yellow to white. to bluish white; it does not make sense to speak of color temperature, for example, of a green or purple light.
Color temperature is usually expressed in kelvins, using the symbol K, the unit of measurement for absolute temperature.
The color temperatures greater than 5000 K are called "cold color" (bluish), while the lower color temperatures (2700-3000 K) are called "warm colors" (yellow).
"Warm" in this context is an analogy to the heat flux radiated from traditional incandescent lighting rather than temperature.
The spectral peak of warm-colored light is closer to infrared, and most warm-colored natural light sources emit significant infrared radiation.
The fact that "warm" lighting in this sense actually has a "cooler" color temperature is often confusing.
Source: Wikipedia
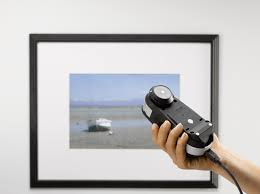
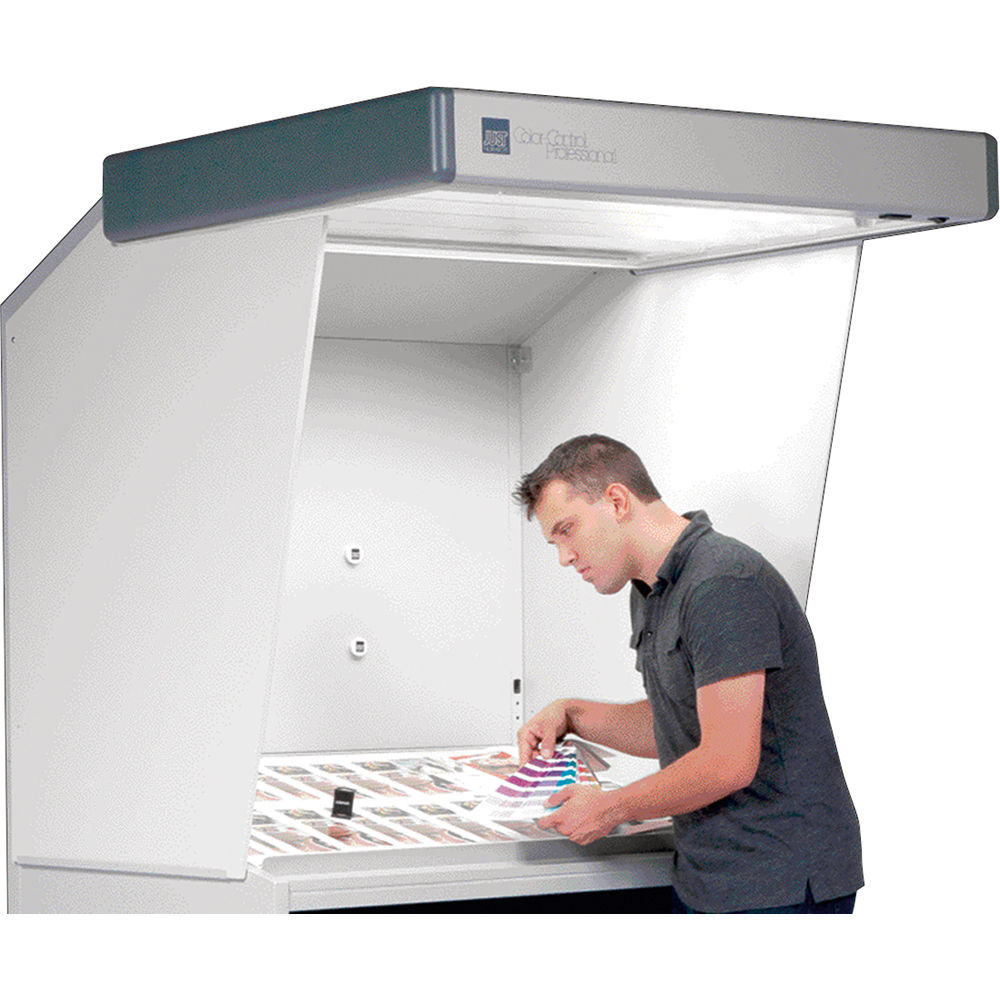
Control your stand or your viewing conditions
IllumReader can be useful for checking uniformity, color temperature, light intensity in a booth, and checking viewing conditions for proofs, objects and prints.
In the field of graphic arts, ISO standards have been defined to standardize the conditions for viewing prints.
Knowing how to control your light is, in a way, knowing how to control your color.
| Viewing condition | P1 Critical Comparison | P2 Practical Appraisal |
 |
 |
 |
ISO 3664: 2009 - VIEWING CONDITIONS
Light source
• The relative spectral power distribution should match that of the CIE D50 illuminant.
• UV energy must comply with CIE D50 illuminant (correlated with M1 in ISO 13655).
Two levels of light intensity
• Critical comparison P1: for example two impressions: illuminance 2000 ± 500 Lux
• Practical evaluation of P2: less critical comparisons, for example. software-proof hard copy: 500 ± 125 Lux or exact adjustment of the illumination of the lighting booth to be monitored
-
Additional definitions
• Homogeneity (control over 9 areas in your stand)-
Surrounding: neutral gray diffuse surface
-
Viewing angle to avoid reflection
-
Light measurement can be used to calculate an Isc profile
-
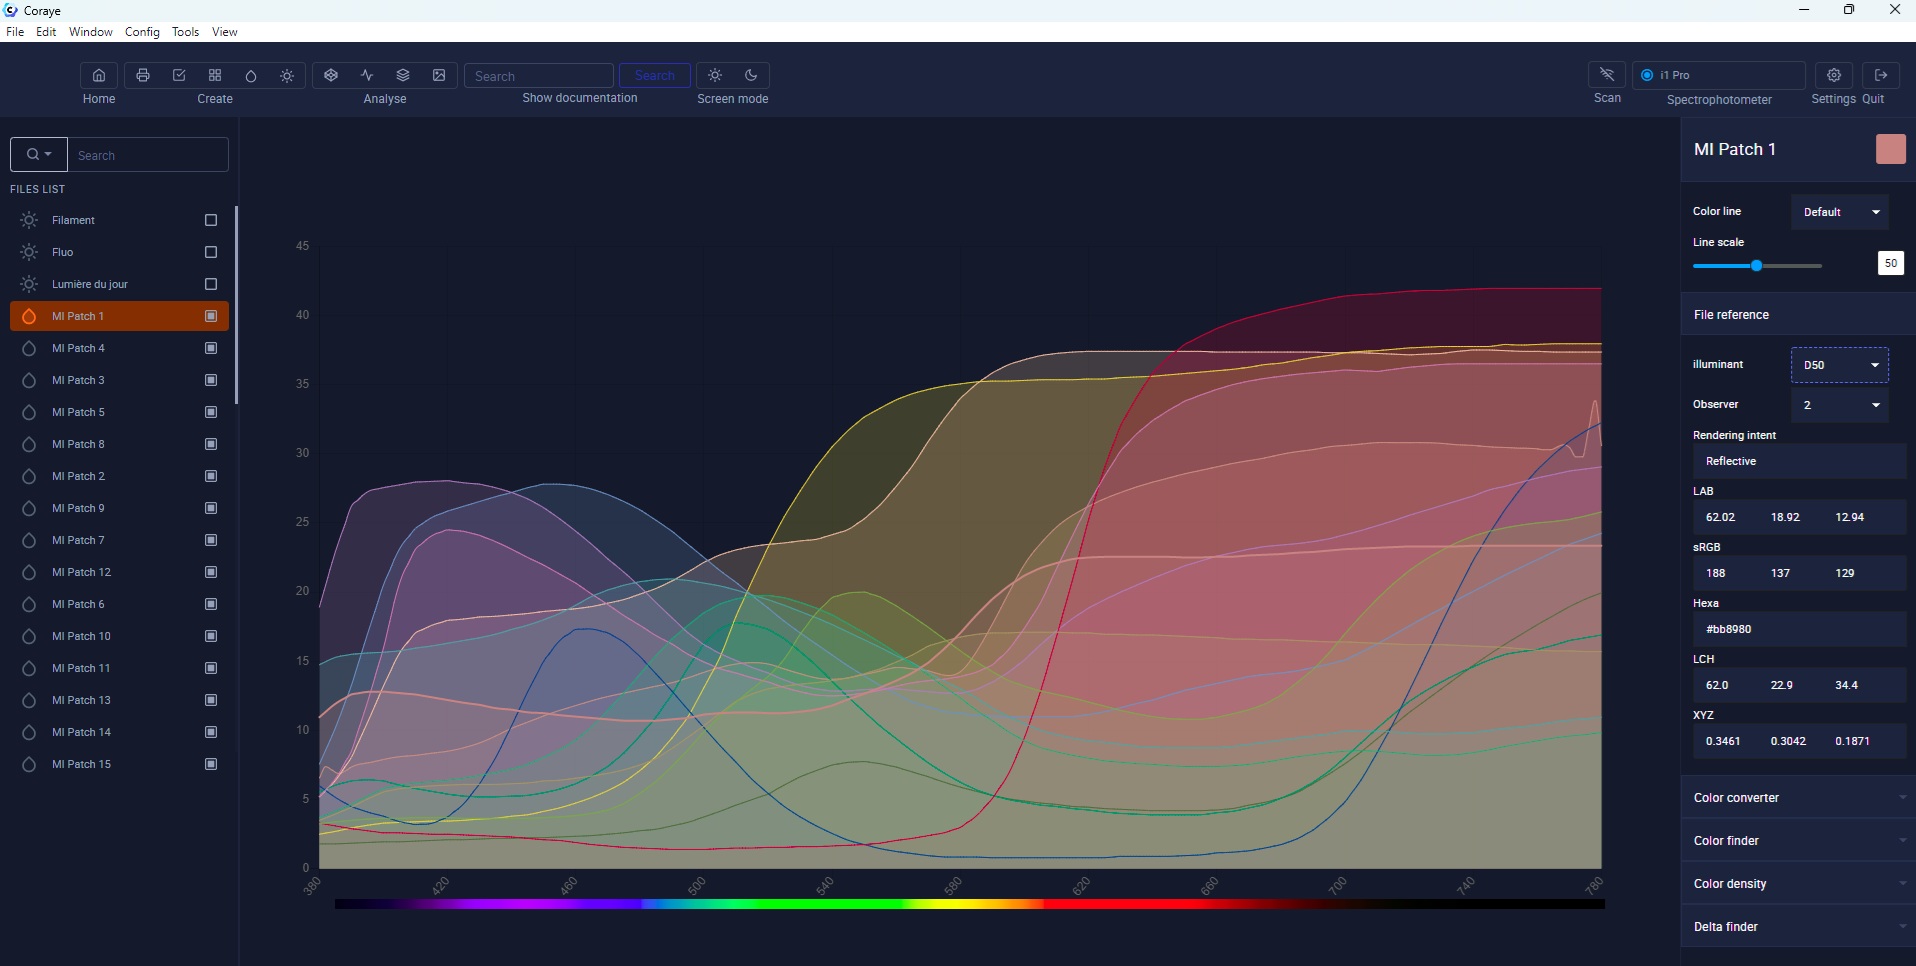
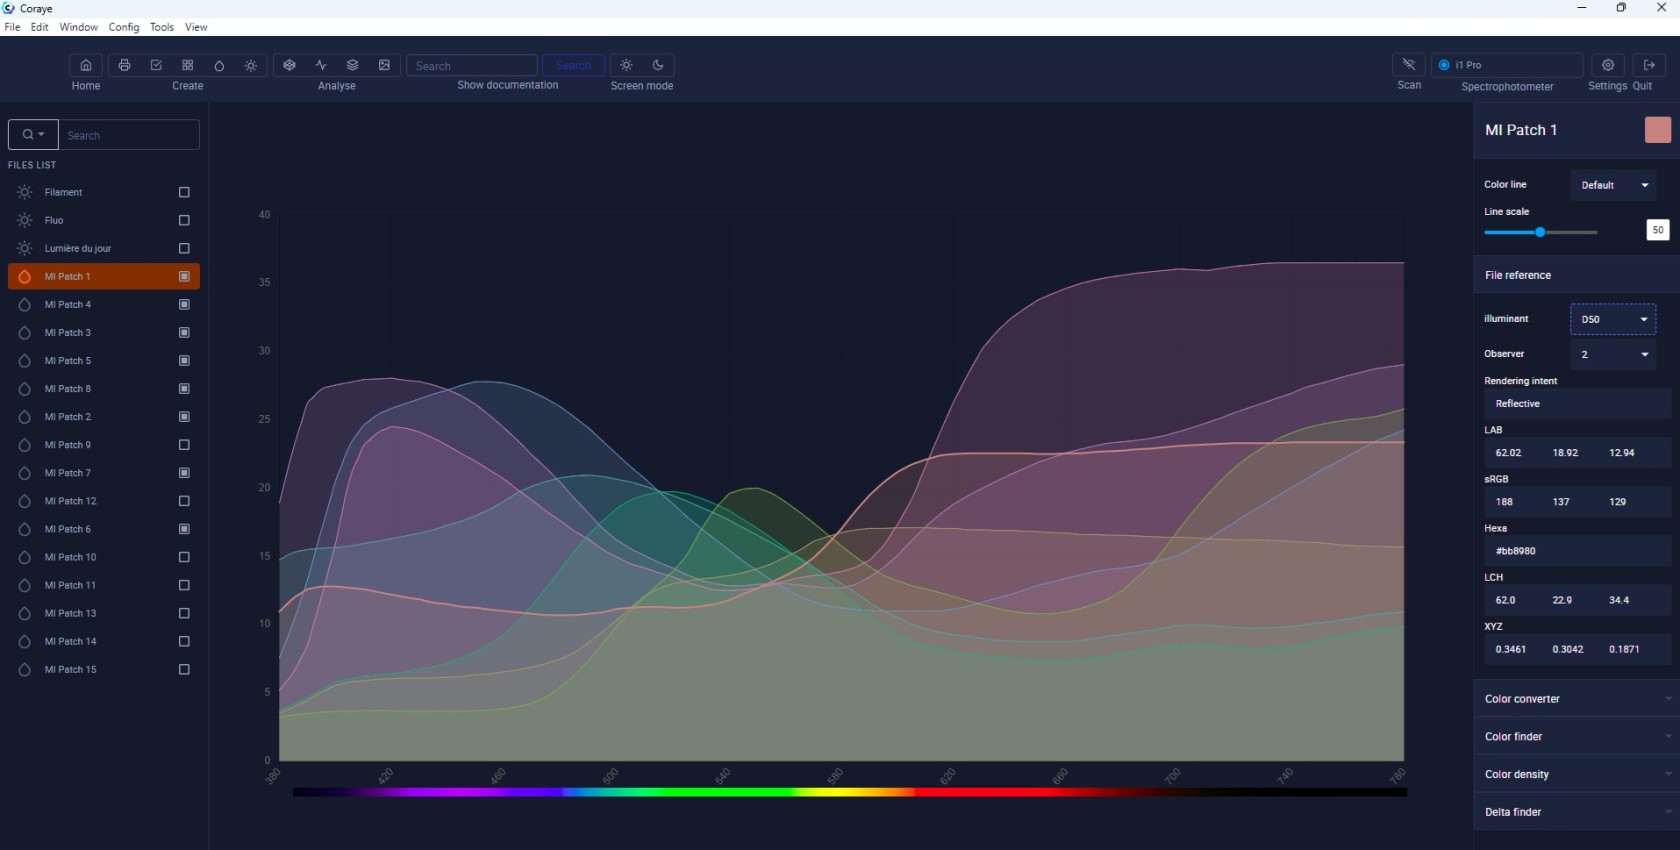
View your reflectance curves in Spectral Viewer.
-
It might be helpful to compare the reflectance curves of your color sample with a spectral curve of a specific light to understand the effect of metamery.
If you need to view the spectral curve of your measured light, you can use the spectral viewer
-
-
For more information, see chapter: Spectral Viewer
Coming soon in a future release:
Added TM-30
TM-30 (or Technical Memorandum 30) is a standard developed by the CIE (Commission Internationale de l'Éclairage) to evaluate the color quality of light sources (illuminants). It was published in 2015 and aims to provide a more comprehensive and accurate method than the traditional color rendering index Ra to evaluate how a light source affects the color perception of an object.
The main features of TM-30 are:
Overall color rendering index (Rf): This is a measure that gives a general idea of the ability of a light source to faithfully render colors. Rf is similar to Ra, but it is based on a larger number of reference colors.
Color Rendering Chart (Gamut Area, or G): The TM-30 also measures the range of colors rendered by the light source. A Gamut Area (or G) evaluates whether the light source tends to saturate or desaturate colors compared to natural light (standard daylight).
Chromaticity Deviation (Rf and Rg): The TM-30 also evaluates chromatic deviations using a set of test colors. This helps identify specific behaviors of light sources, such as a tendency to make colors appear warmer or cooler than they actually are.
Detailed Spectral Efficiency: The TM-30 offers a set of 99 test colors and takes into account the ability of an illuminant to render specific colors with finer precision than traditional systems such as Ra.
In summary, the TM-30 allows a more detailed analysis of how a light source influences color perception, offering a finer assessment than the Ra index alone and taking into account color range and chromatic deviations.
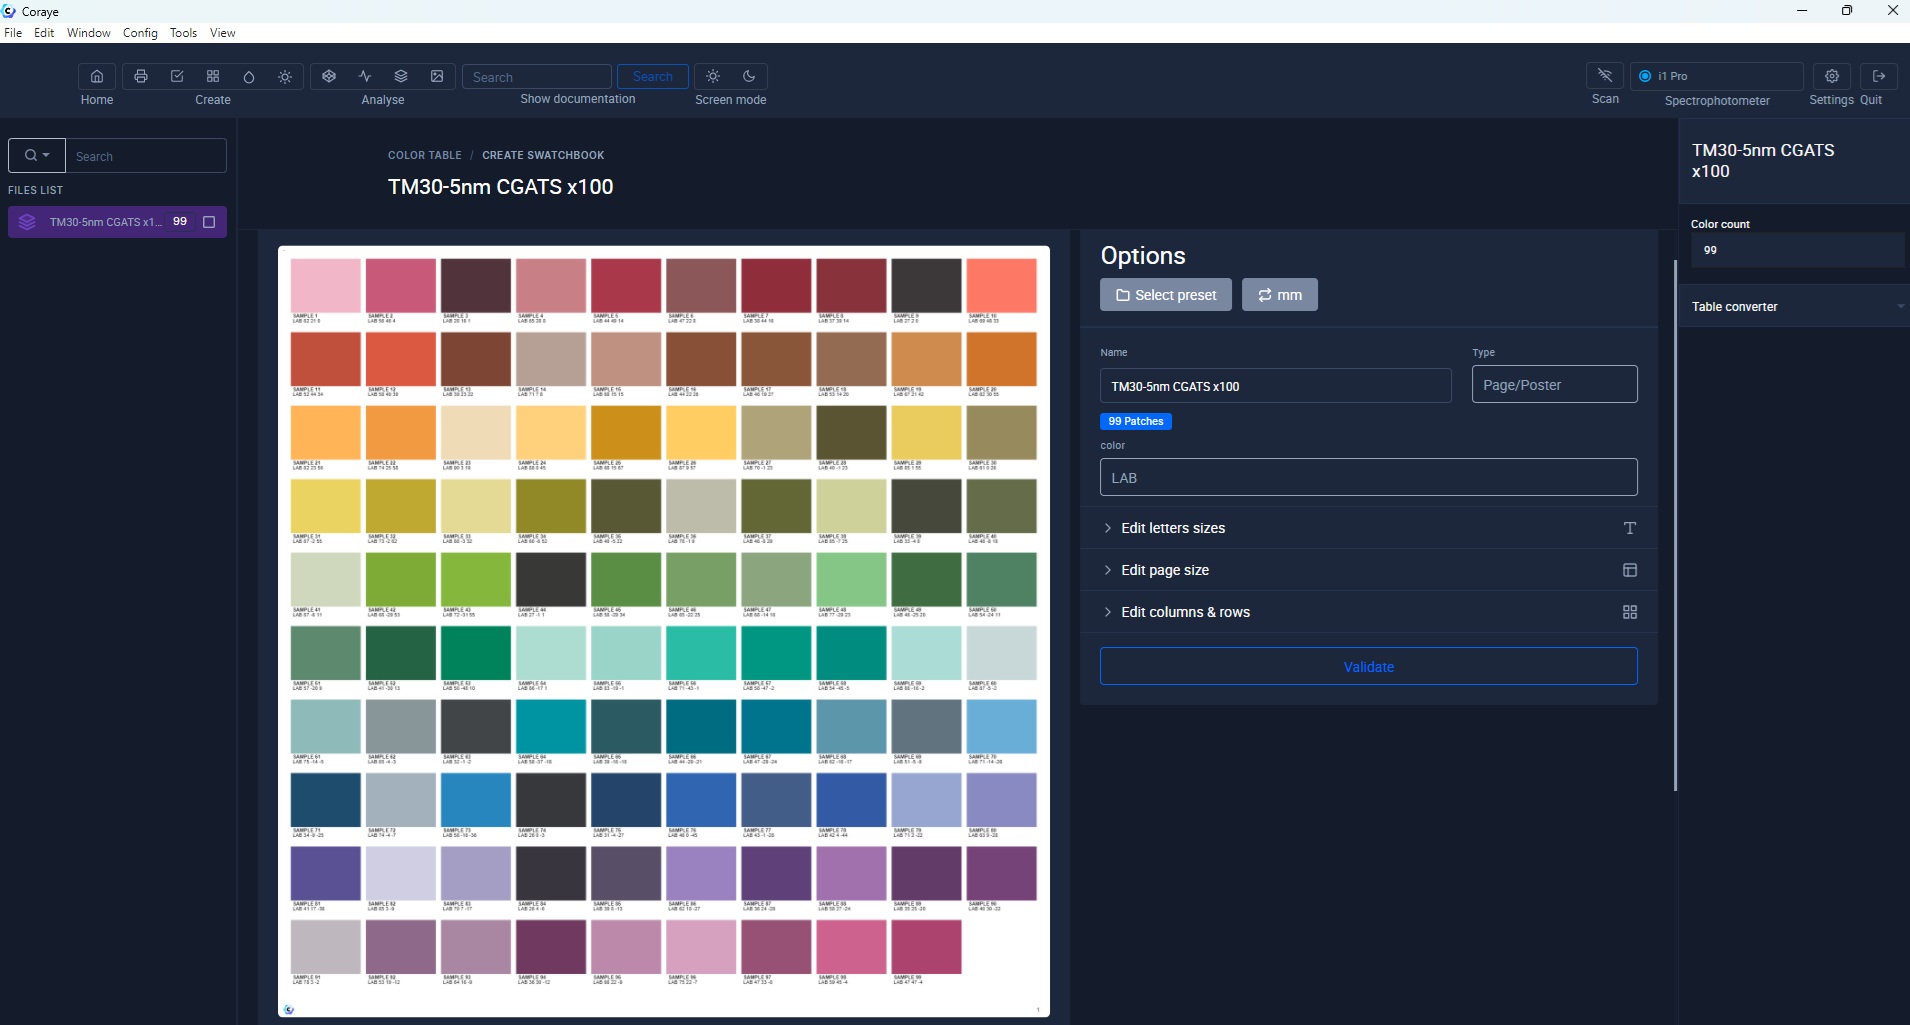 The 99 reference samples used for the calculation of TM-30
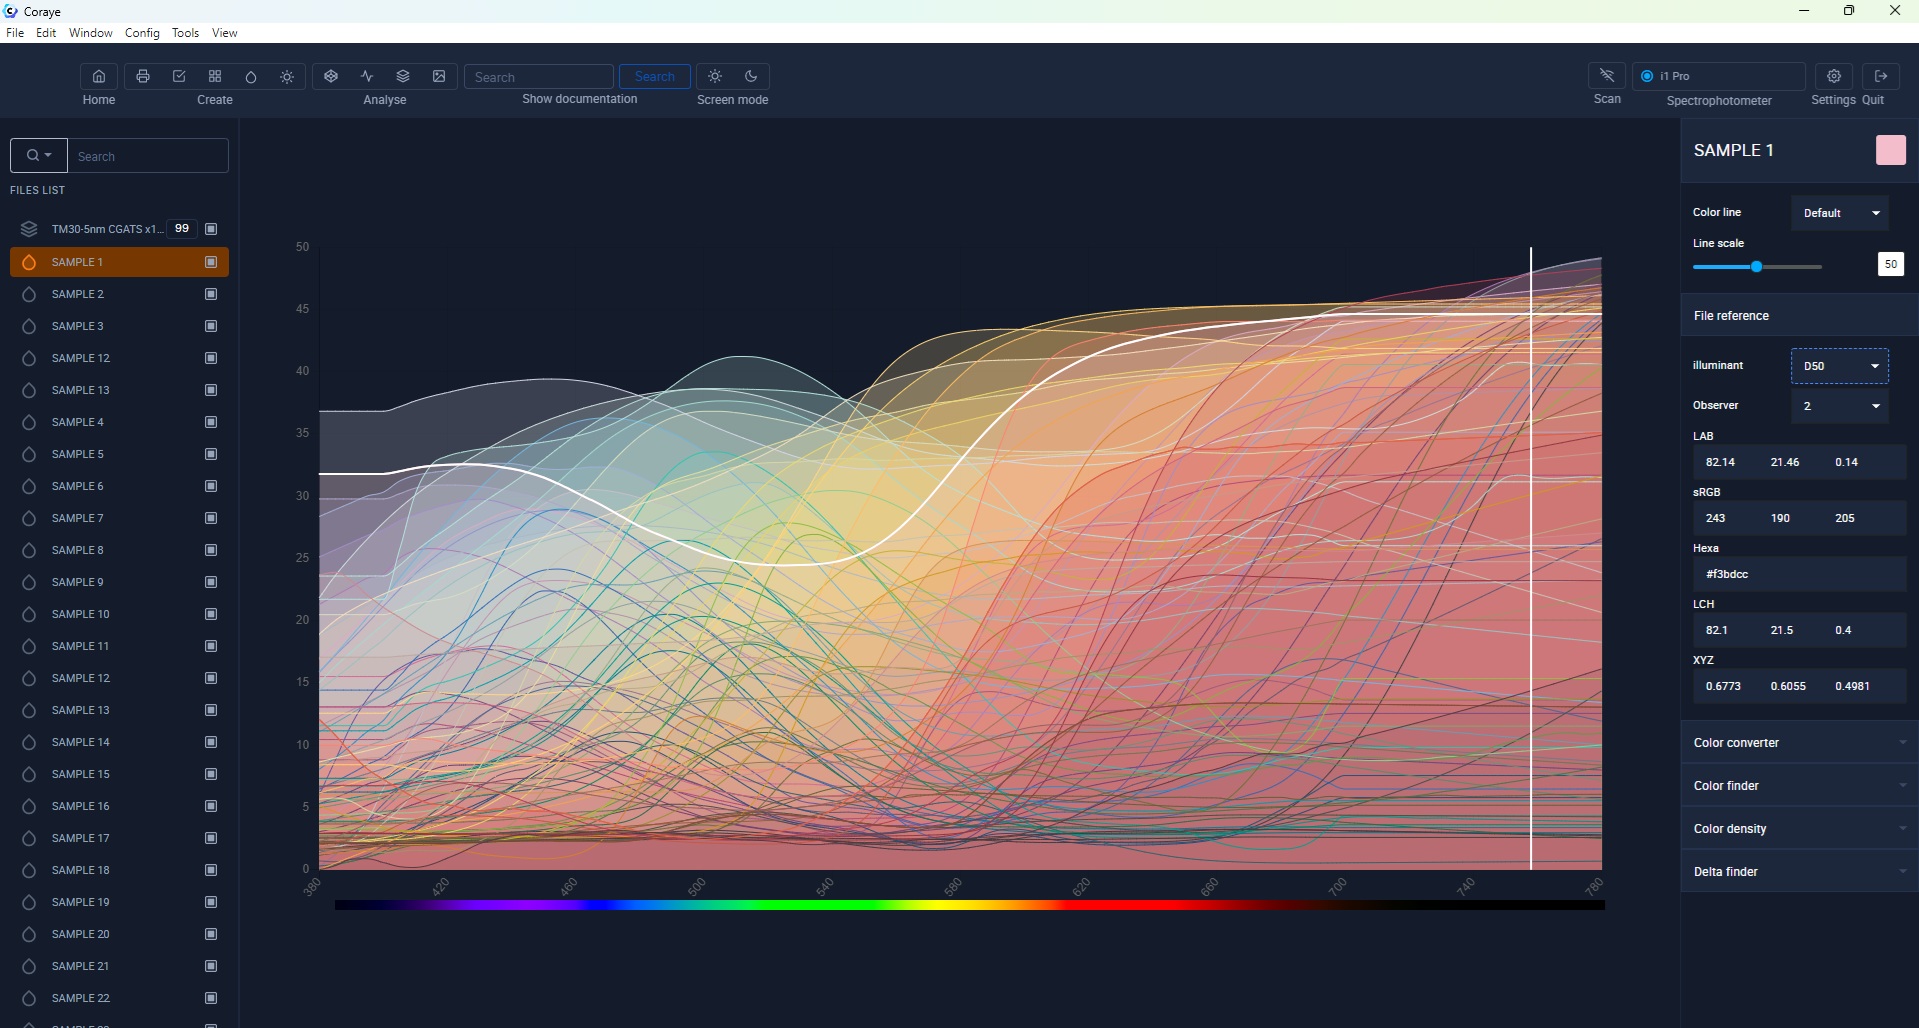 The spectral curves of the 99 samples