Create a baseline from a printed RGB Mediawedge
To produce consistent, high-quality prints, you need to monitor the stability of your printer.The print control module allows you to create your own references.
Launch of the Print Control module
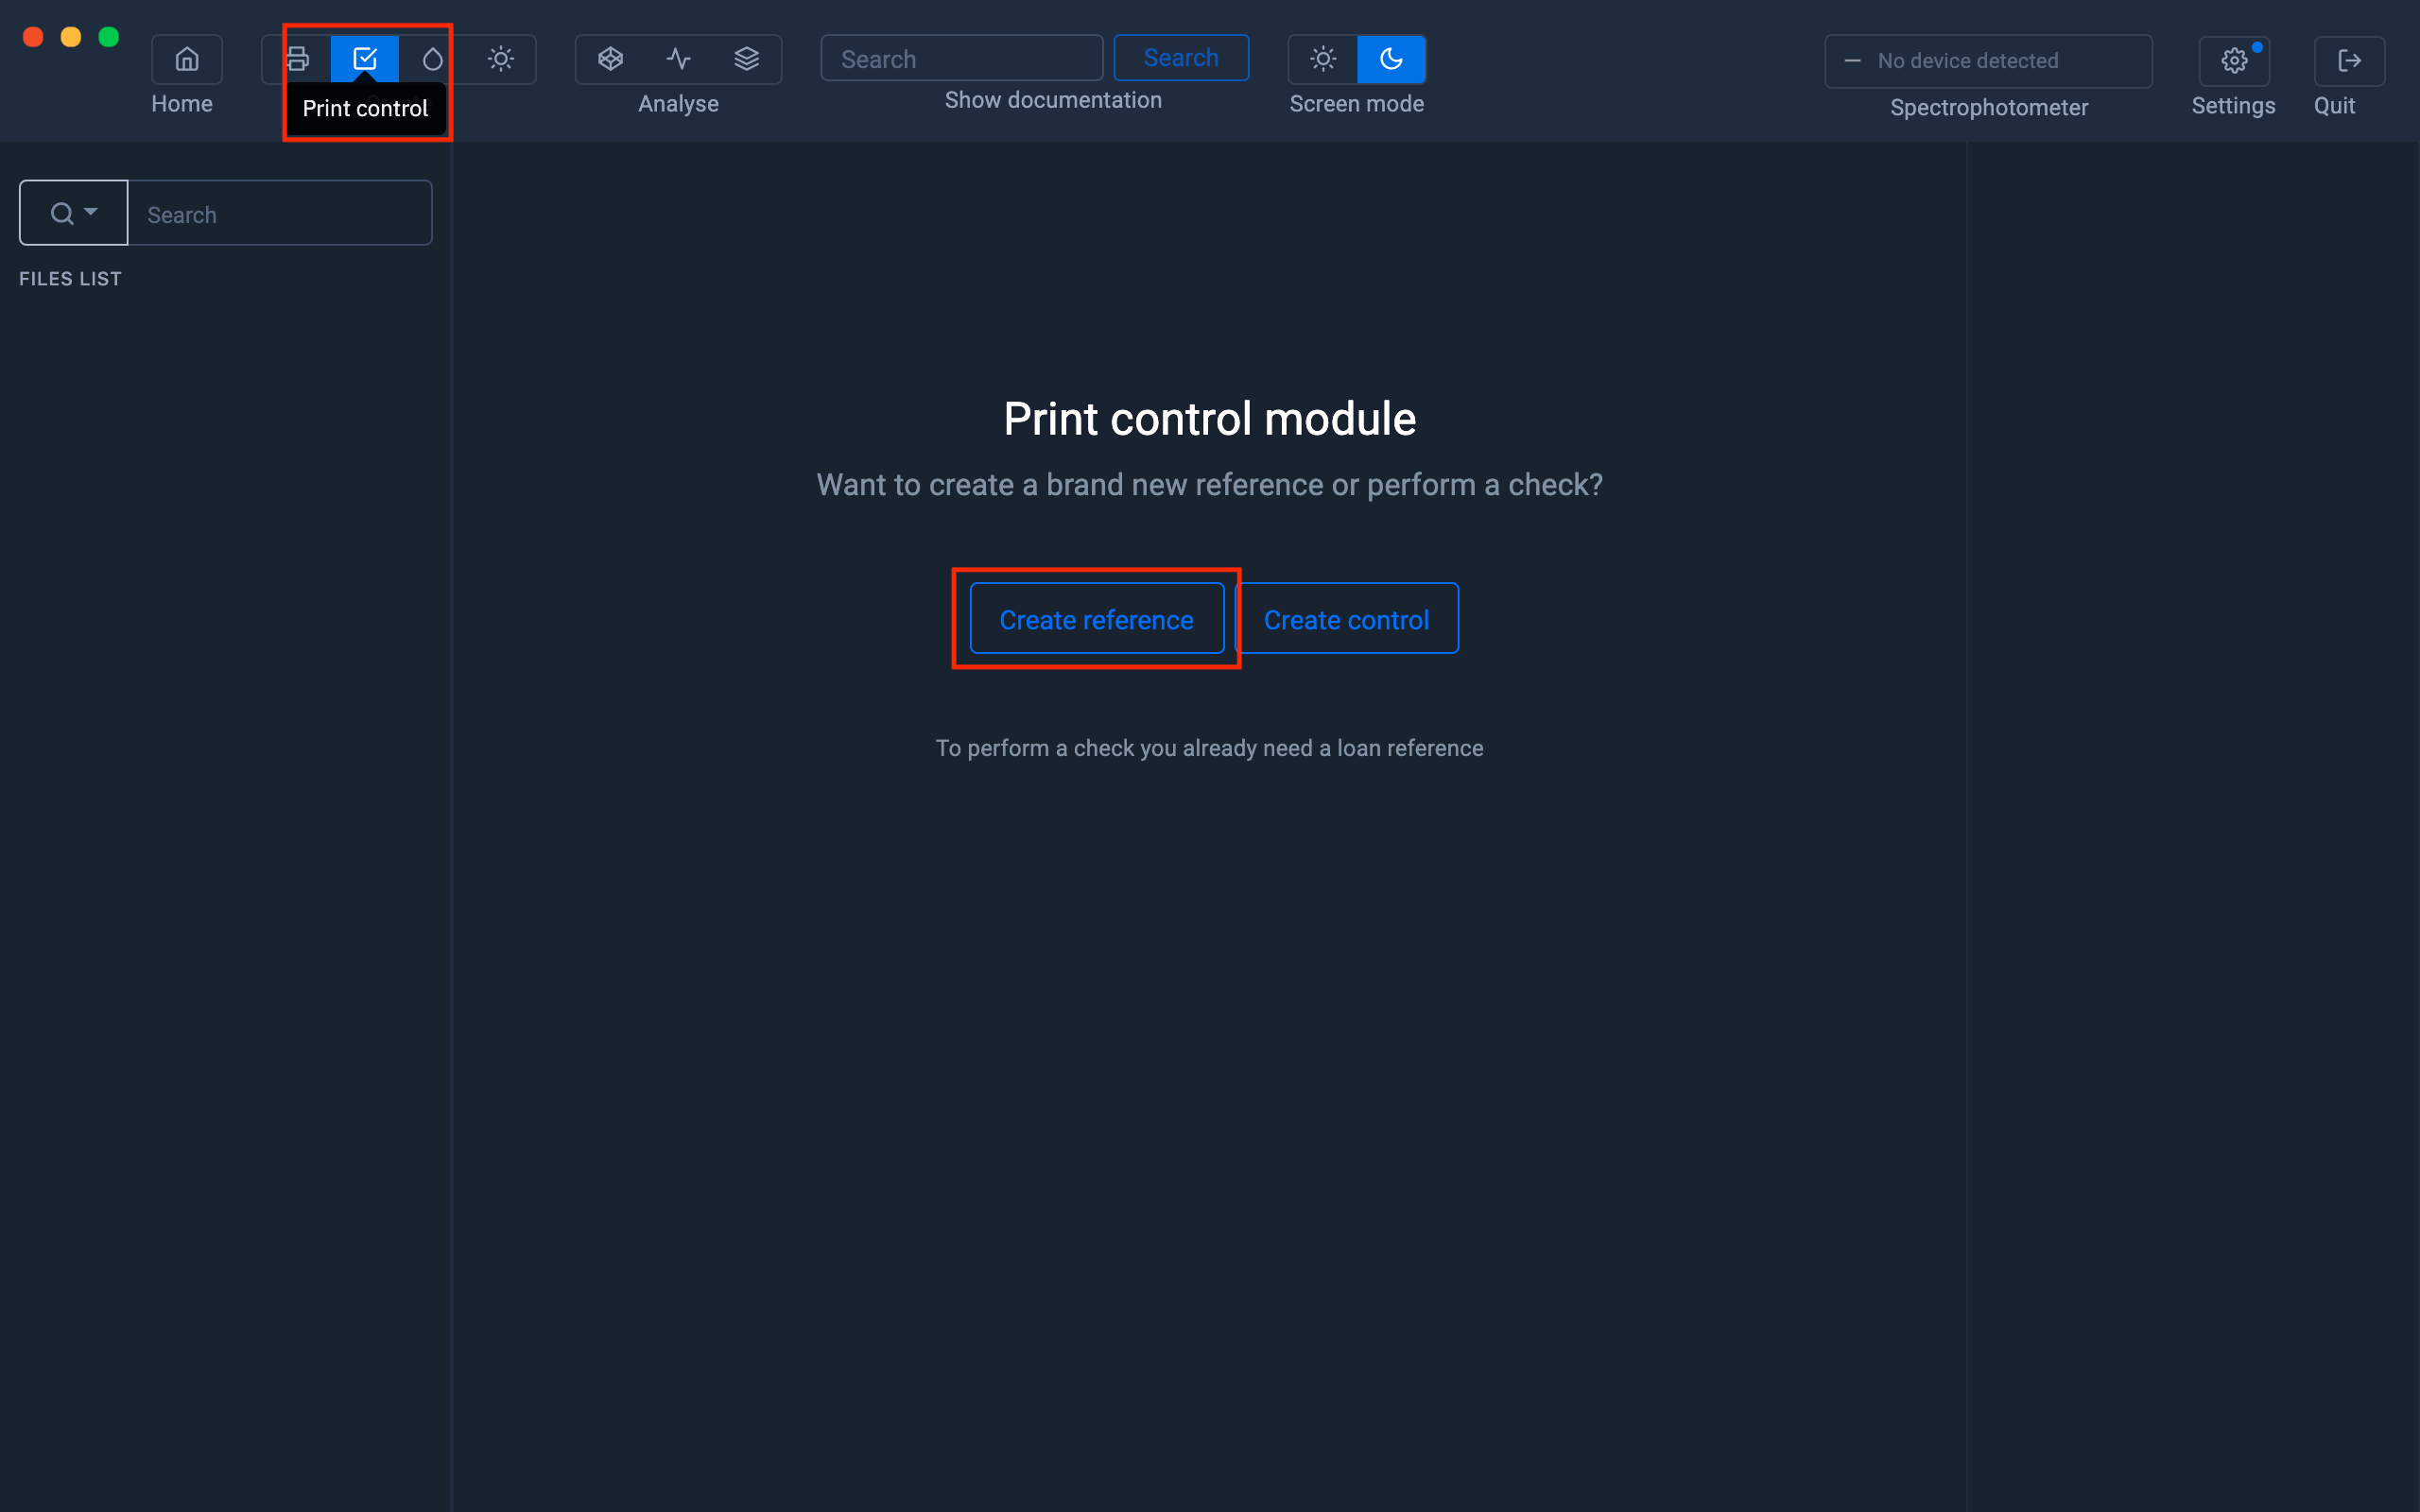
Click on the " Print Control " icon located at the top left
Then click on the " Create a reference " button
In this example, we will use a “Mediawedge RGB” range as a reference.
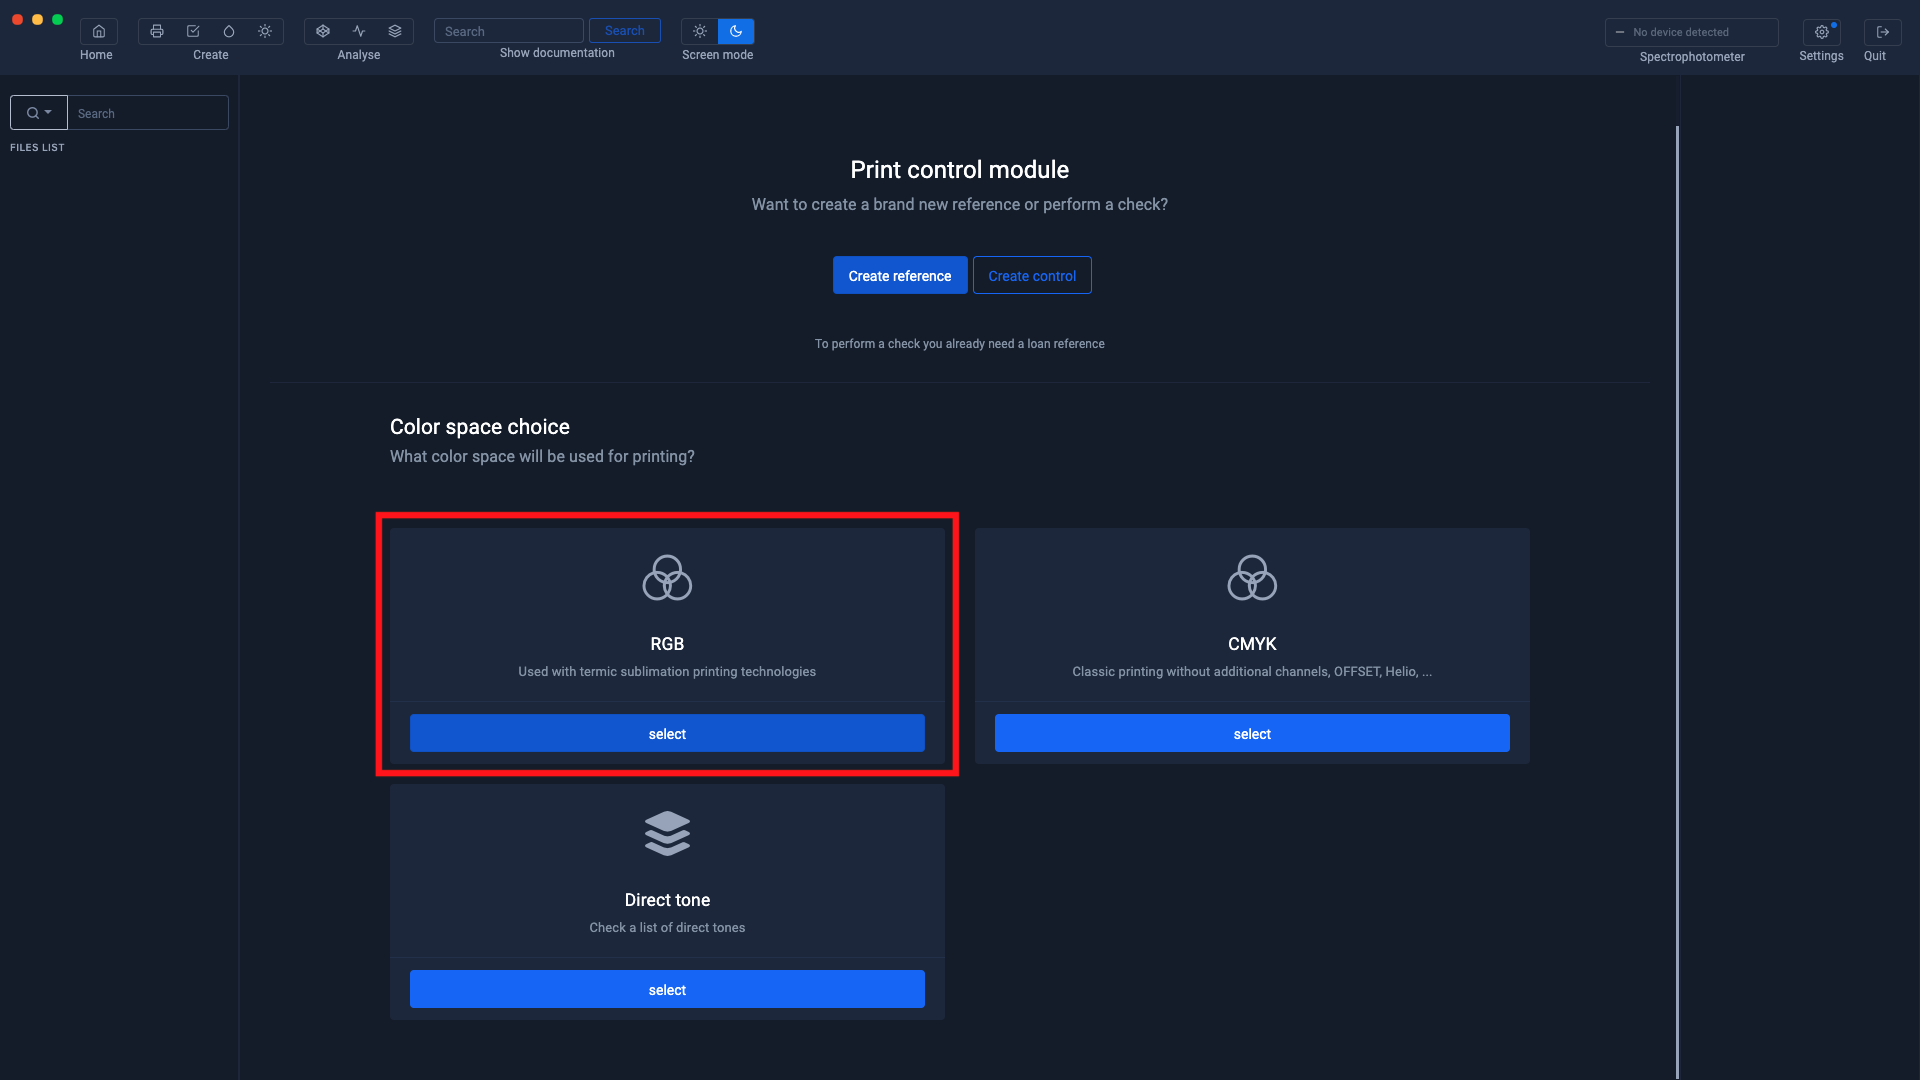
Select RGB mode
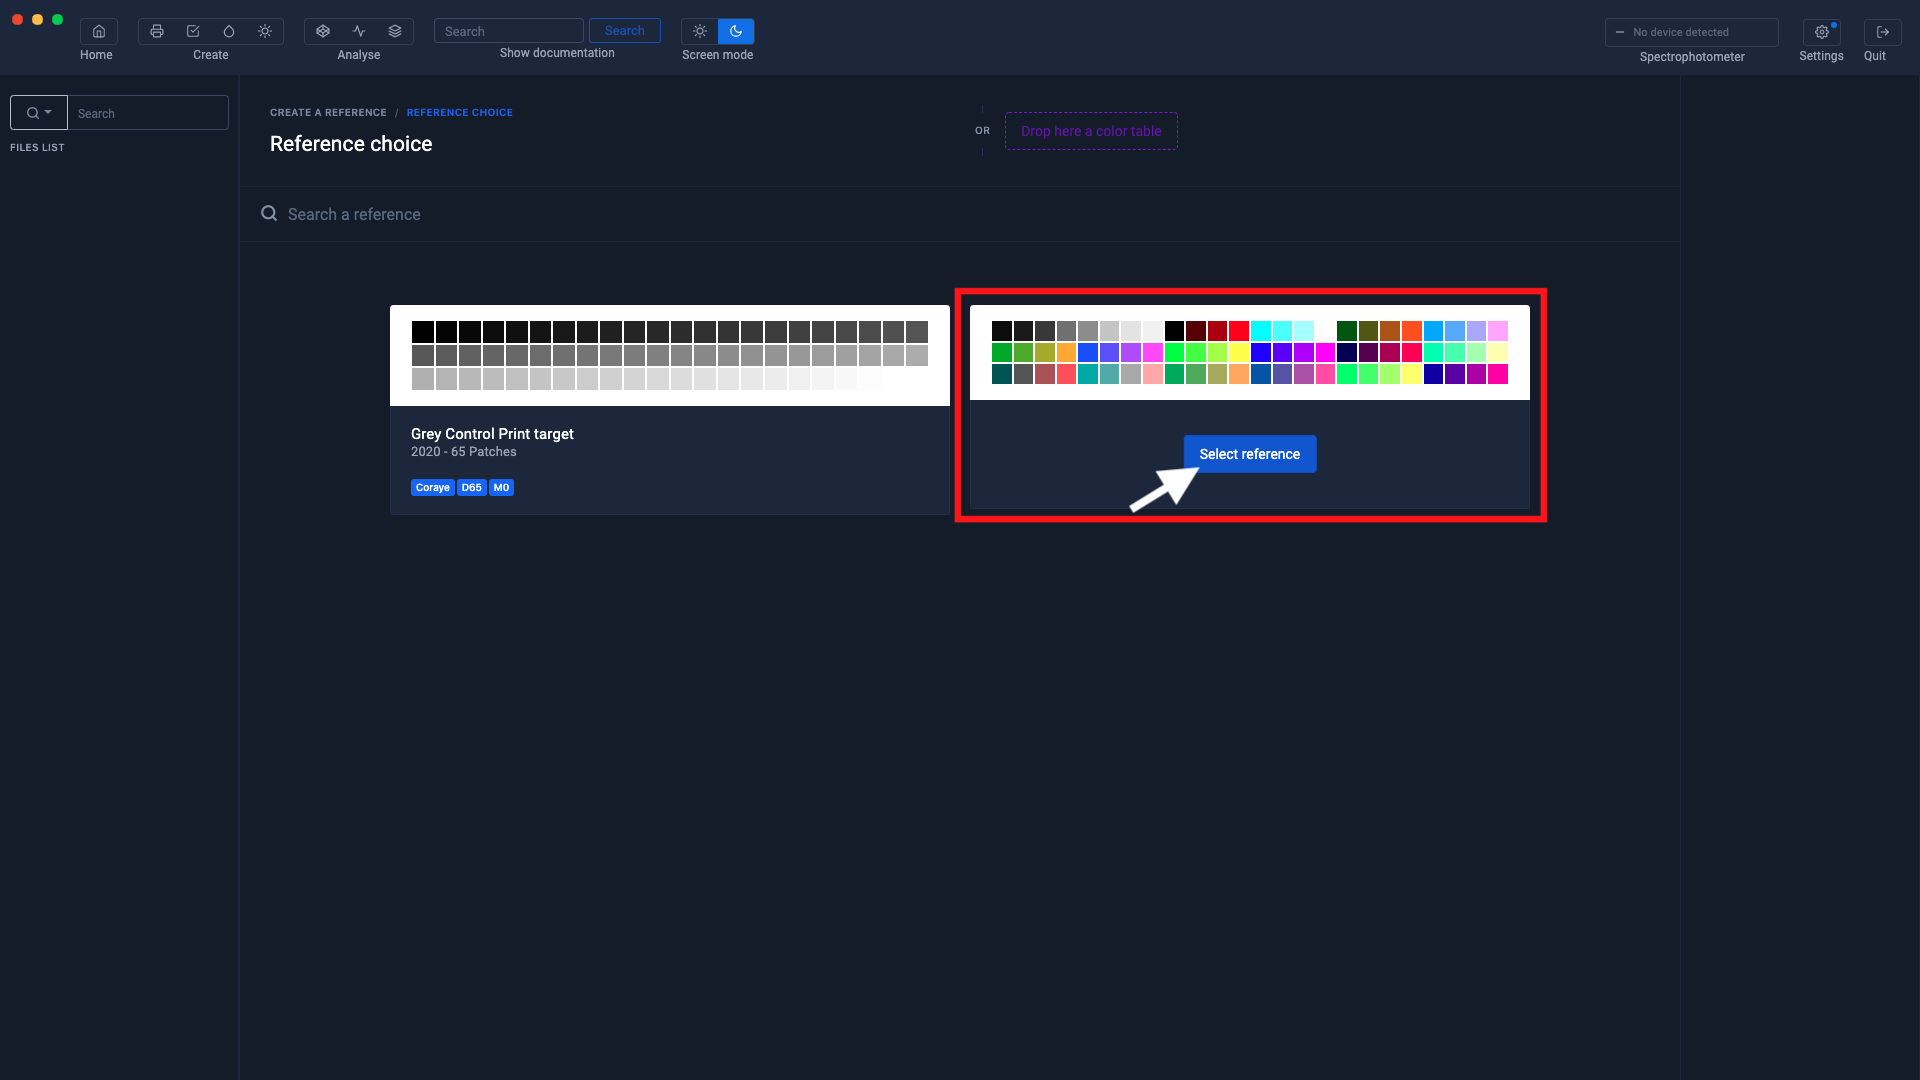
Select the "Mediawedge RGB" range
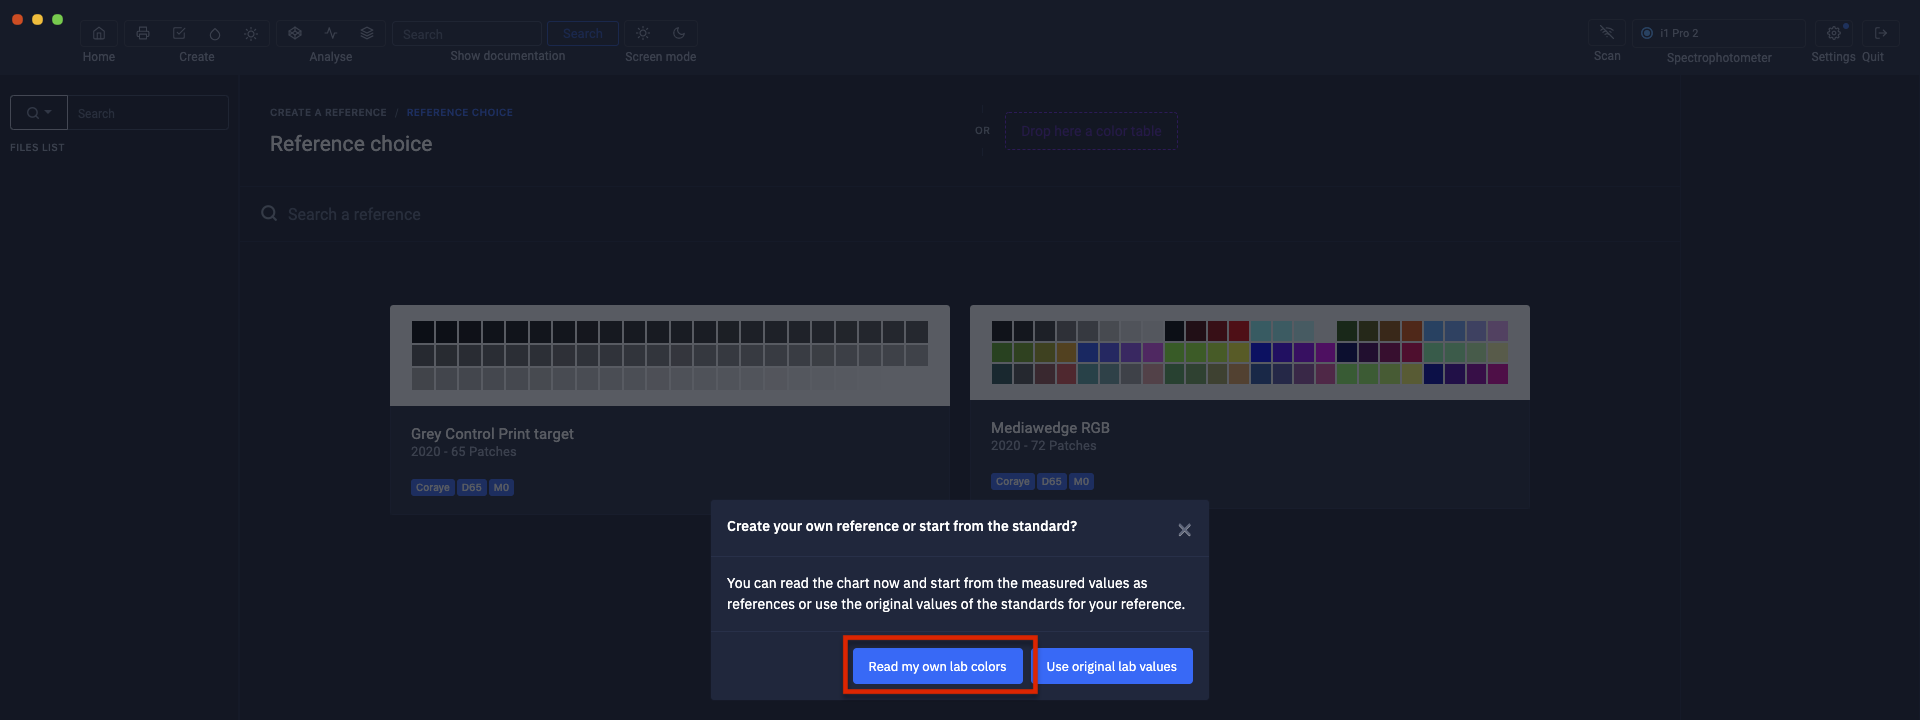
Click the " Measure own Lab values " button.
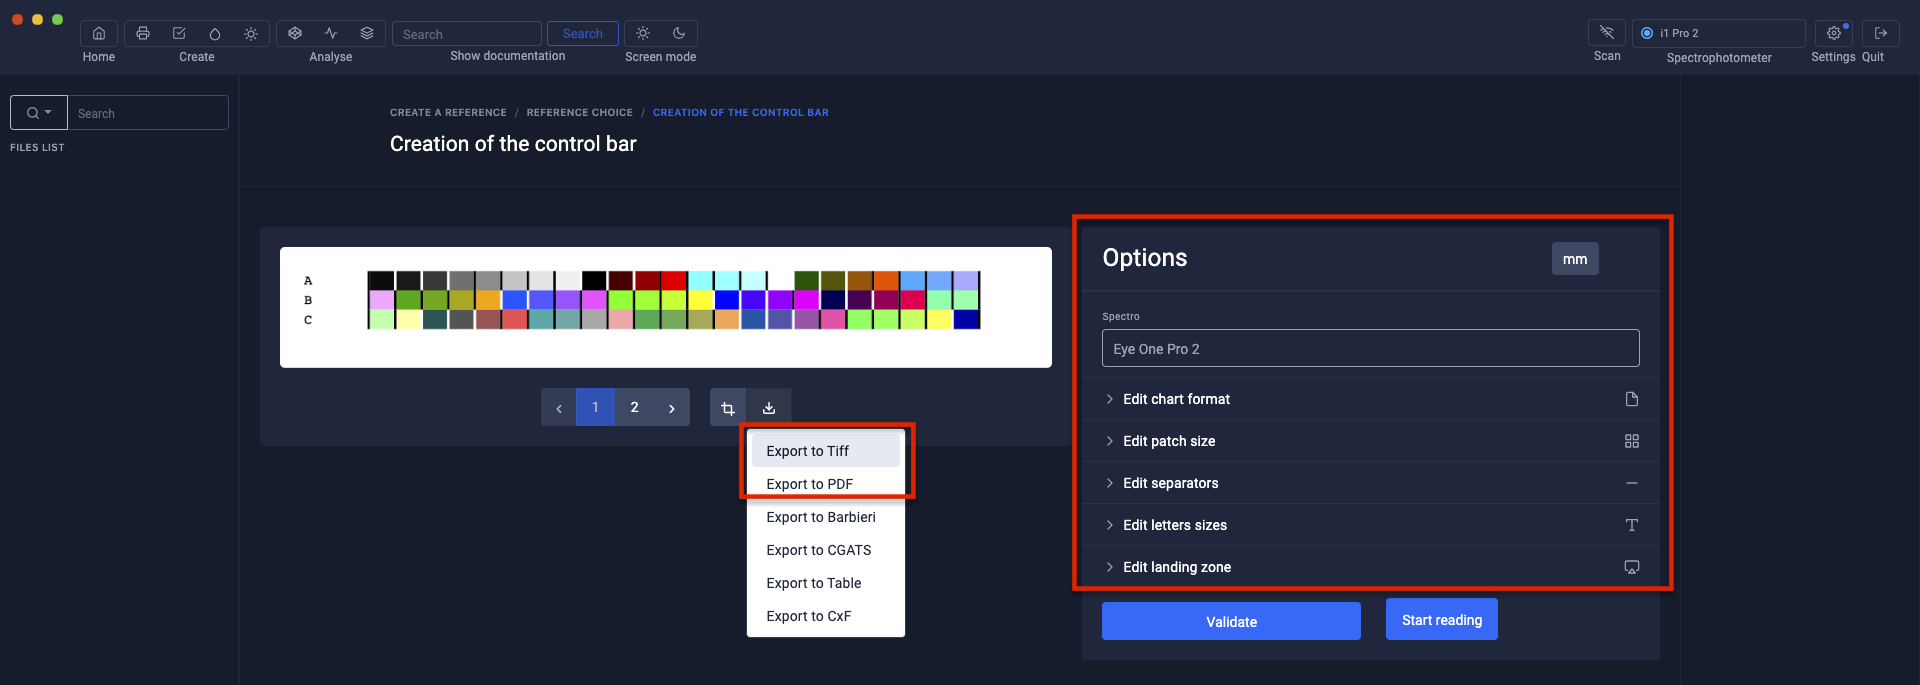
A preview of the range is displayed and it is possible to customize the pattern format using the editing tools on the right.
To find out more, see the chapter: Customizing charts
If your test chart is not already printed, you can export it in Tiff or pdf format to print it.
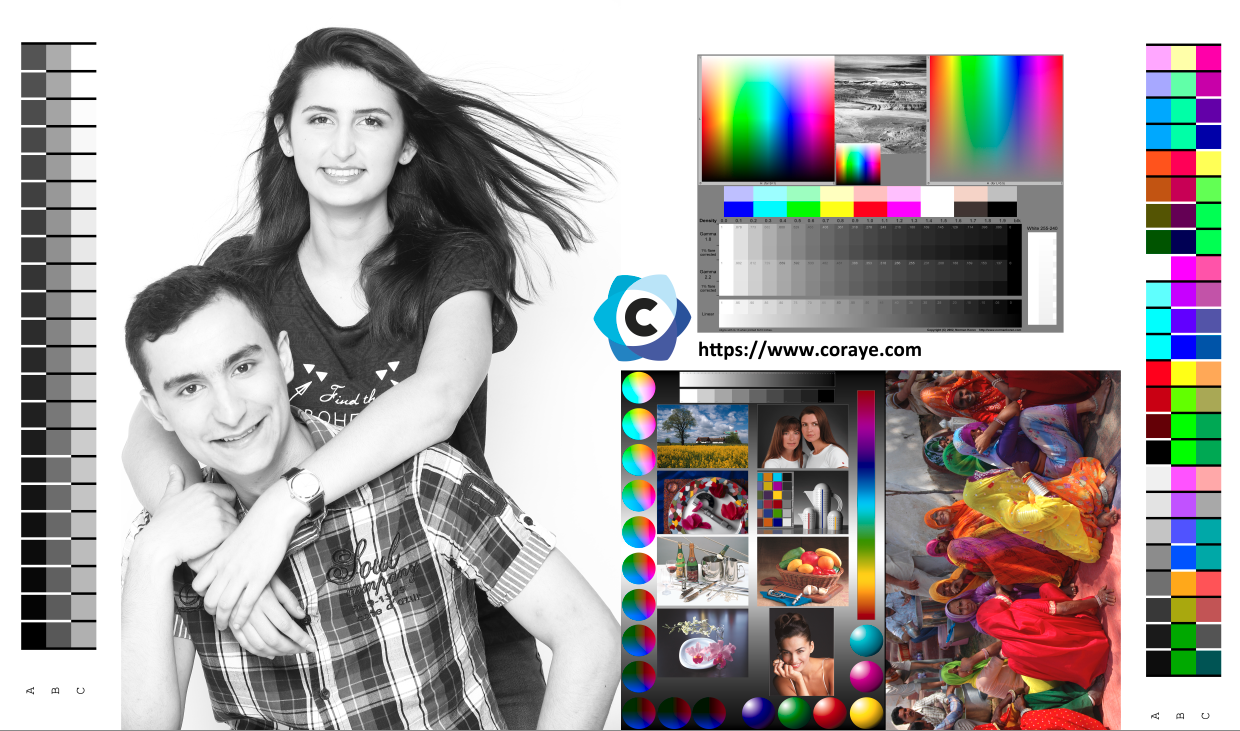
Or use the ranges from Coraye's test image:
Click on the "Start reading " button to continue.
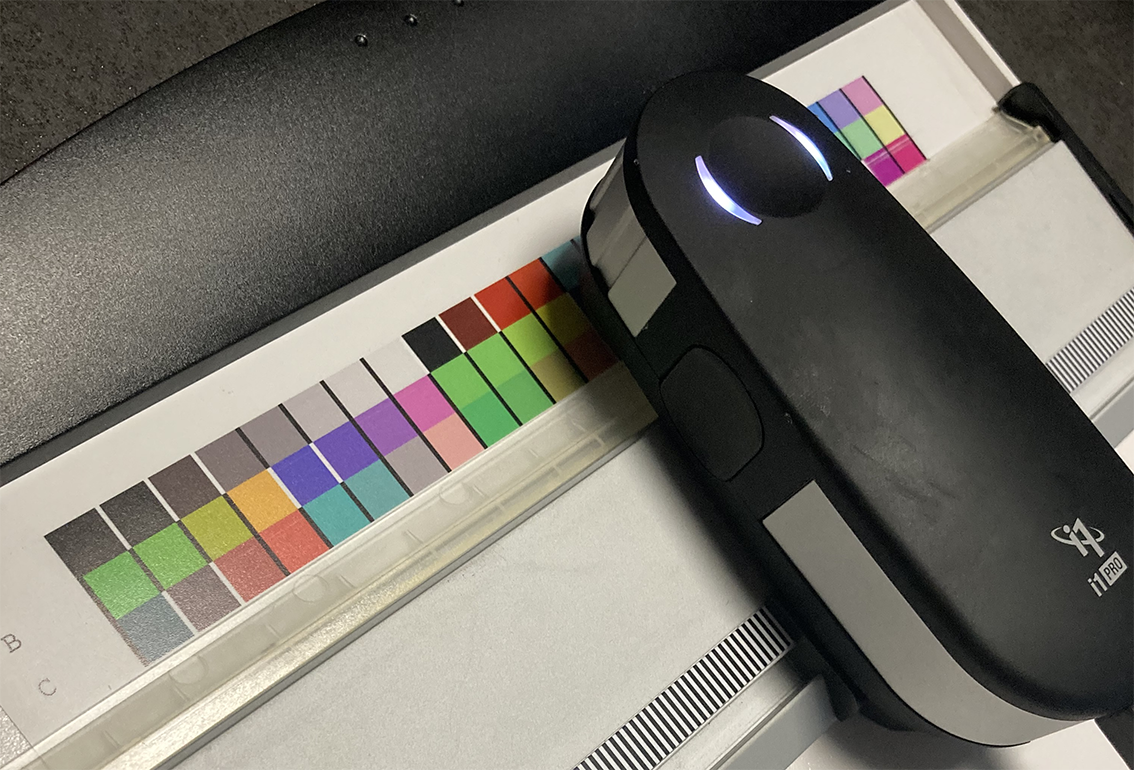
Make sure your spectrophotometer is connected, then click the " Start Reading " button.
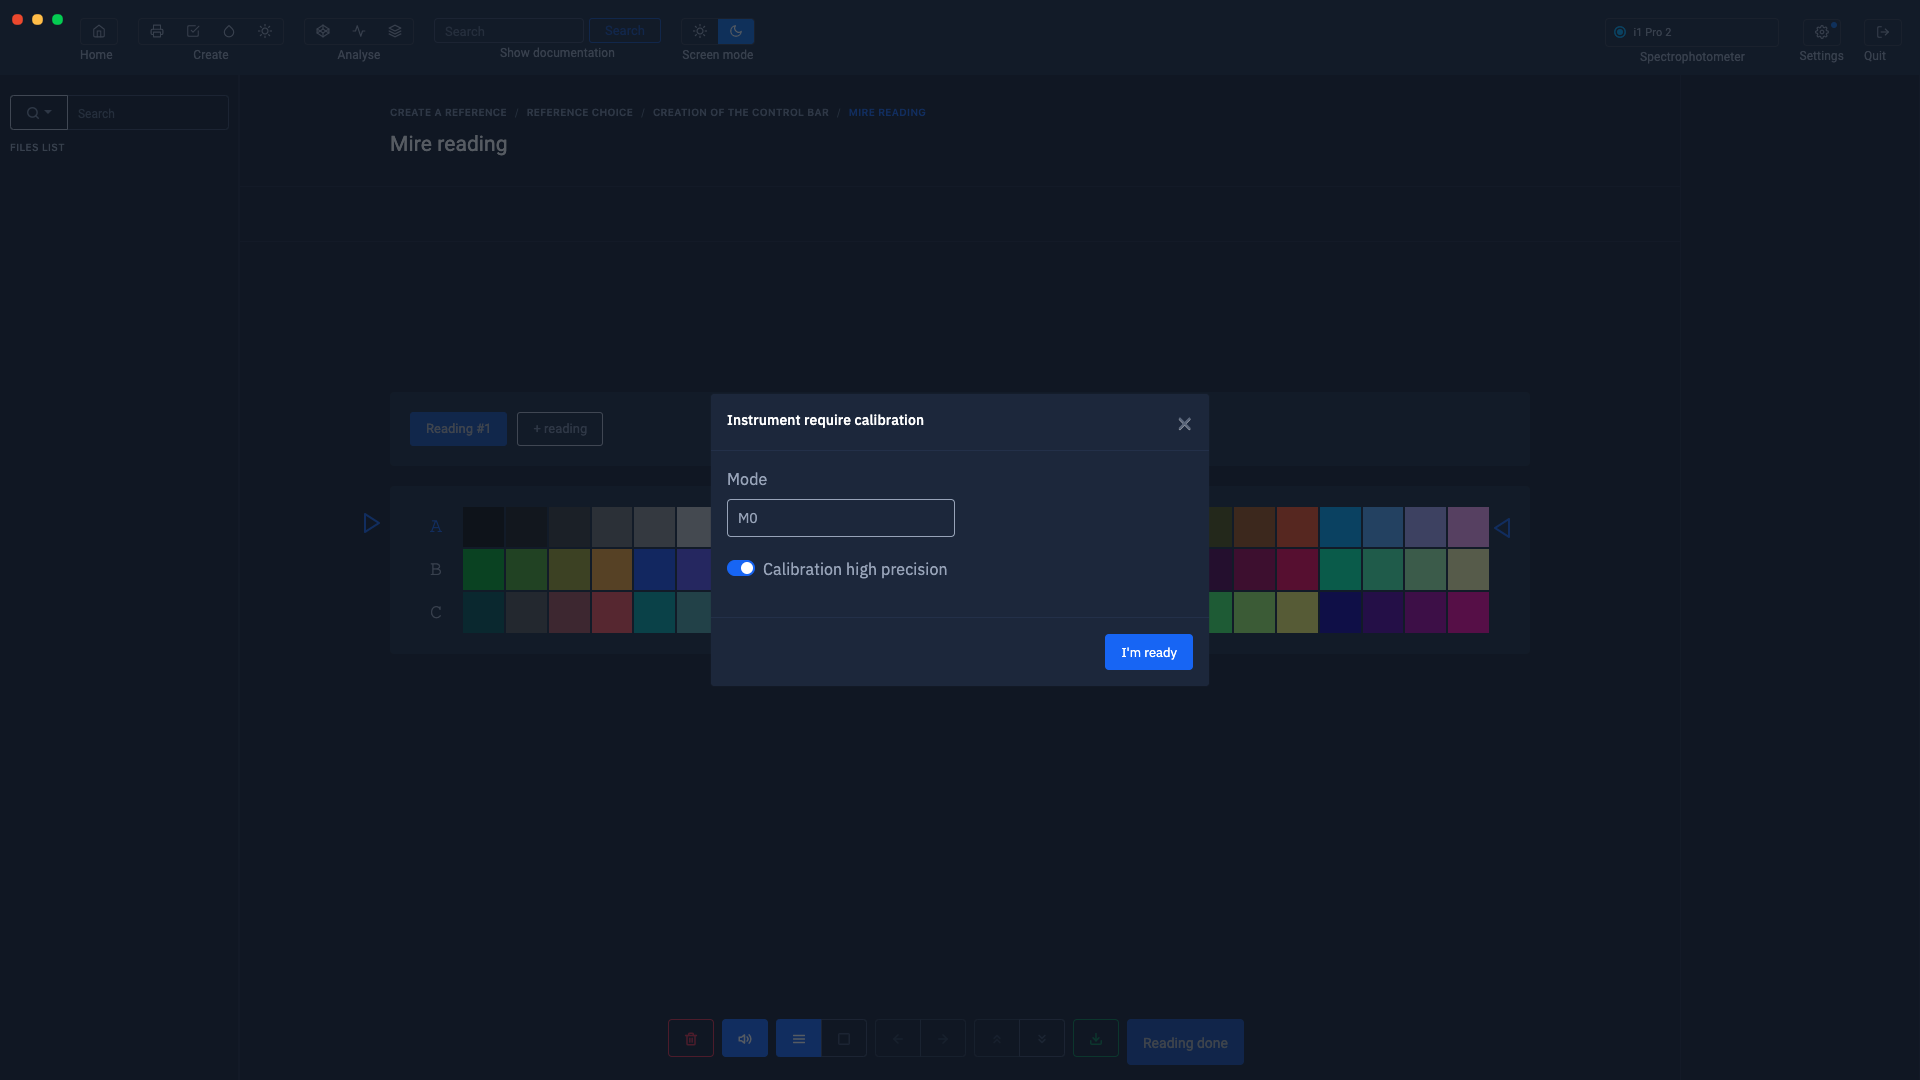
Select the reading mode according to your spectrophotometer, then click " I'm ready ".
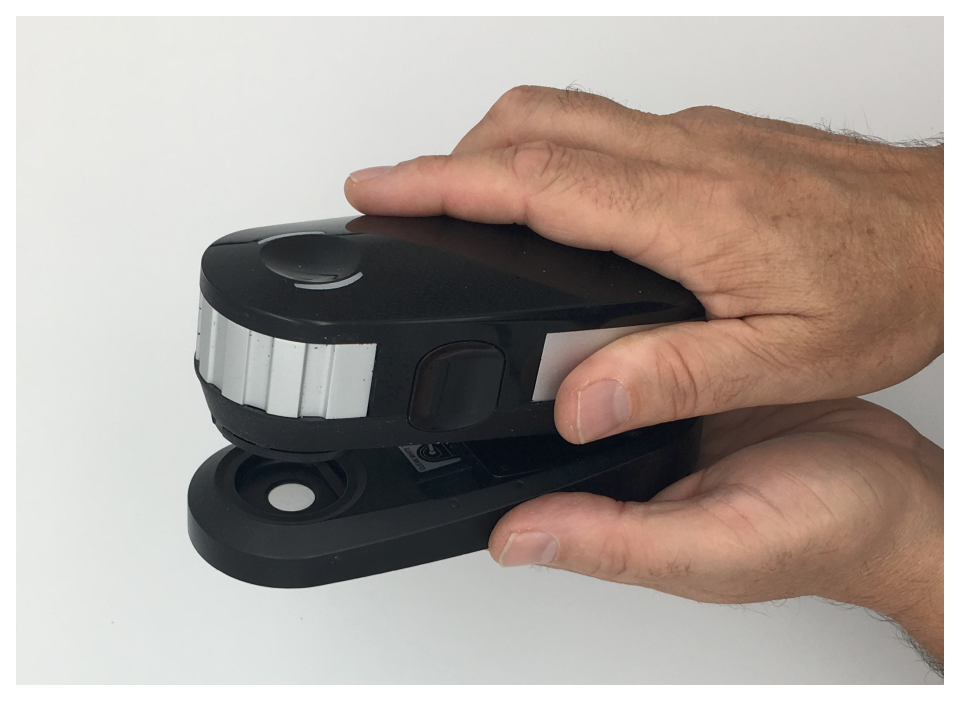
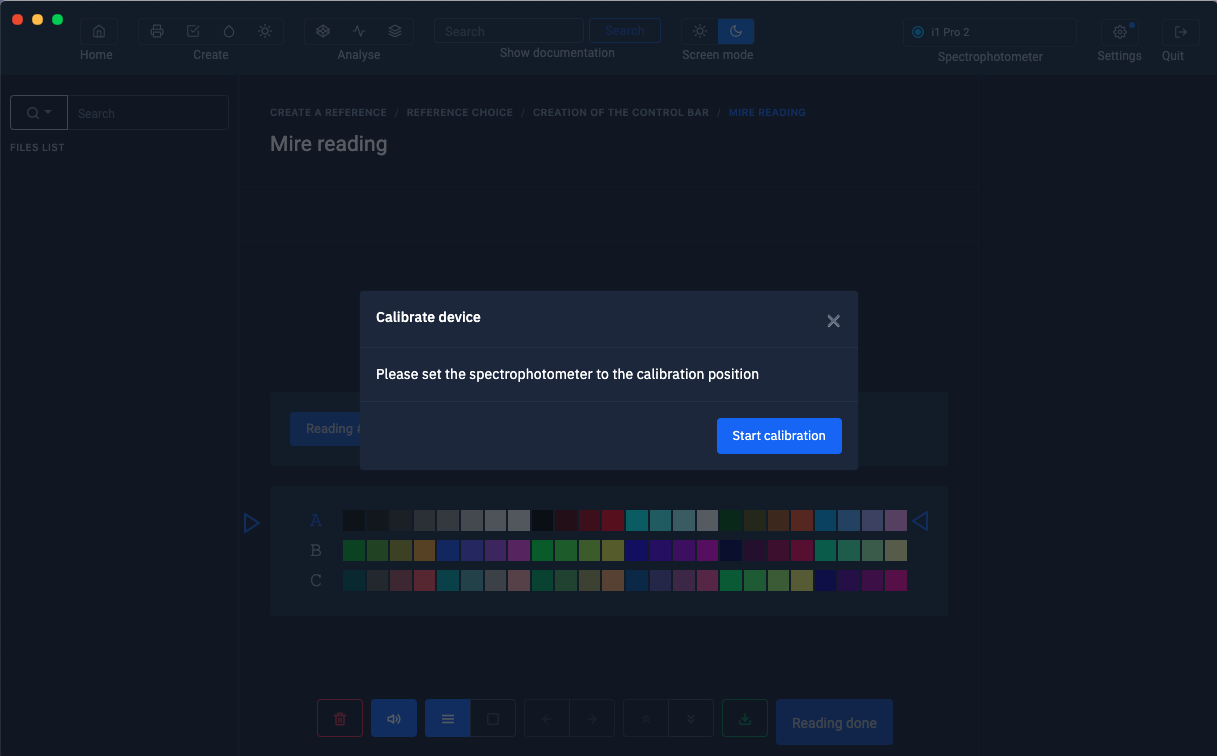
Position the spectrophotometer in its calibration position.
Then click on the " Start calibration " button.
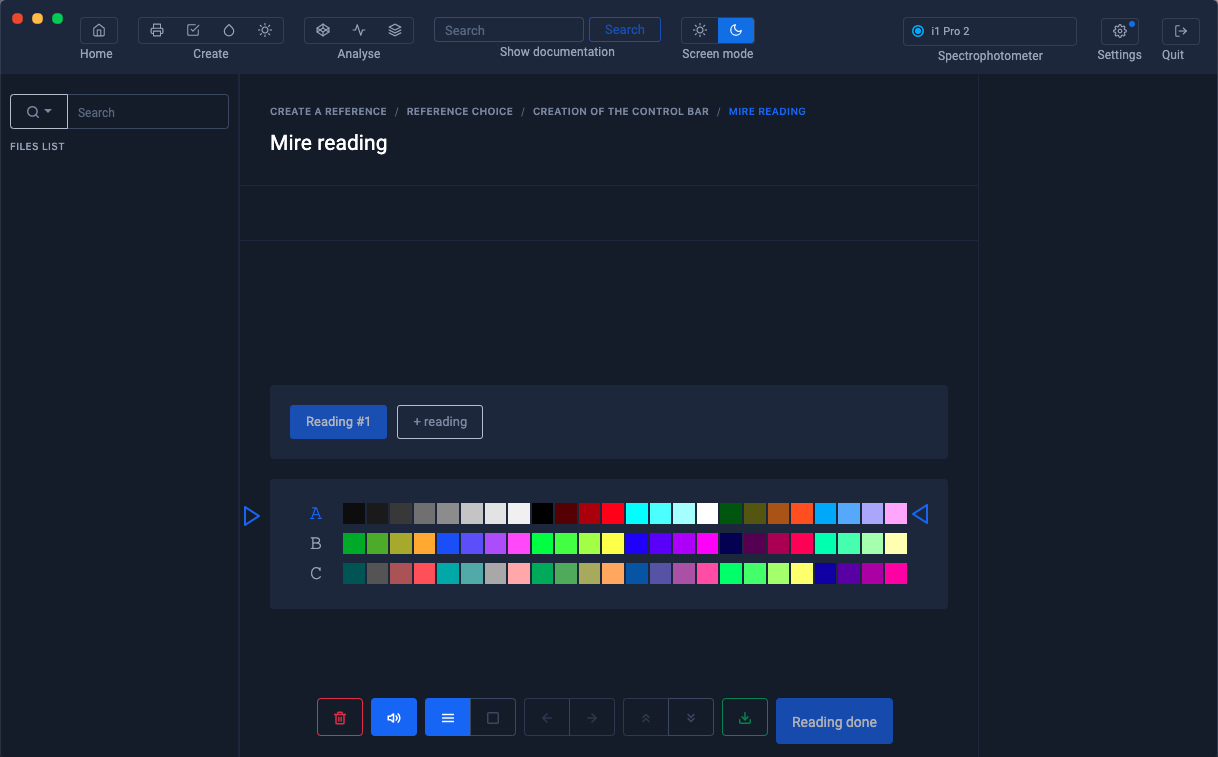
When the calibration is complete, start measuring the staff.
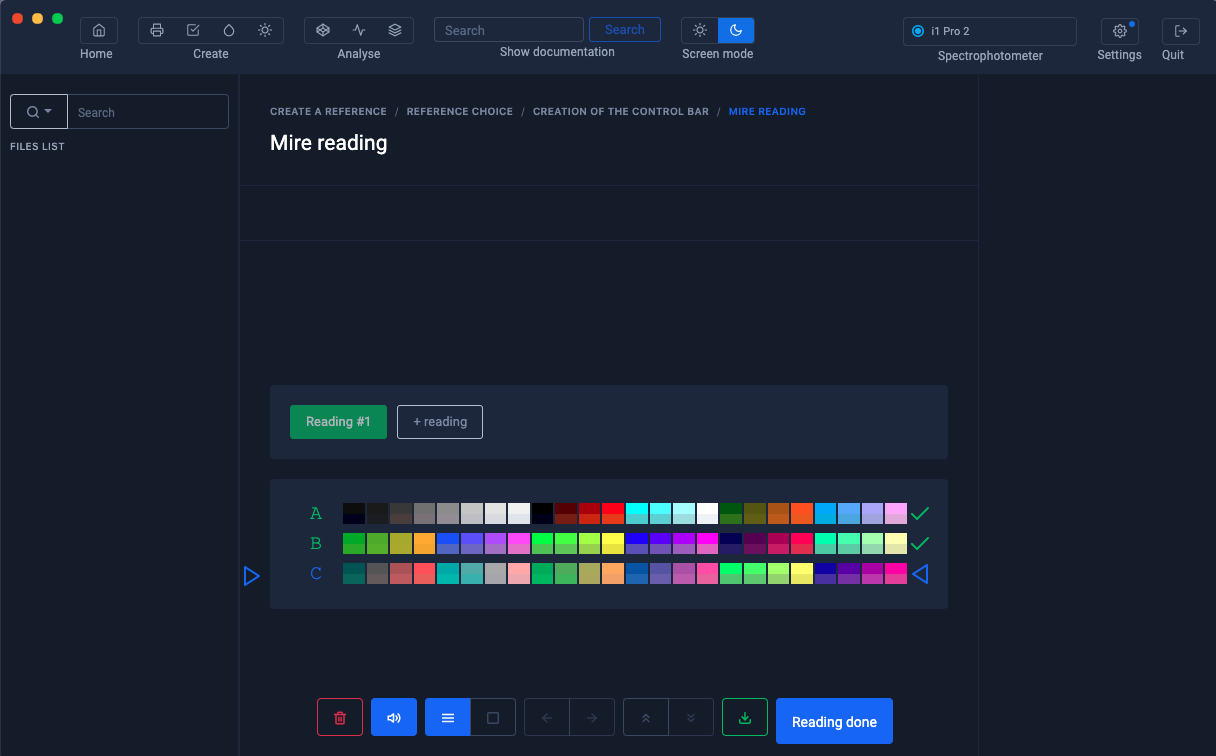
Measure the line indicated by the blue marker.
Once the test chart has been measured, click on the " End reading " button.
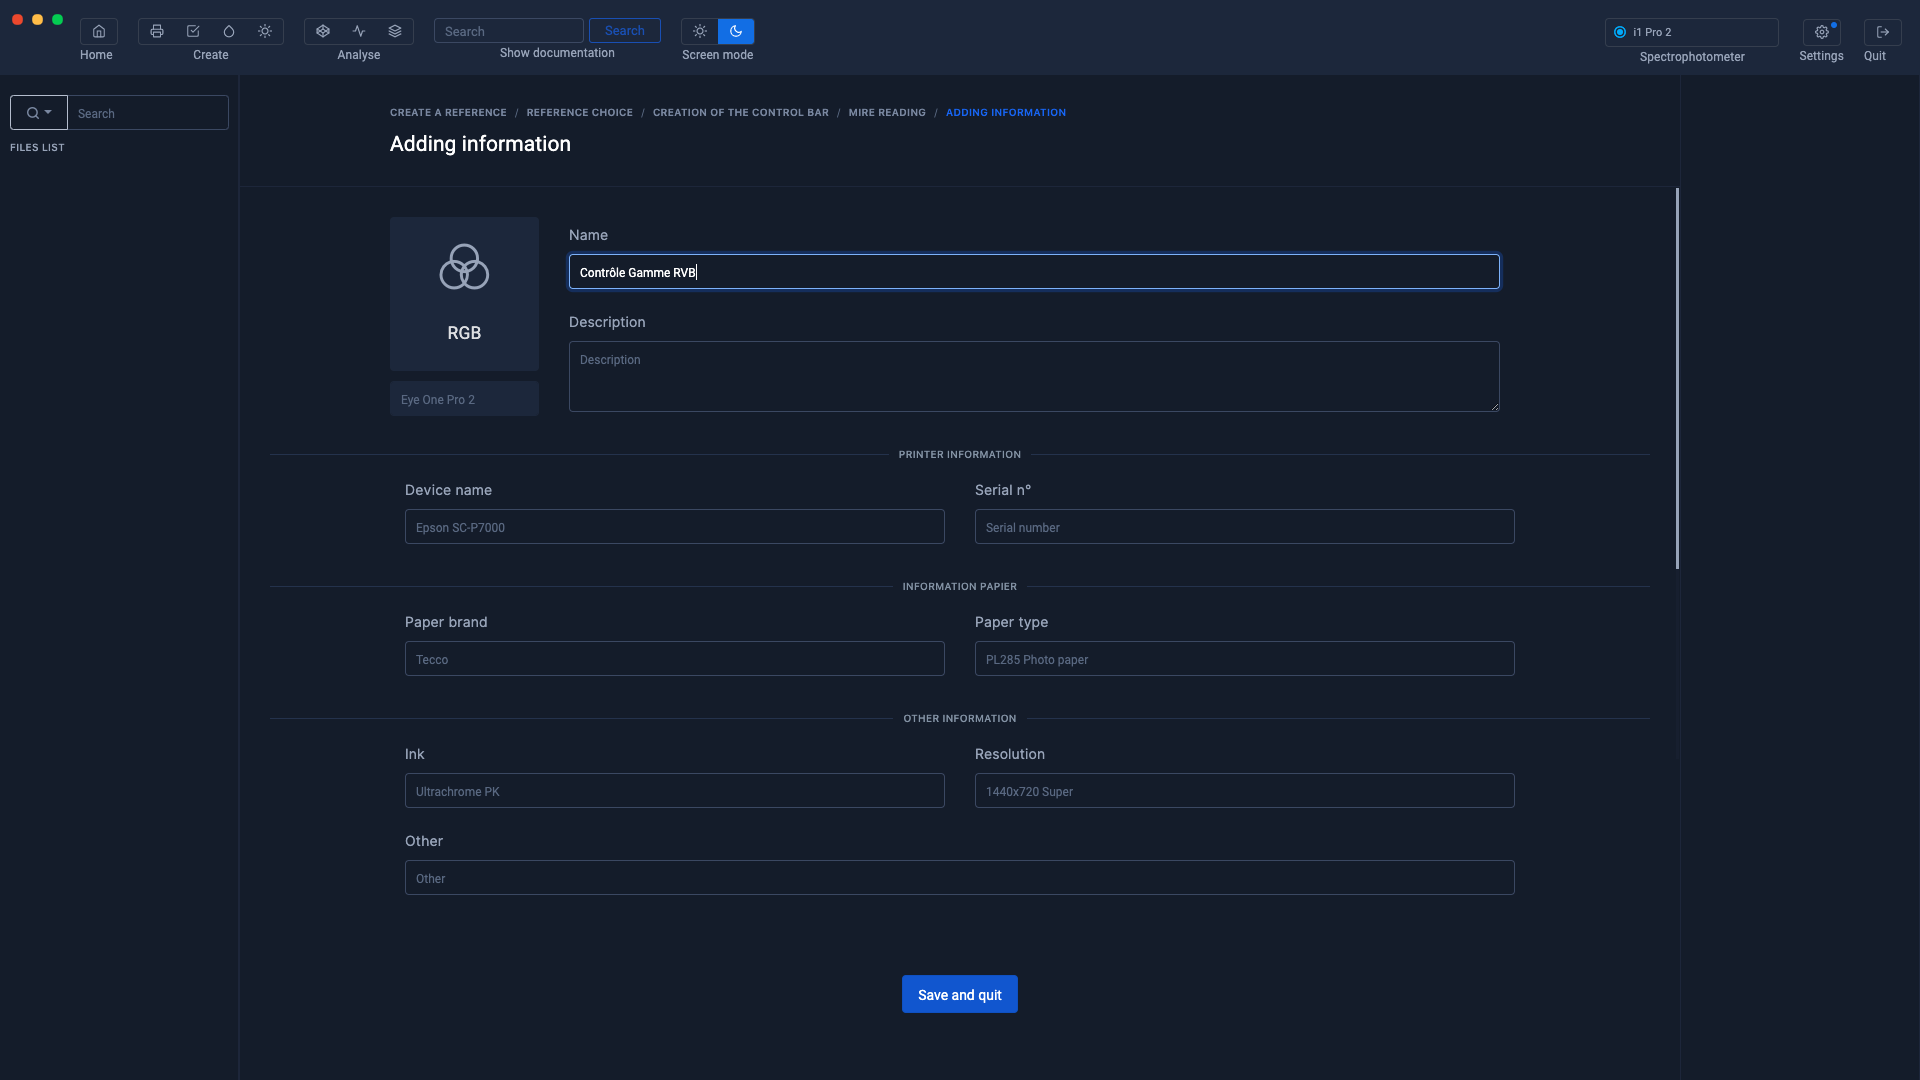
In the information window, only the name of the setting is mandatory.
The other information is optional.
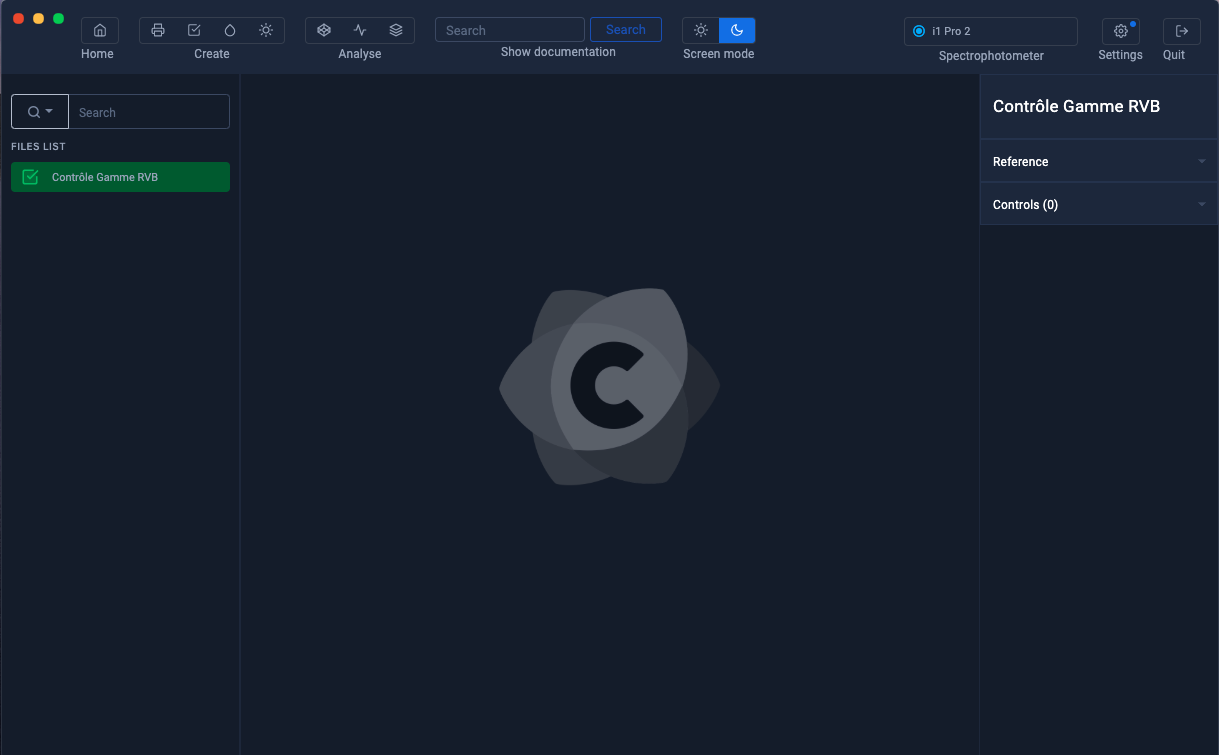
After clicking on the " Save and Exit " button, the " Print Control .pctrl " file is displayed in the left column.
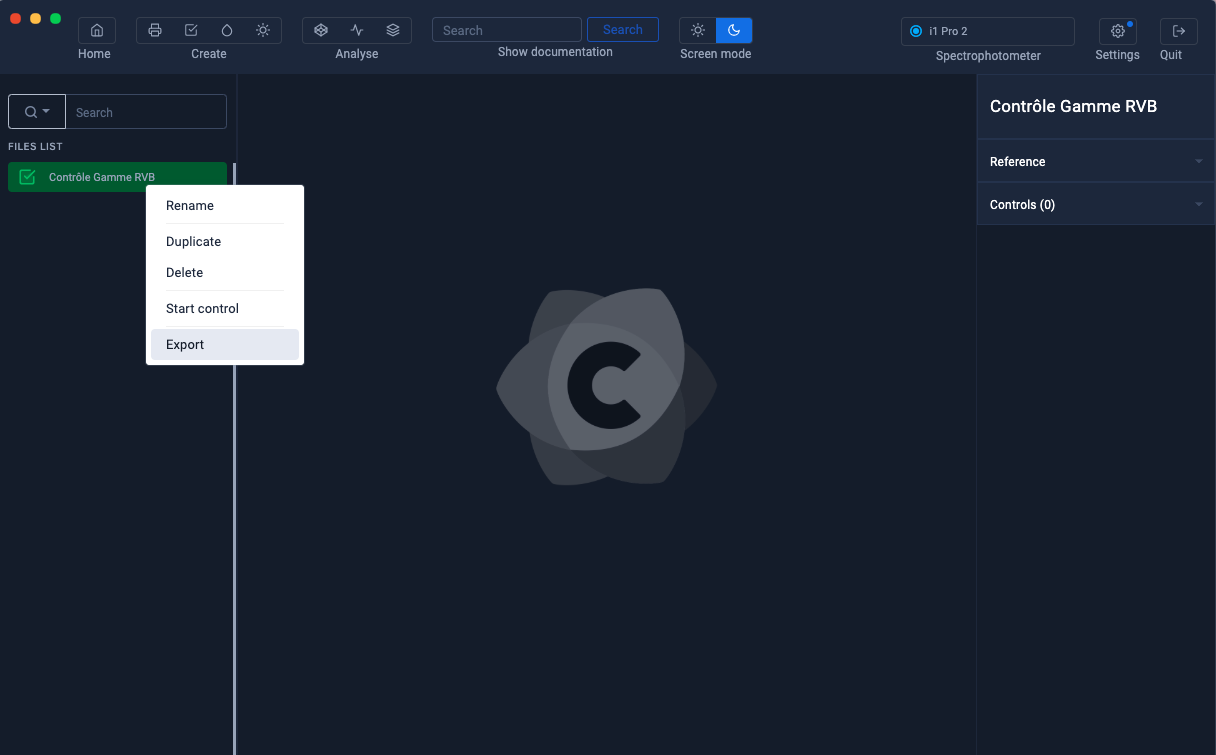
You can now start the range measurement or export the file to save it by right-clicking on the Print Control file.
The control of an RGB Mediawedge range is very similar to that of a CMYK Mediawedge. You can use the tutorial "Controlling a standardized Mediawedge range" starting with the chapter " Importing a Print Control File (.pctrl) "
To find out more, see the chapter: Controlling a RGB Mediawedge range
