Color table
A color table is a way to save your colors in a digital color chart.
This function is a major function of the Coraye solution, in this tutorial you will understand why.
One of the particularities of this tool is that it allows the sharing of the same color table between different software, such as the Adobe® suite, RIPs, Coraye and other software.
That is, you can use a single common color database between designers, contractors and printers.
It is also possible to create reference color tables for quality control or personalized reference charts for the creation of icc profiles, etc ...
We will see all of this in the next chapters.
Importing a color table
Coraye is compatible with a large number of color tables which can be direct tone tables or color palettes.
List of color table formats supported by Coraye:
- CXF (.cxf) to share with RIP EFI®, RIP ColorGATE®, XRite®, PANTONE®, XRite eXact spectrodensitometer (import / export)
- Adobe® (.ase,. aco, .acb) to share with Photoshop®, Illustrator®, Indesign®, RIP Ergosoft®, Mutoh VerteLith® and RIP Epson® Edge Print (Import / Export)
- CSV (.csv) to share with Microsoft® Excel, RIP Wasatch® (import / export)
- Caldera® (.lab) (export only)
- CorelDraw® (.xml)
- NeoStampa® (.spt)
- Versaworks (.spot)
- CIE CGATS (.txt)
- Onyx® Postershop (.tab)
- Data Color® (.qtx) (Only supports spectral data)
To import a color table, all you have to do is drag and drop your color chart in Coraye in the left or right column.
Or: File / Open the file in the menu at the top corner, then select your color chart.
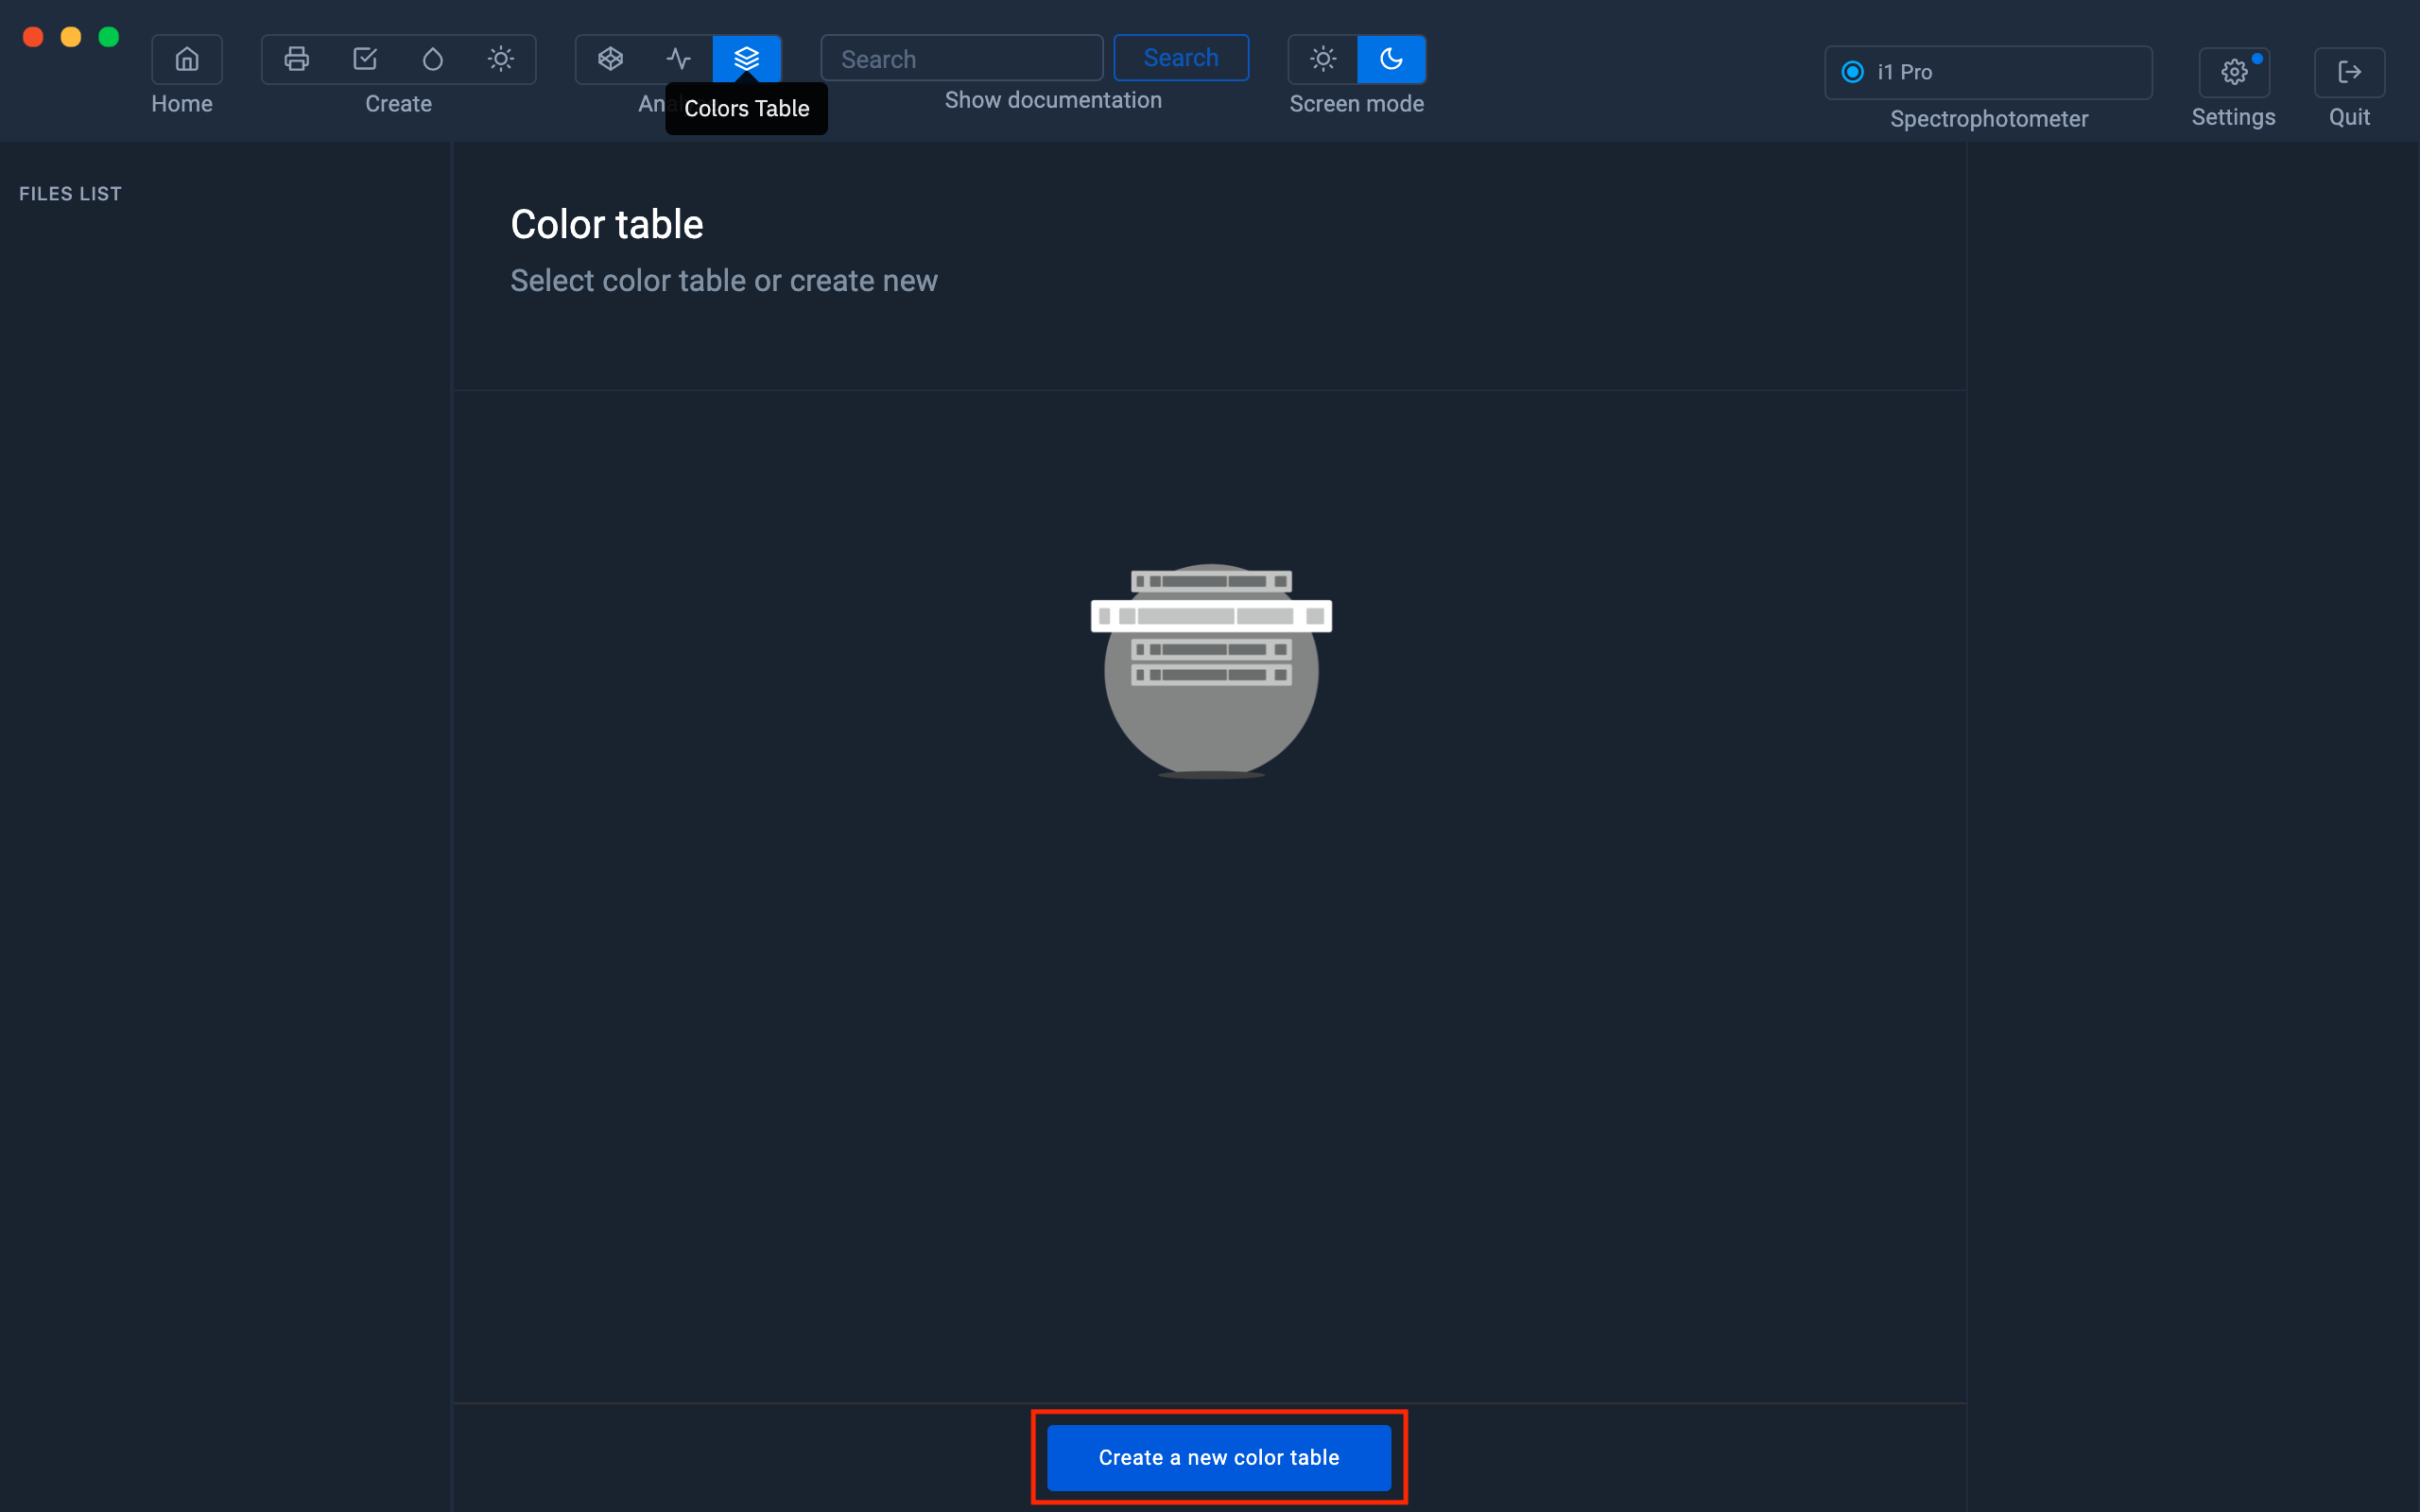
Create a new color table
To create a new color table, click on the bottom button "Create a new color table".
Add the colors captured with a spectrophotometer into a color table.
Spectrophotometers supported for color capture:
| Konica Minolta MYIRO | 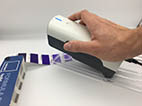 |
| XRite I1 Pro 3 - EFI ES3000 | 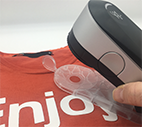 |
| XRite I1 Pro 2 - EFI ES2000 | 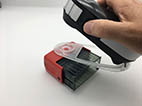
|
| XRite I1 Pro - EFI ES1000 |
|
| Konica Minolta CM 26d & 25d | 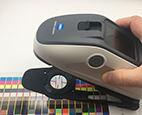 |
| Barbieri Sensing Unit LFP qb |
|
| XRite eXact (Import / Export of colors only) |
|
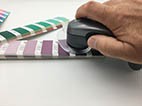
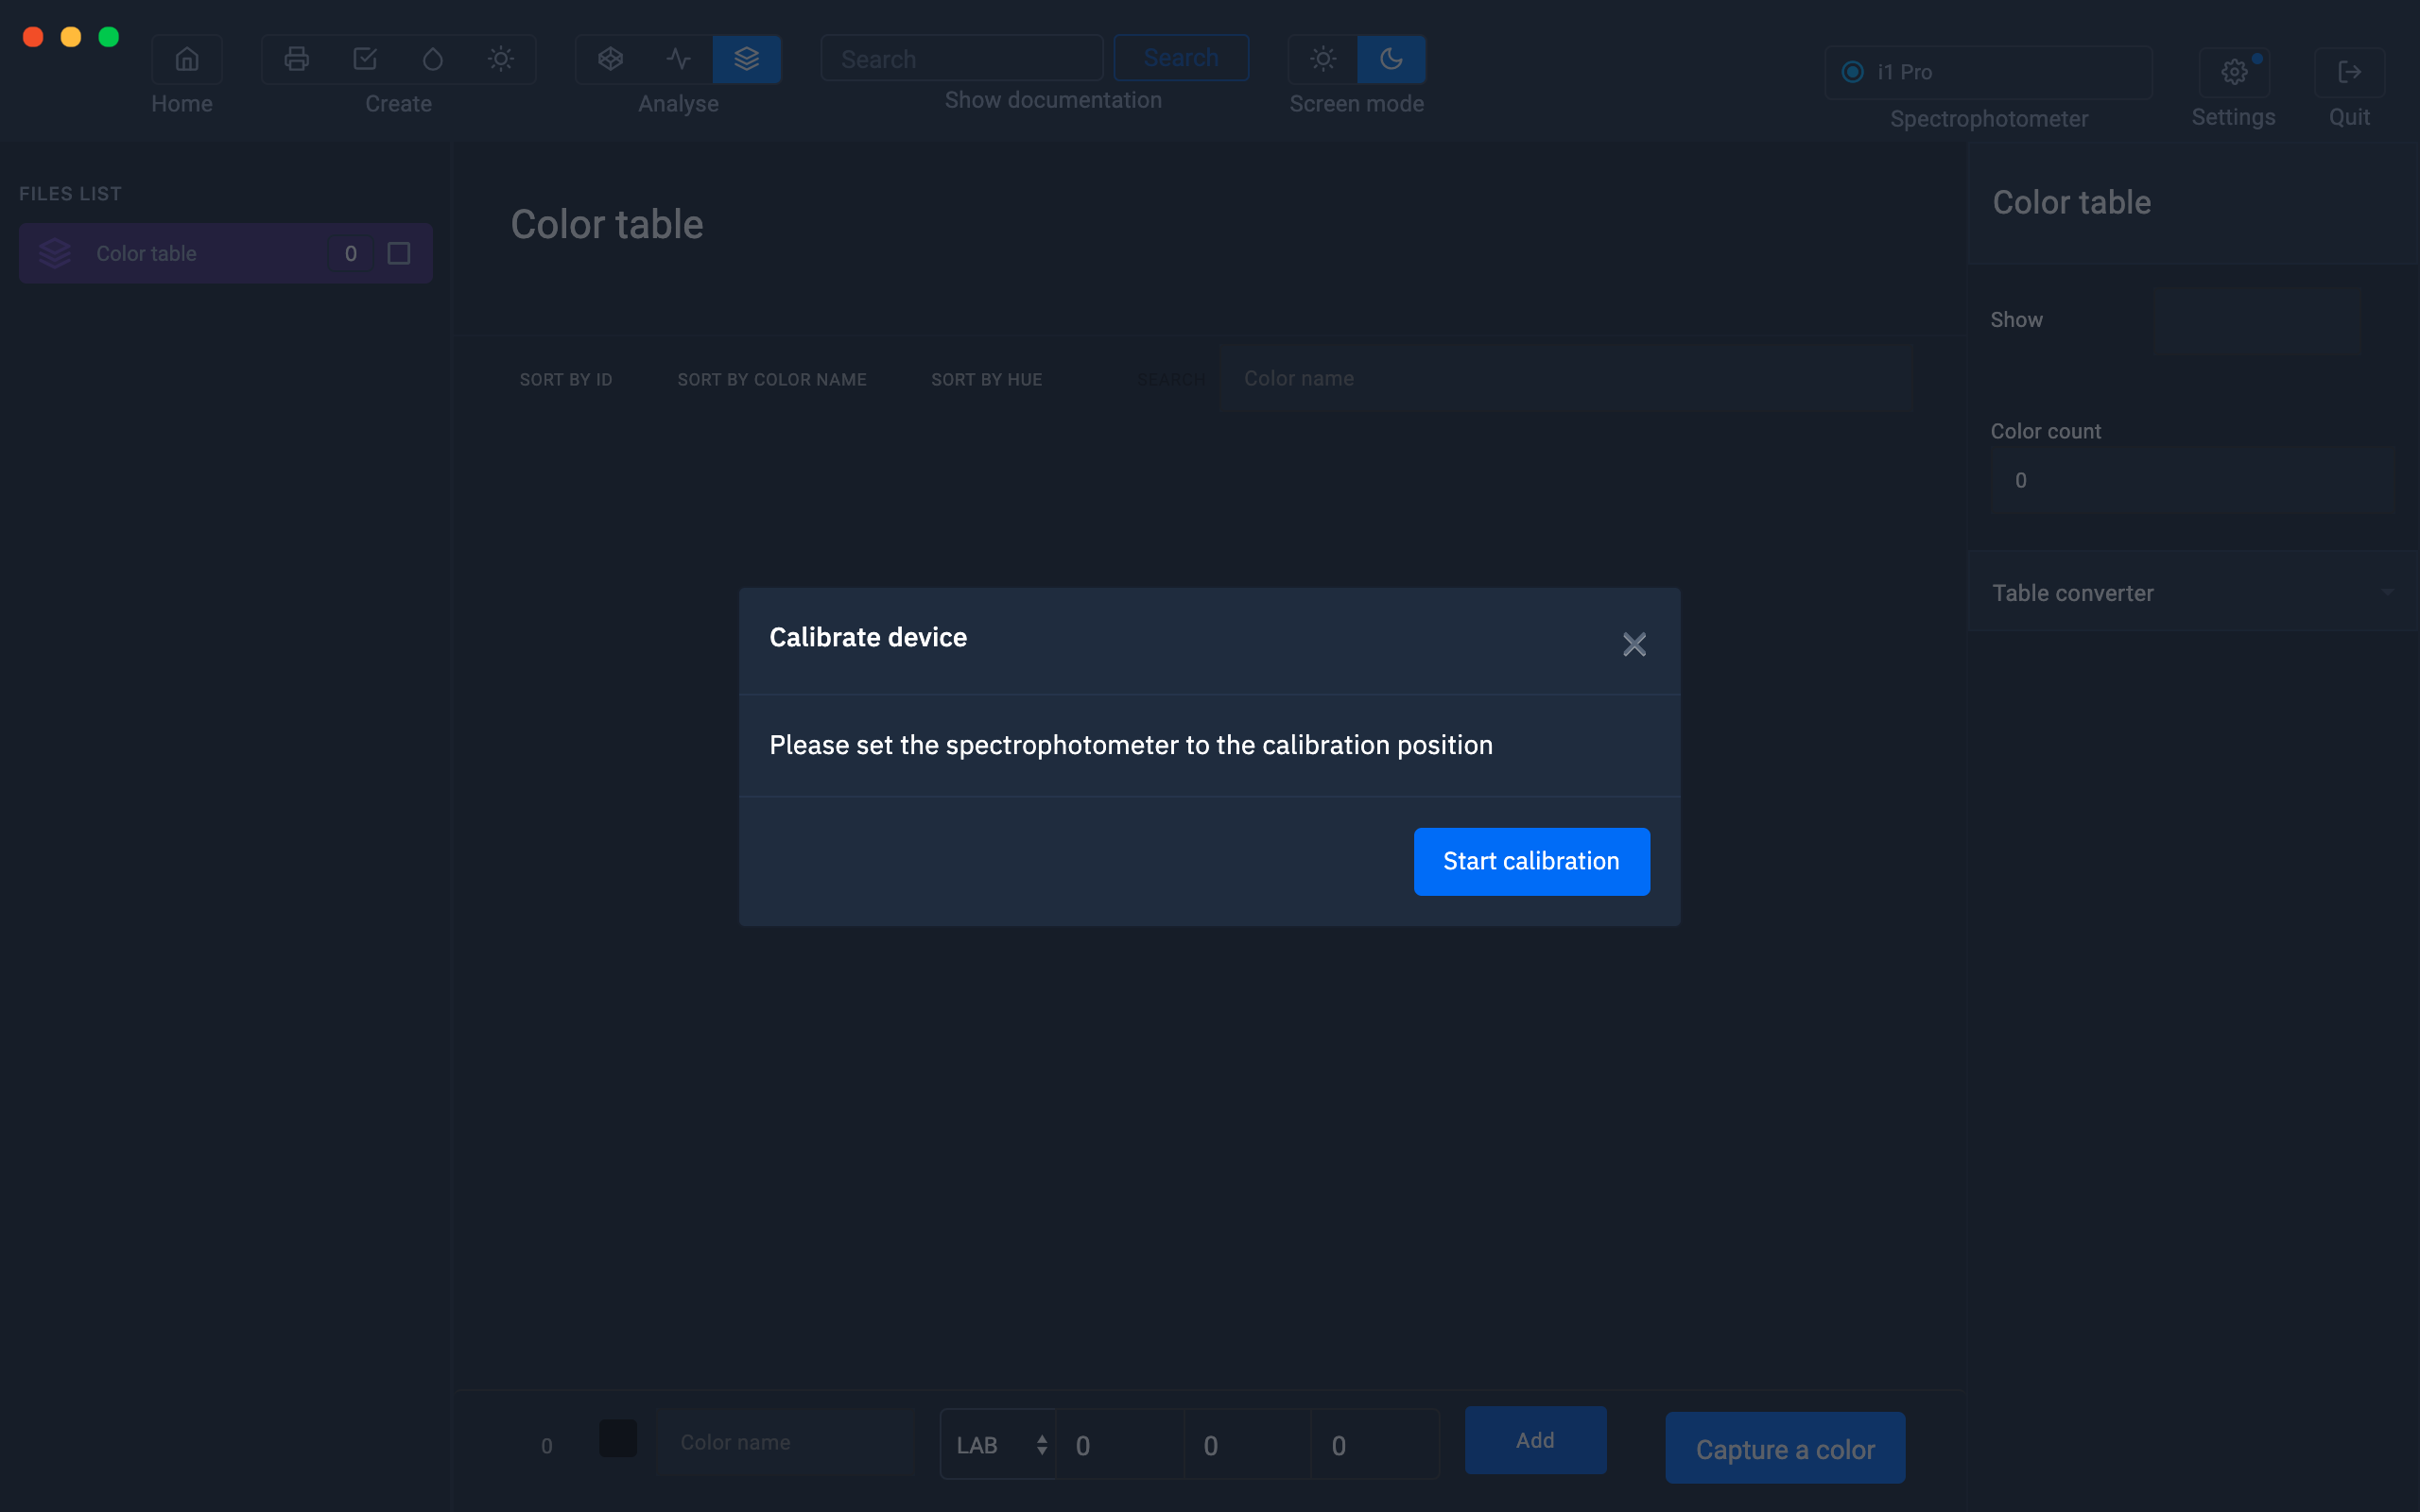
To add colors using a spectrophotometer, click on the bottom button "Capture a color"
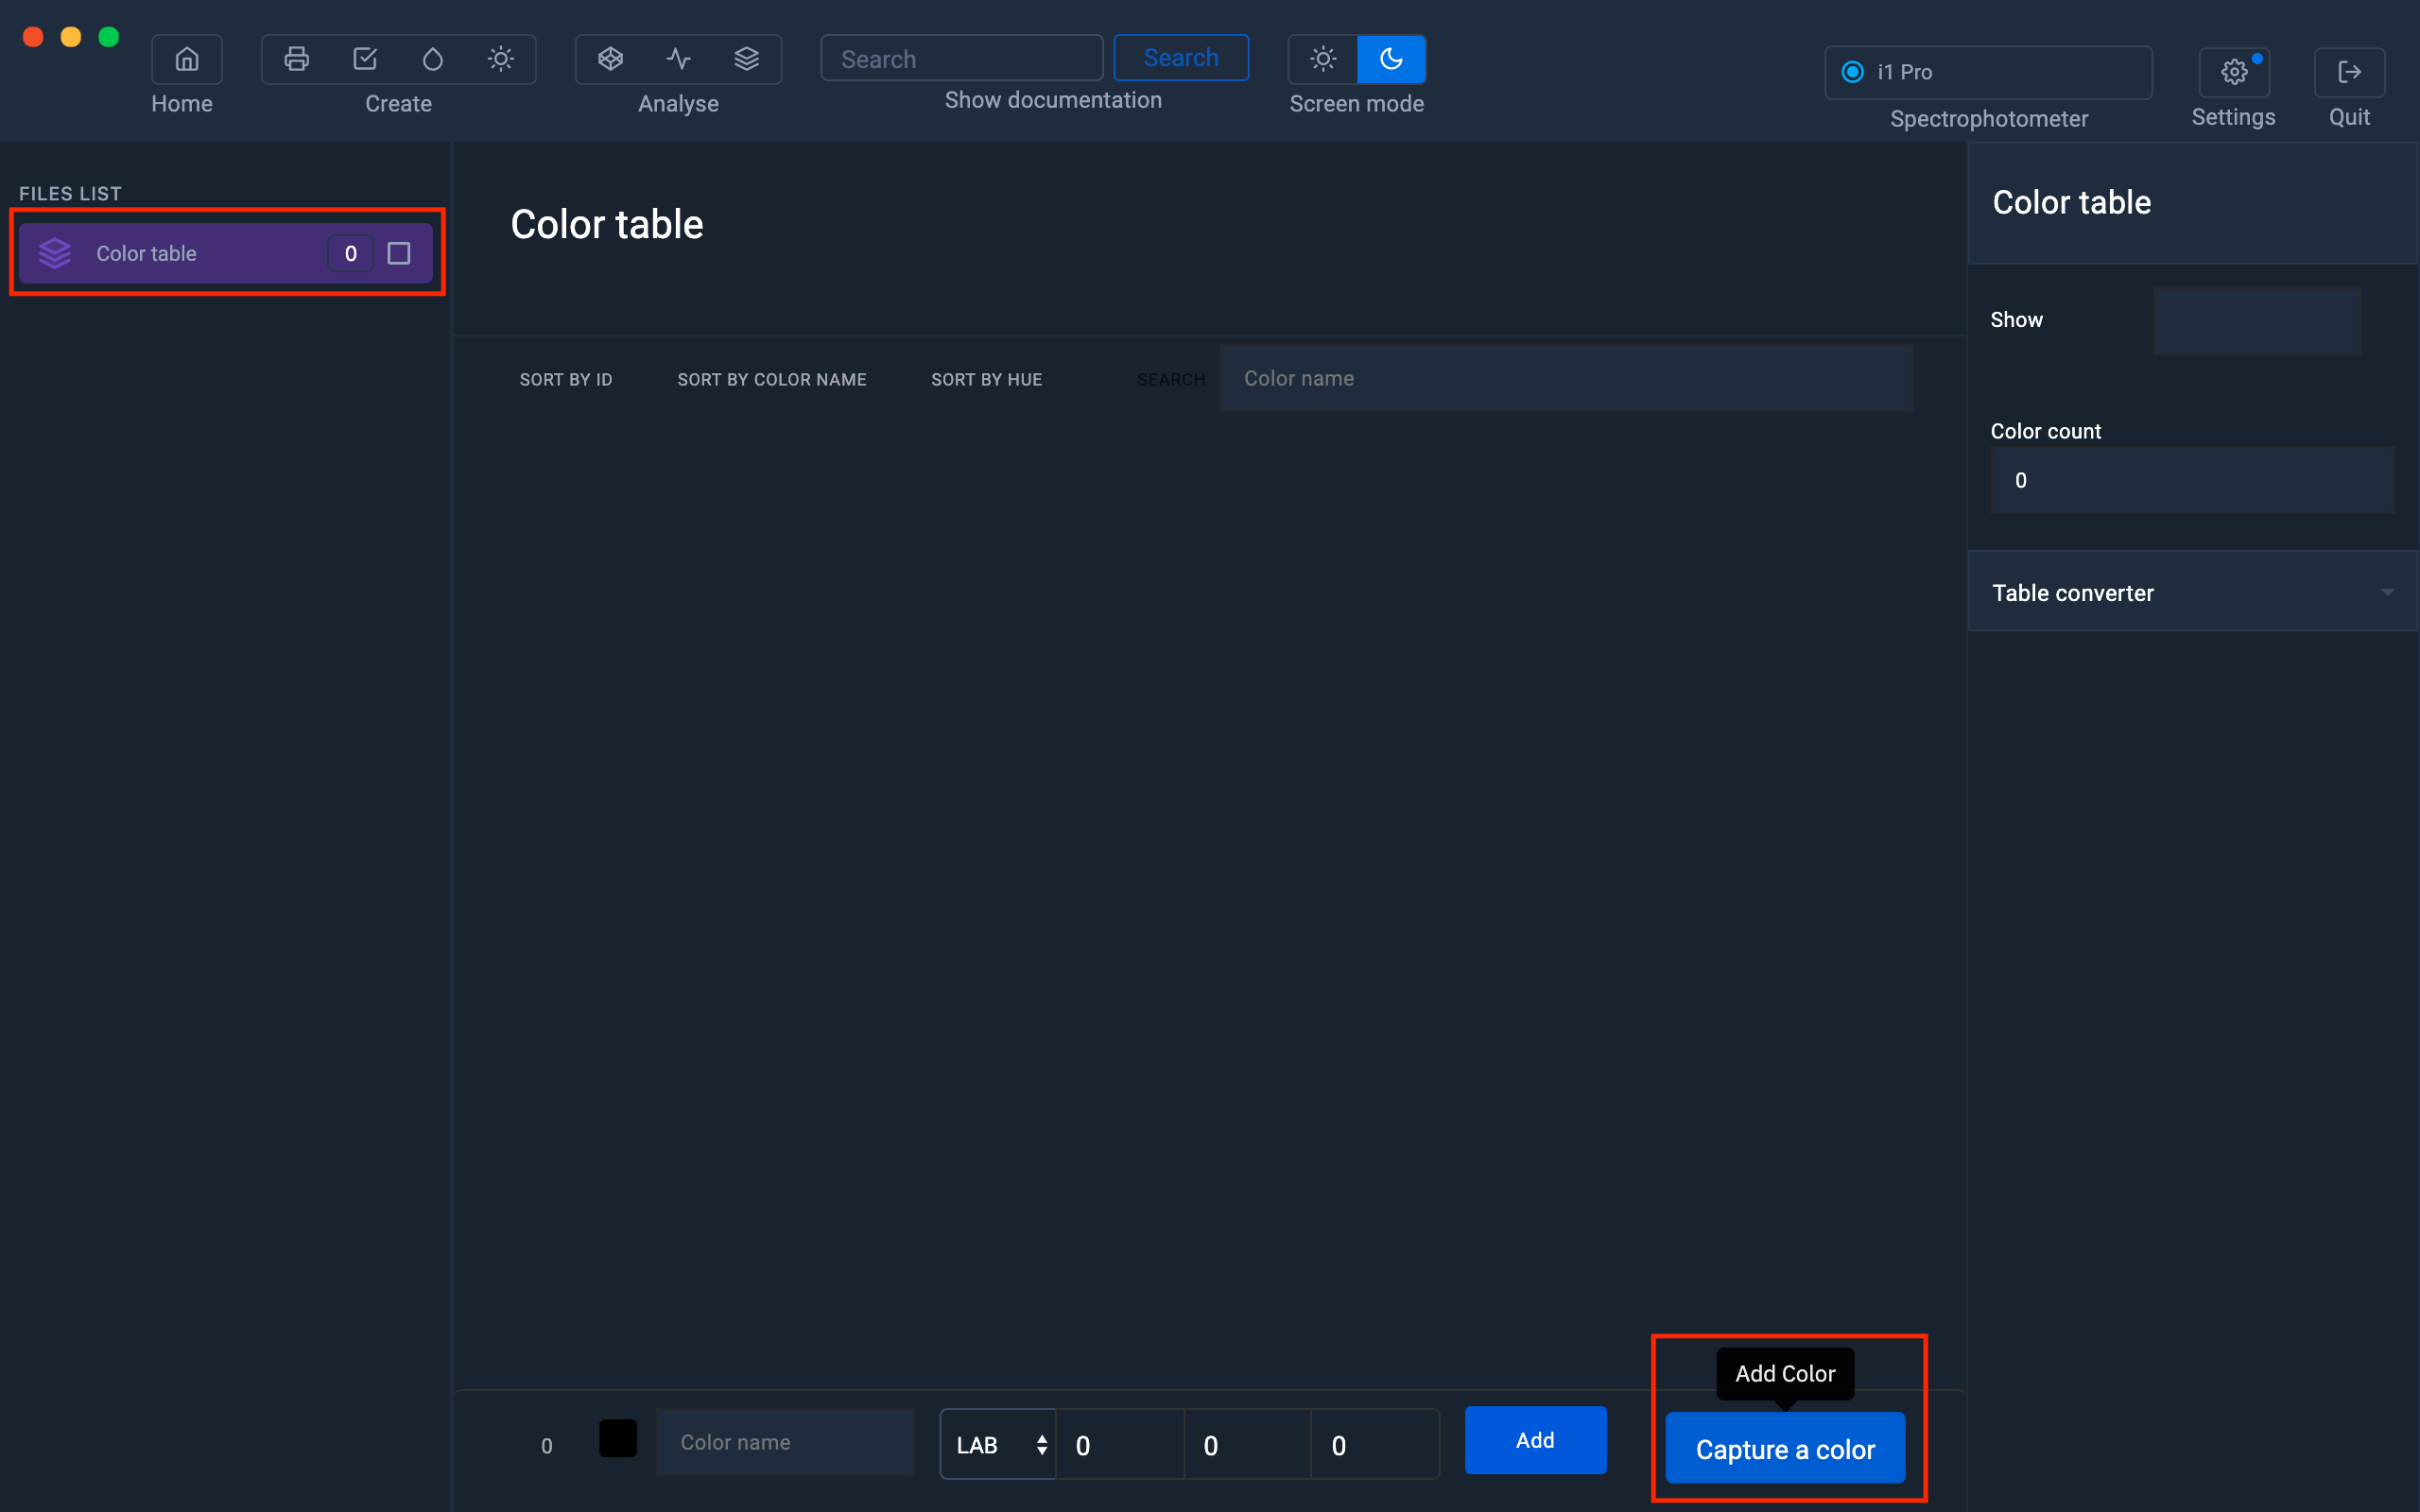
A small window will appear, choose the options to perform the measurement.
Then click on " I'm ready ".
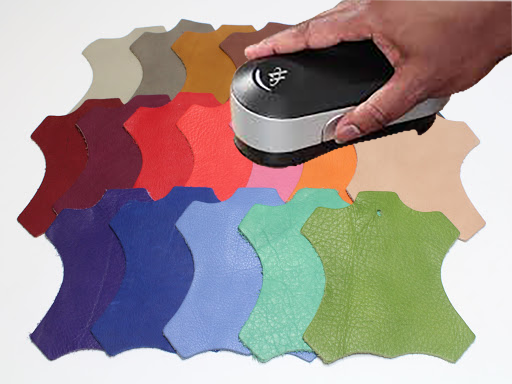
Use Reflective mode to measure on paper or material such as leather, fabric, etc.
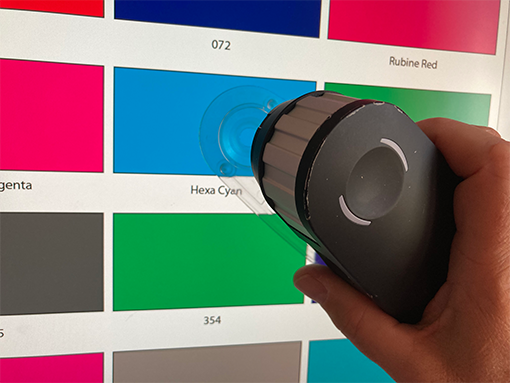
Use Emissive mode to measure a color on your screen
| Material measurement | Measuring colors on a screen |
|
|
 |
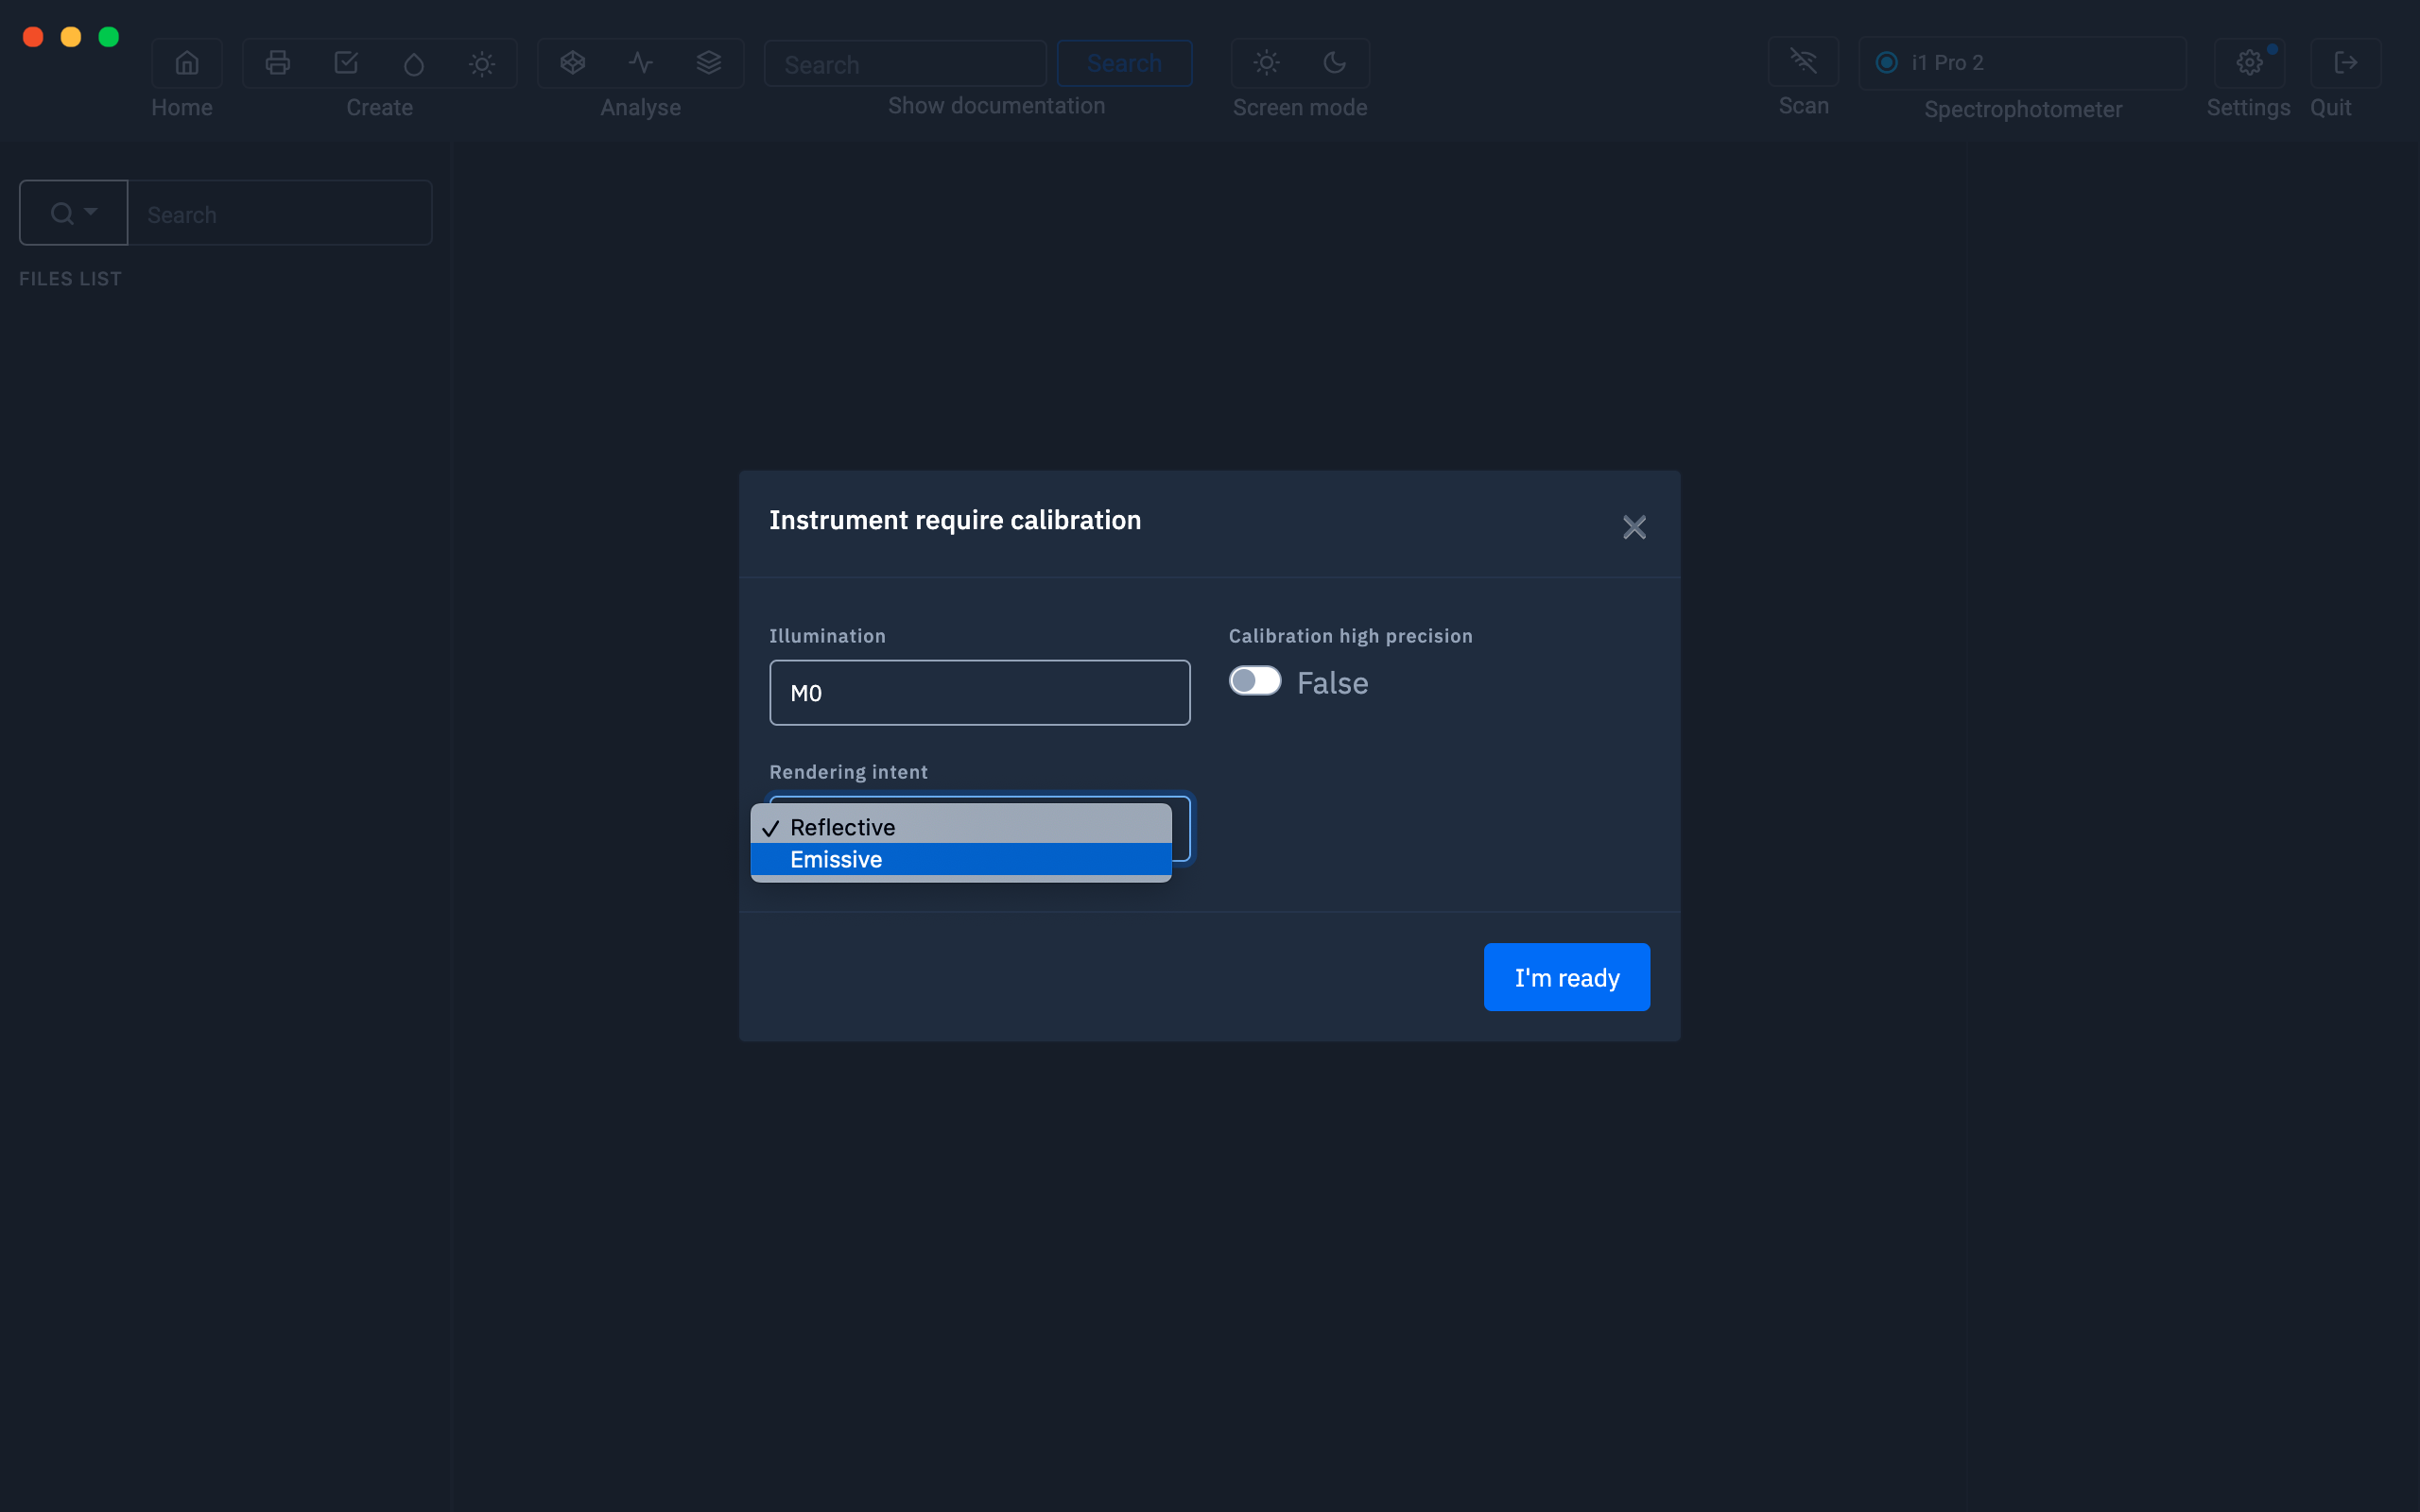
During calibration, you need to put your spectrophotometer in its calibration position.
|
Konica Minolta MYIRO |
 |
| XRite I1 Pro 3 |
|
| XRite I1 Pro 2 | 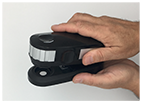
|
| XRite I1 Pro |  |
| Konica Minolta CM 26d | 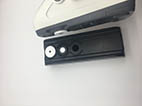 |

When the calibration is complete, you are ready to capture the colors.
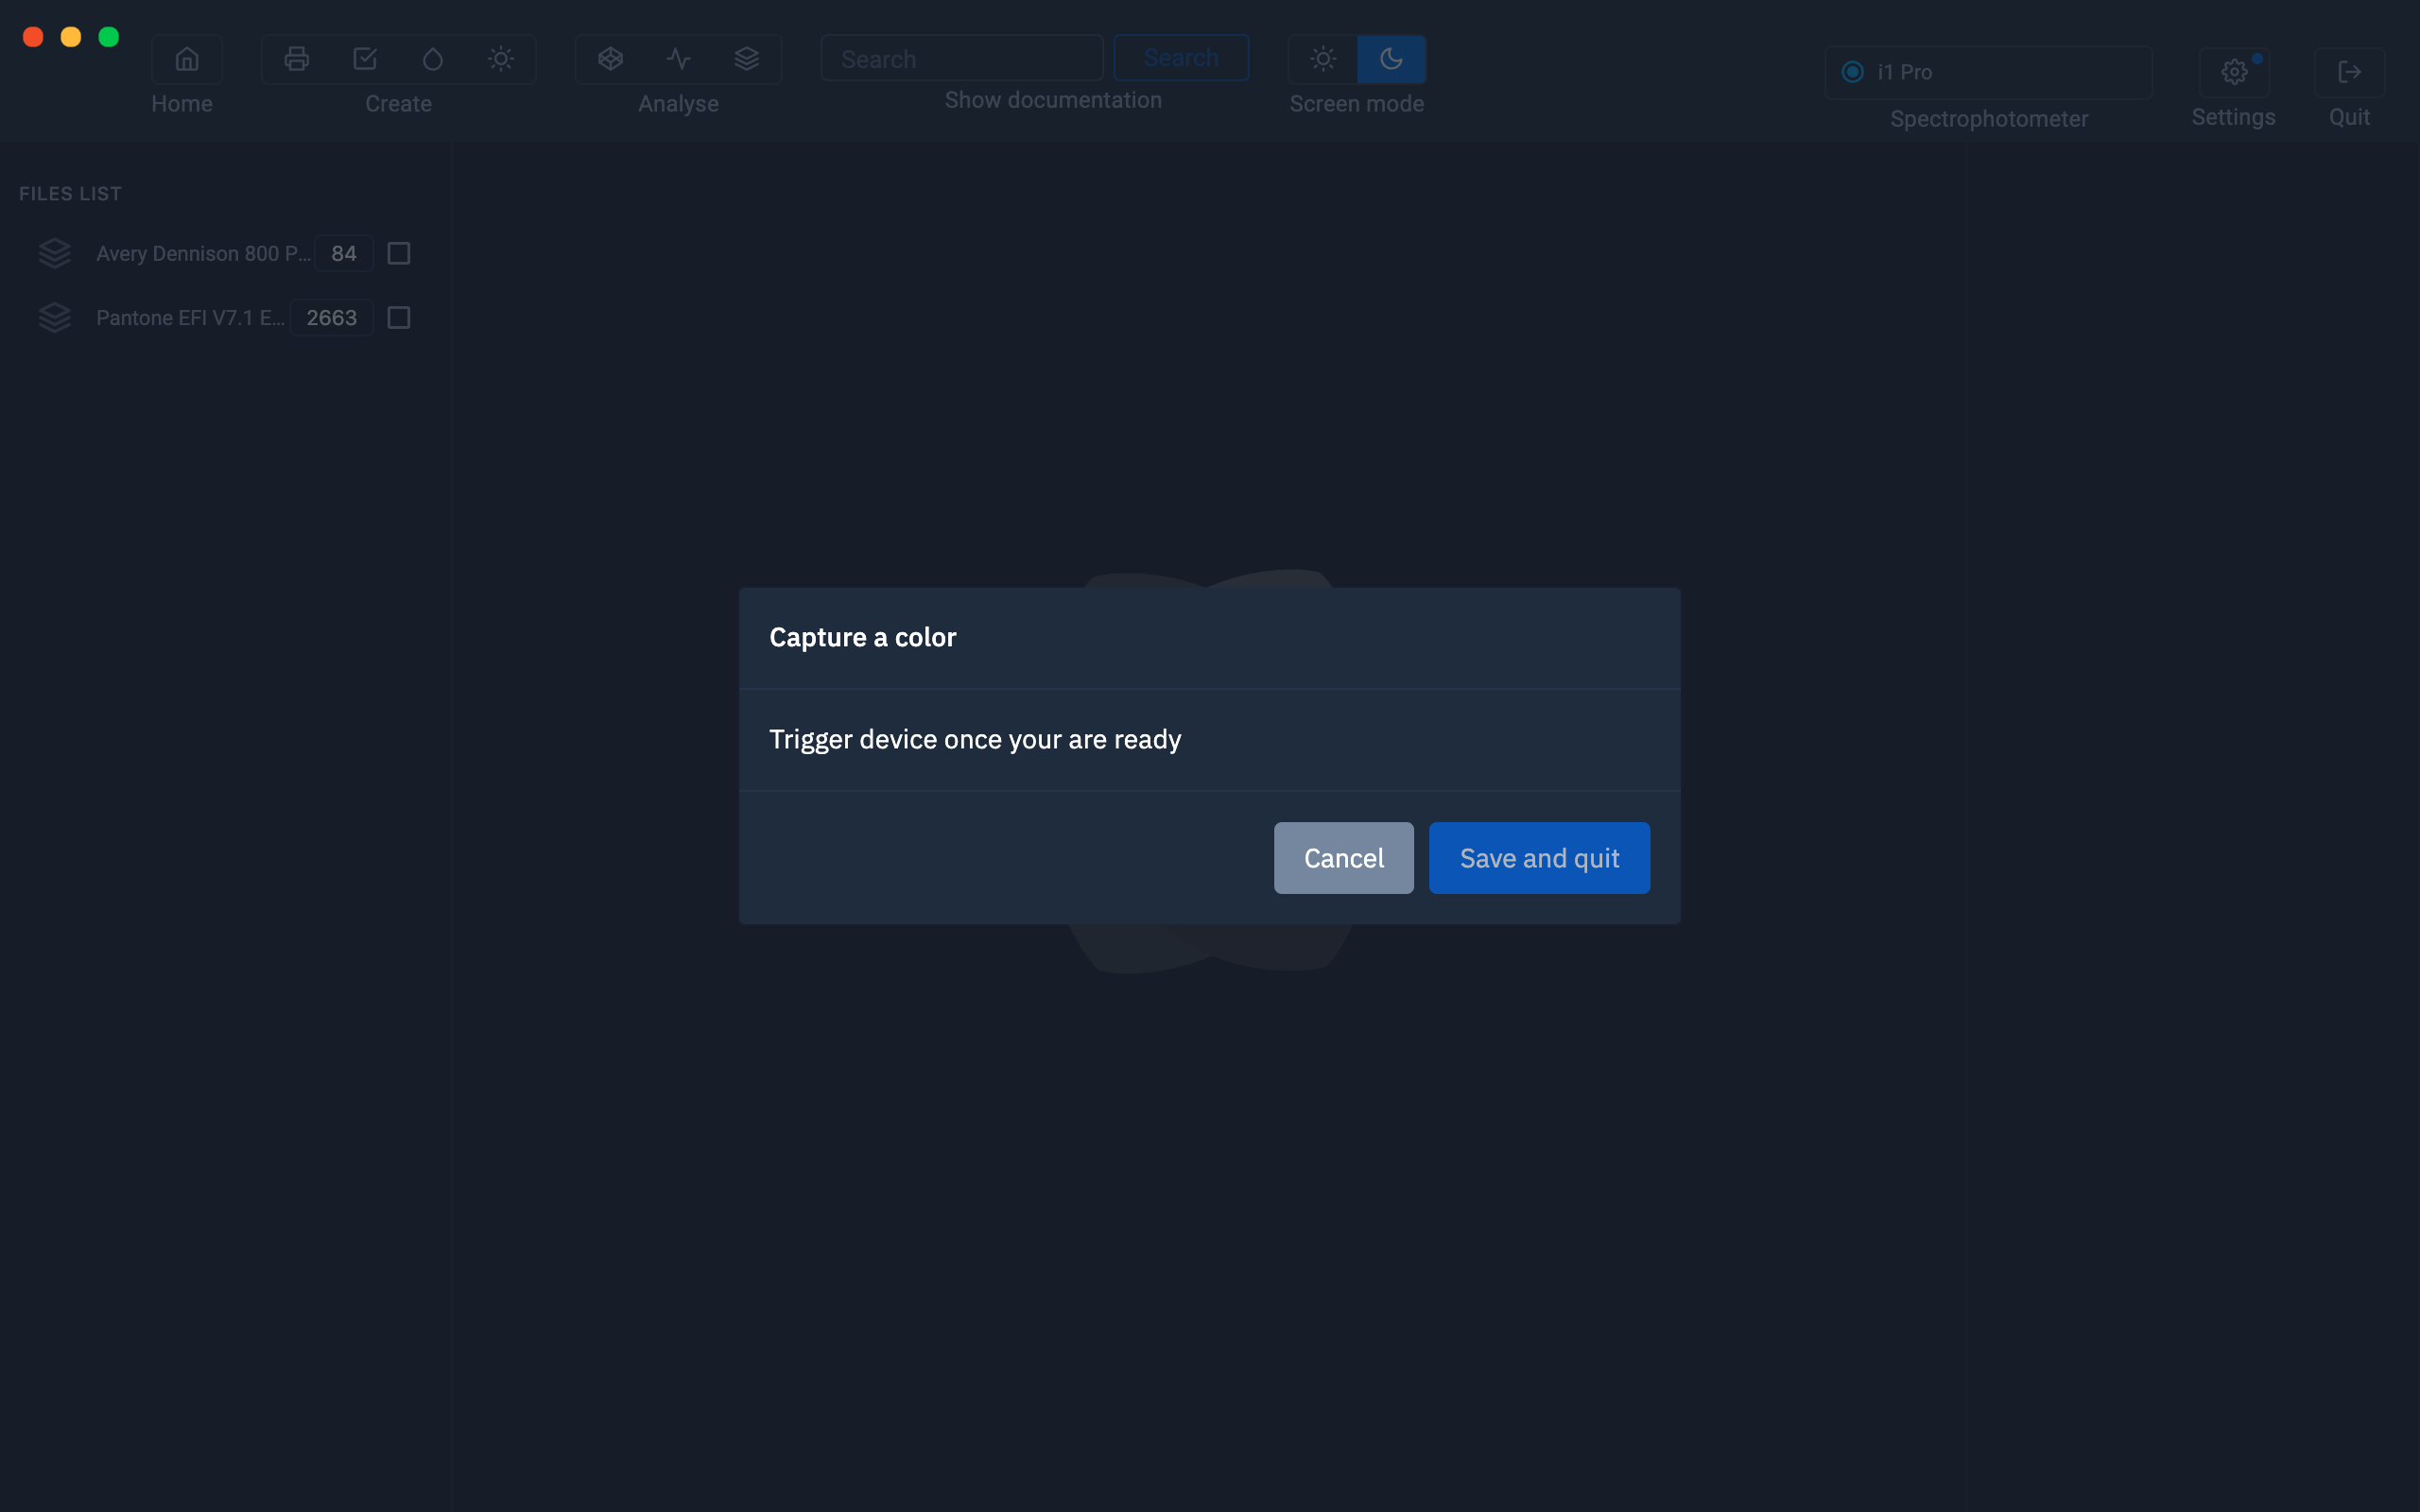
Successive measurements will be displayed one below the other.
Click " Save and Exit " to add the colors directly to the color table.

The colors will appear in the color table.
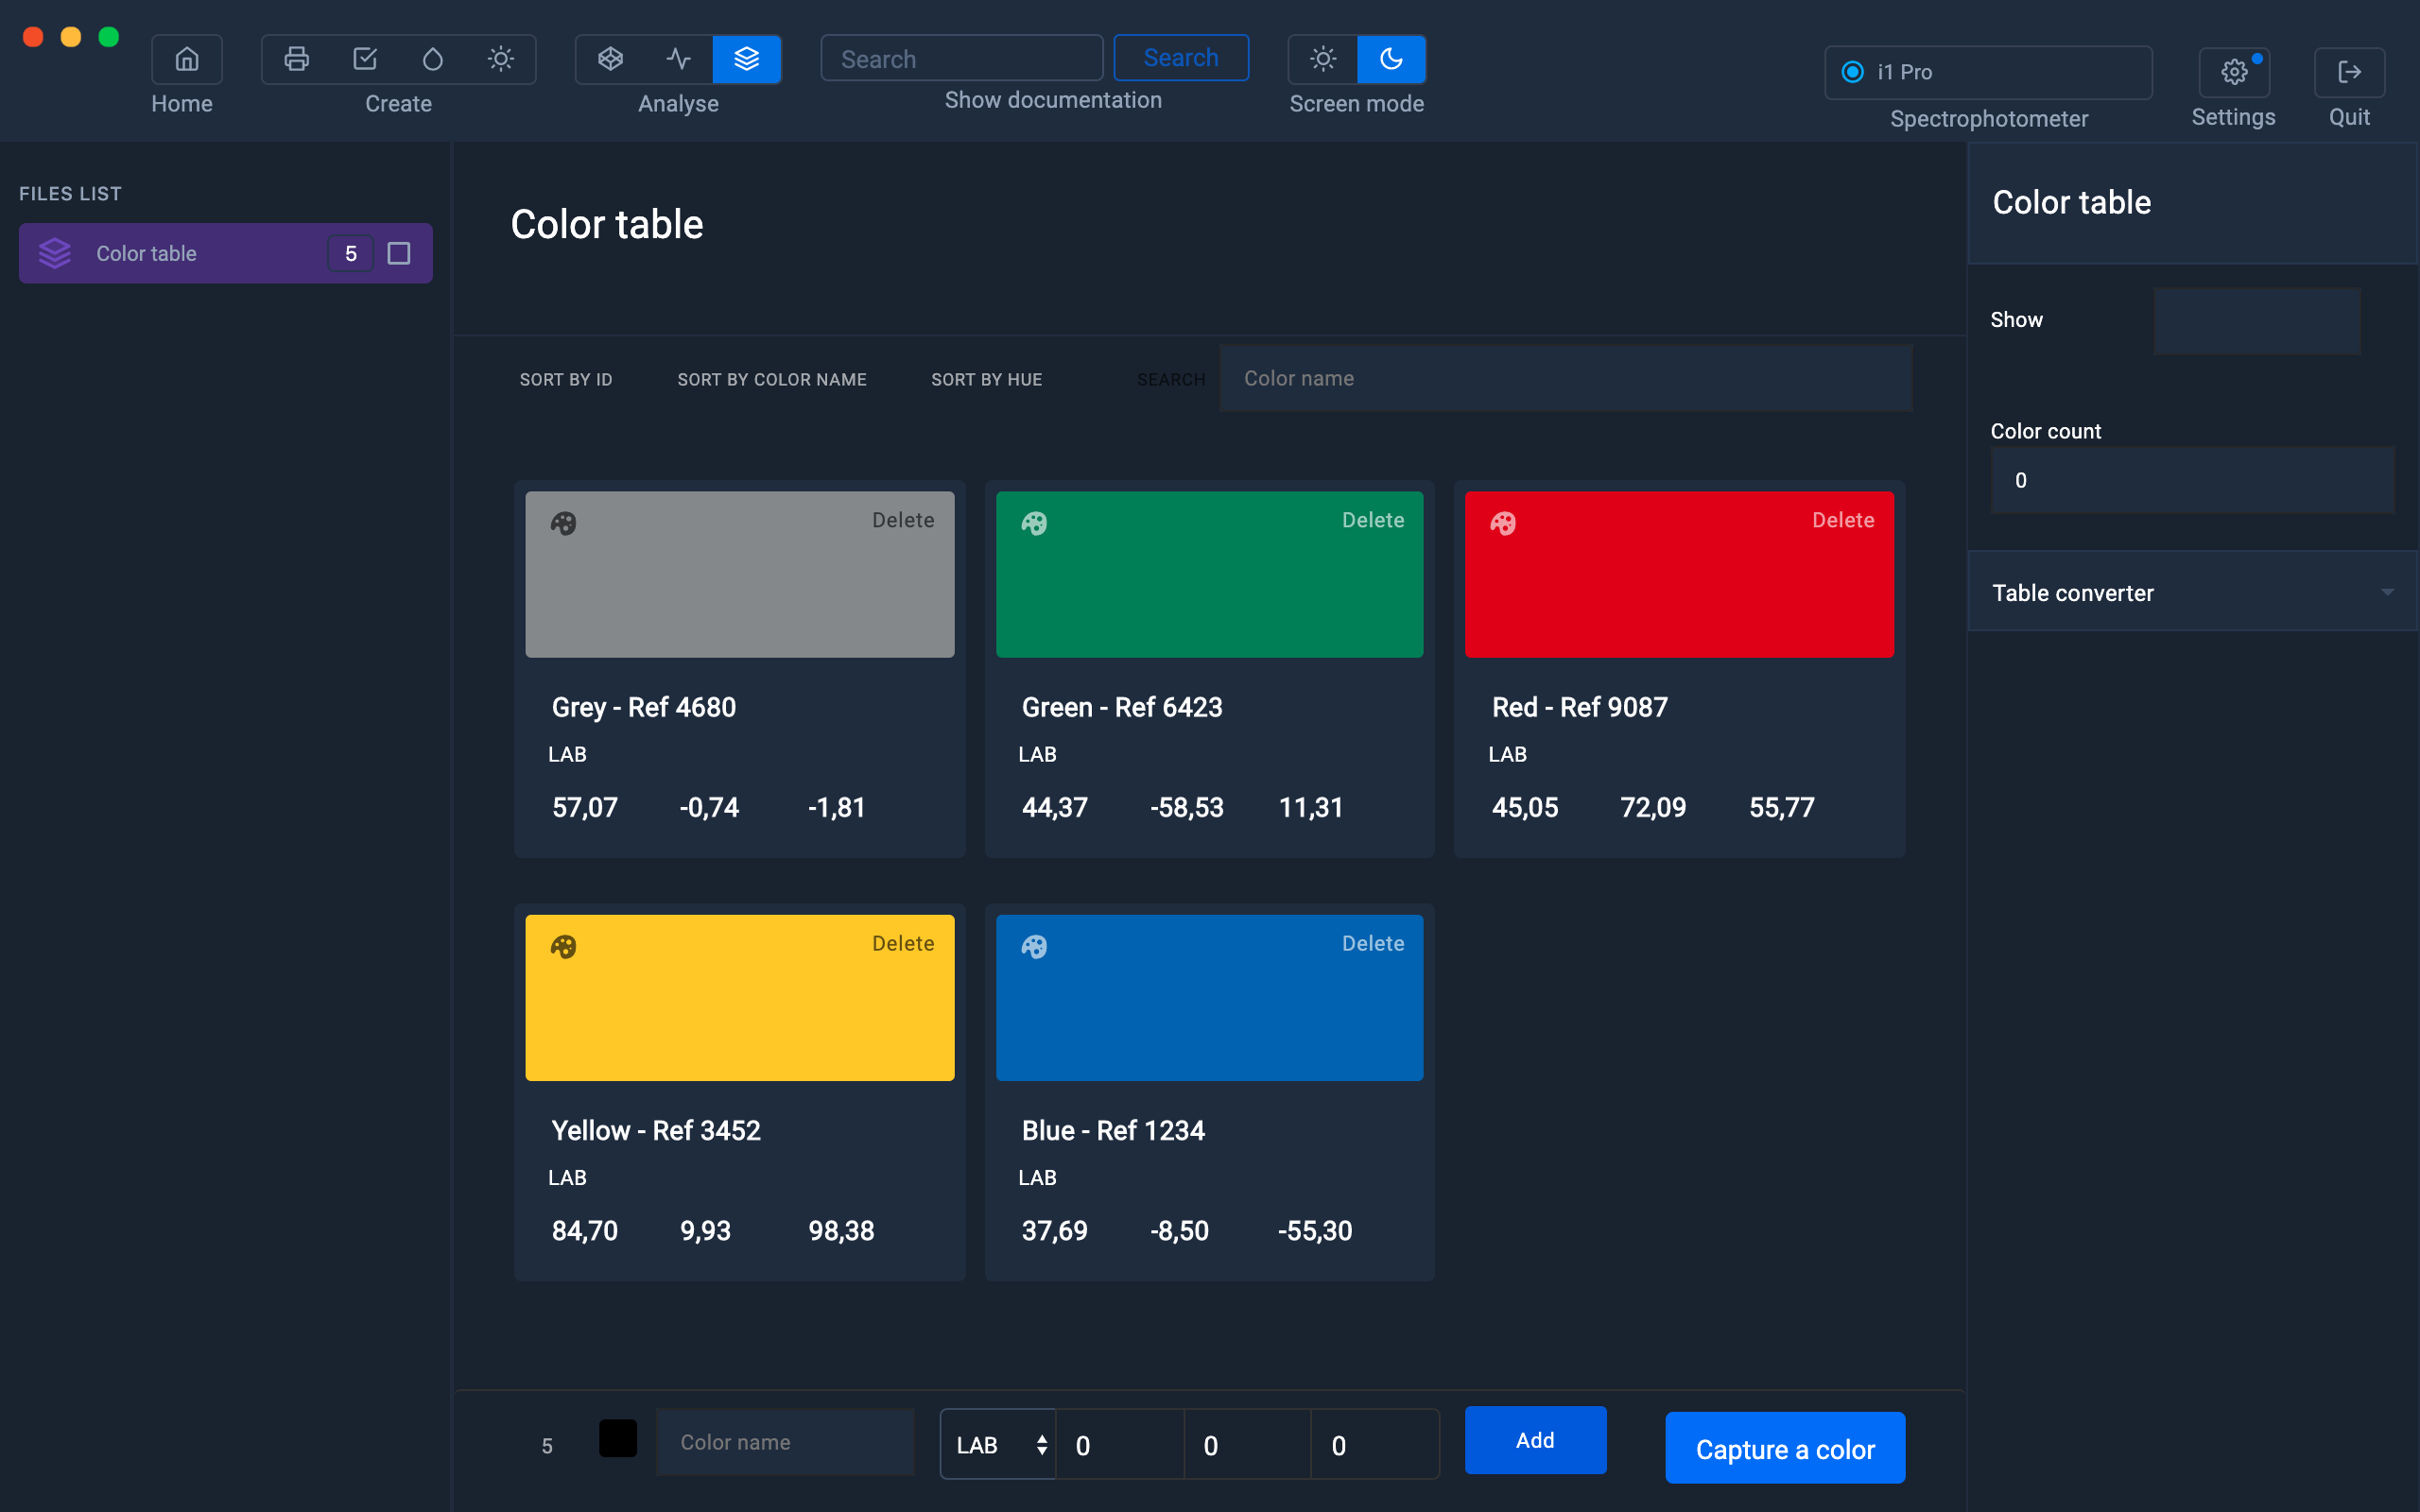
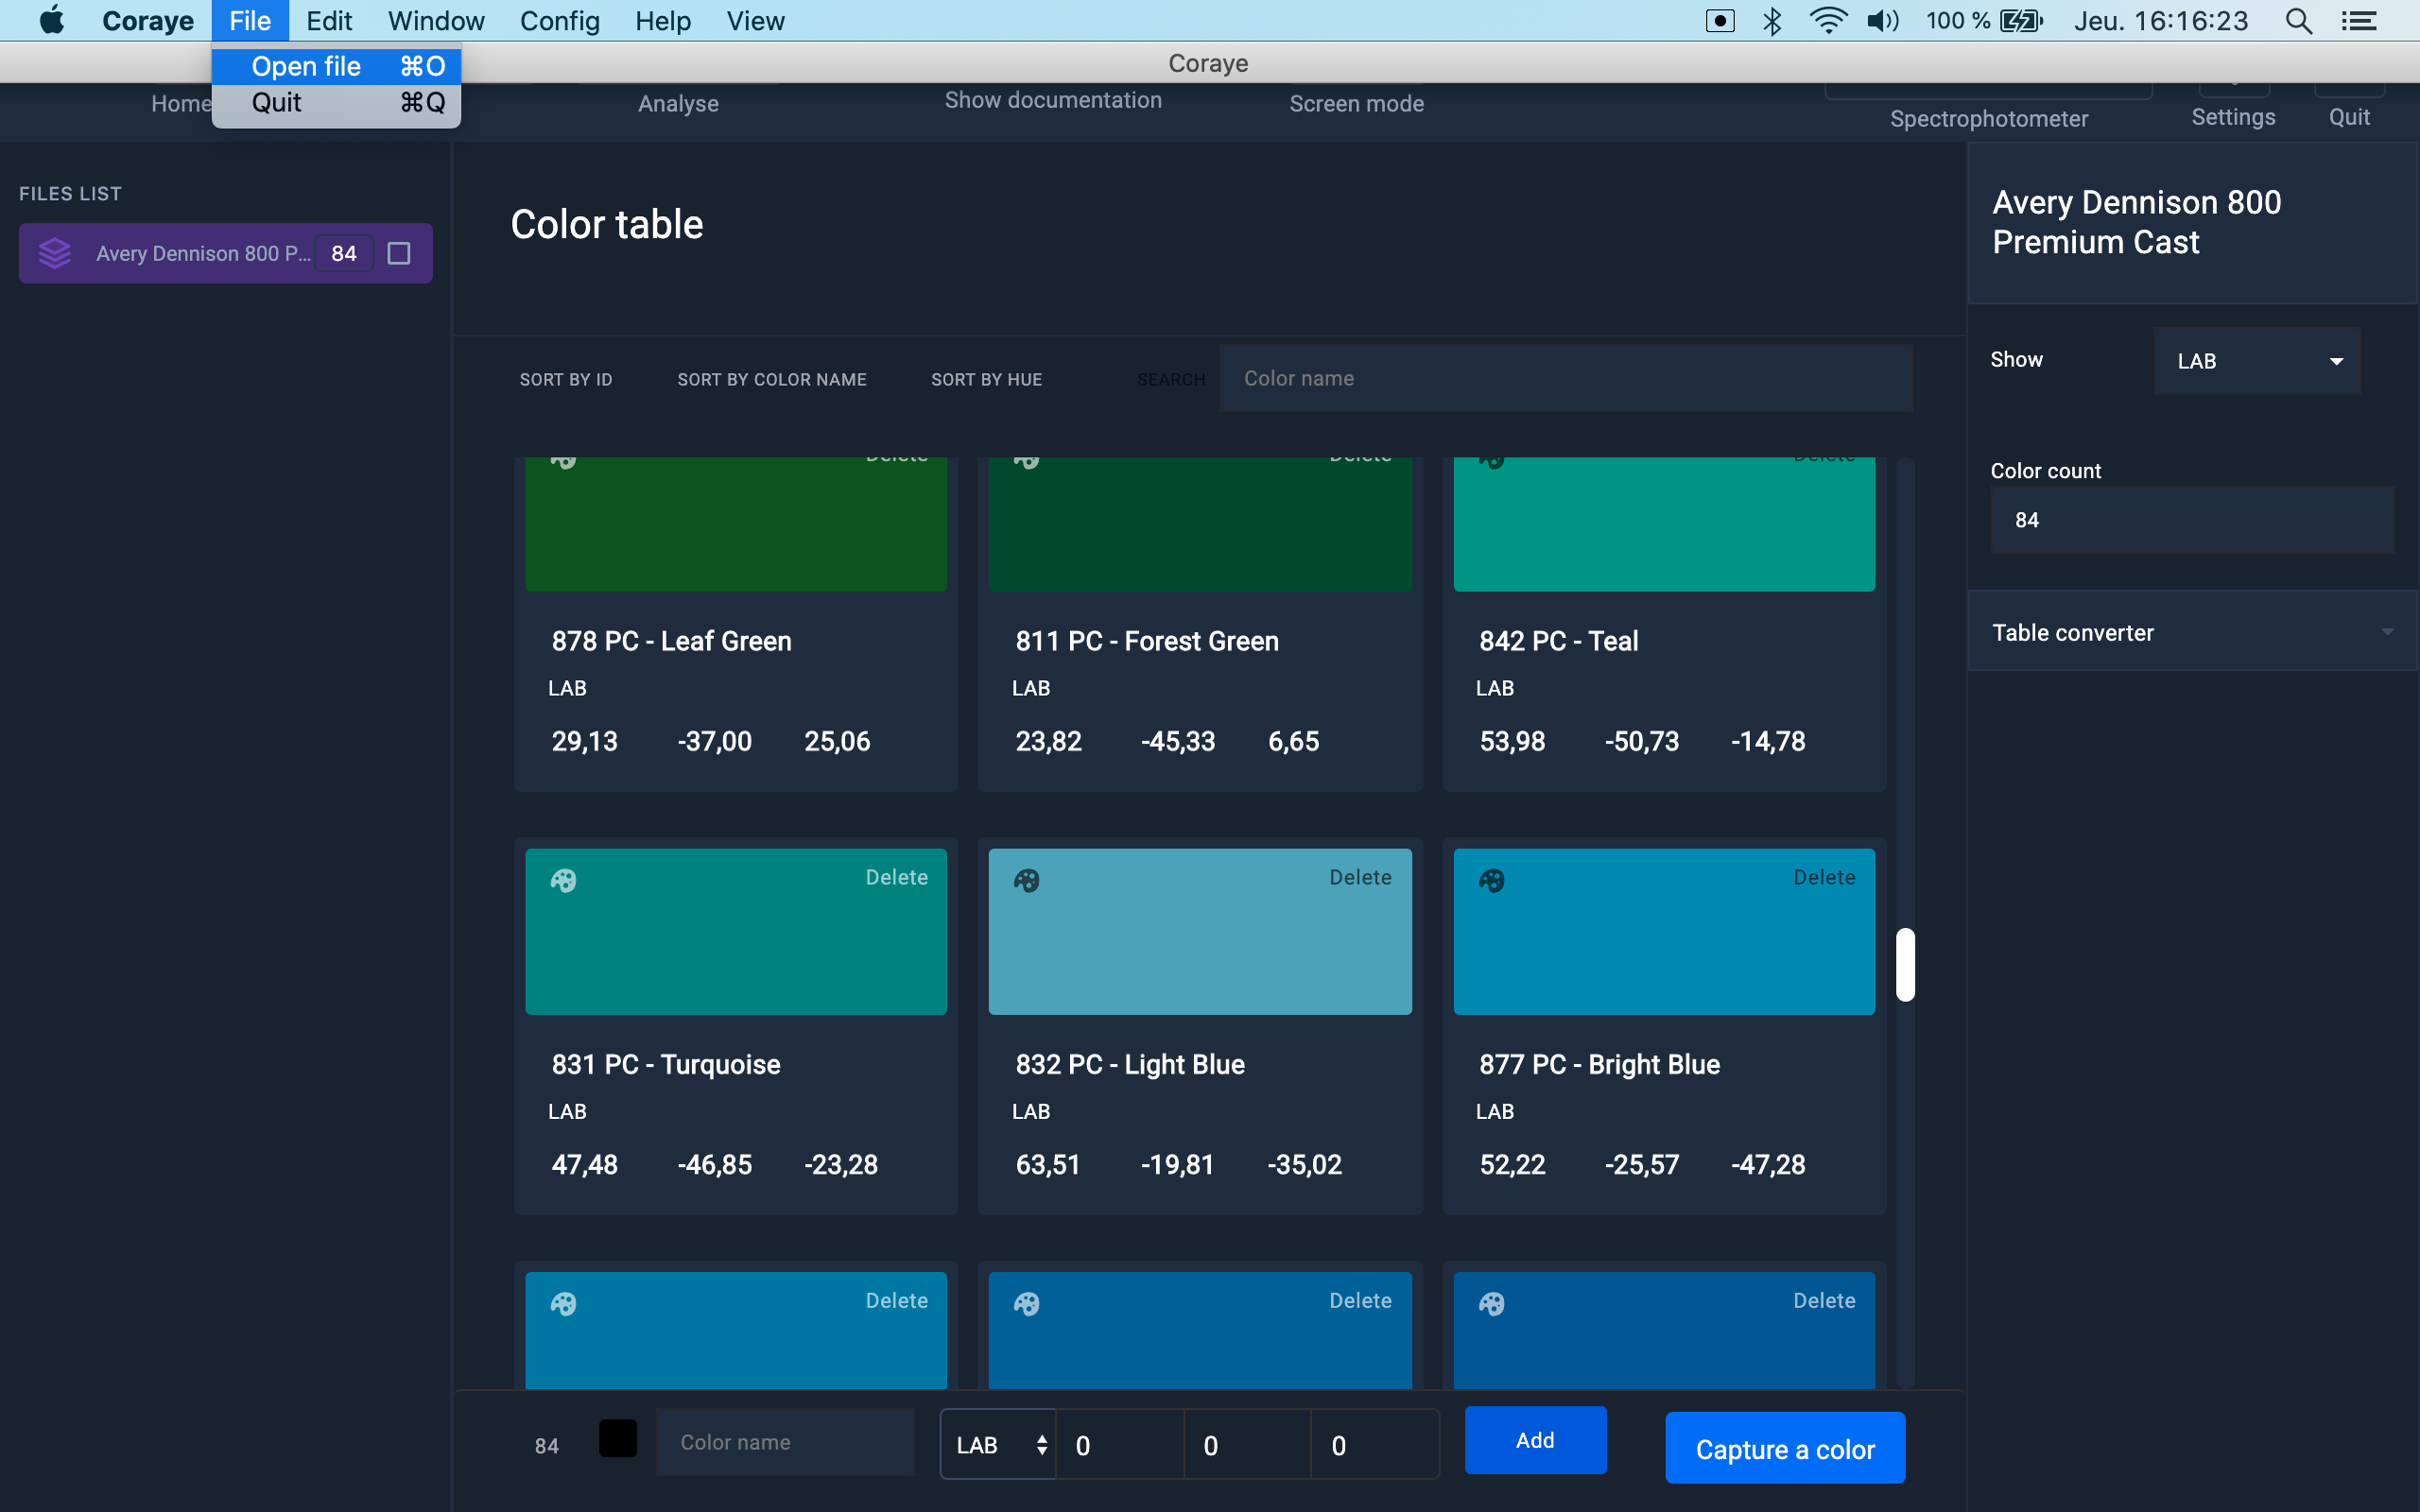
Add a color manually (Lab mode)
If you know the LAB values for your color, you can manually add them to the color table.
To do this, enter the Lab values and the name of the color in the lower box, then click the "Add" button.
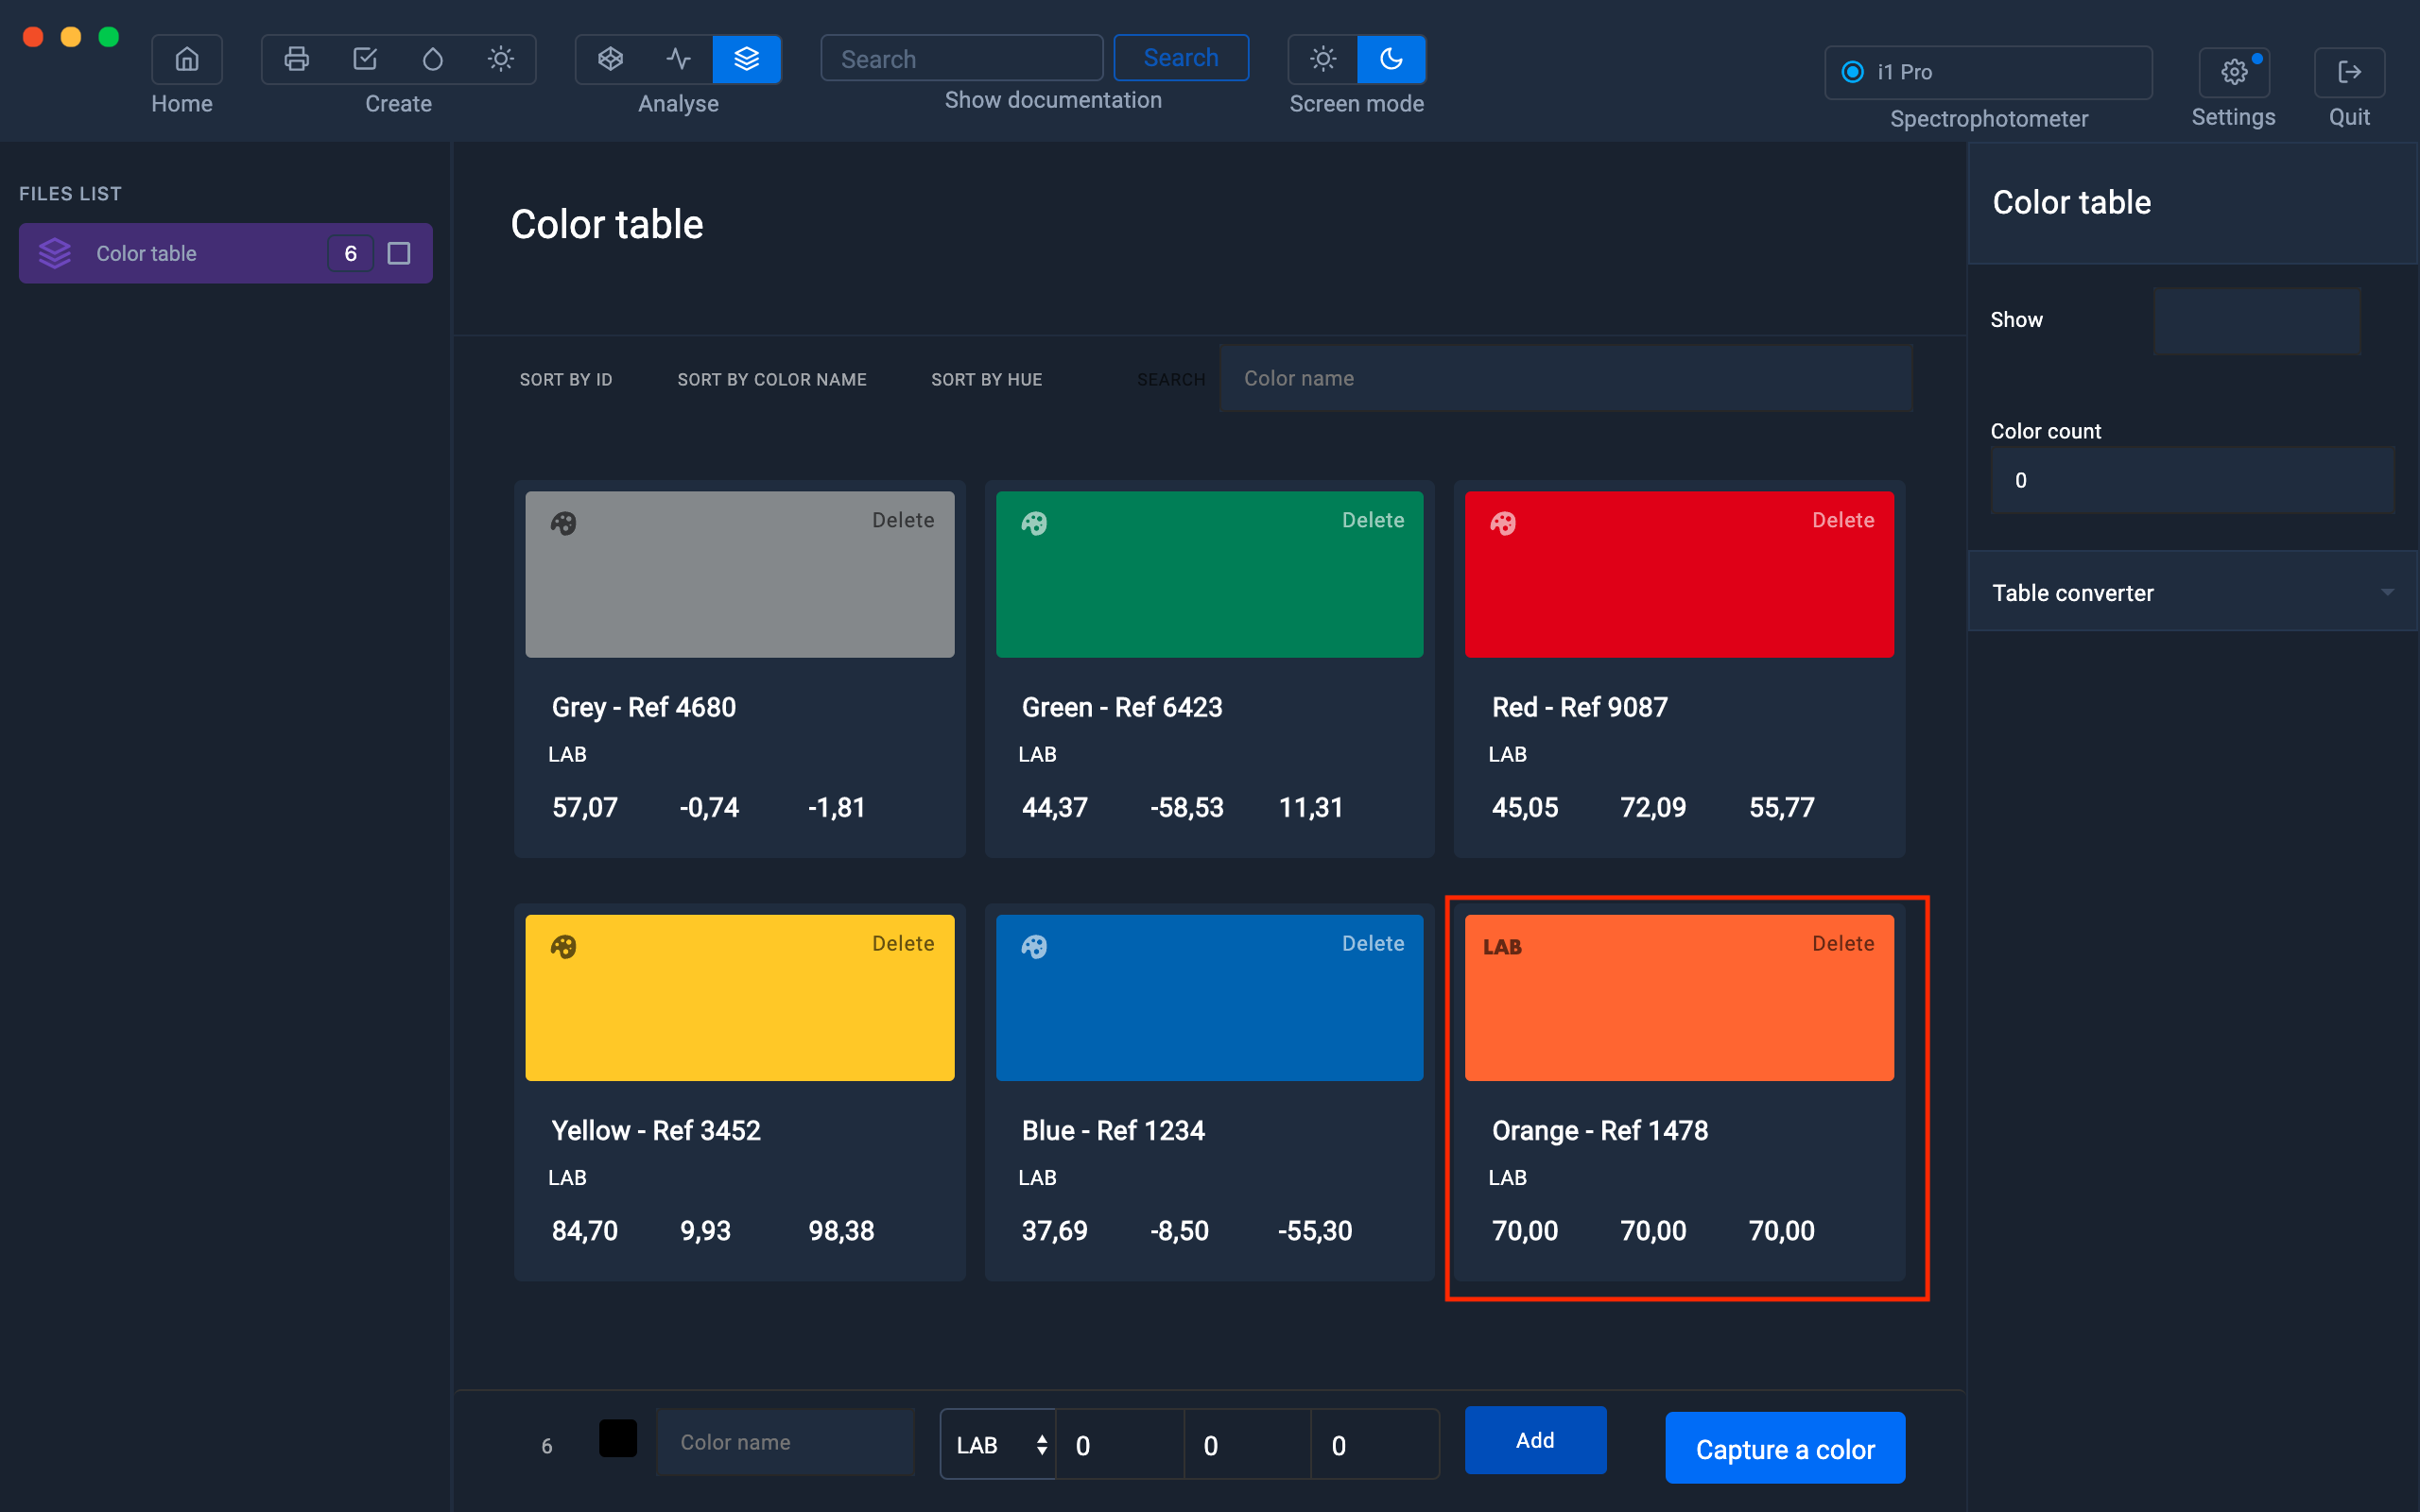
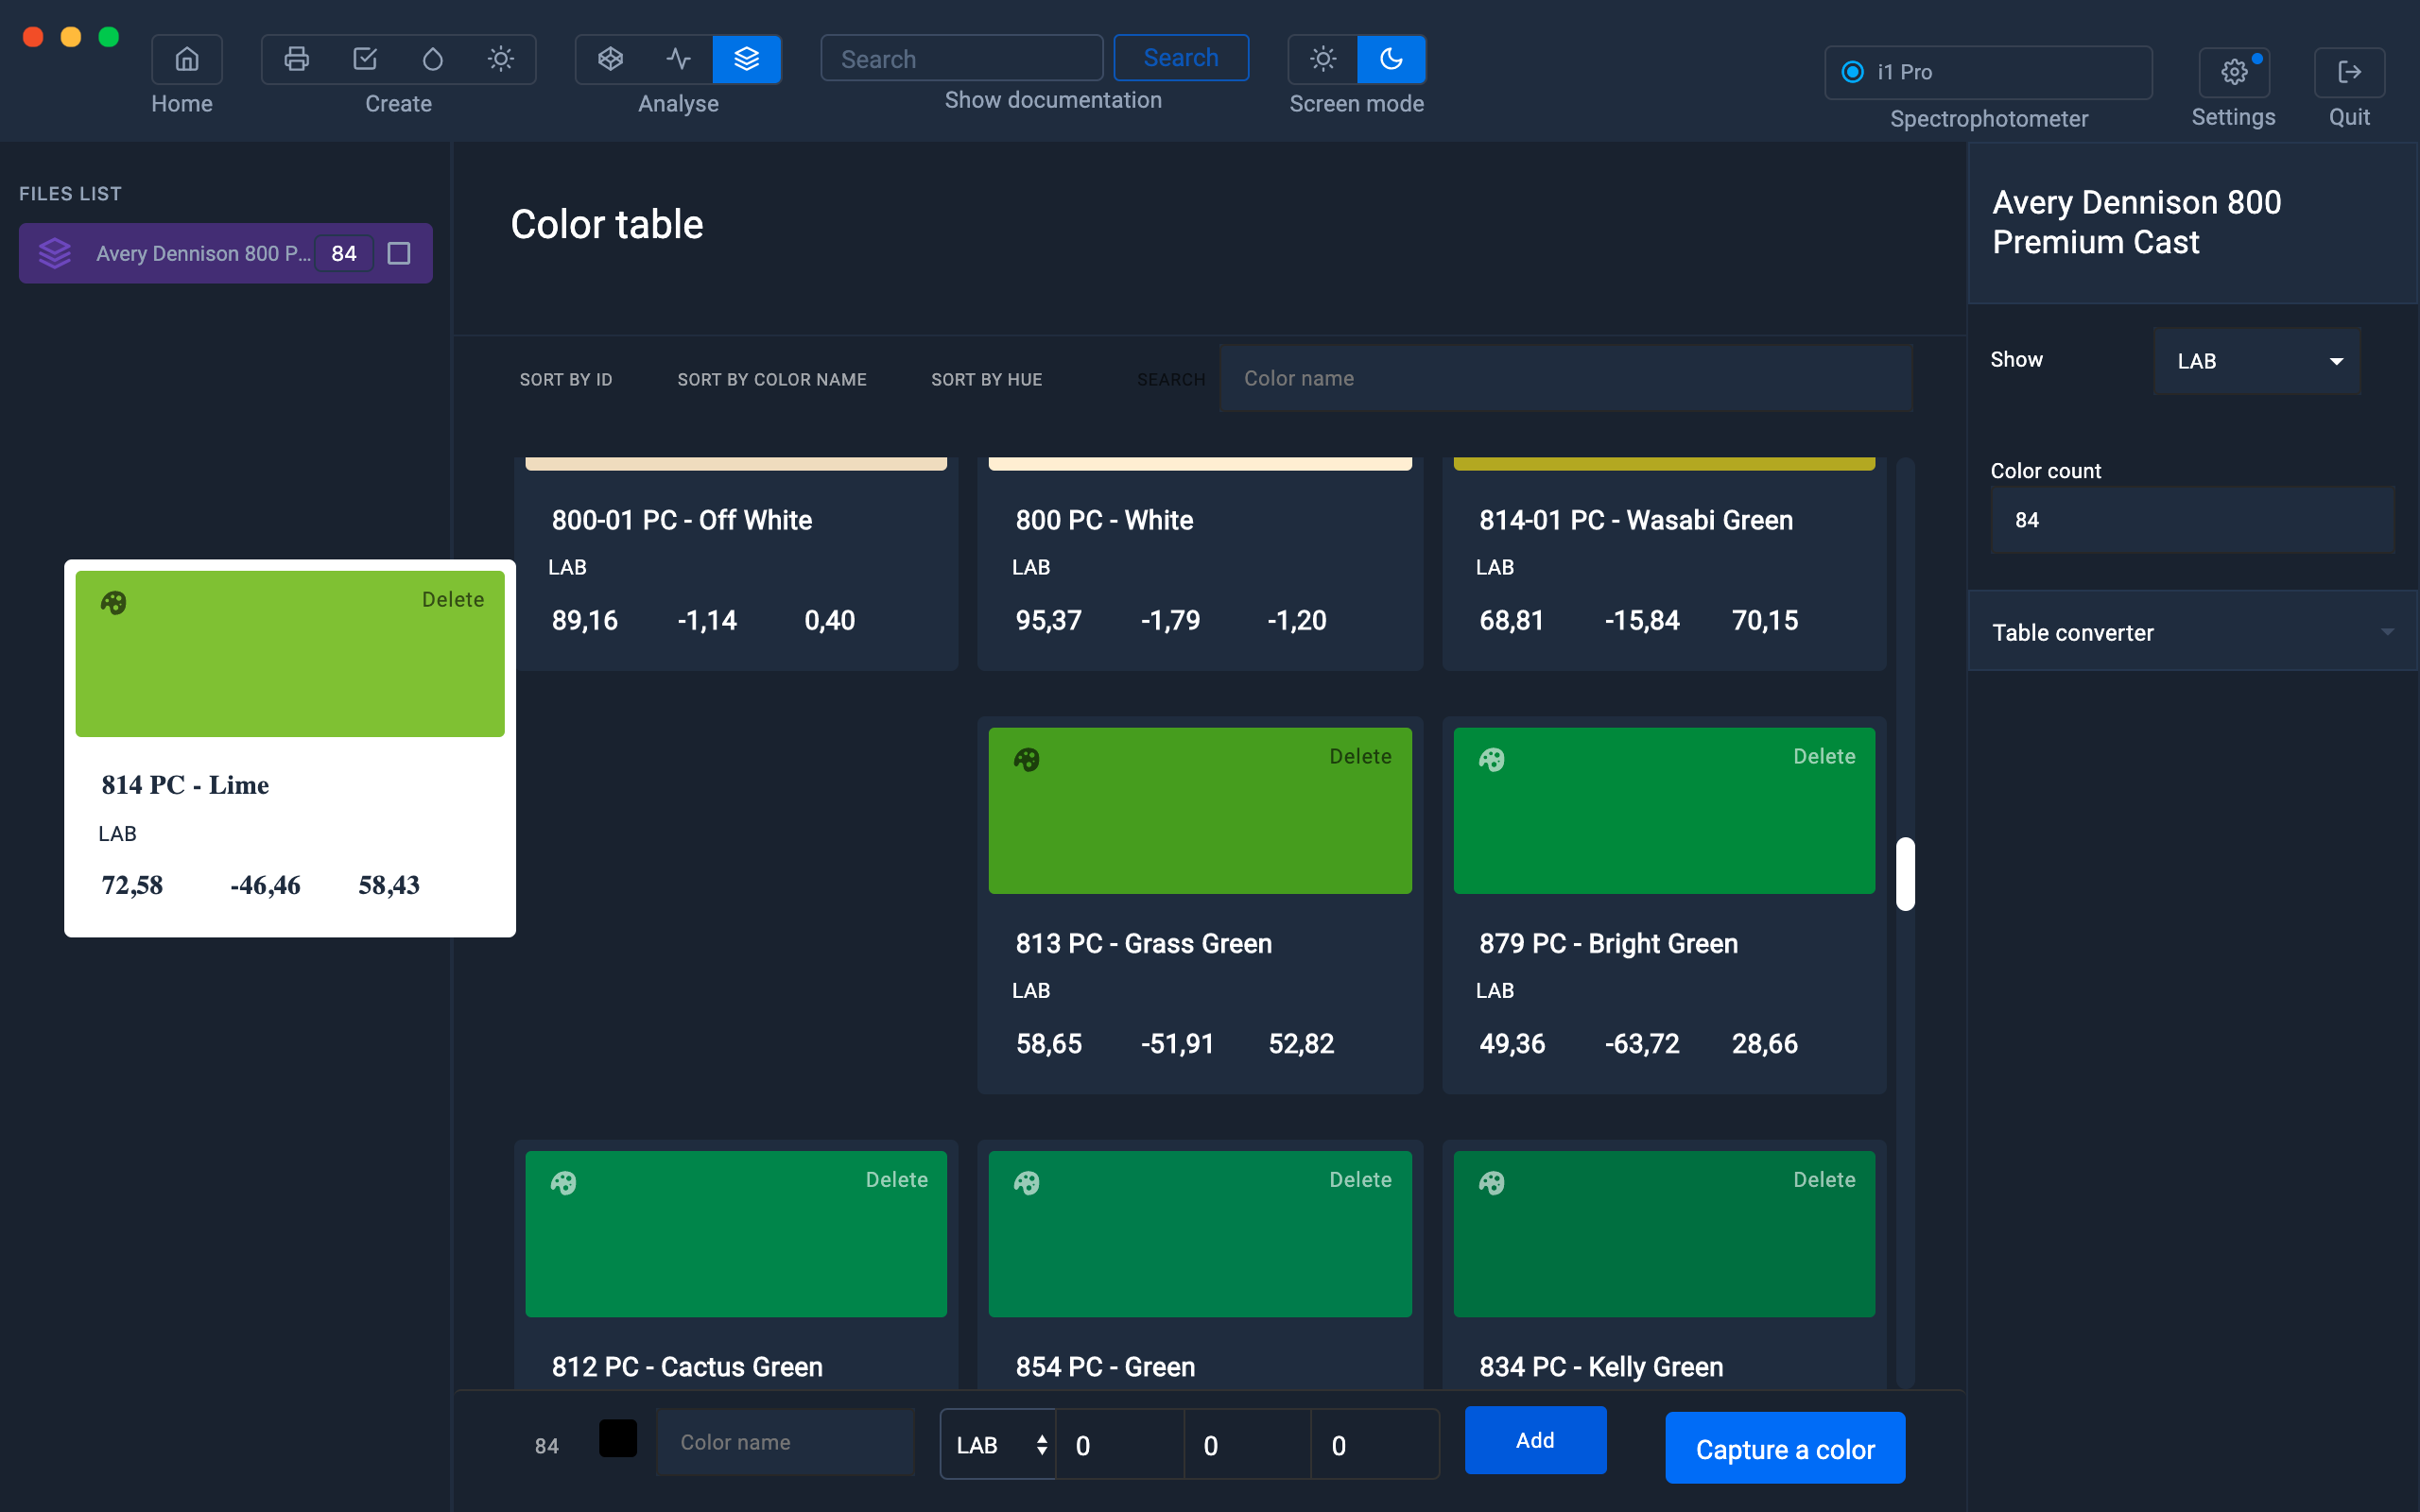
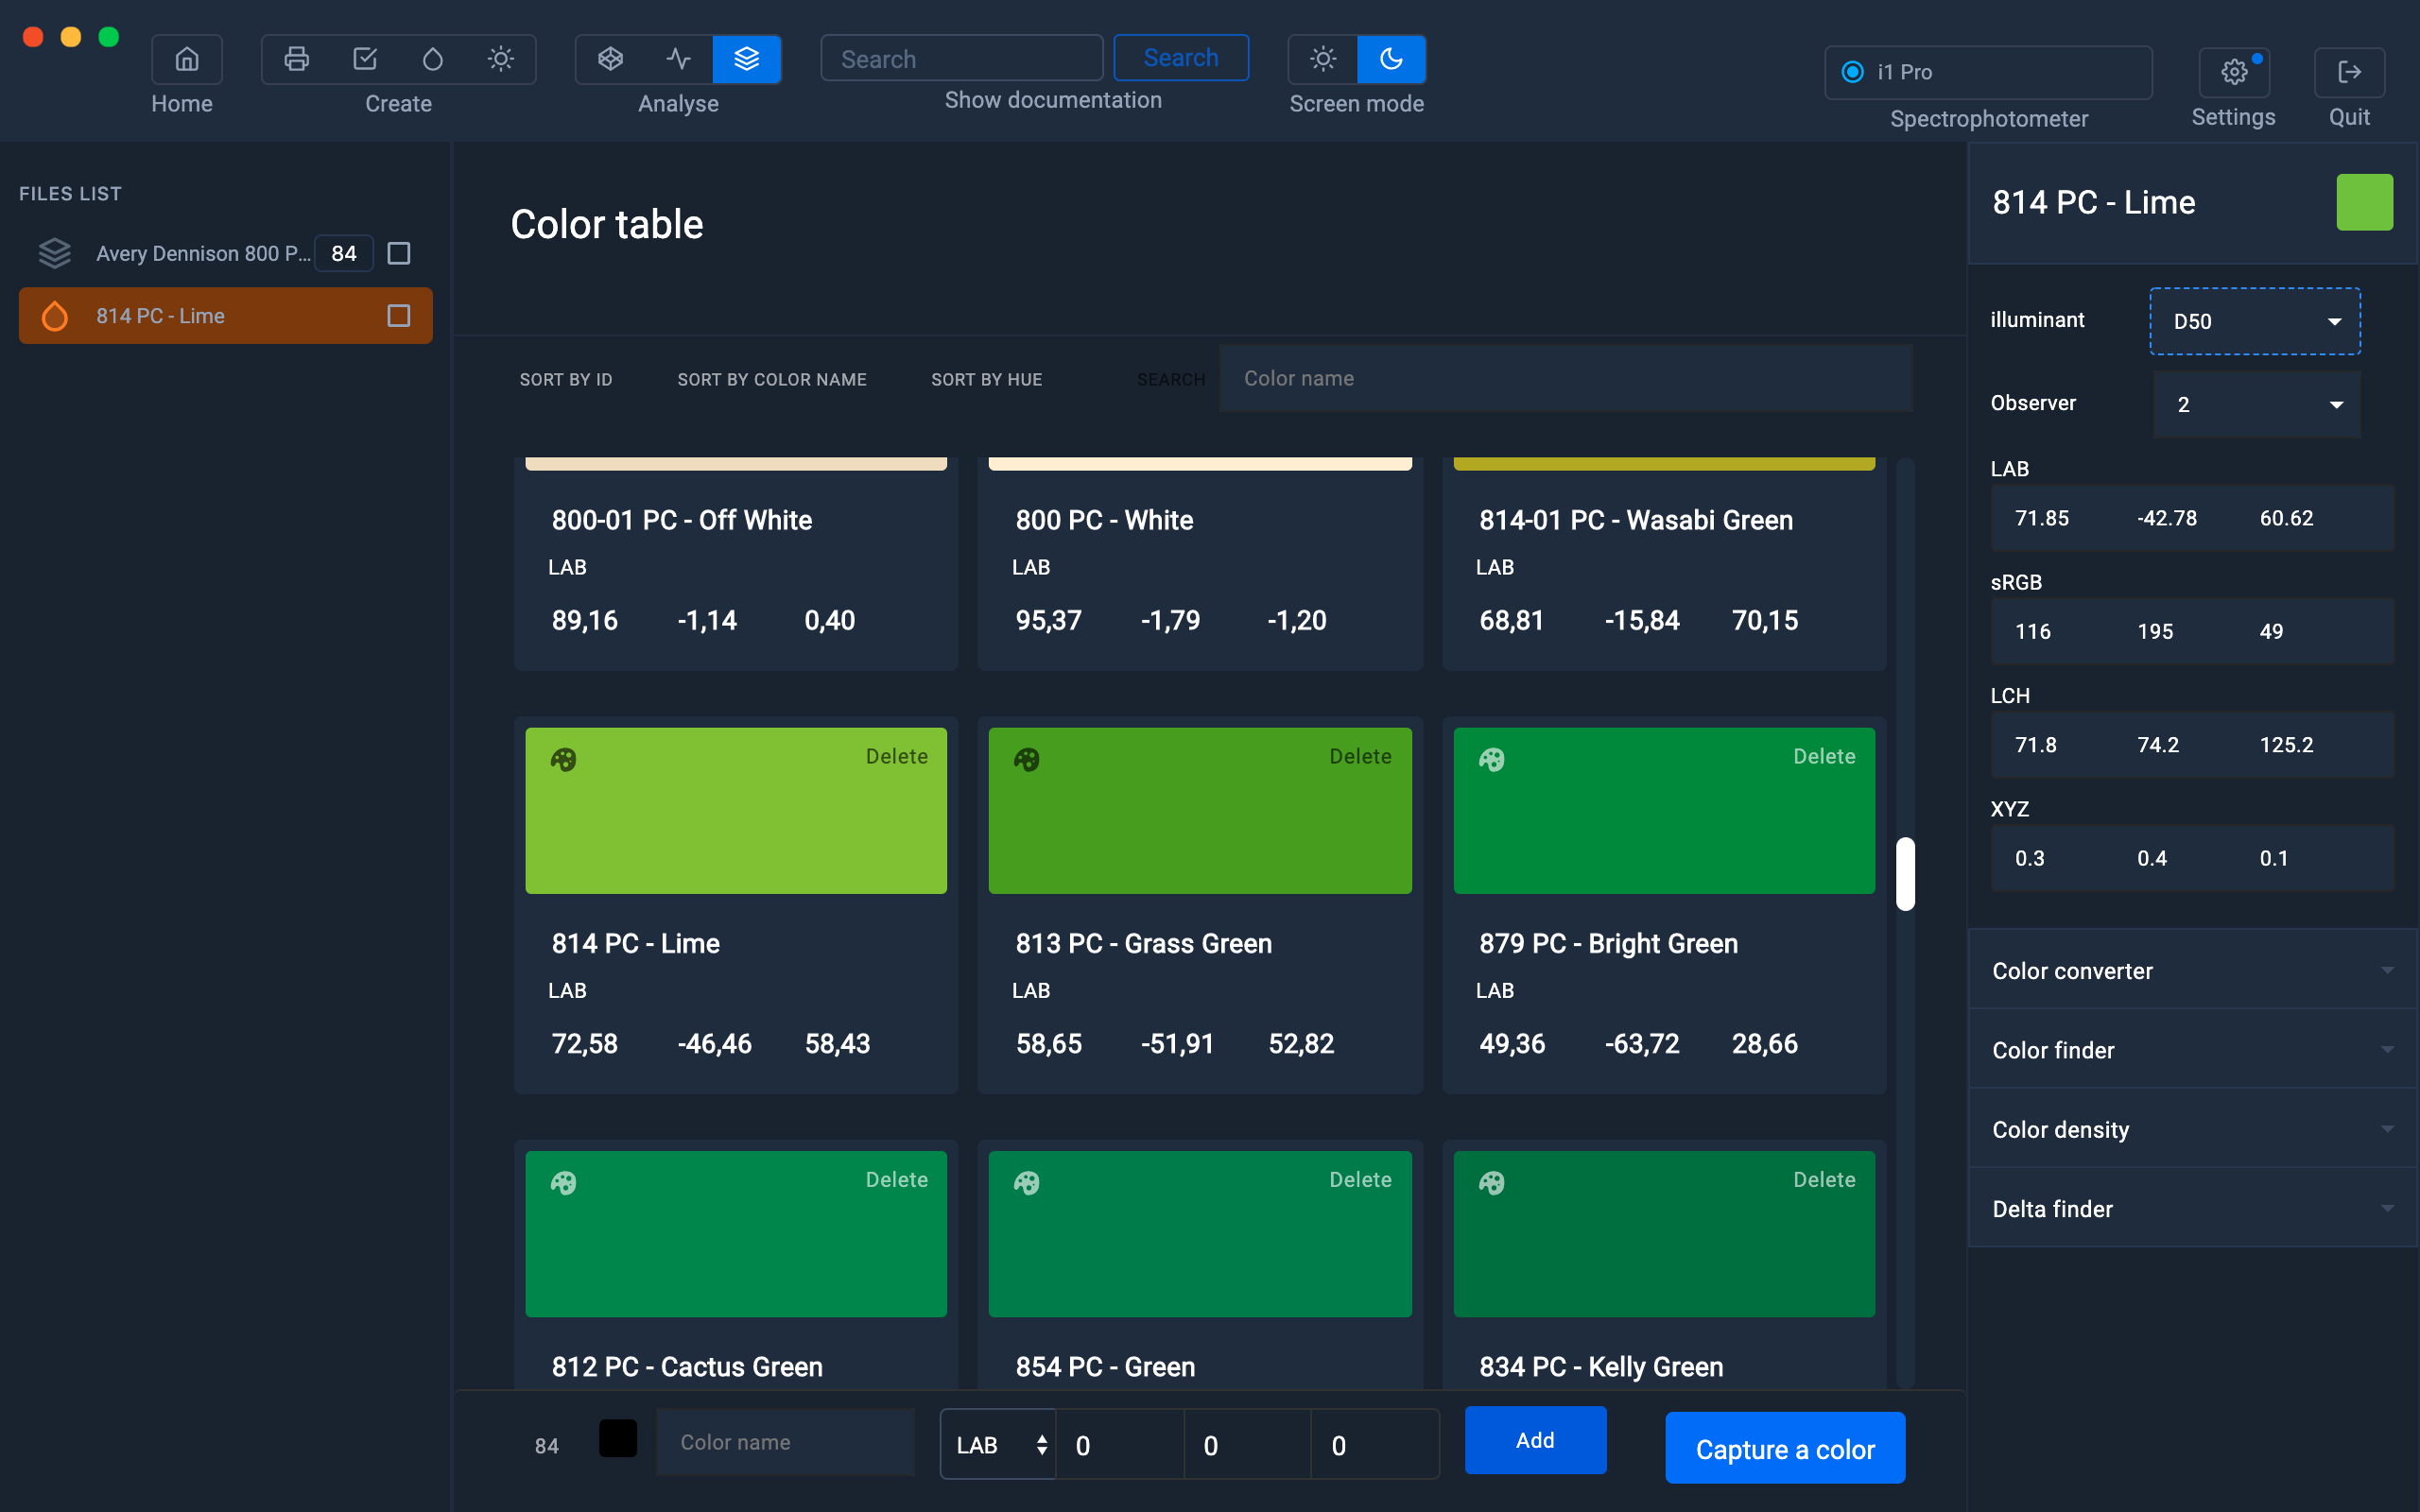
The colors measured with a spectrophotometer contain the spectral values.
These are recognizable by the pictogram representing a color palette, located at the top left of the rectangle representing the color.
Colors added manually by entering Lab values do not contain spectral data.
These are recognizable by the pictogram representing LAB located at the top left of the rectangle representing the color.

The new color will be added to the color table with the LAB pictogram.
Edit the name and values of a color
To change the Lab name or values, simply select and edit its name or value.
Only the colors which do not contain the spectral values can be modified (LAB pictogram)
To modify the other colors (Color palette pictogram), they must be recreated manually using the Lab values of the original color.
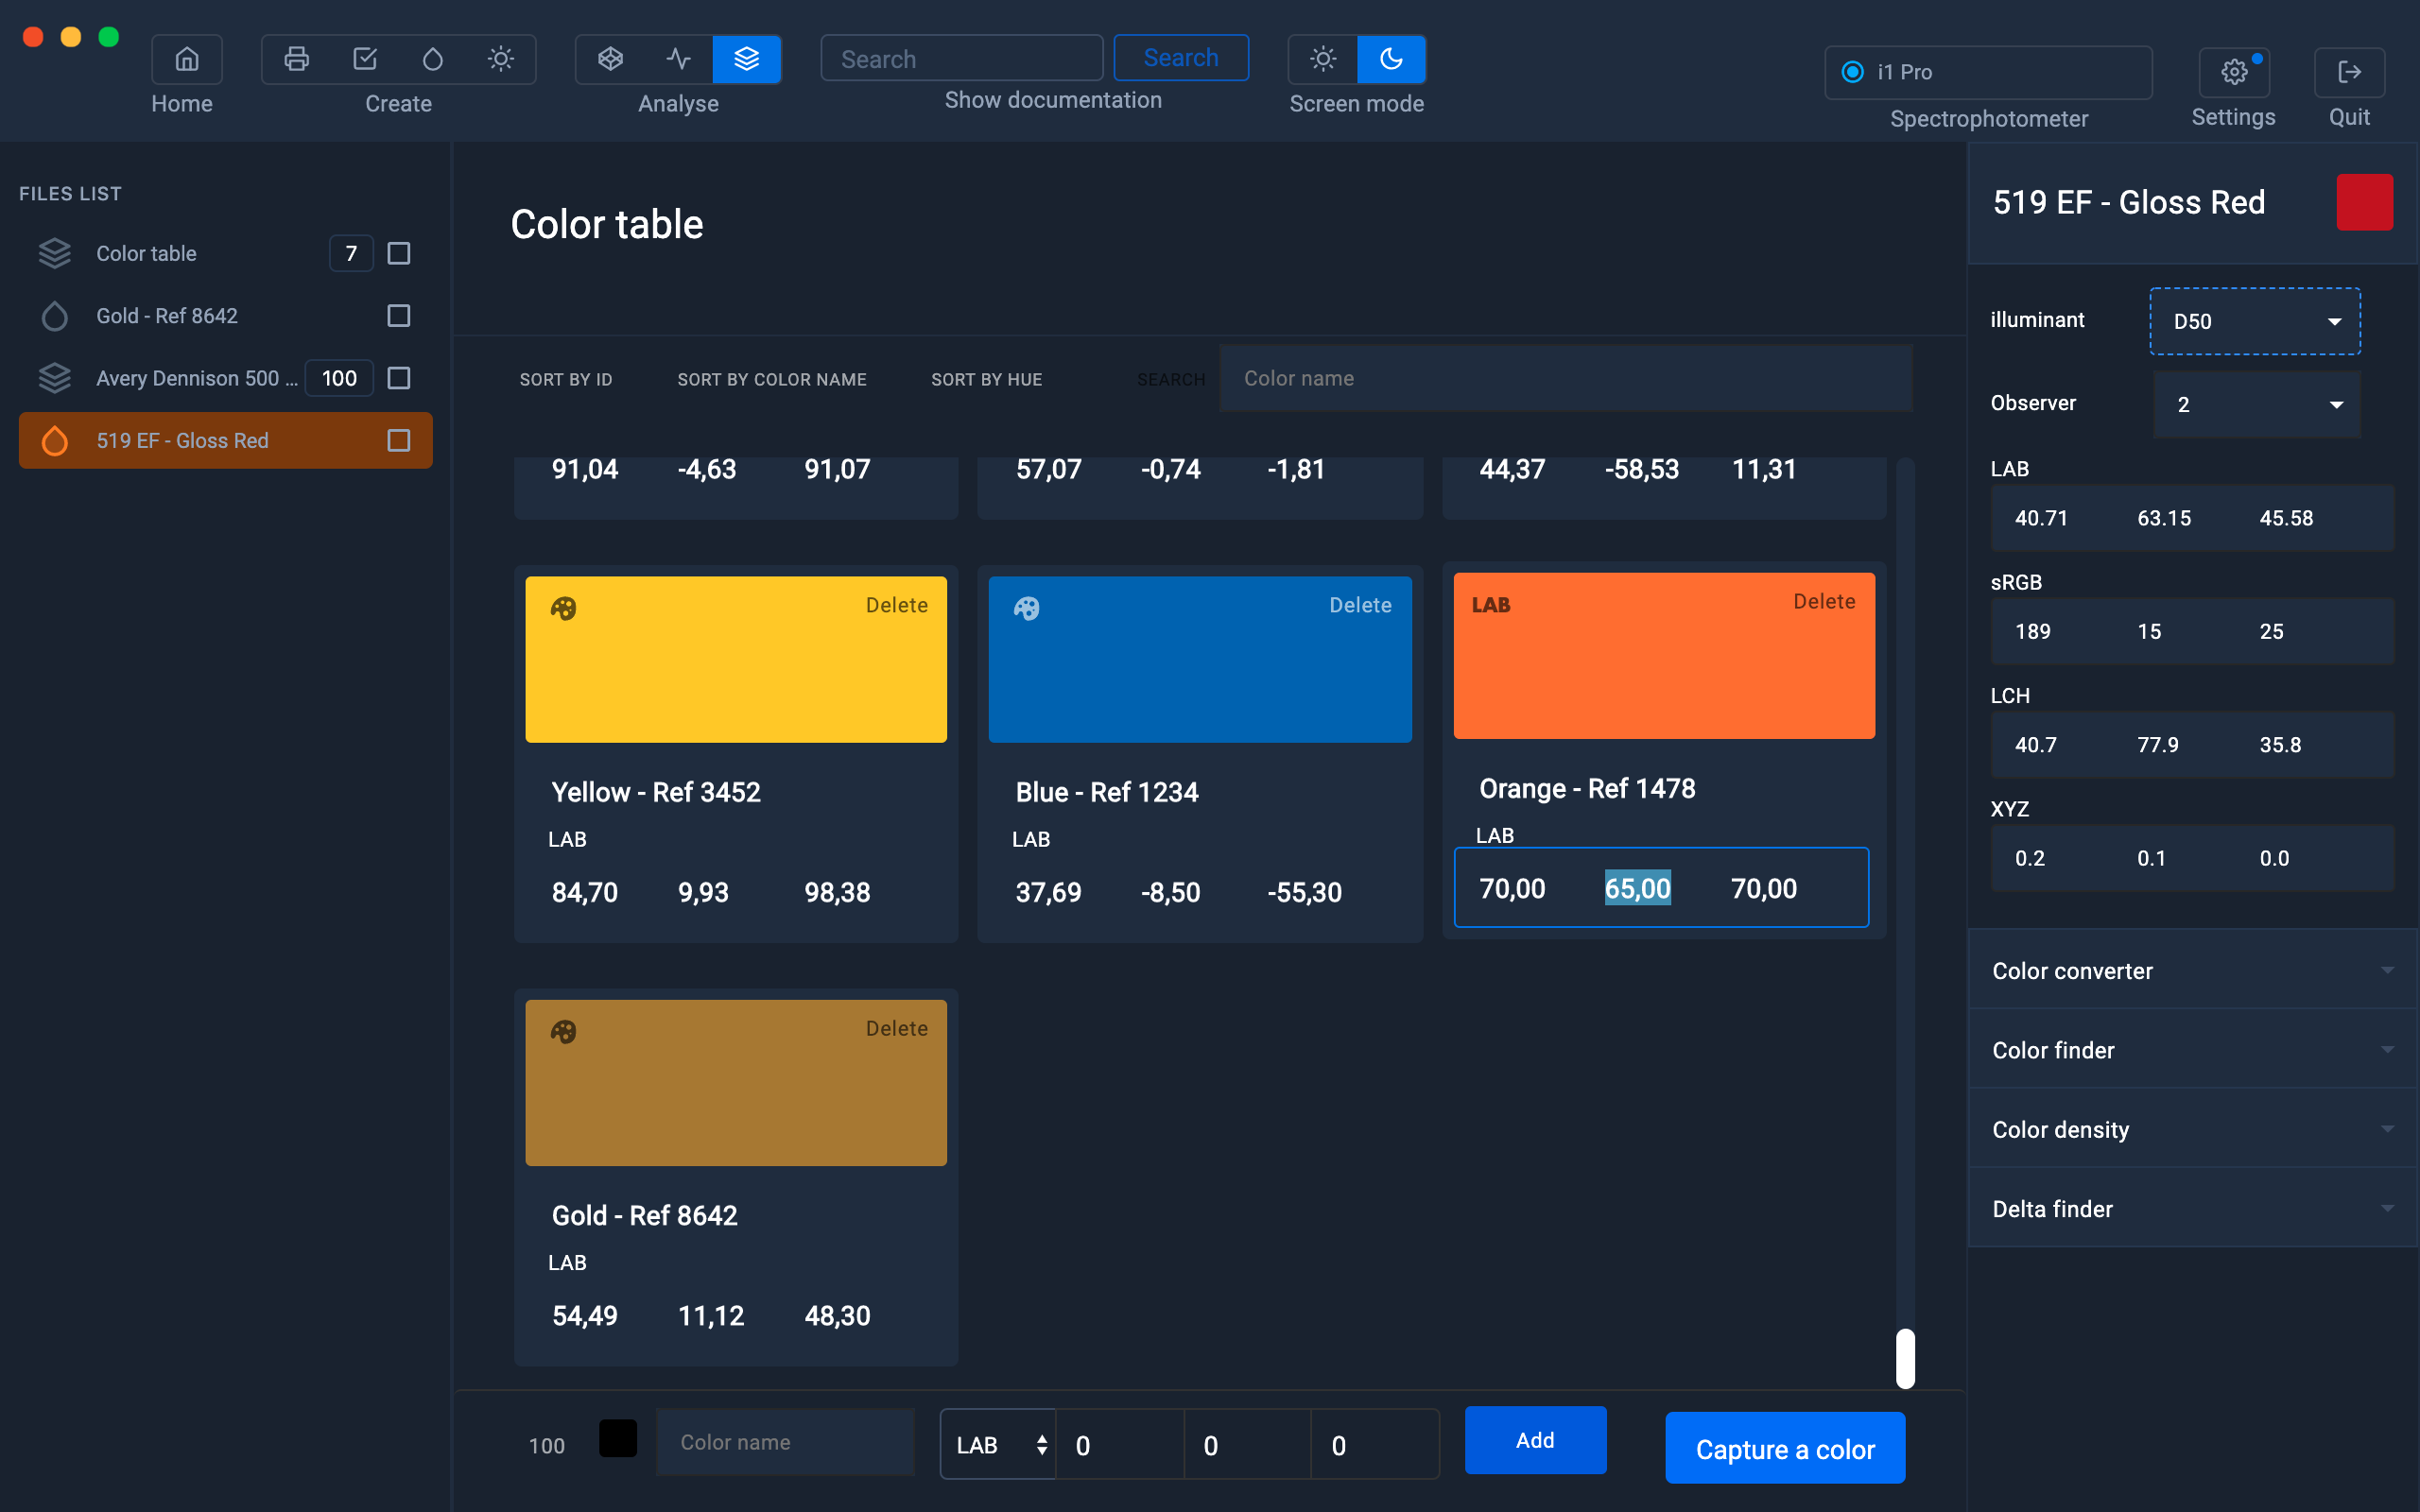
Capture a color with "Add a color" then add it to the color table
It is also possible to drag and drop a measured color with the "Add a color" function.
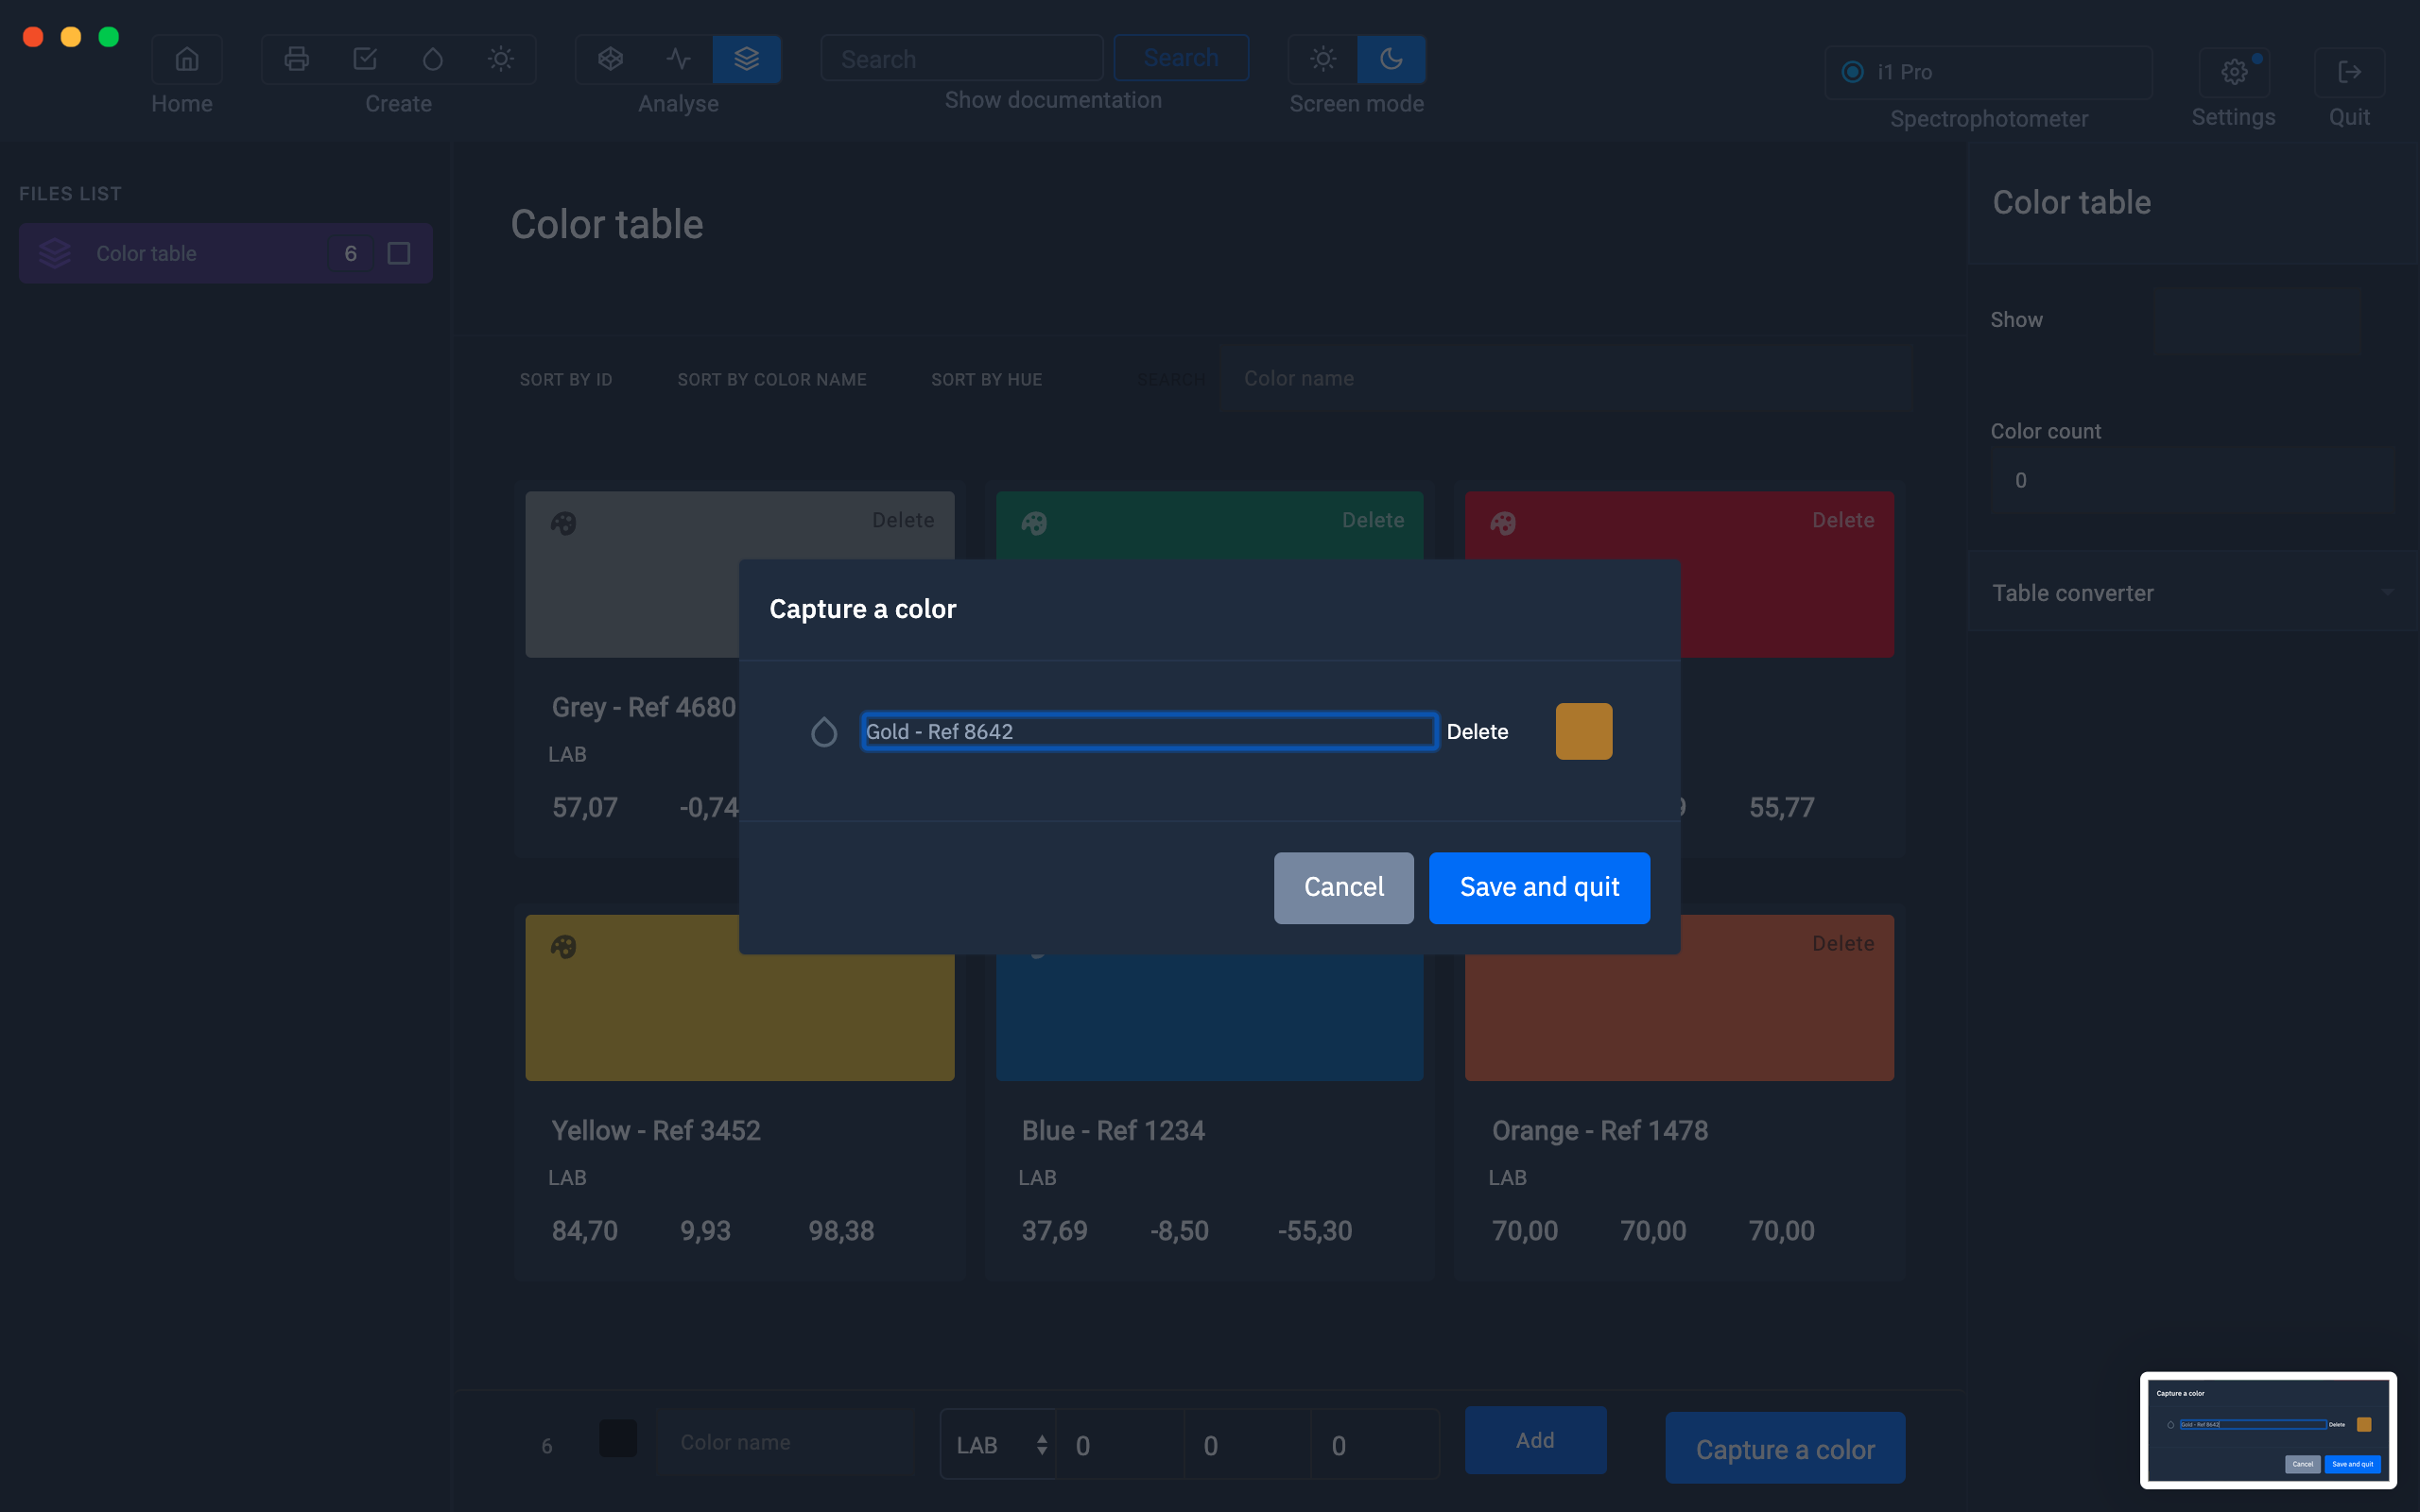
To add the color Gold to the color table, just drag it into the table.

Sort table colors
With Coraye, it is possible to sort the colors of your tables.
Sorting is carried out:
- By name
- By shade
- By Delta E
To validate the change, click on the " Re-order the patches " button

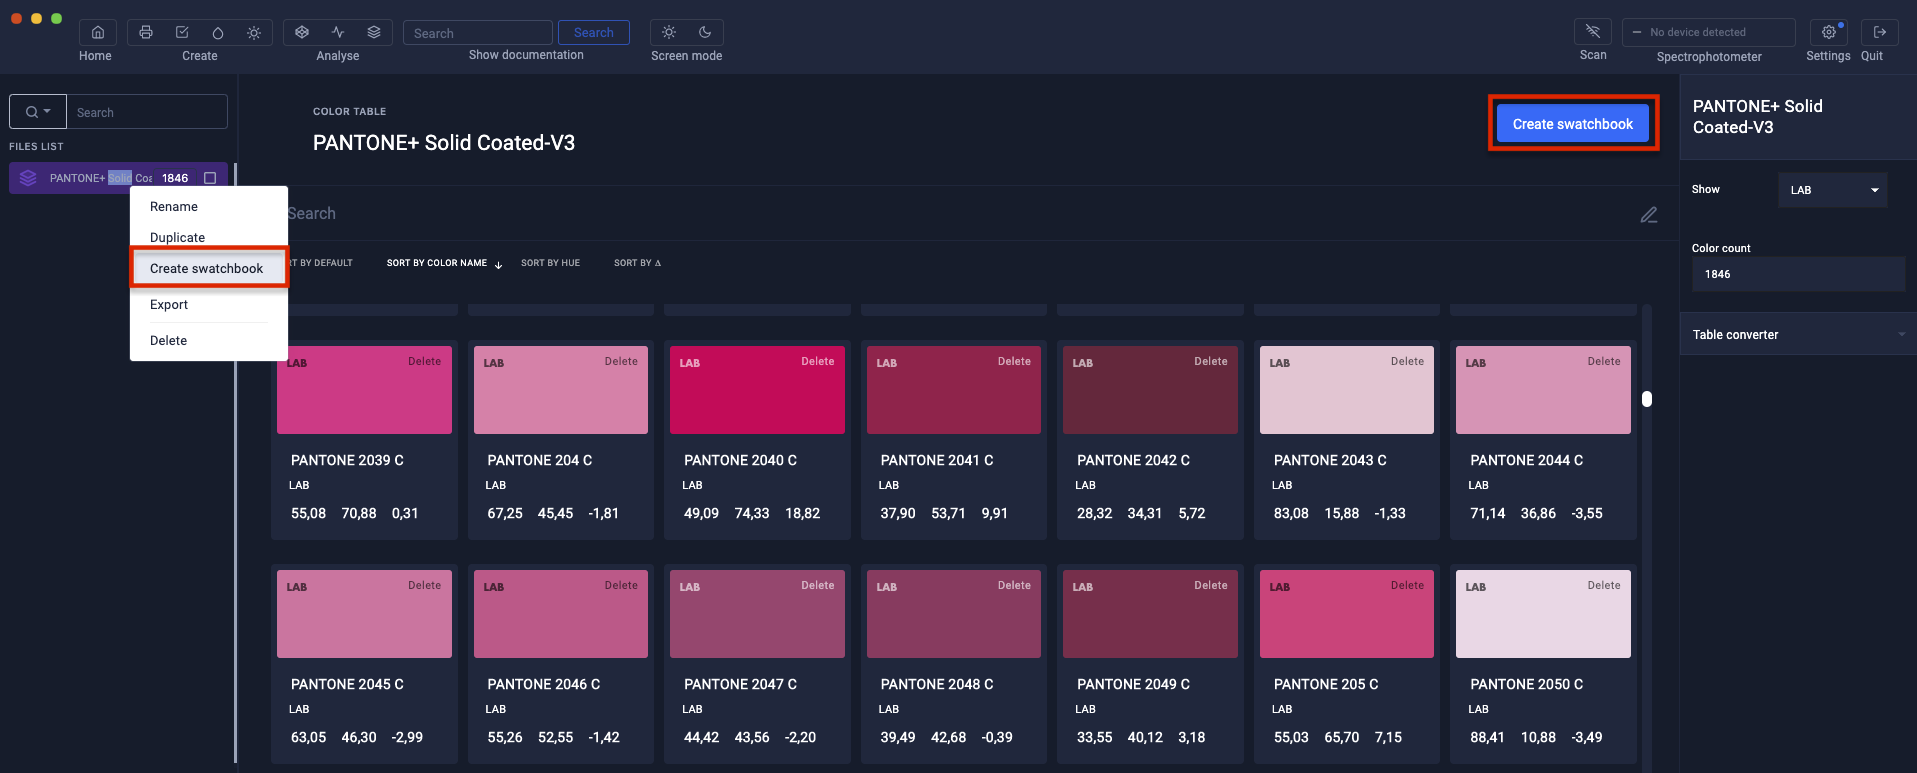
Creation of a printable color chart
From the color table, it is possible to create a printable and customizable color chart in pdf format, including the index, a first page and crop marks.
The window for creating the printable color chart appears
If you have sorted the colors beforehand, the swatch will be created with the sorted colors.
The index will take the sorting into account.
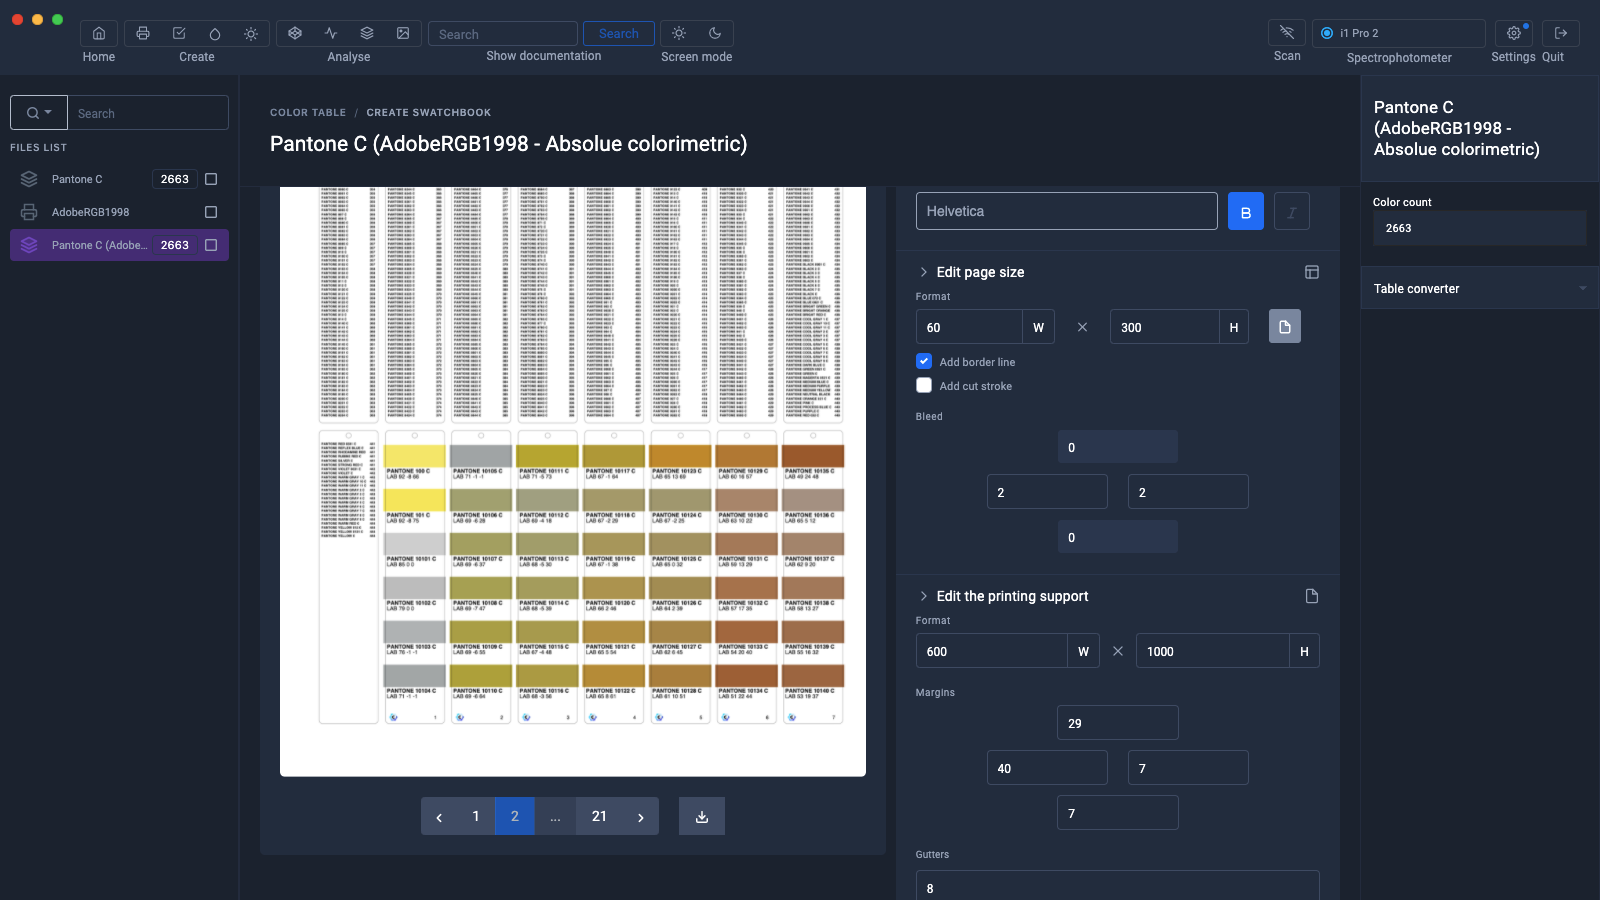
If the table contains the RGB or CMYK values of the colors, these will appear when exporting the RGB or CMYK color chart.
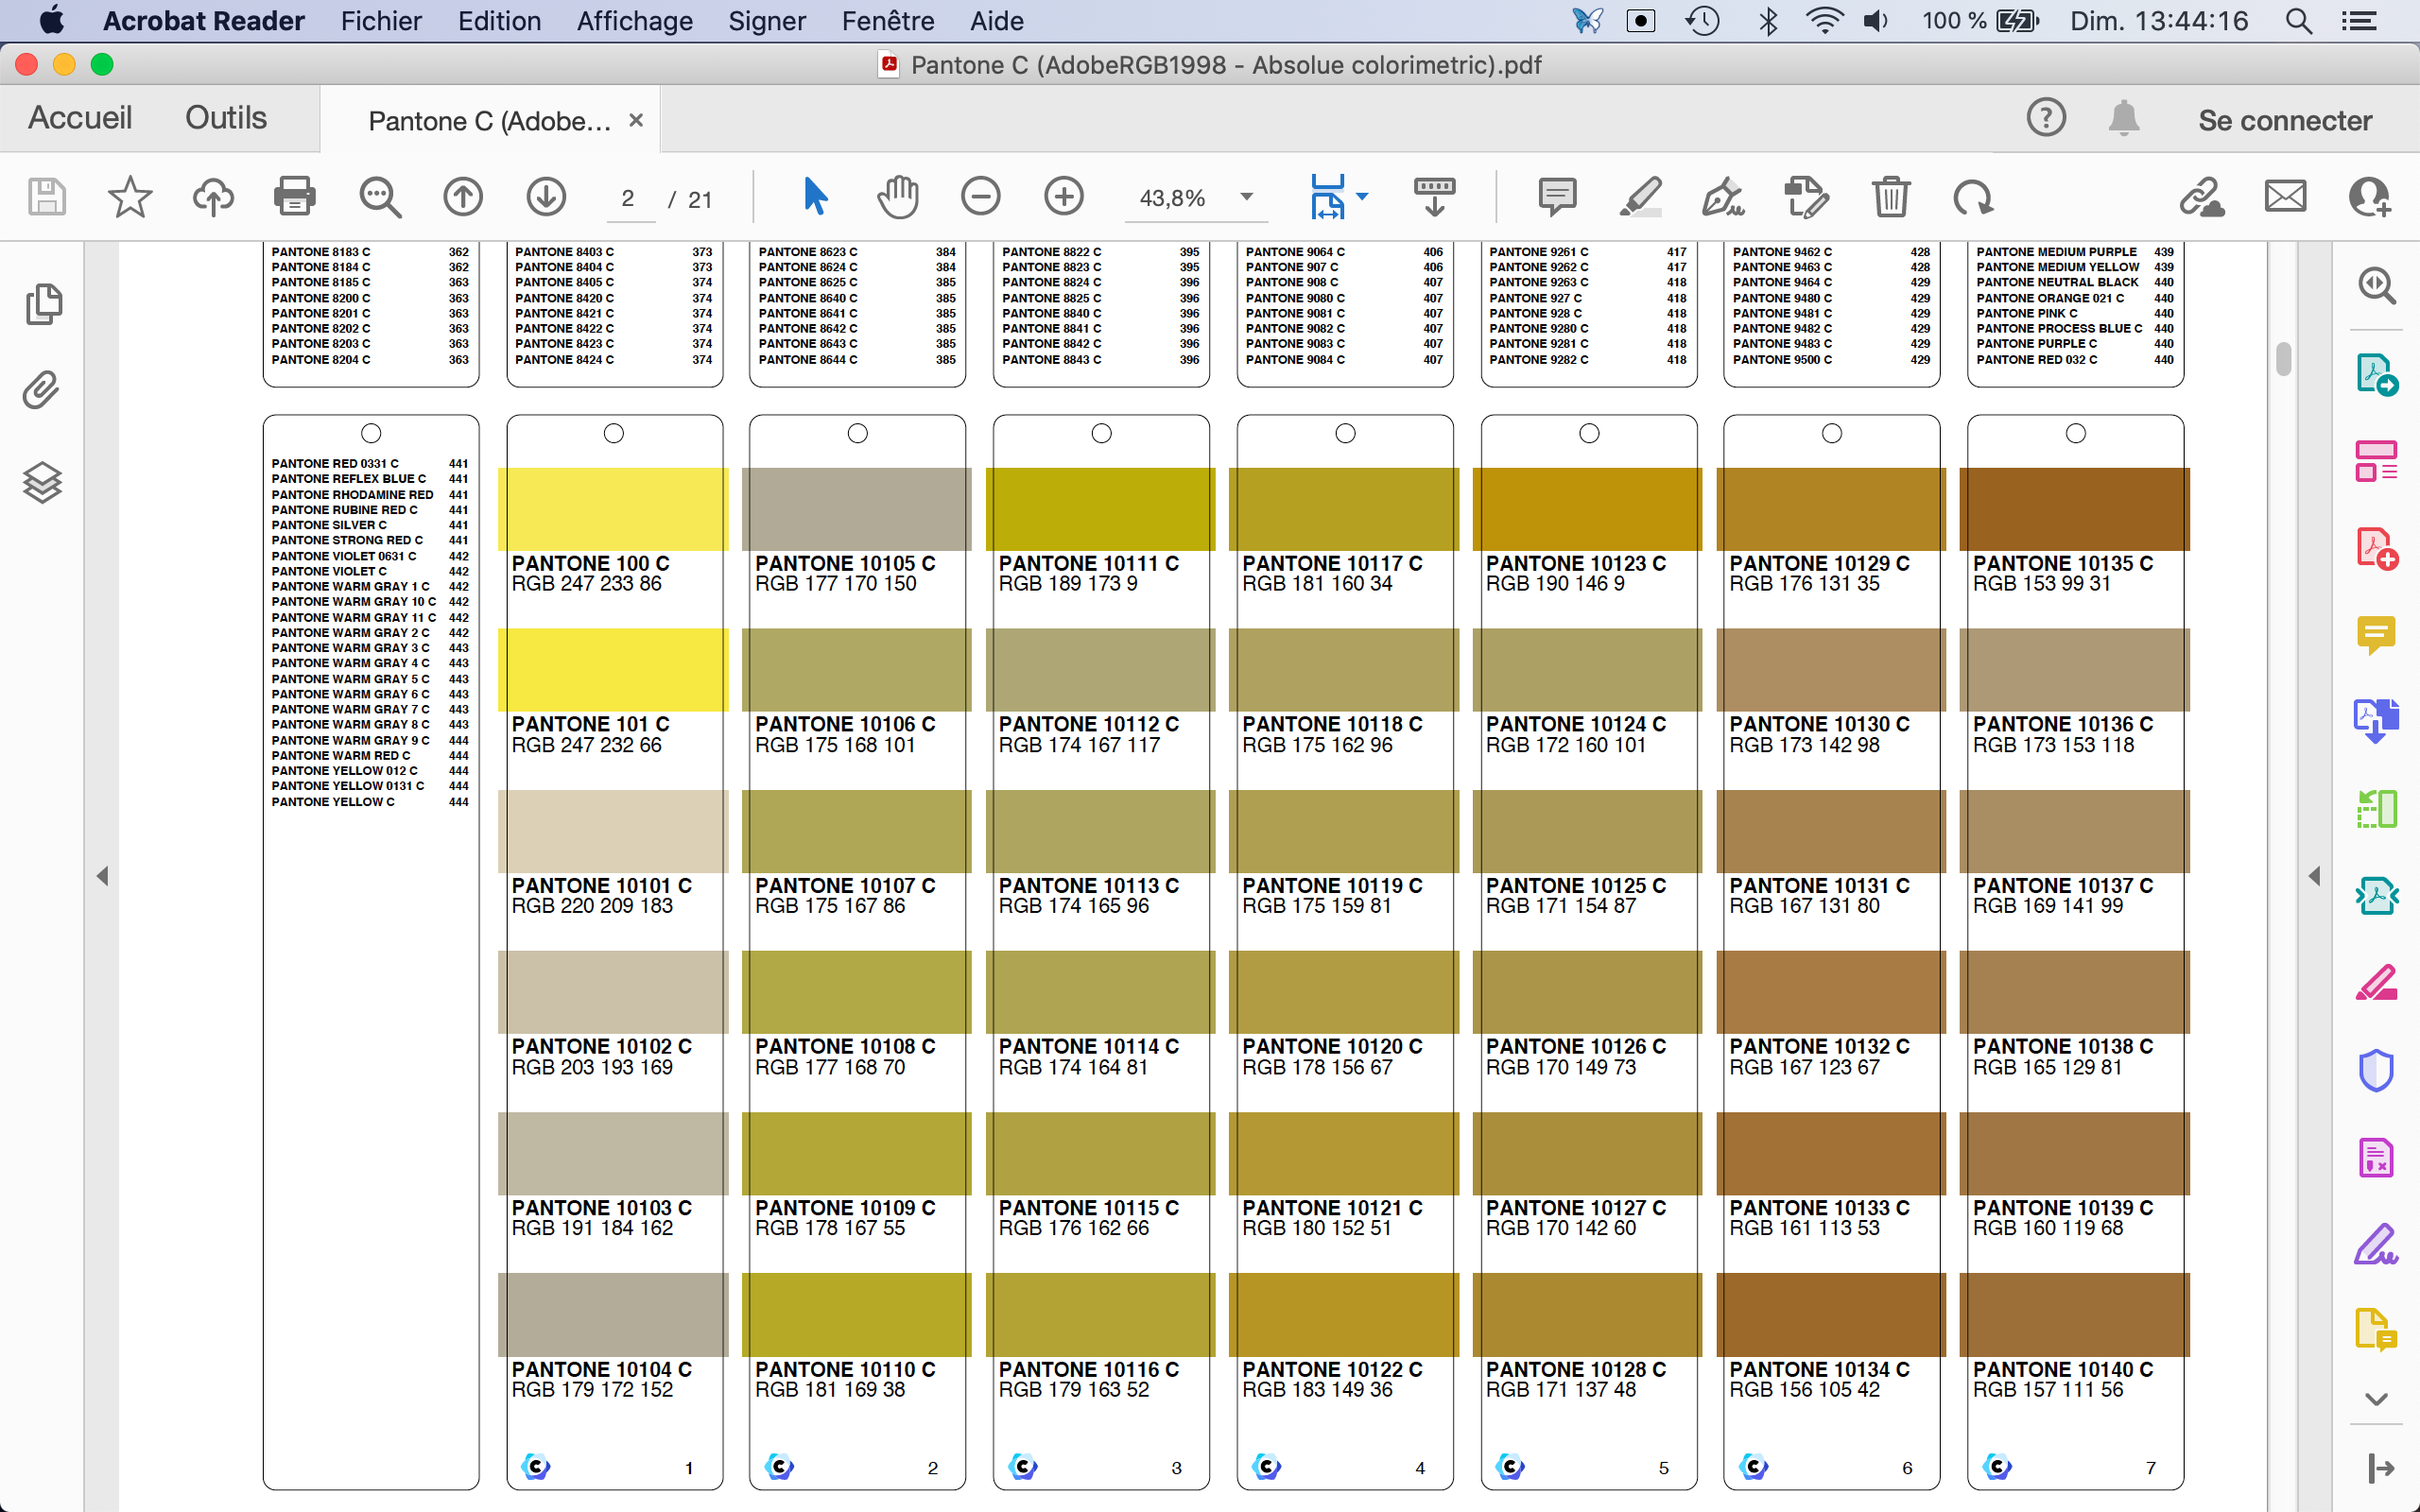
For more details on creating the printable color chart, you can refer to the chapter "Creating a color chart"
For more information, see the chapter: Create a printable color chart
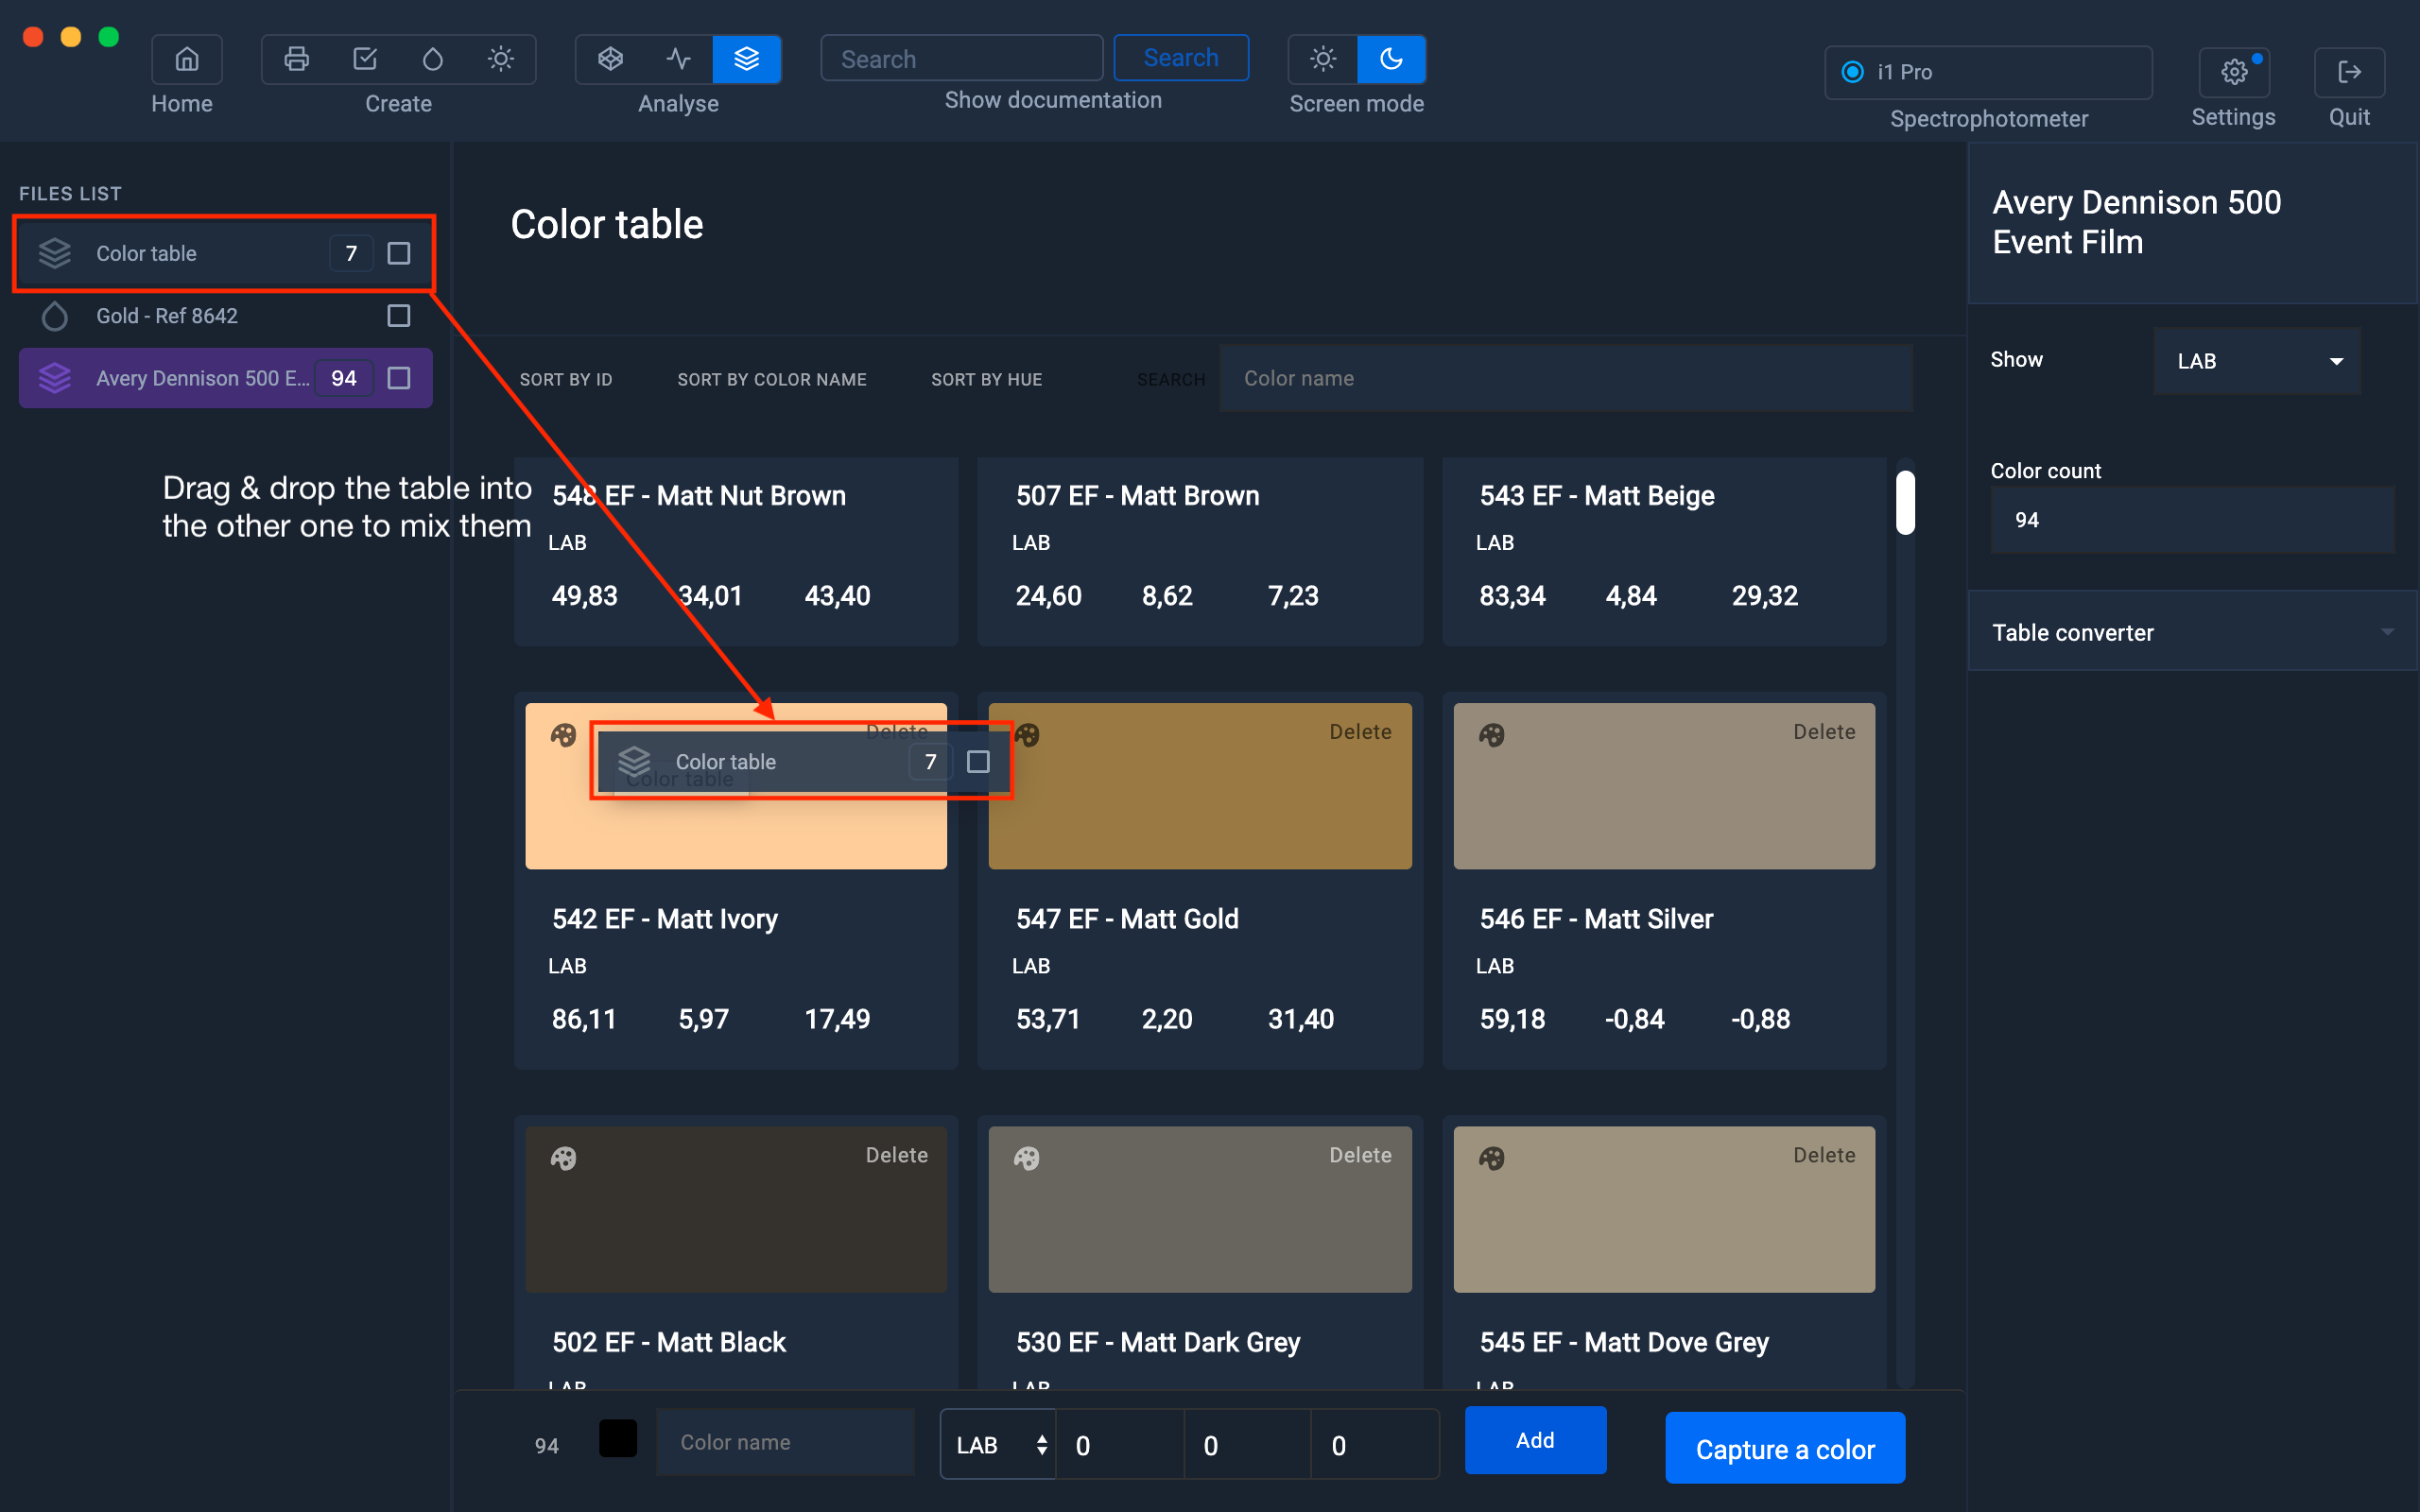
Merge multiple tables
The advantage of being able to merge several tables is to update a main color table for example.
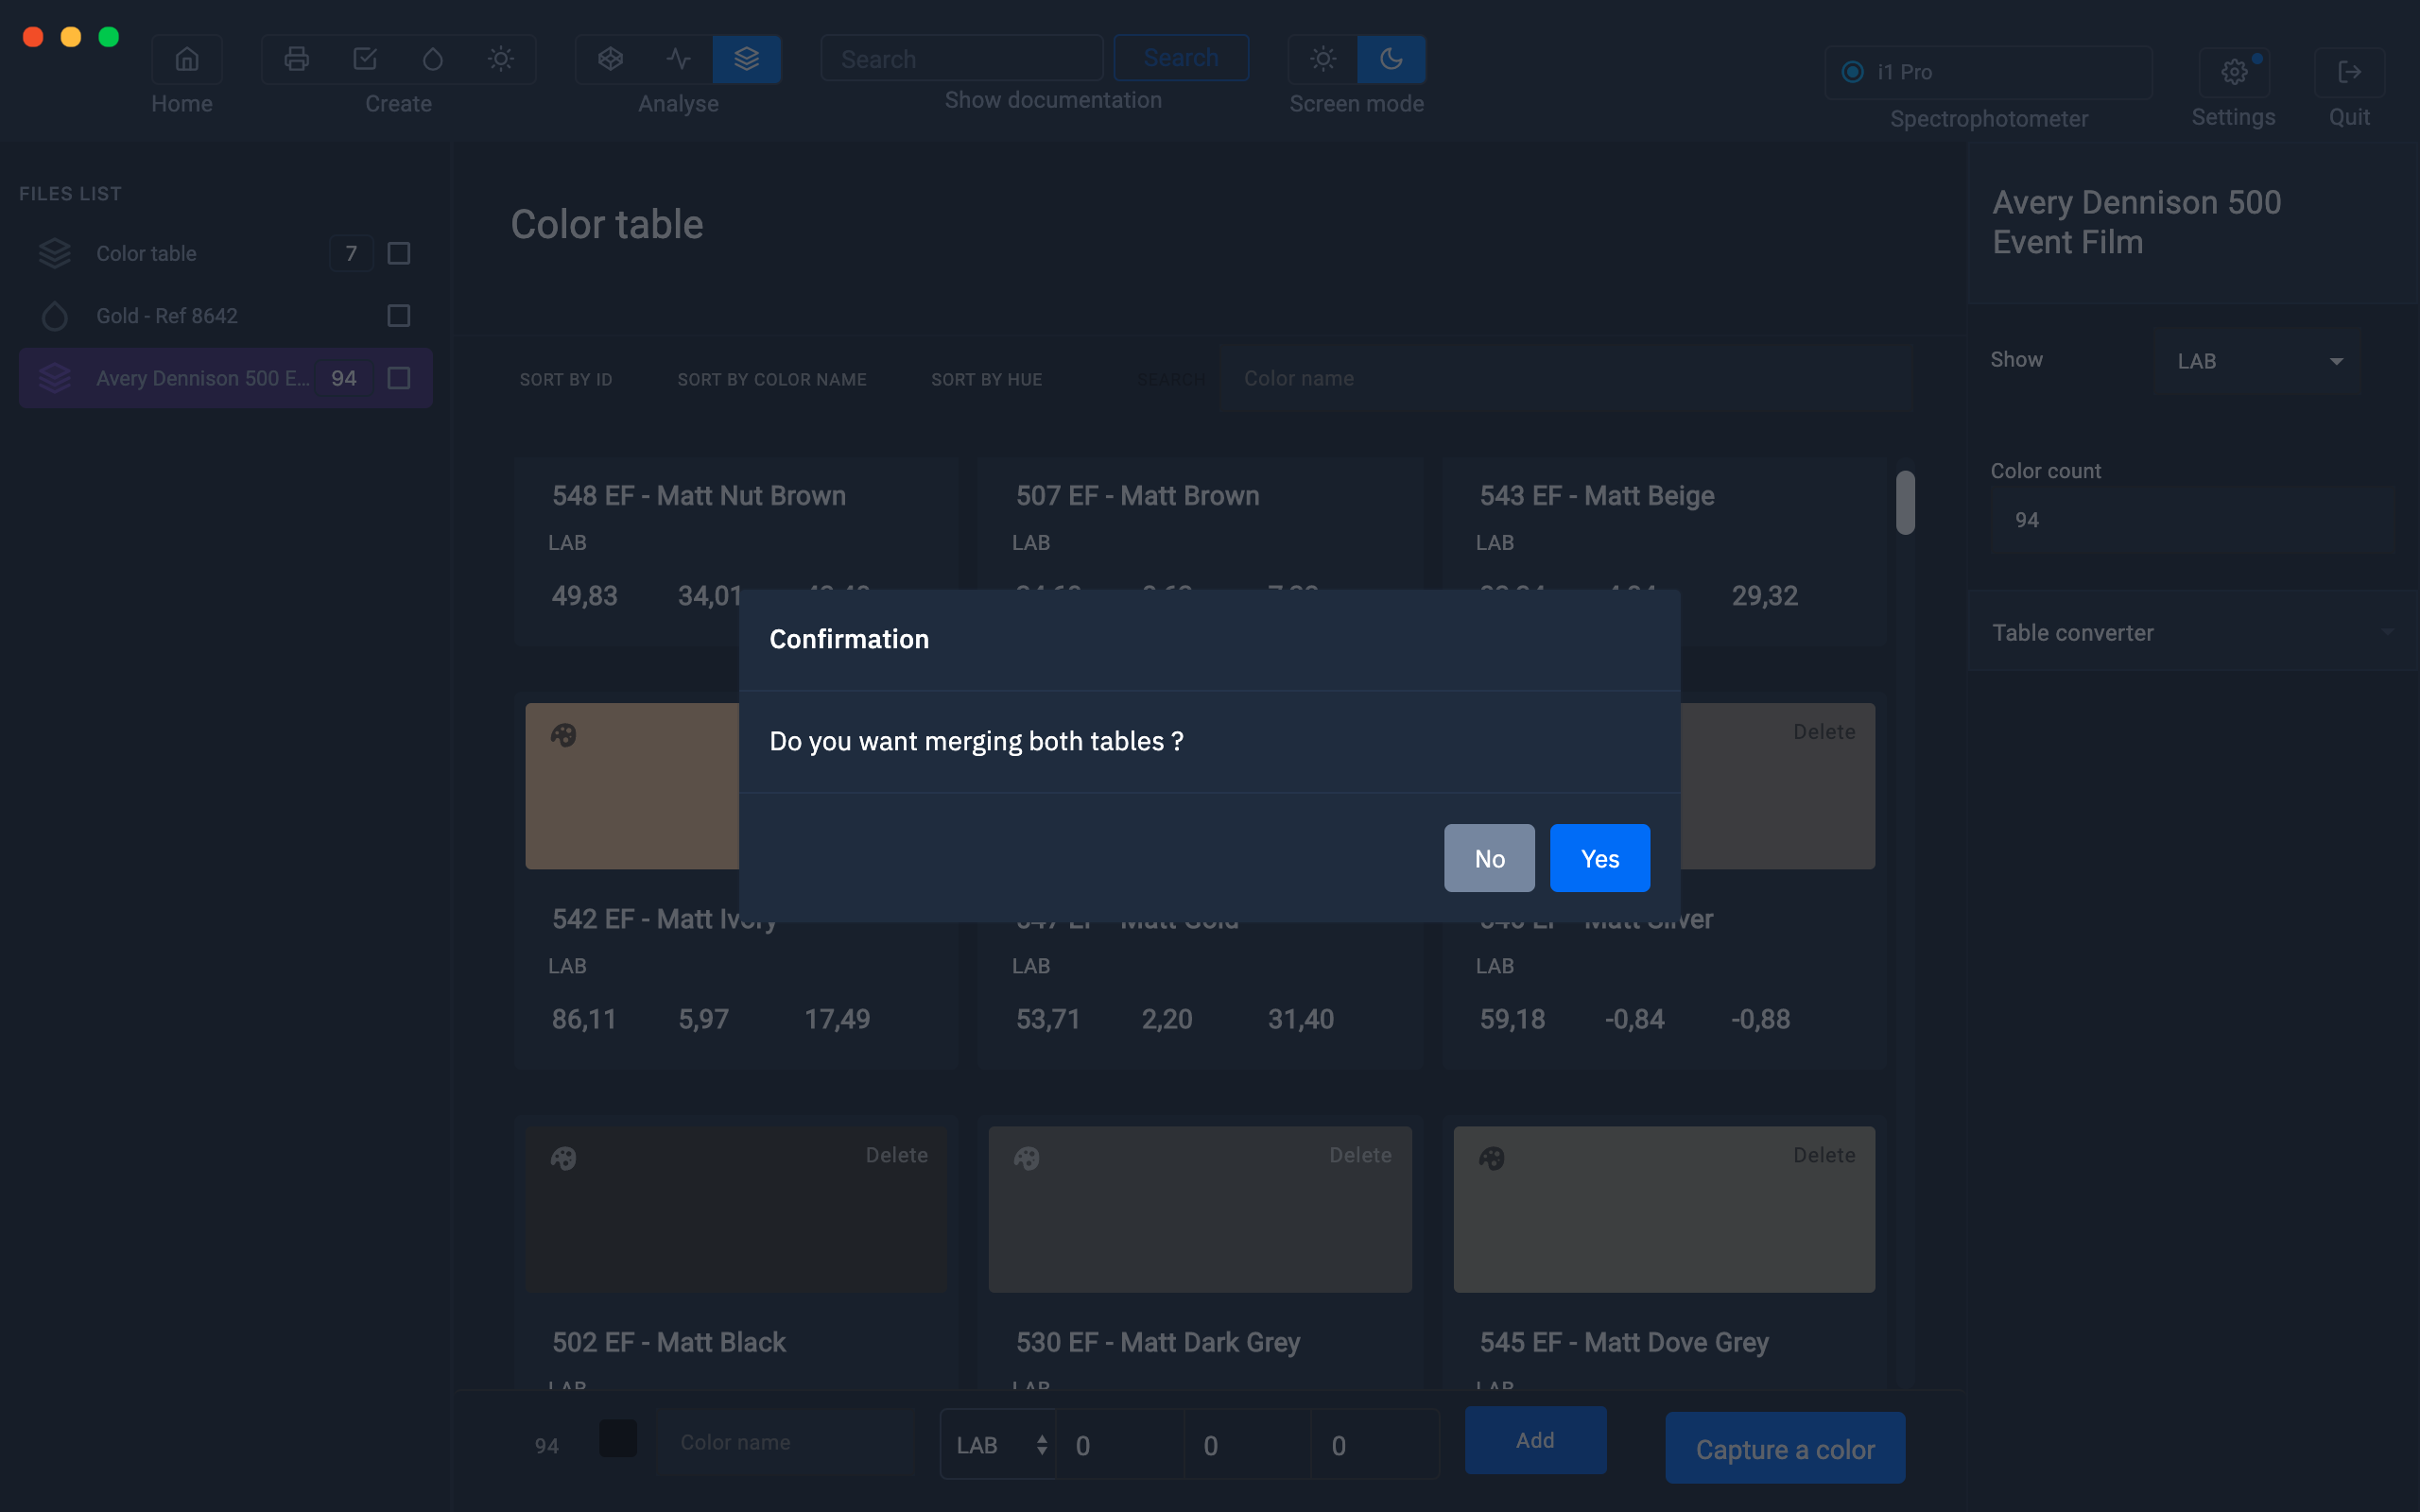
To avoid any errors, a notification will ask you to confirm the merger of the two tables.
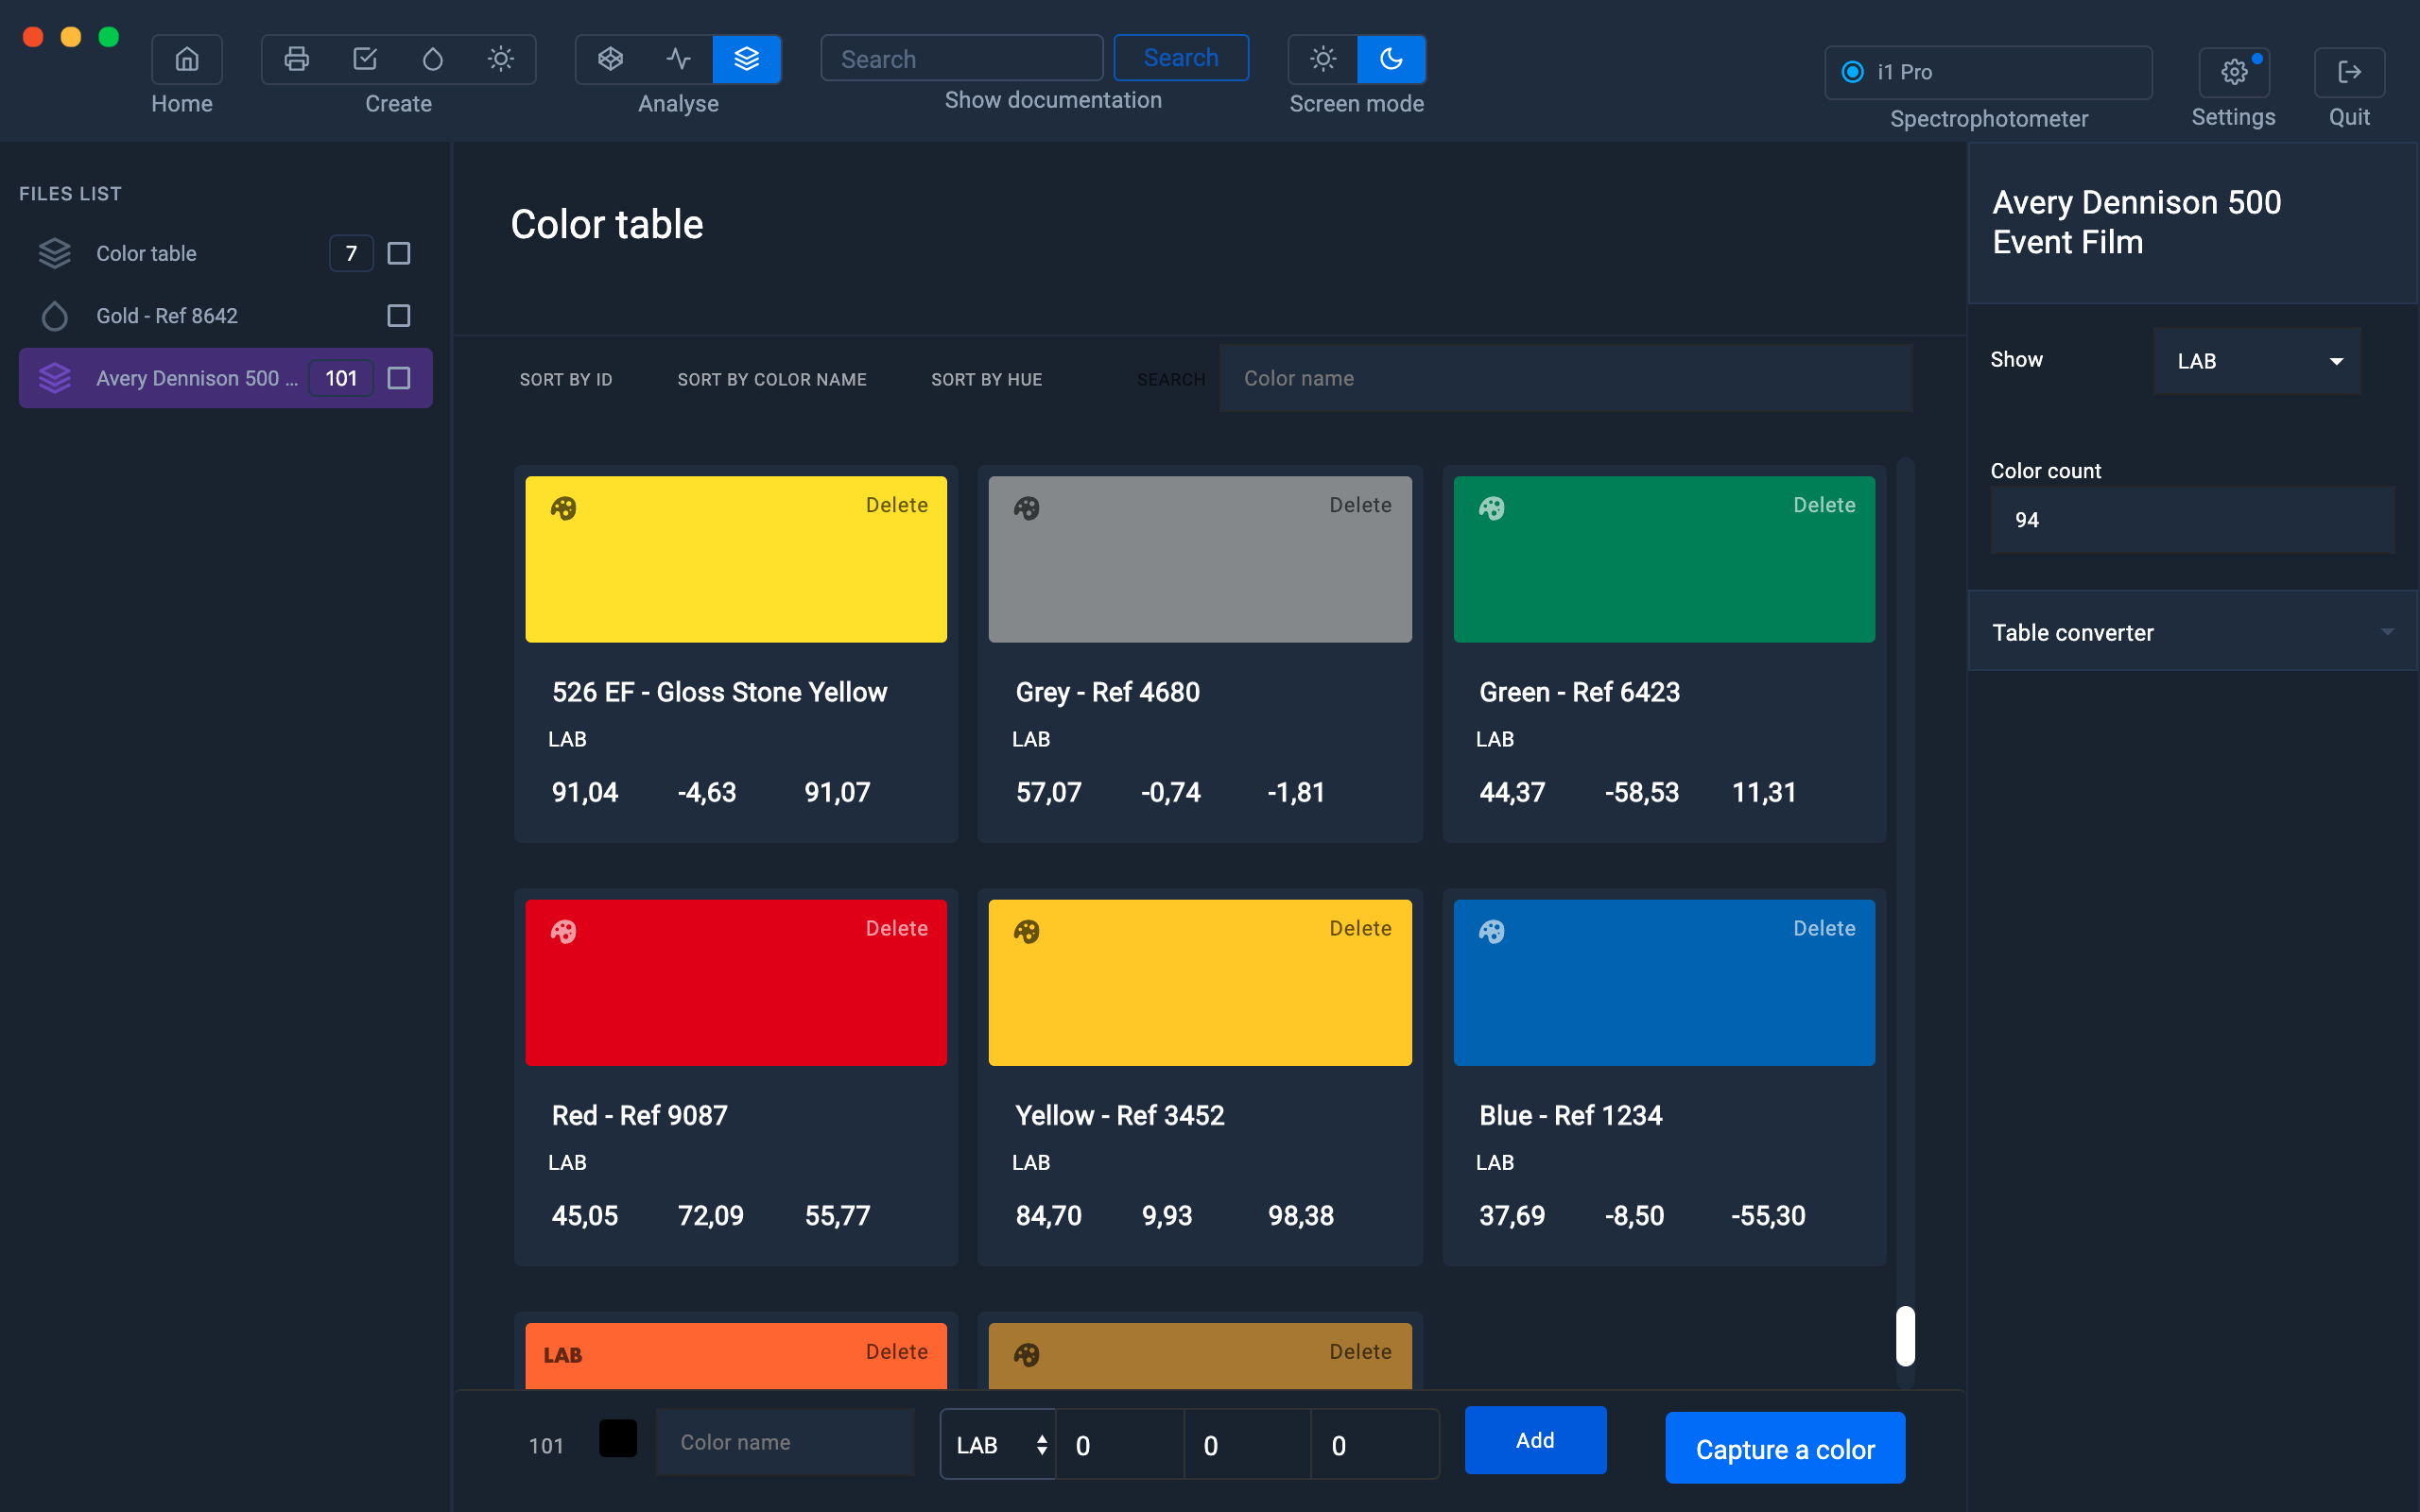
The main table (Avery Dennison® in our example) is enriched with the 7 values of the "Color table" (94 + 7 = 101 colors).
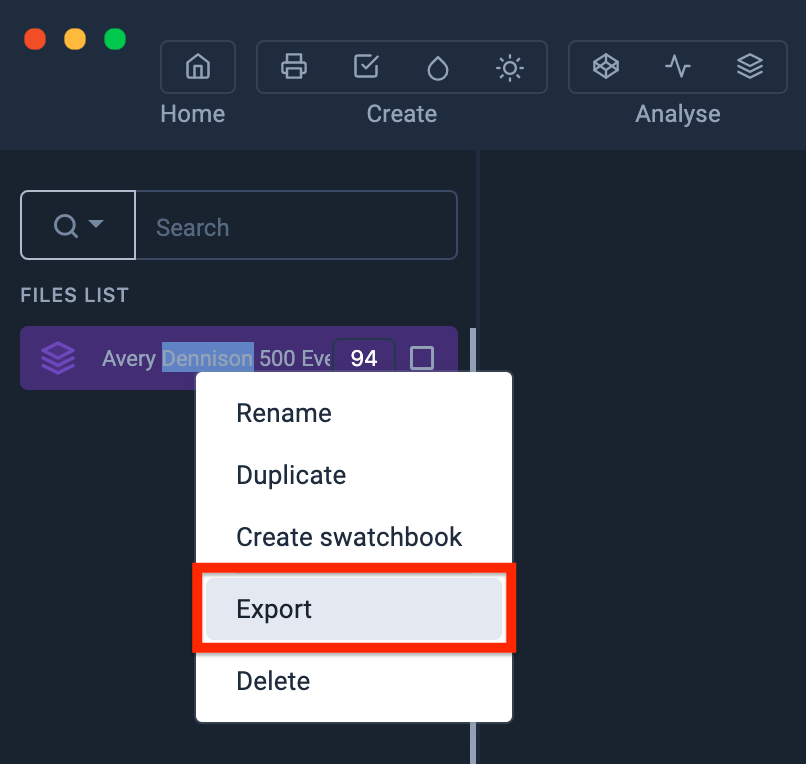
Export and convert a table
To export a table to different formats, right click on the relevant table.
You will also have the option to rename, duplicate or delete the file.
A window displaying the list of the different supported file formats appears.
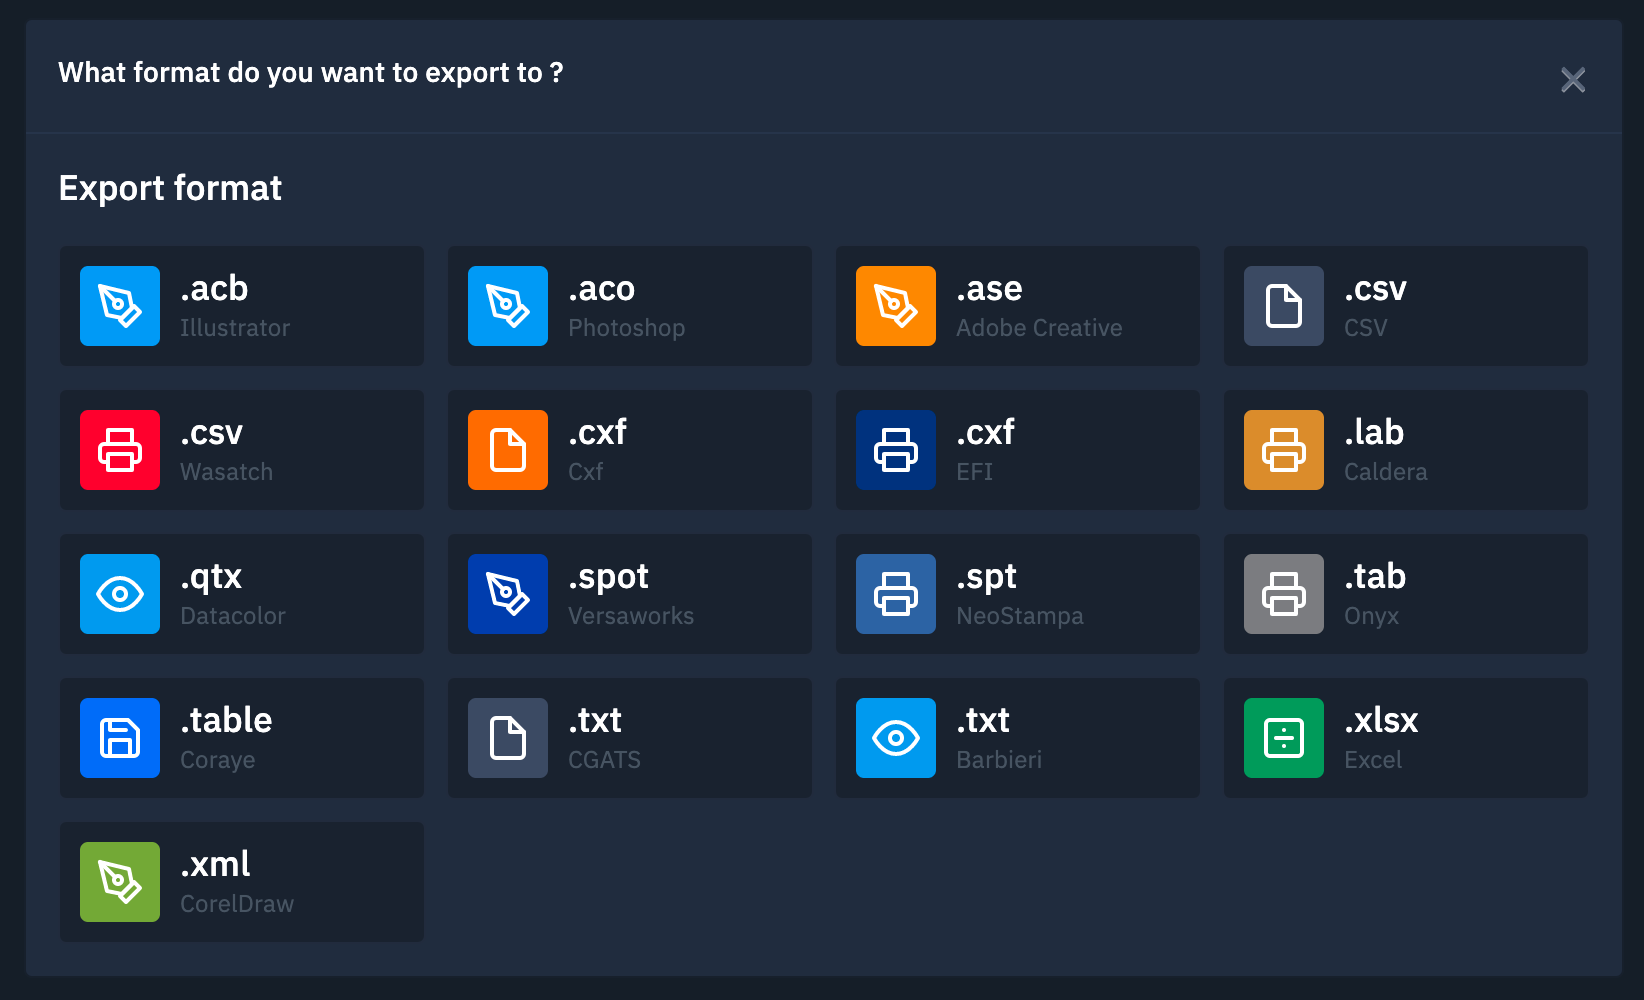
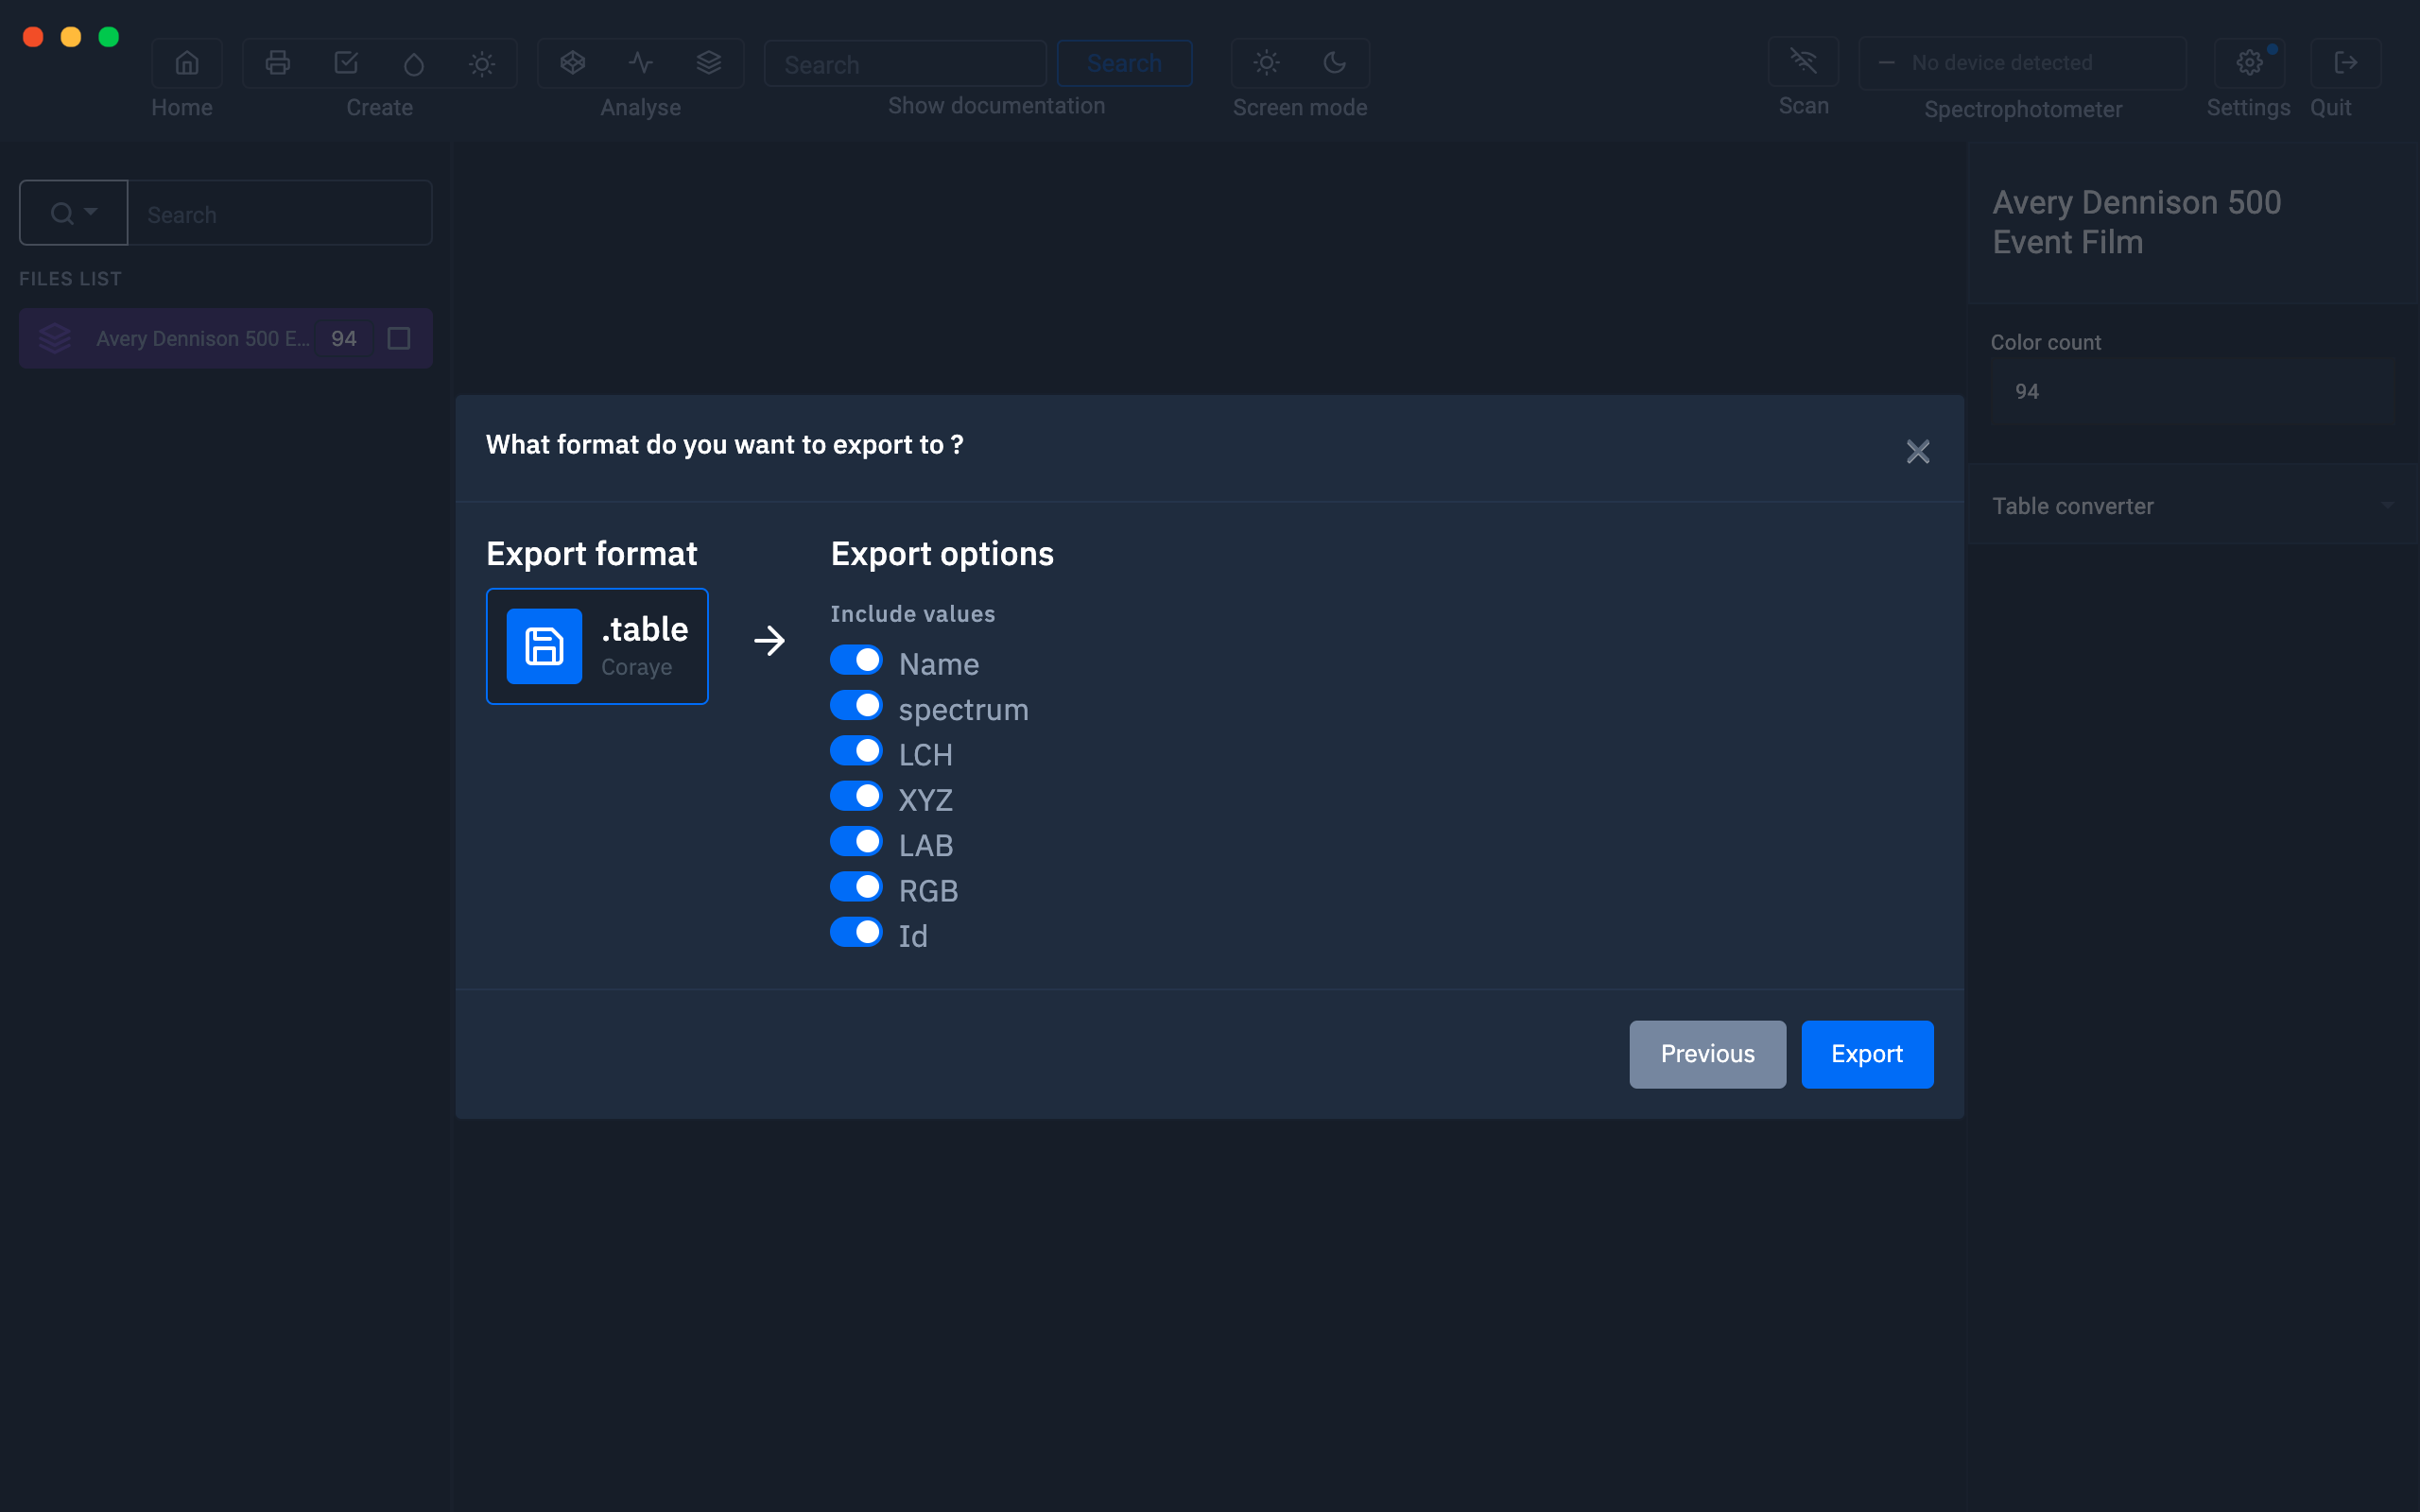
Each type of export file is customizable.
During the export, Coraye examines the fields contained in the color table and offers you to customize the content of the new color table.
Once the options have been selected, click on the "Export" button to save the file.
Then, use the color chart with your Adobe software or your RIP according to your needs.
Several tutorials are available to help you export and use color charts
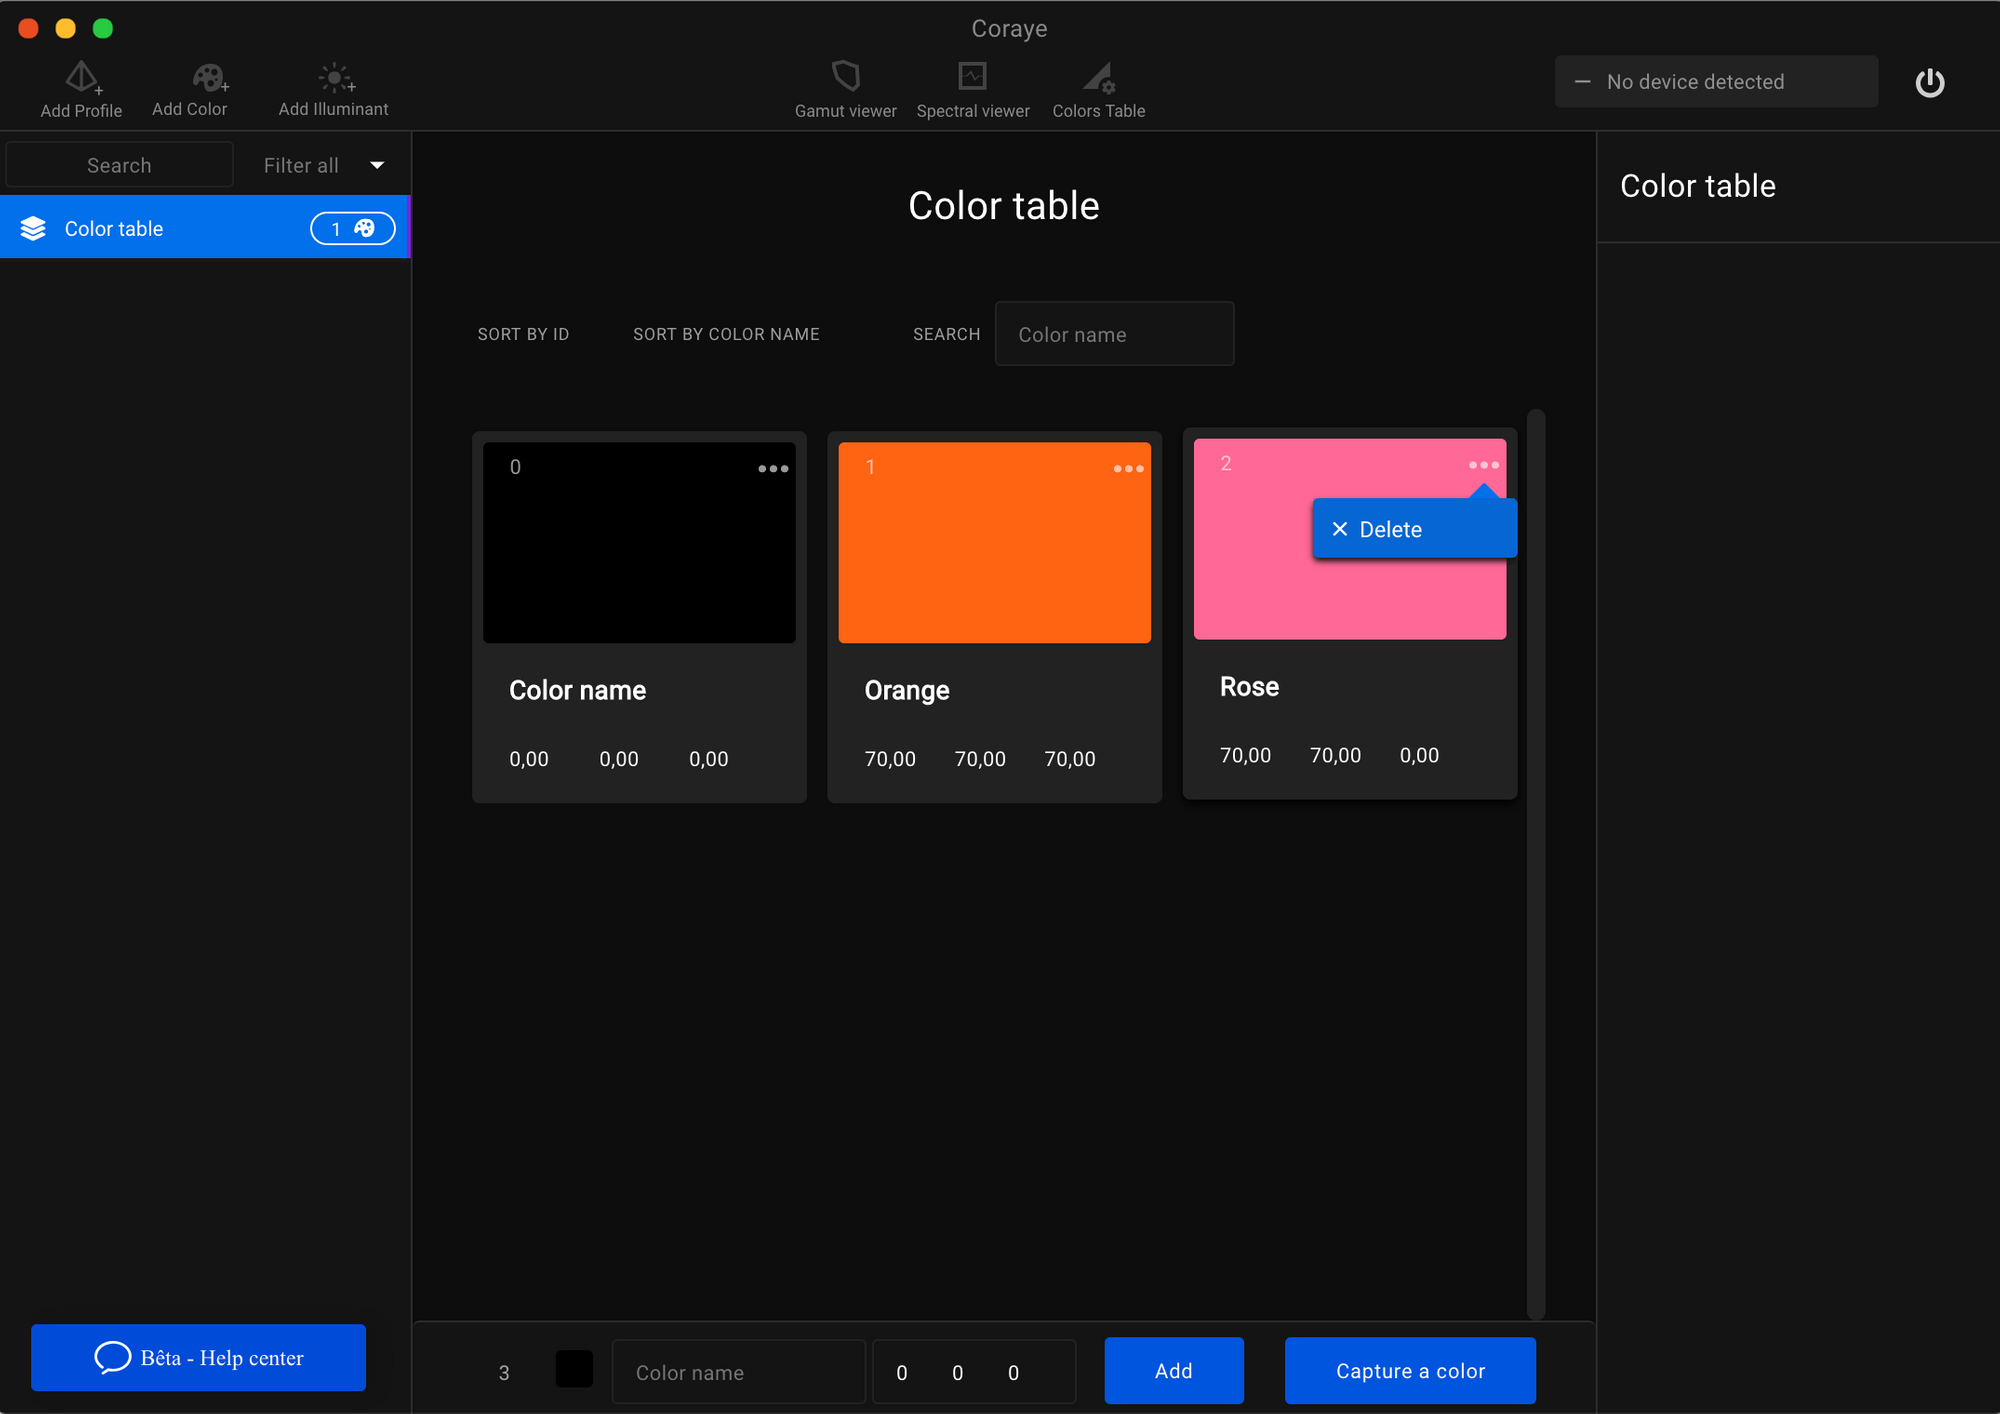
Remove a color
Inside the color table module, you can delete a color by clicking on " Delete " at the top right of the color to be deleted.
Extract a sample from a color table
You can extract a color swatch from the color table by simply dragging and dropping from the color table preview to the left column.
The color from the table appears in the left column.
Then you can use this color:
-
To convert it
Useful to know the closest CMYK value and to know if a PANTONE® is printable for example.
-
To compare it
Useful to compare a color printed with a PANTONE® for example.
-
To create a new color table
Useful for creating a reference color table for quality control, for example.
Shade search
Use the tables to perform shade searches with Color Finder
For more information, see chapter: Color Finder