Example of using a color table with Photoshop
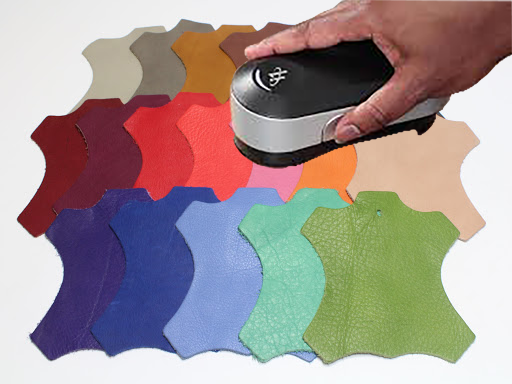
The interest of creating color charts from samples of materials such as fabrics, leathers, plastics, etc ... is not only to share the color but also to simulate realistic renderings.
Introduction
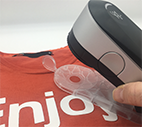
In this tutorial, we will simulate different colors of bracelets made from measuring leather samples.
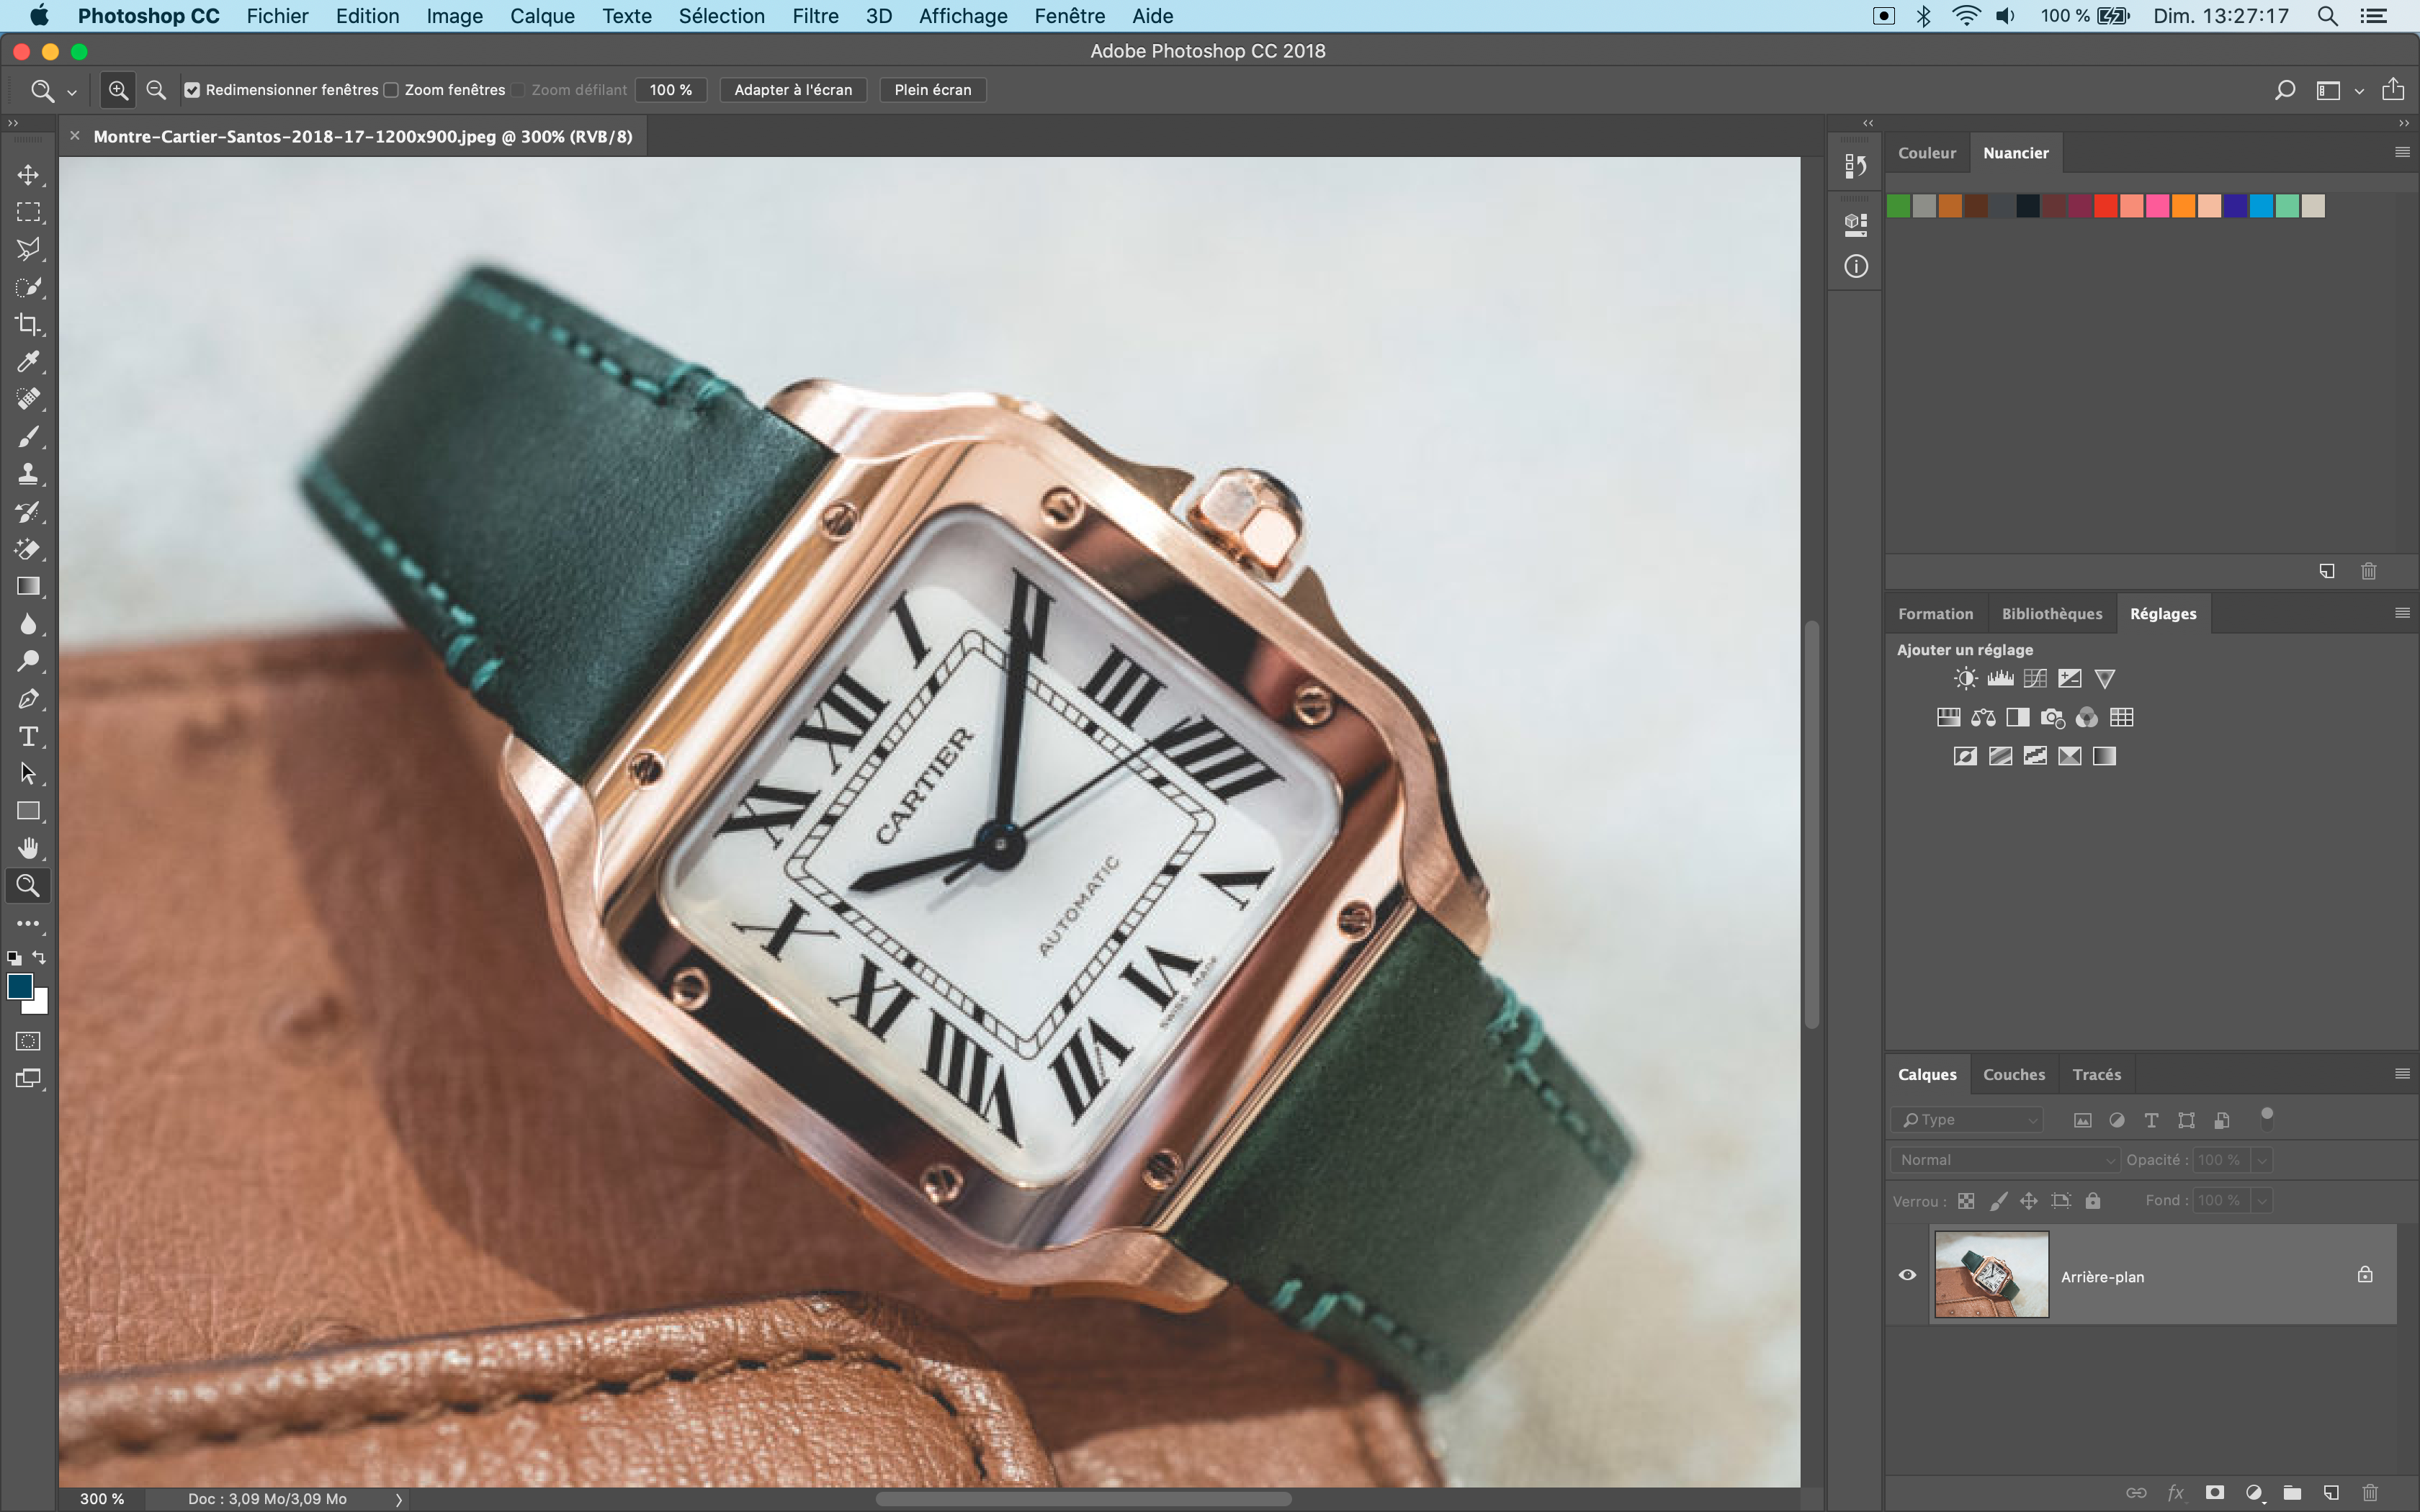
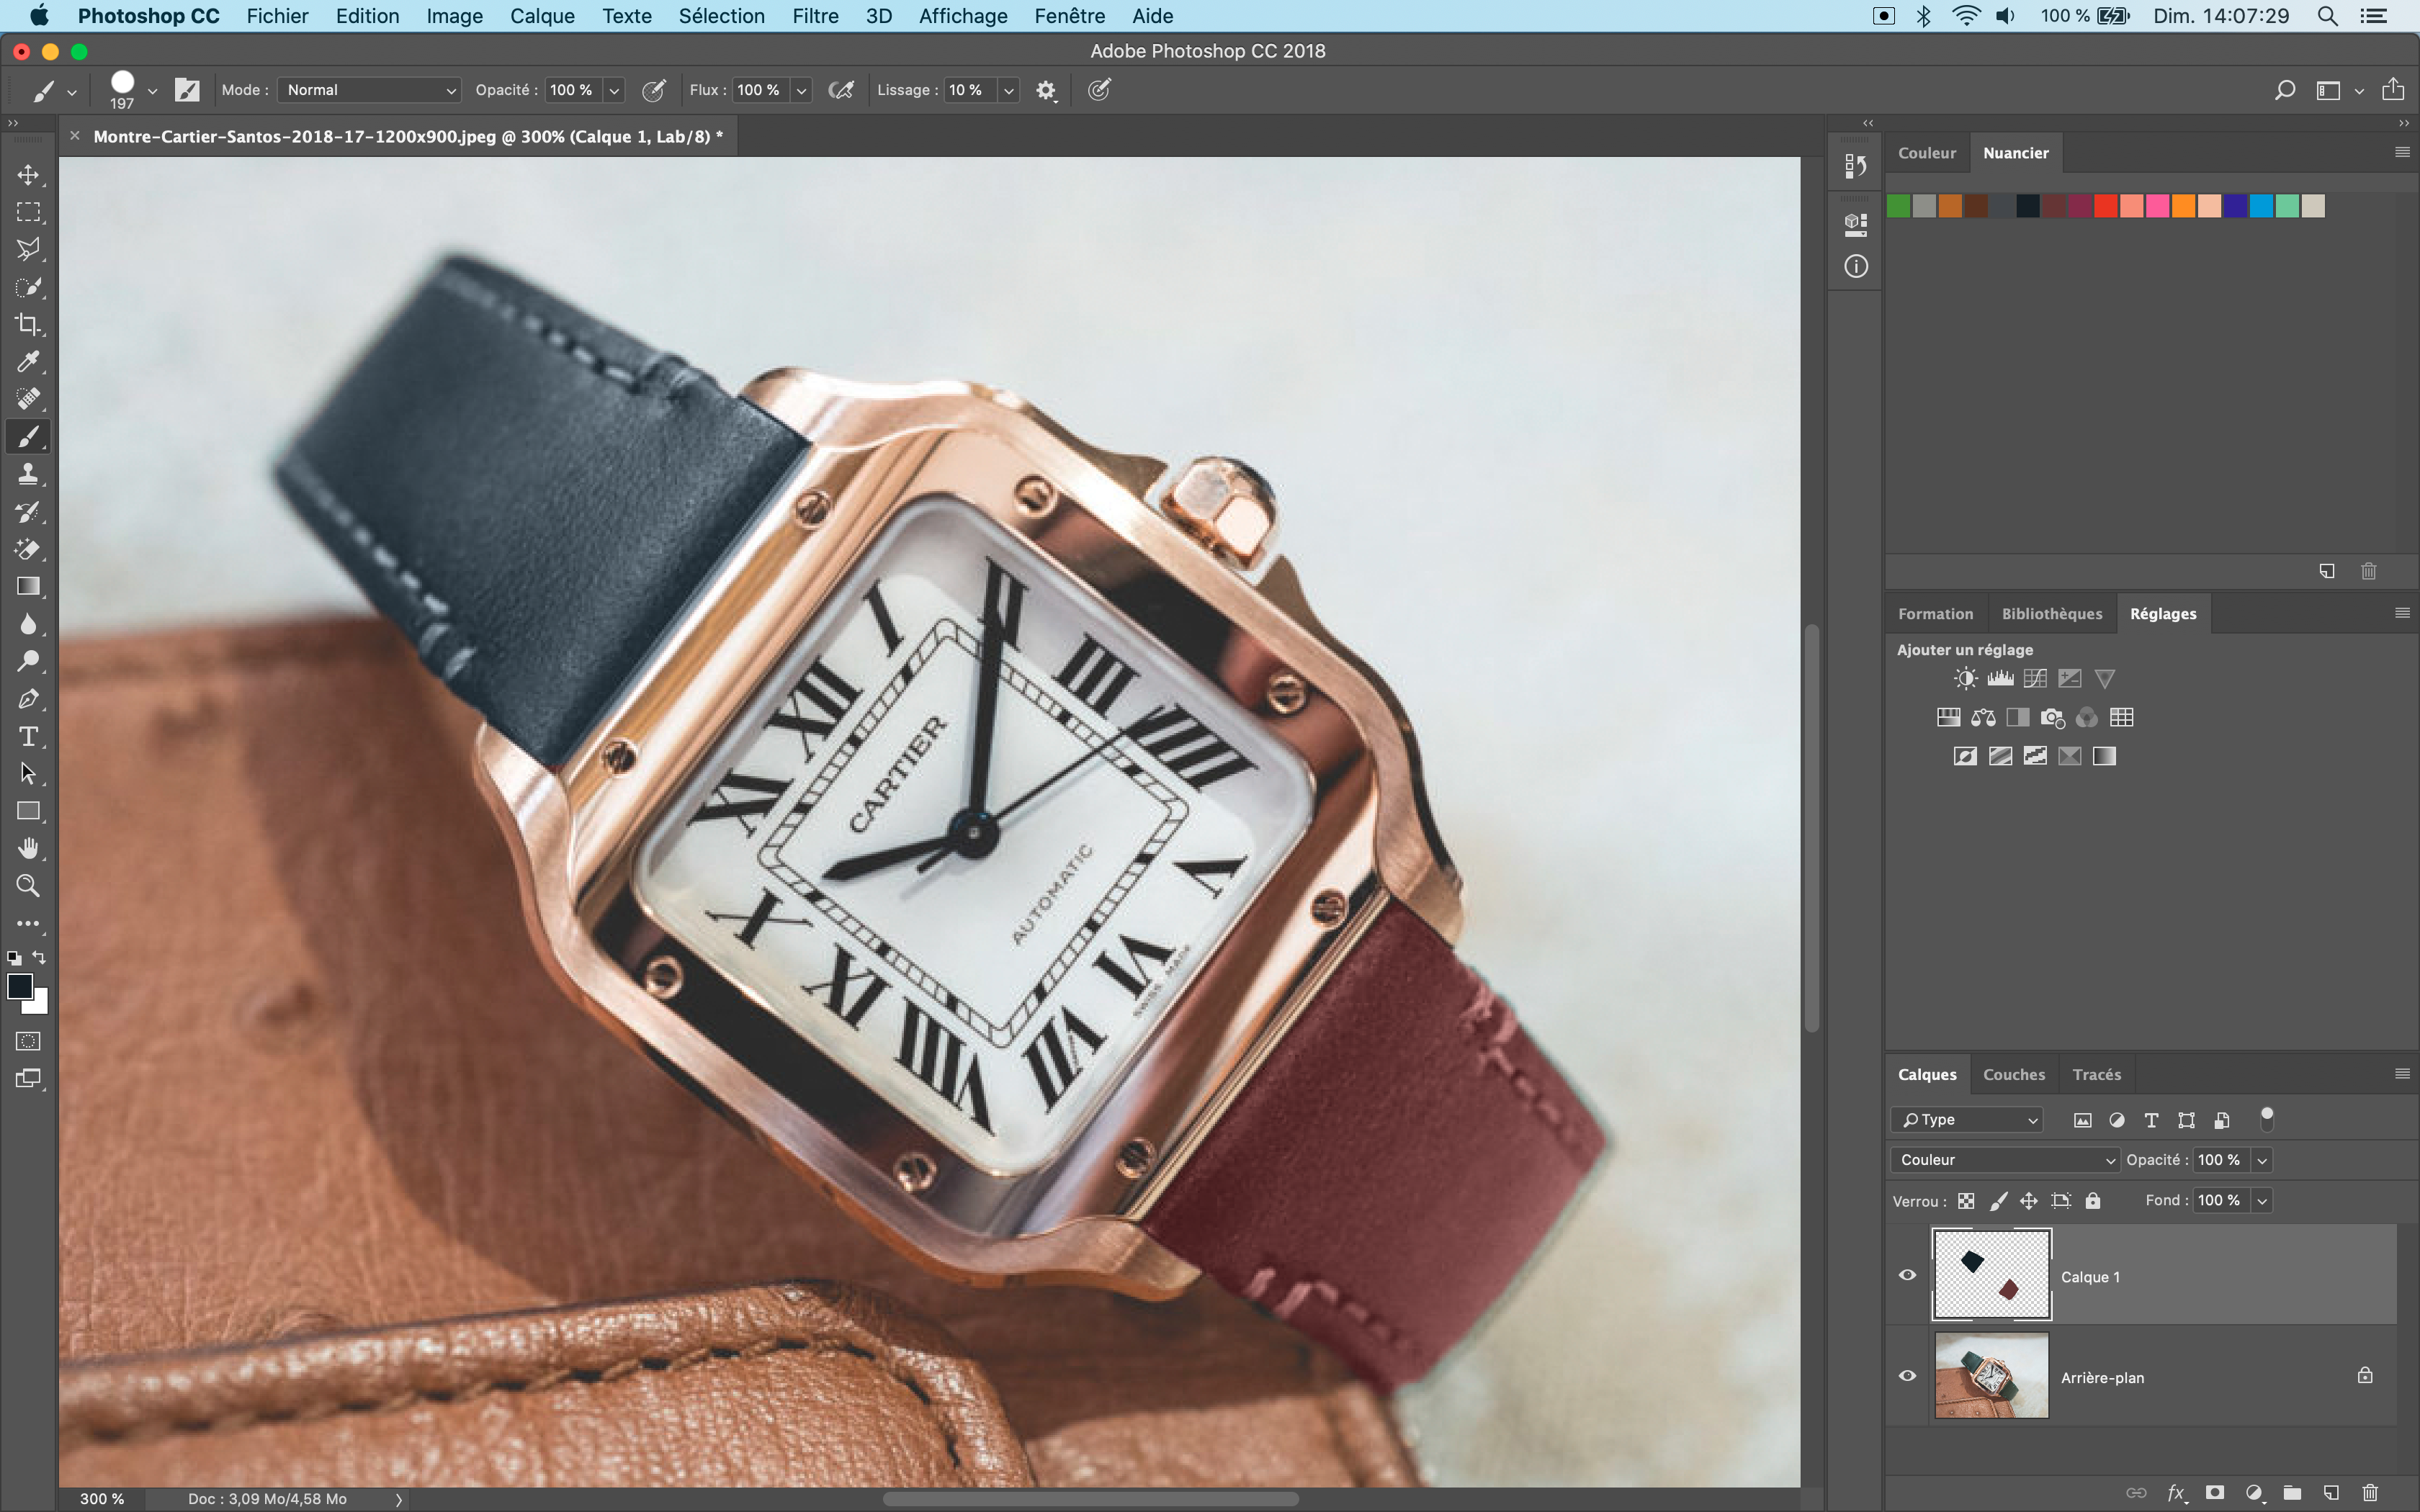
| Picture of the original watch | Bracelet color simulation |
|
|
|
Measurement of leather samples and creation of a color chart.
The first step is to create a color chart from the measurements of leather samples.
You will find in the chapter "Color table" all the procedure to create a color chart from the material sample measurement.
For more information, see chapter: Color tables
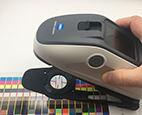
For material measurement, we recommend suitable spectrophotometers such as the I1 Pro 3 PLUS (which has a large aperture of 8mm and an M3 mode) or industrial spectrophotometers such as the Konica Minolta CM-26
| XRite I1 Pro 3 PLUS | Konica Minolta CM26d |
|
|
 |
Export of the swatch in .ase format (Adobe Photoshop)
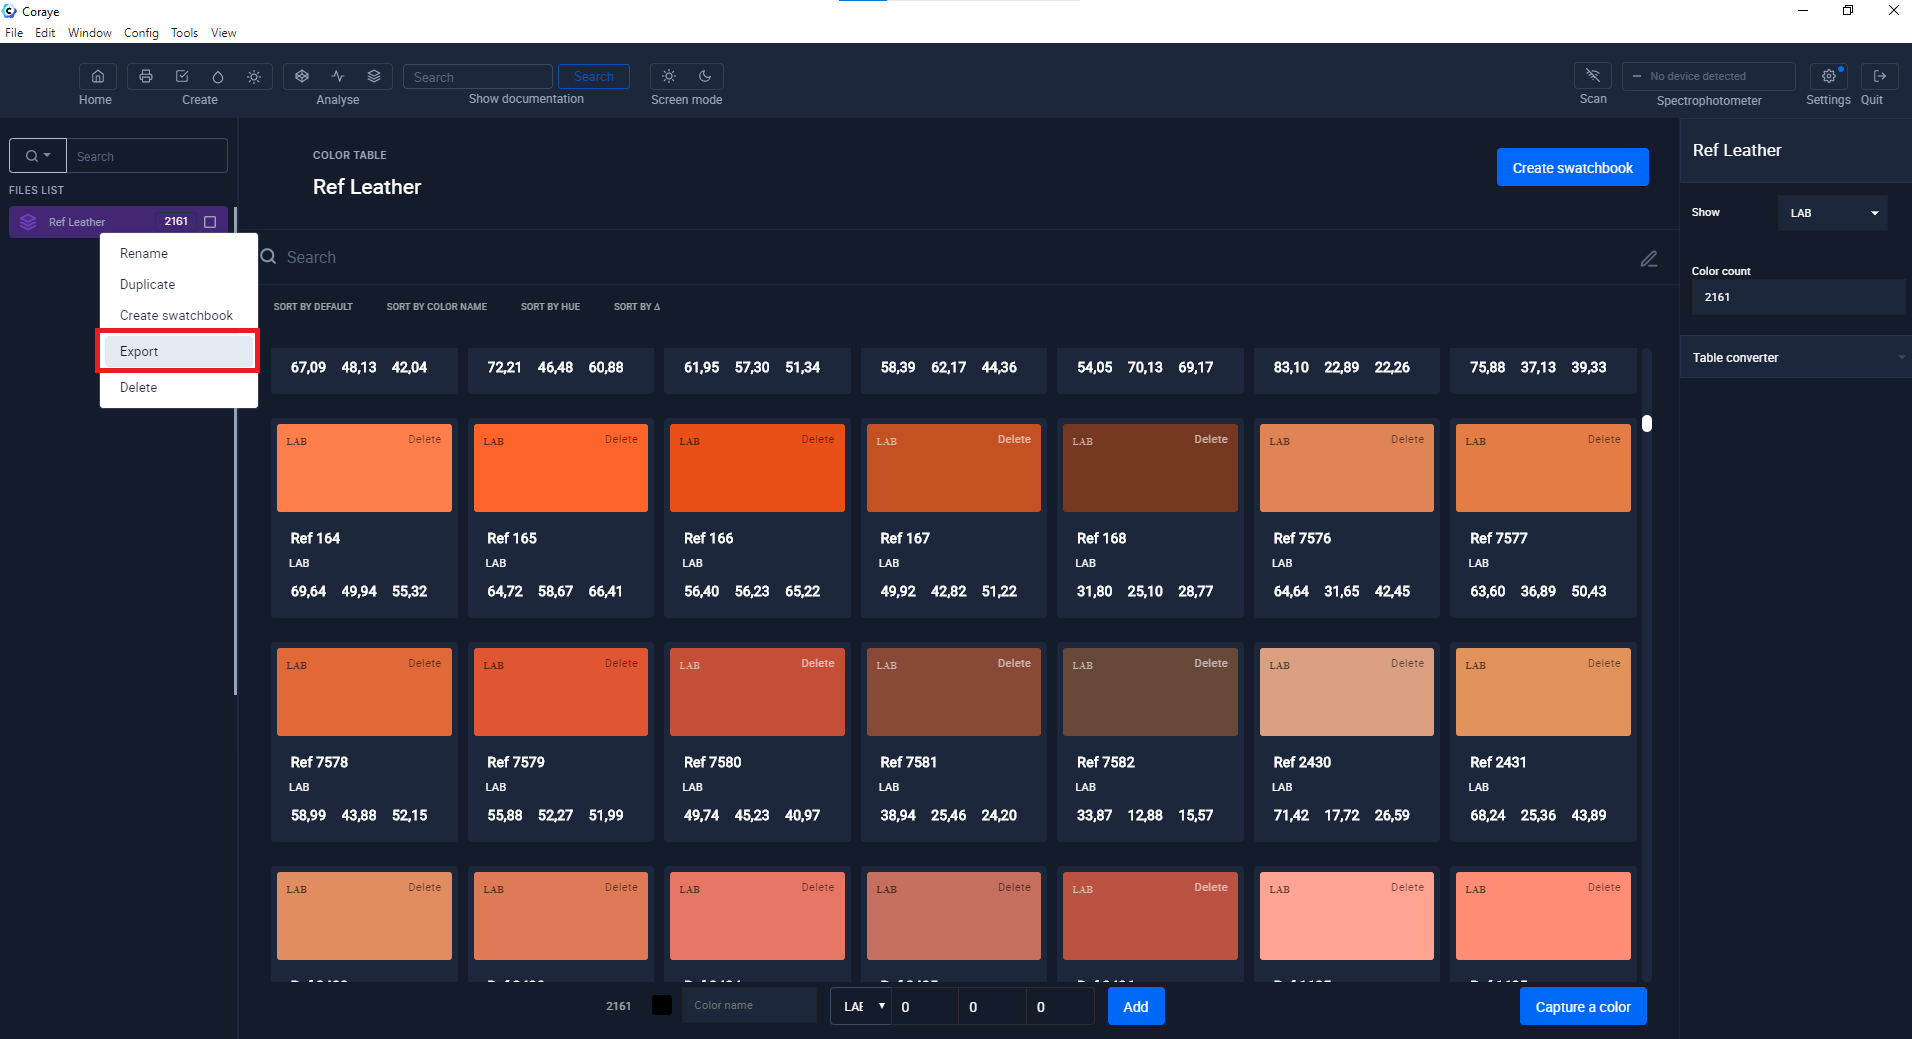
Once the leather measurements have been made, export the color chart in the format corresponding to the software you are going to use. In our example, we will export it in the .ase format which is compatible with Adobe Photoshop.
Right click on the table in the left column, then select " Export ".
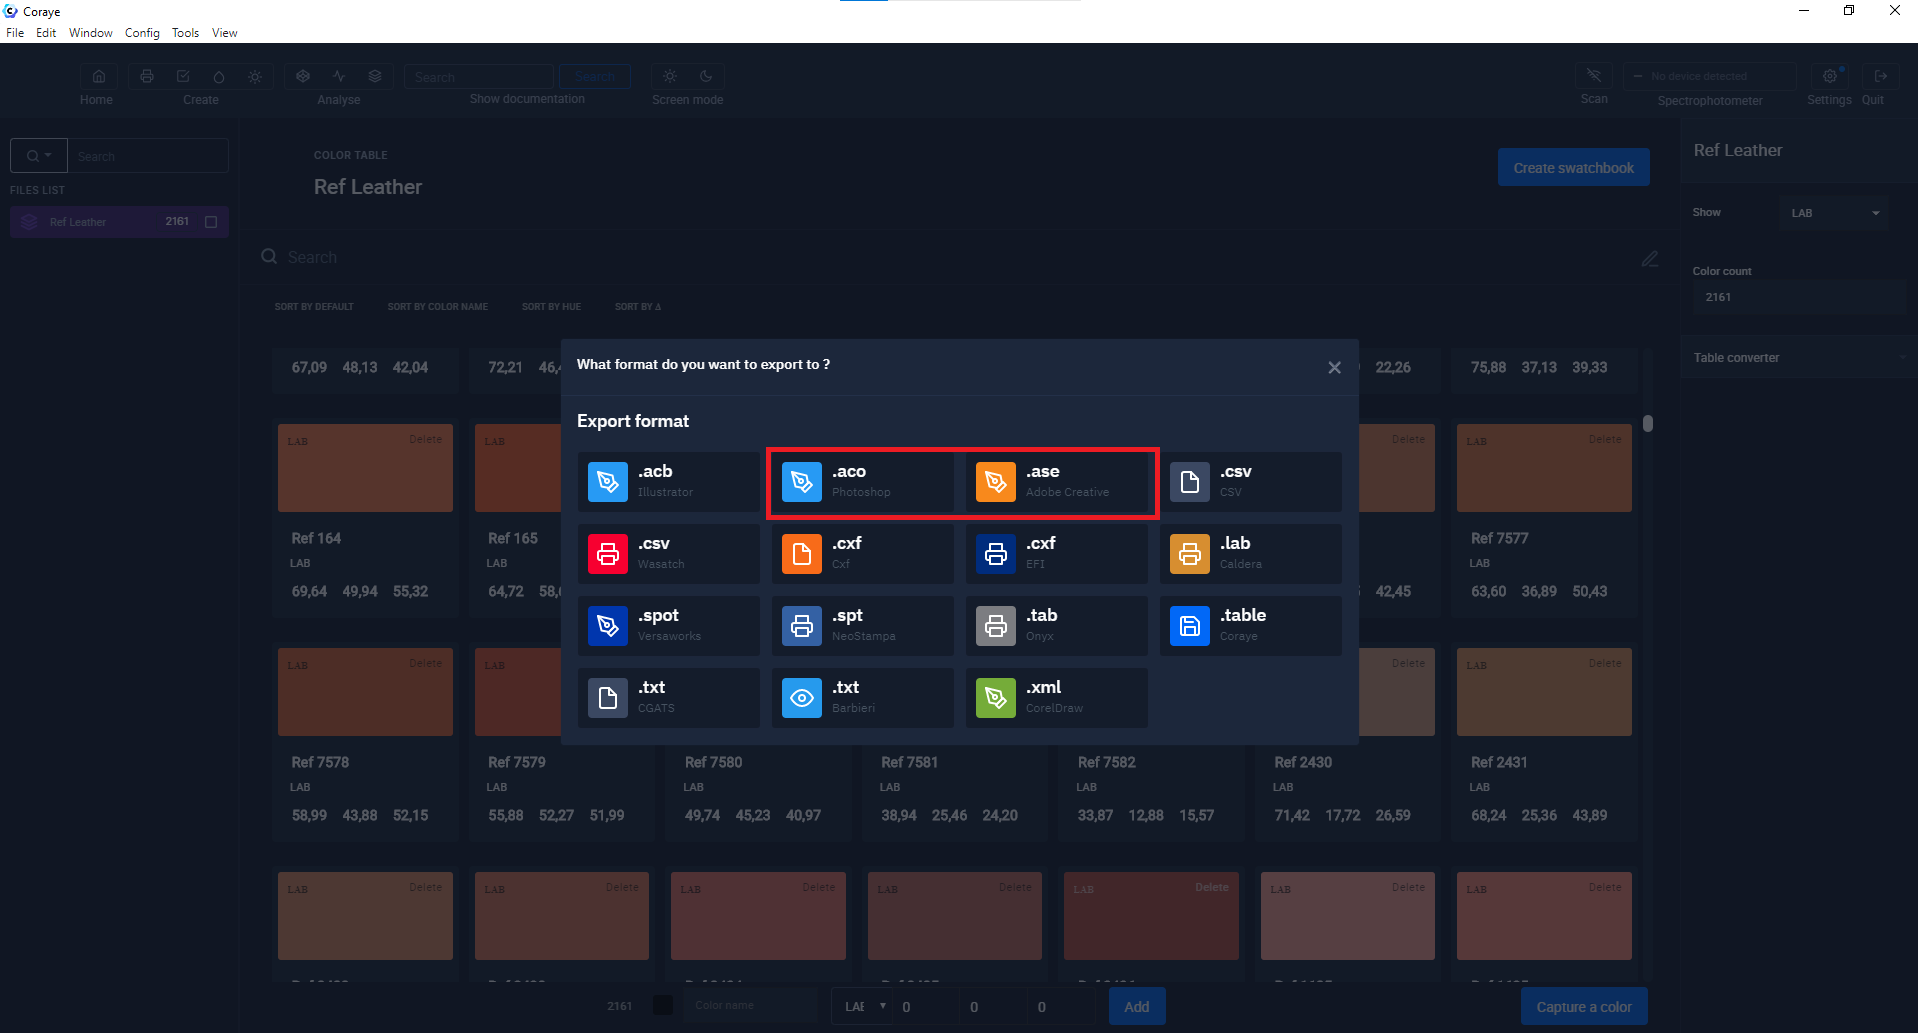
In the new window, choose the export format.
In our case we will choose the .ase format. Note that the .aco format is also compatible with Photoshop.
Click on the " Export " button.
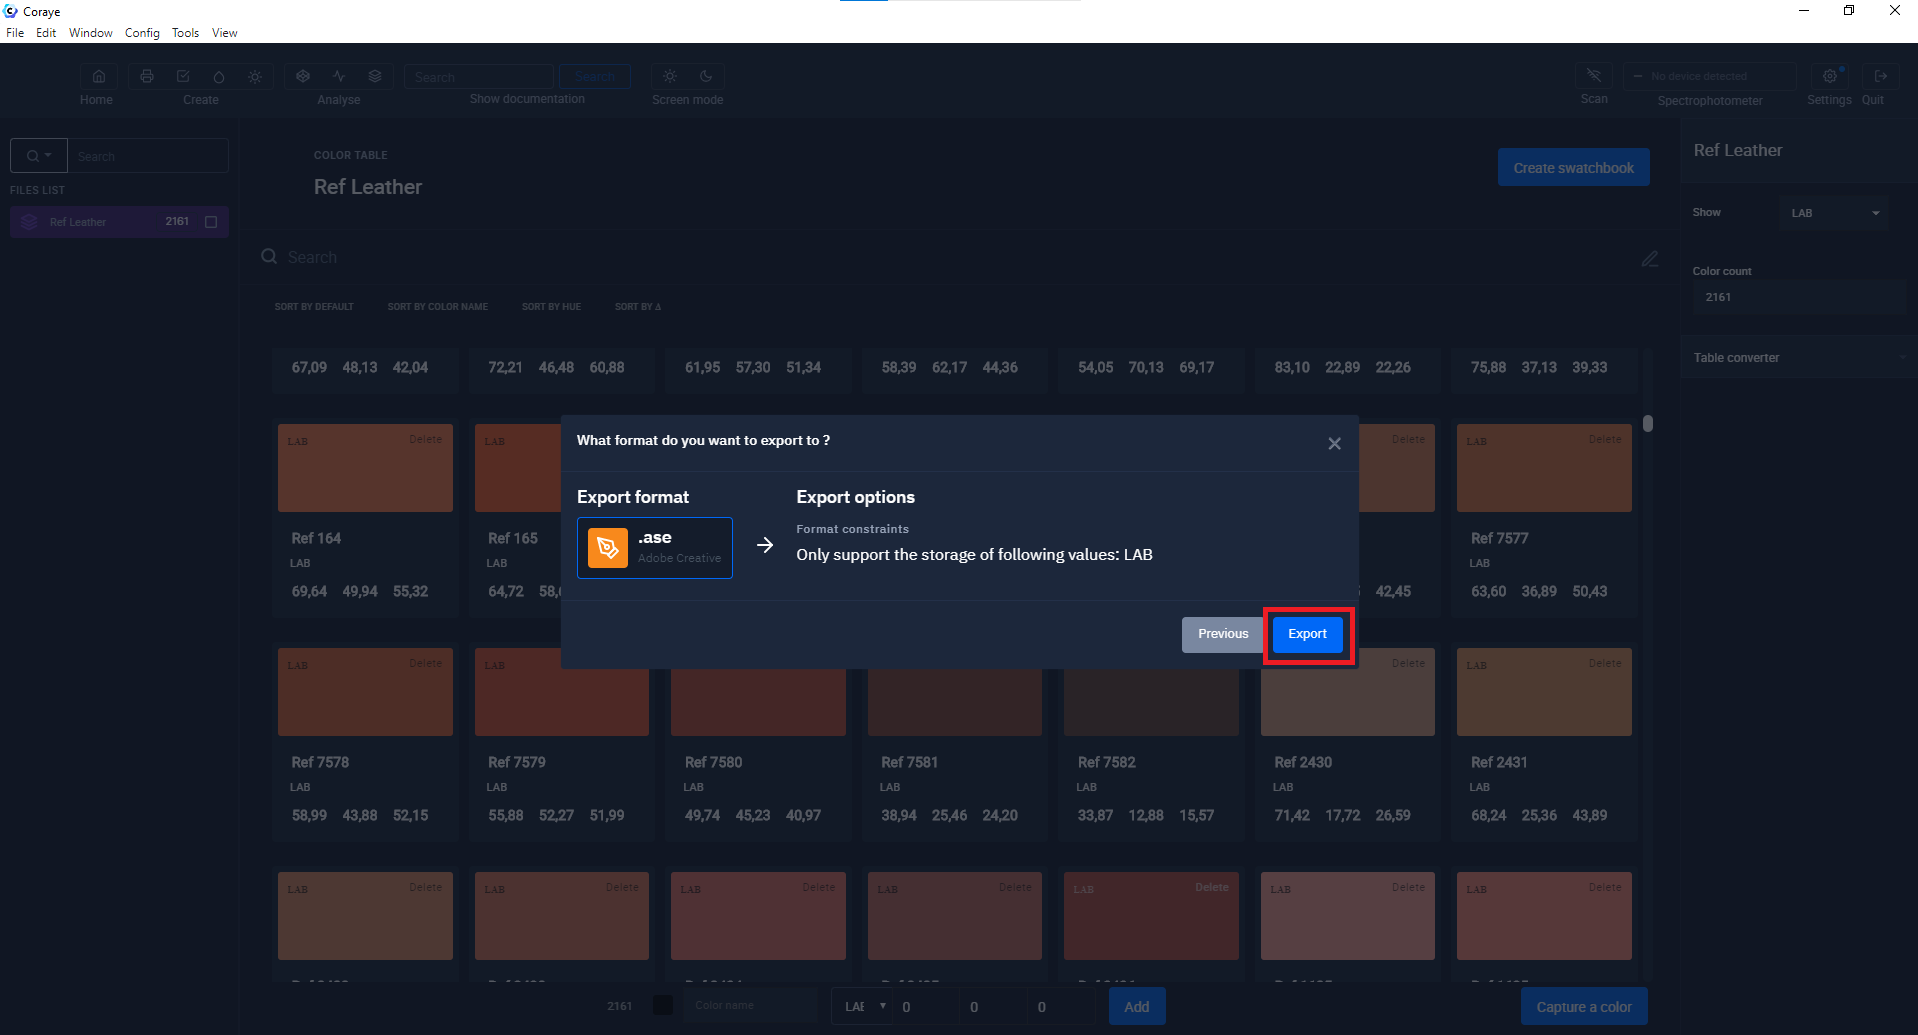
Then save the table on your computer in order to find it to import it later into Photoshop.
Importing the swatch into Adobe Photoshop
Display the swatch in the Window tab> Swatches Then click in the menu at the top right.

Then select " Load a color chart "
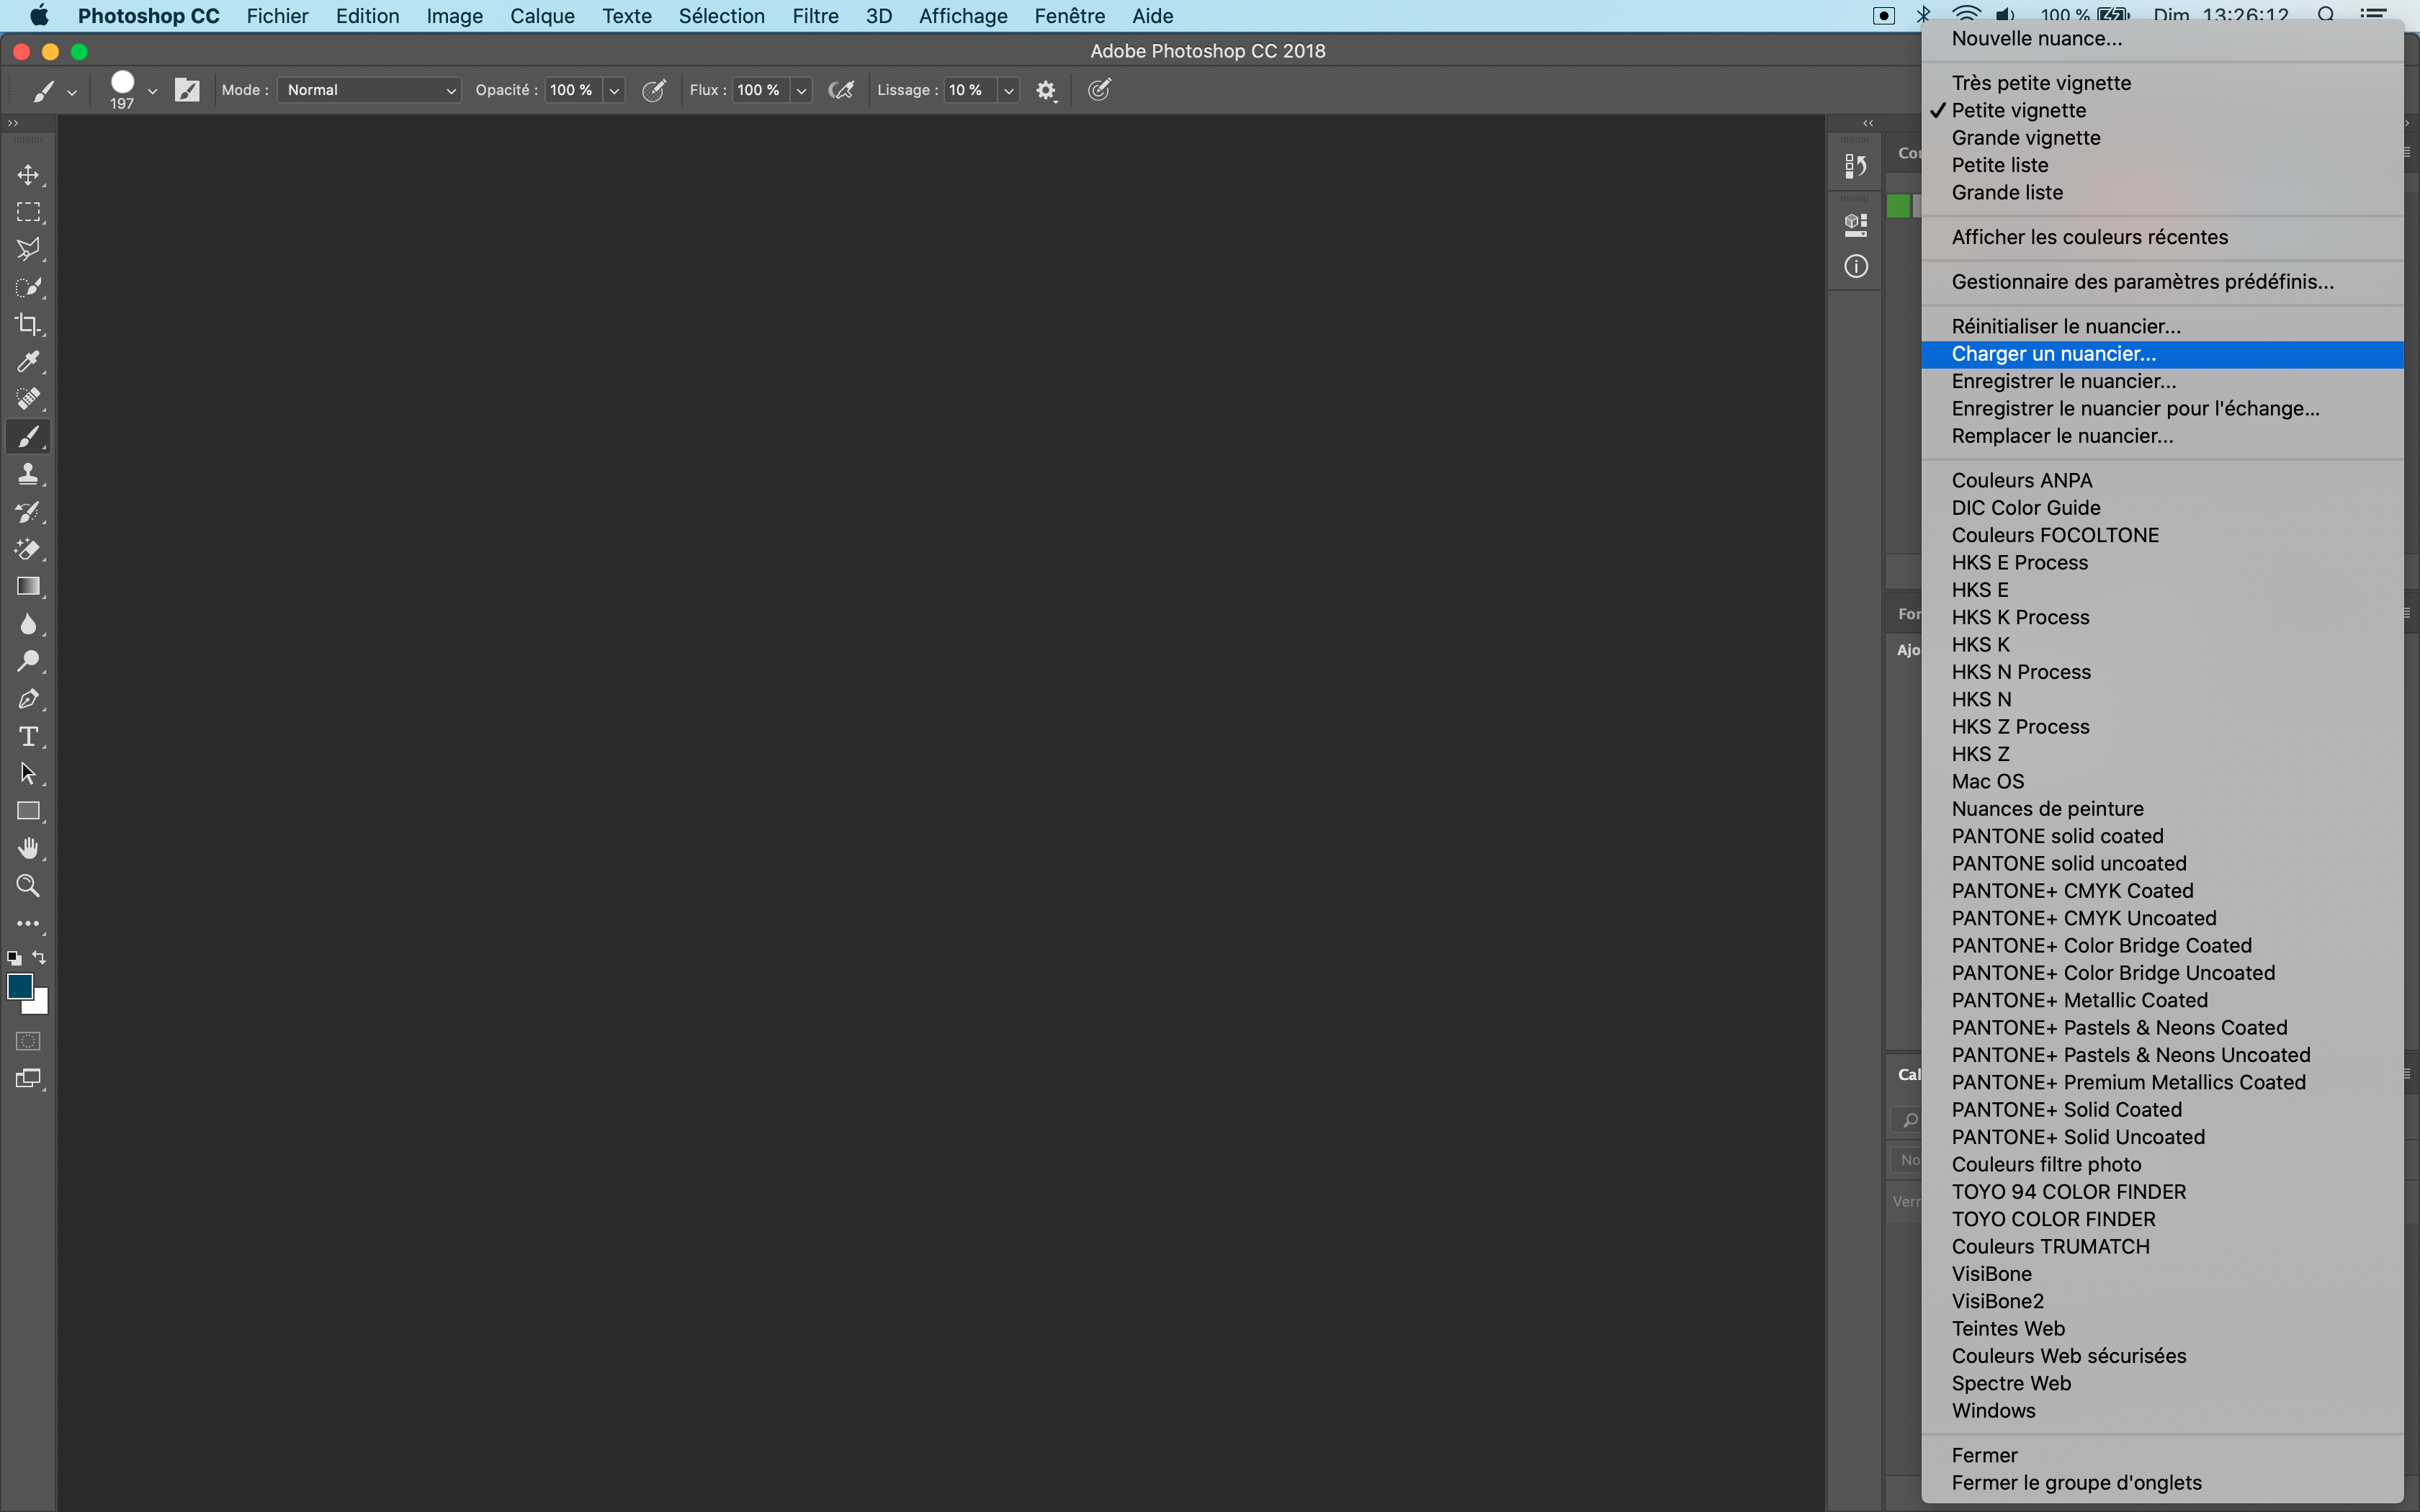
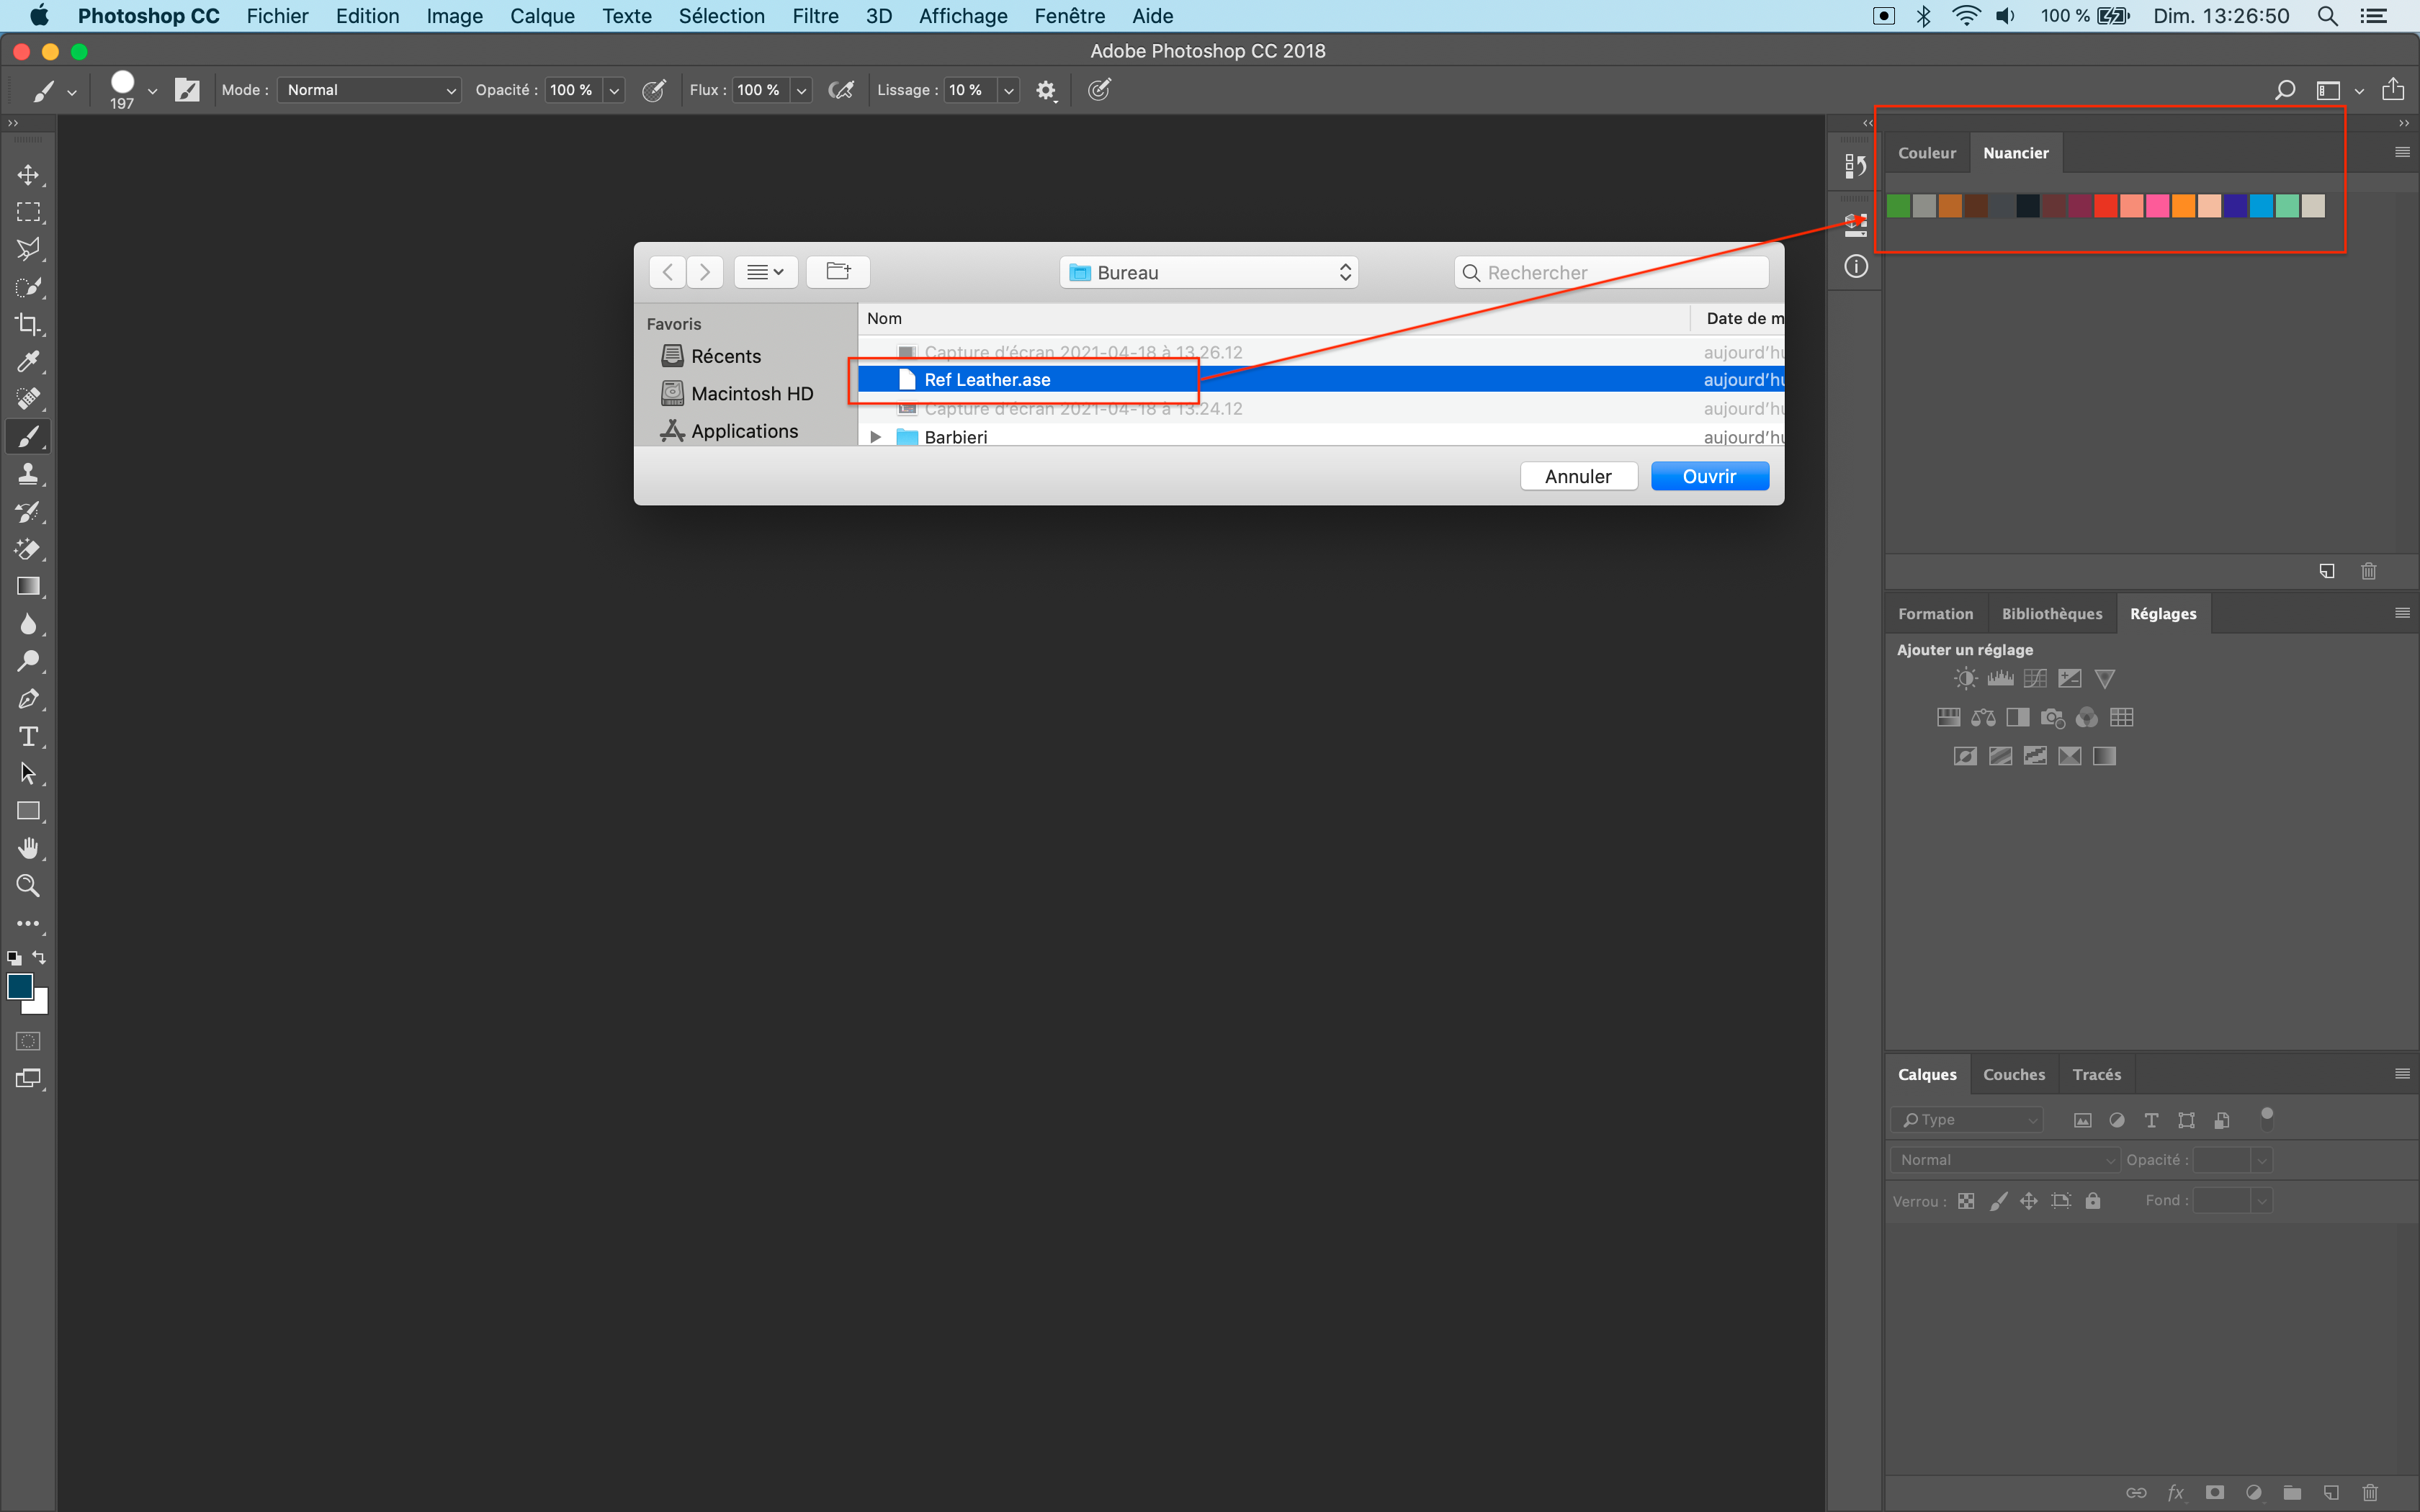
Select the color chart in .ase format generated by Coraye.
Using Lab Color Mode
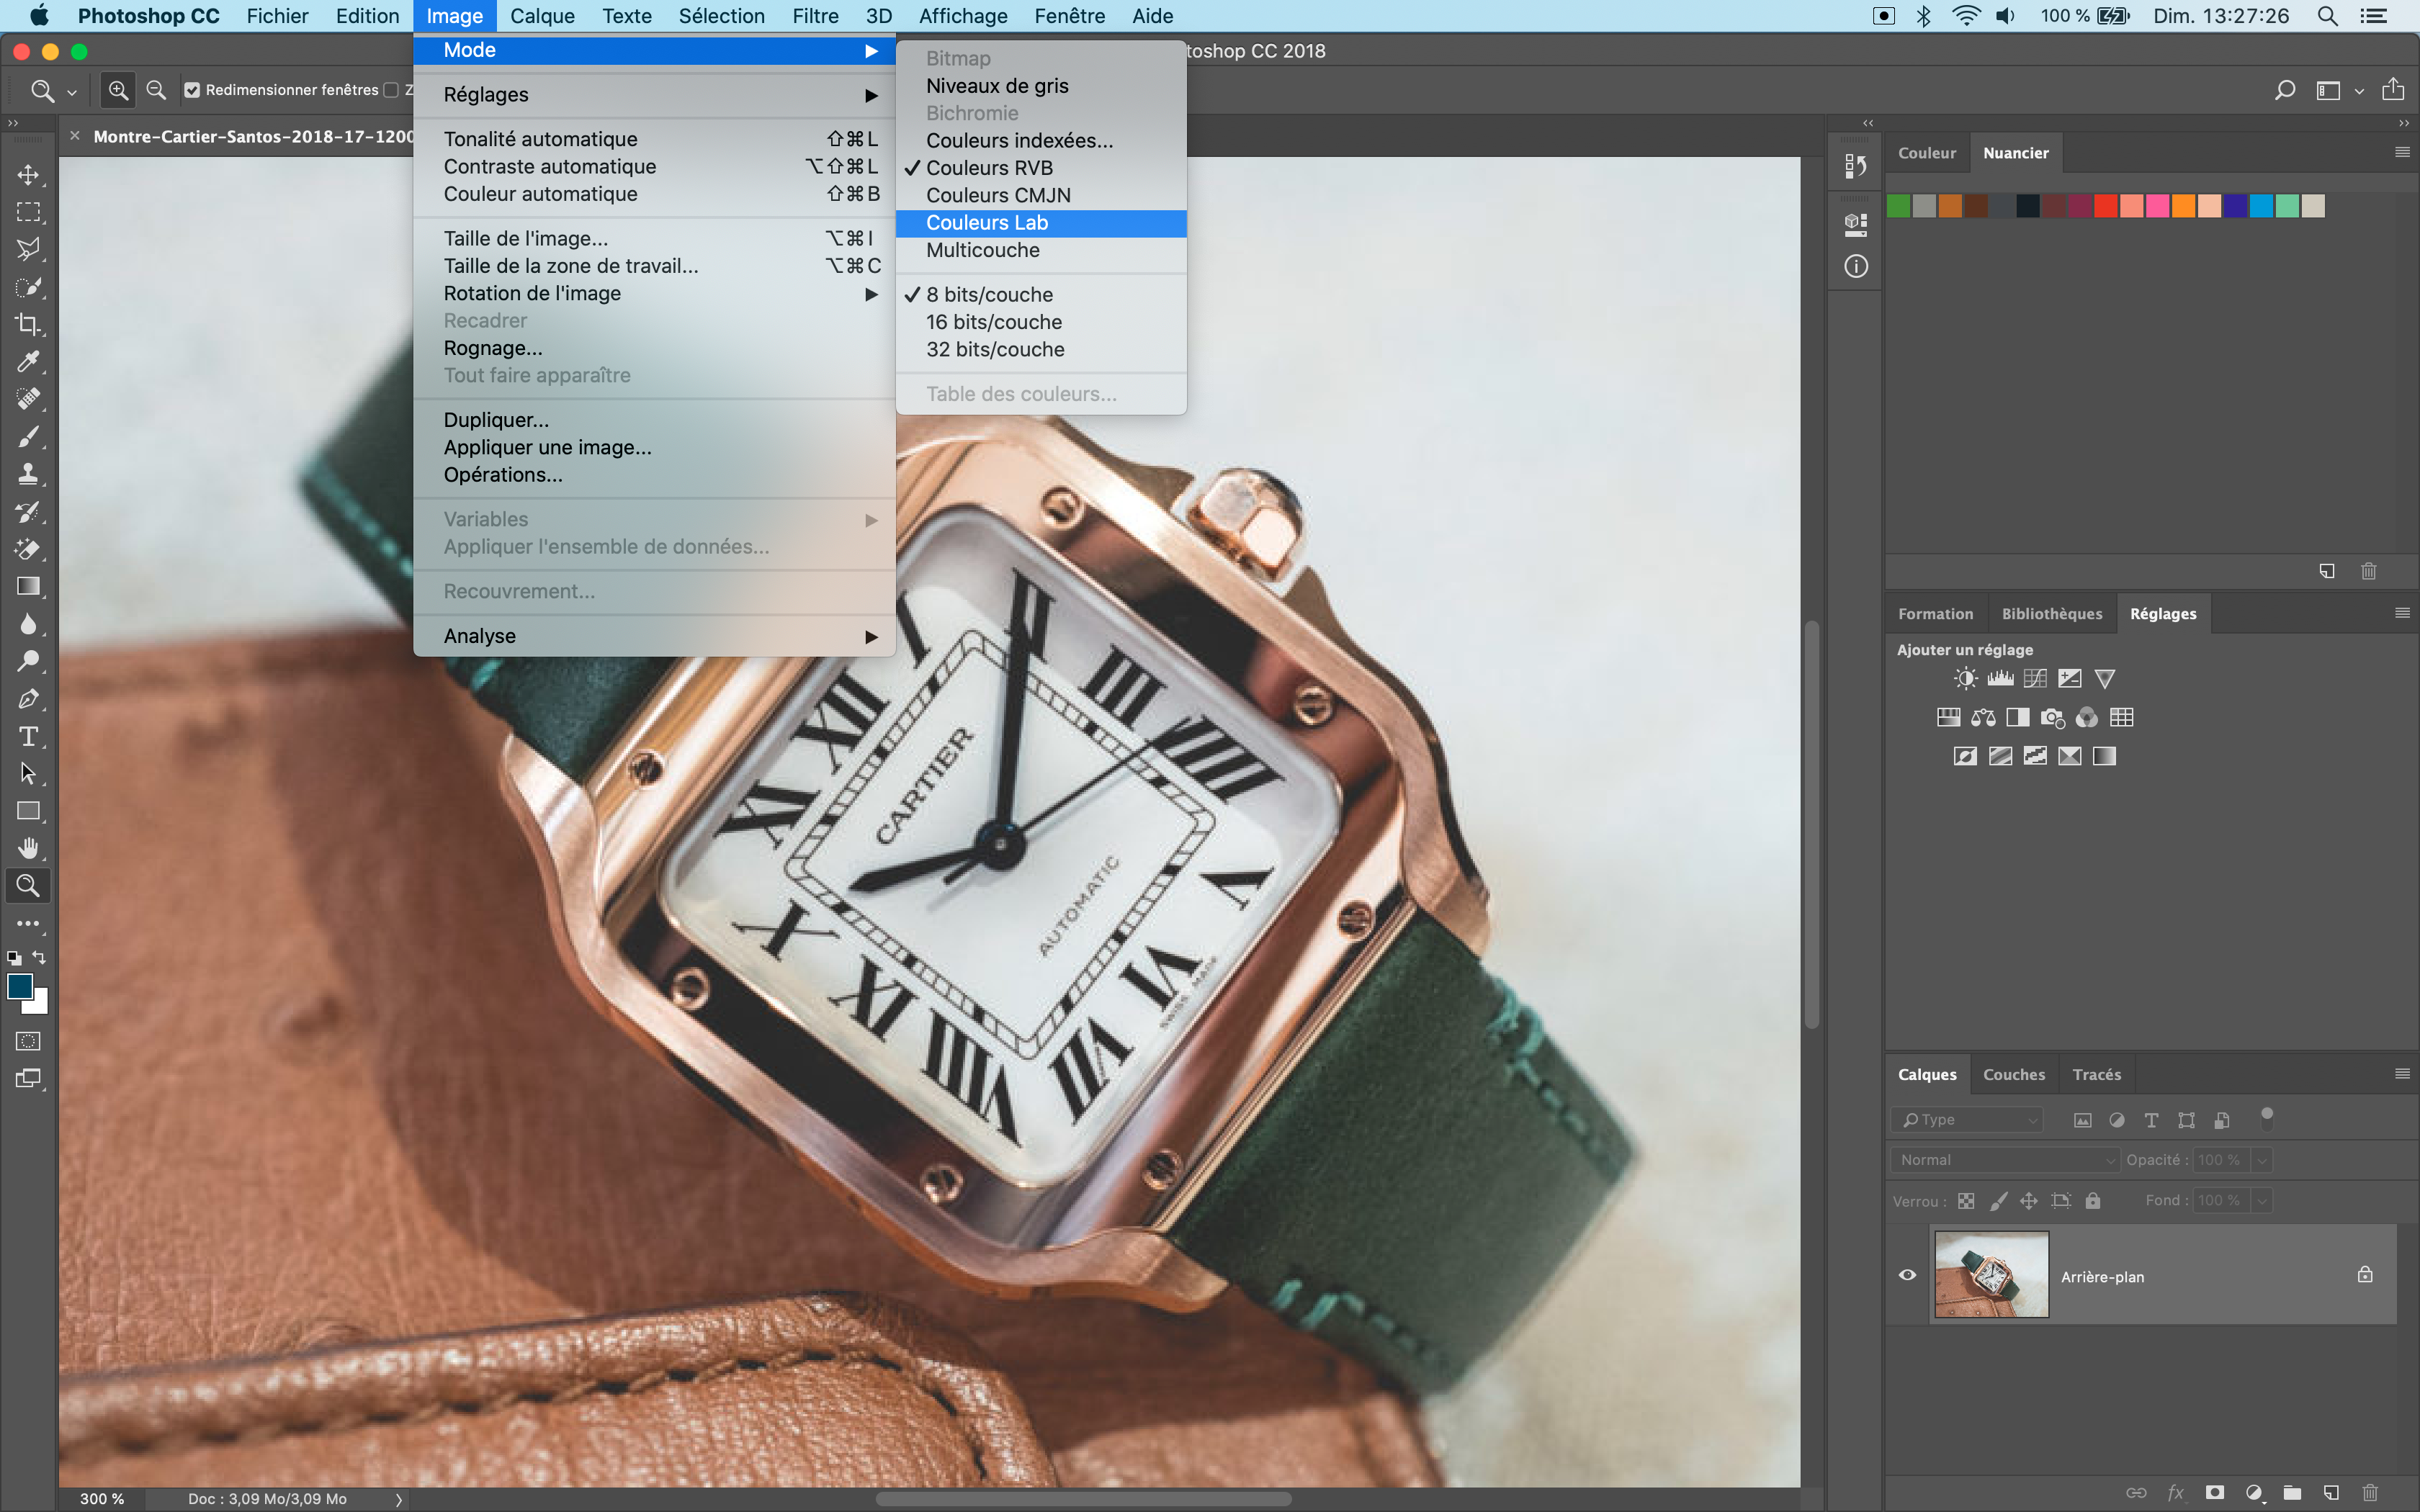
Open the image of the watch then convert it in Lab
Image > Mode > Lab Colors
Lab mode enables faithful and optimized color reproduction.
If you do not have a RIP, you can still convert your image later to the color space of your choice such as Adobe RGB 1998 or sRGB.
File preparation
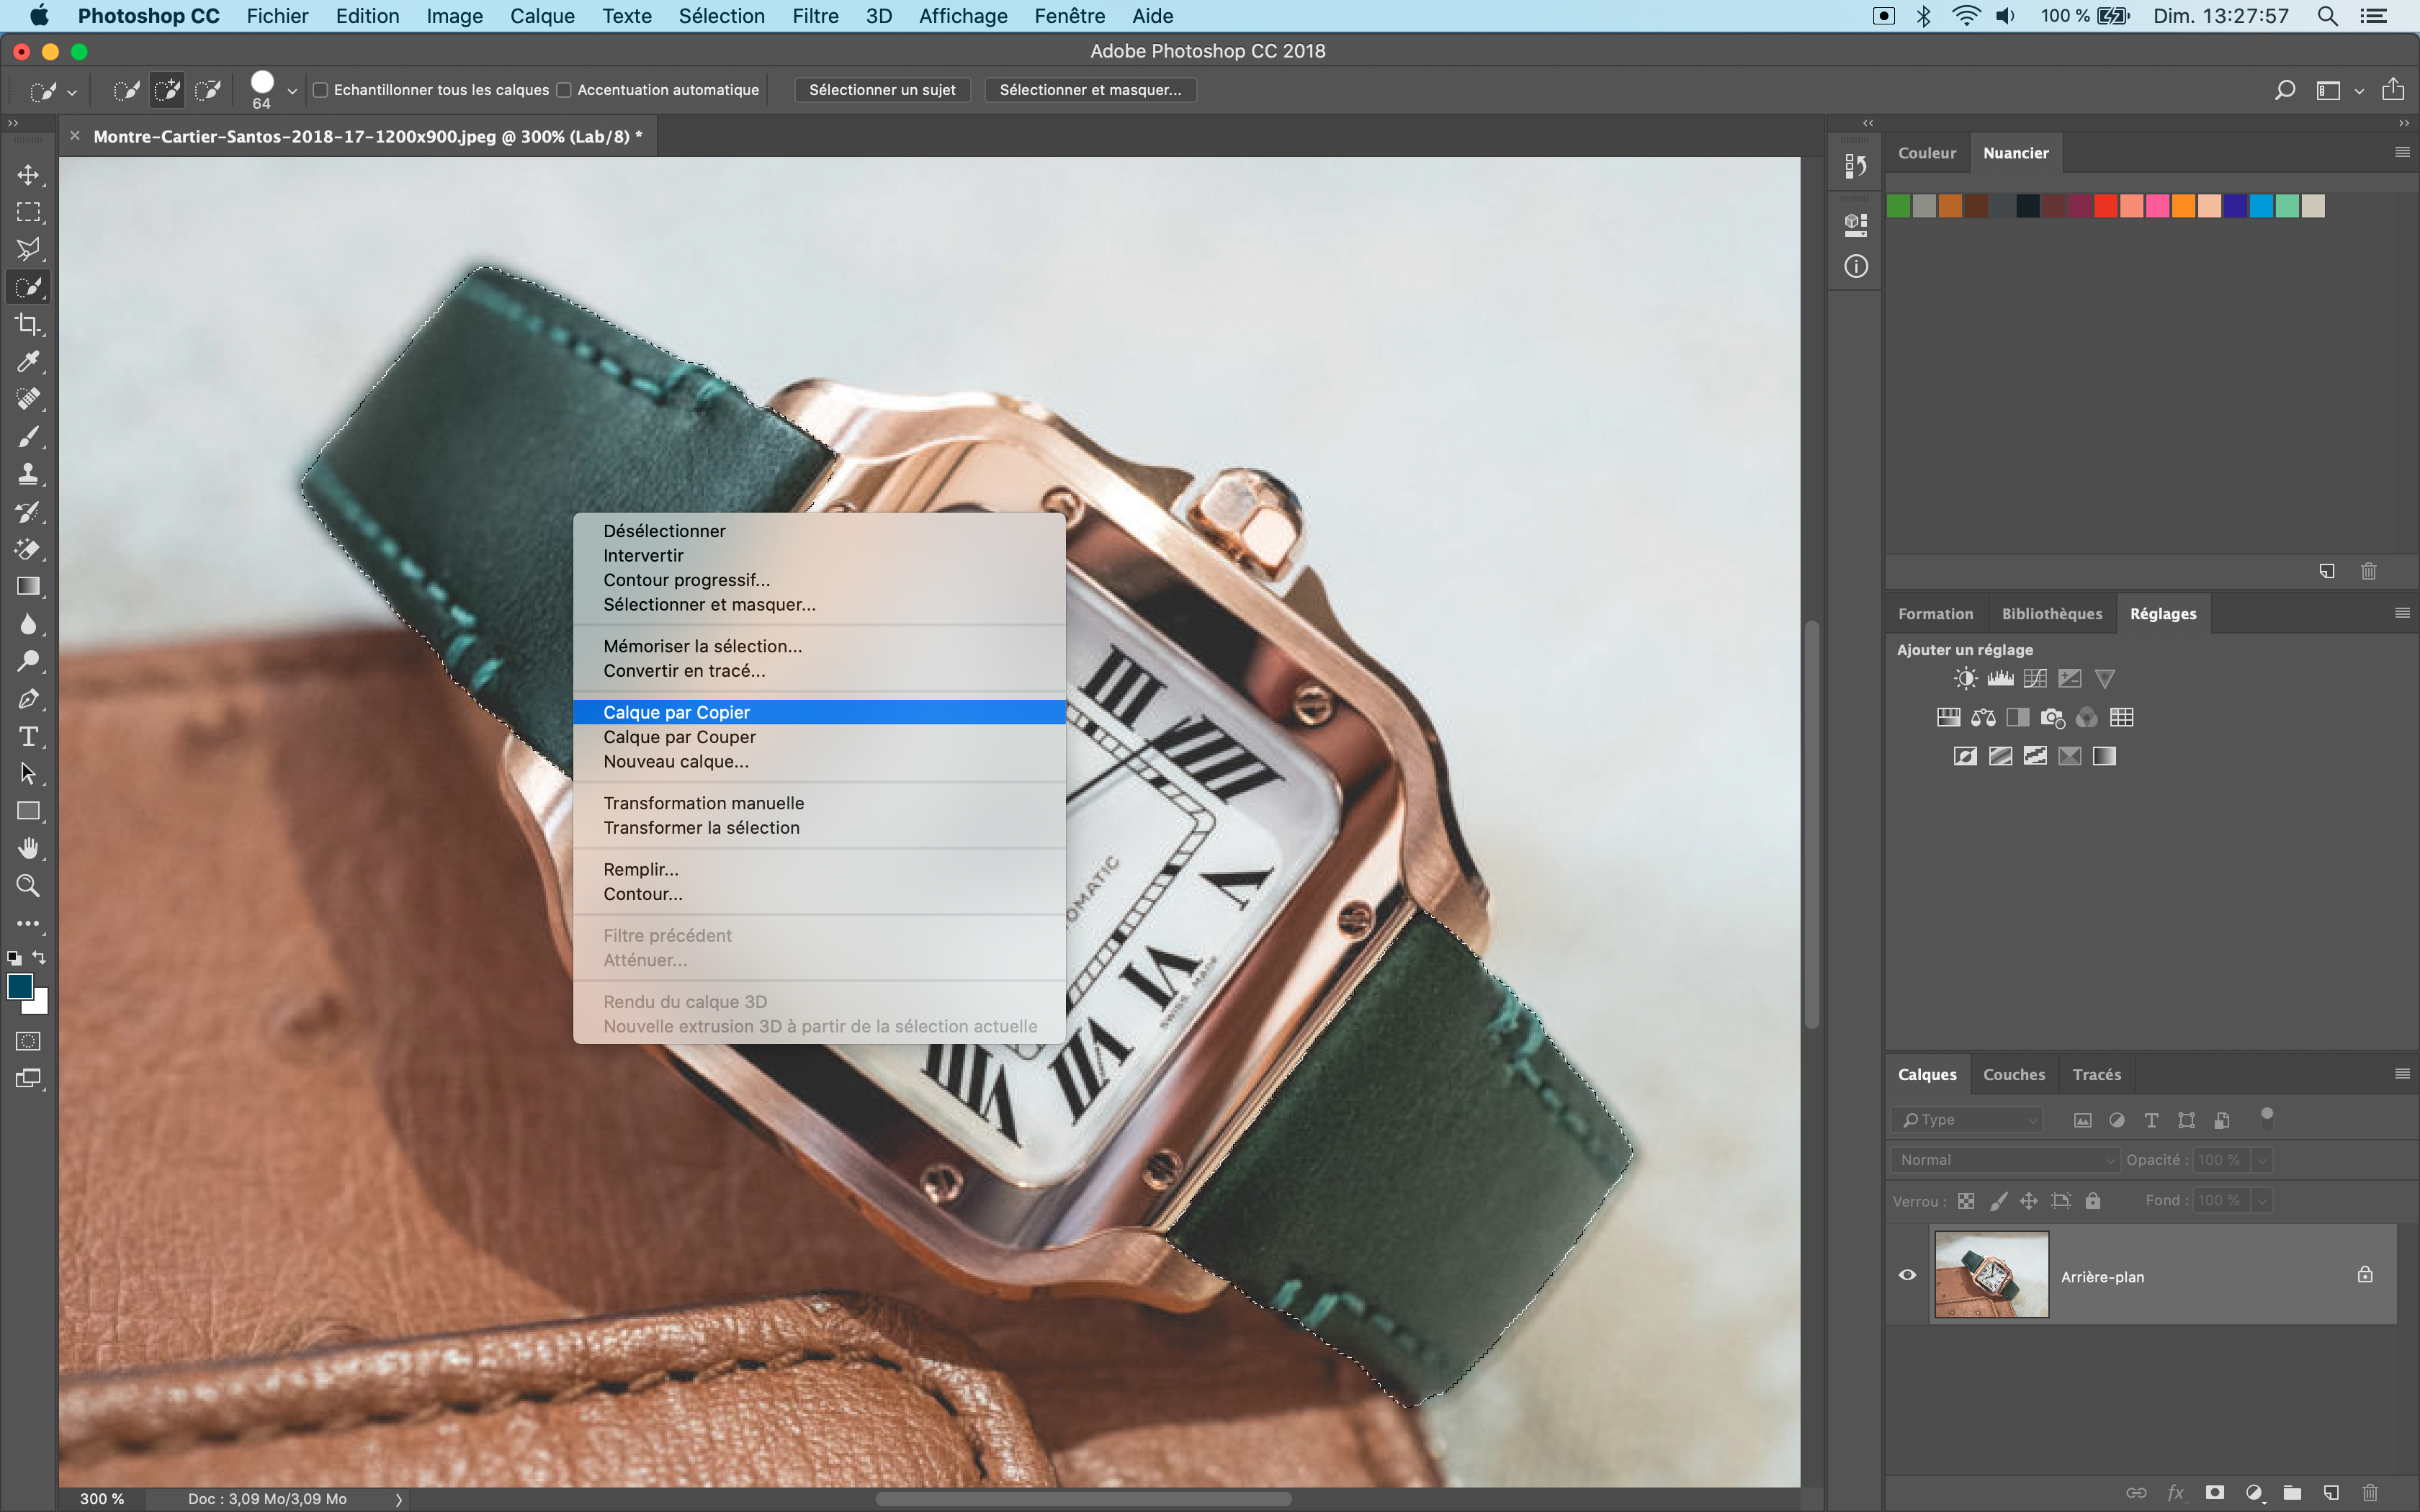
Using the " Quick Selection " tool to select the two parts of the bracelet.
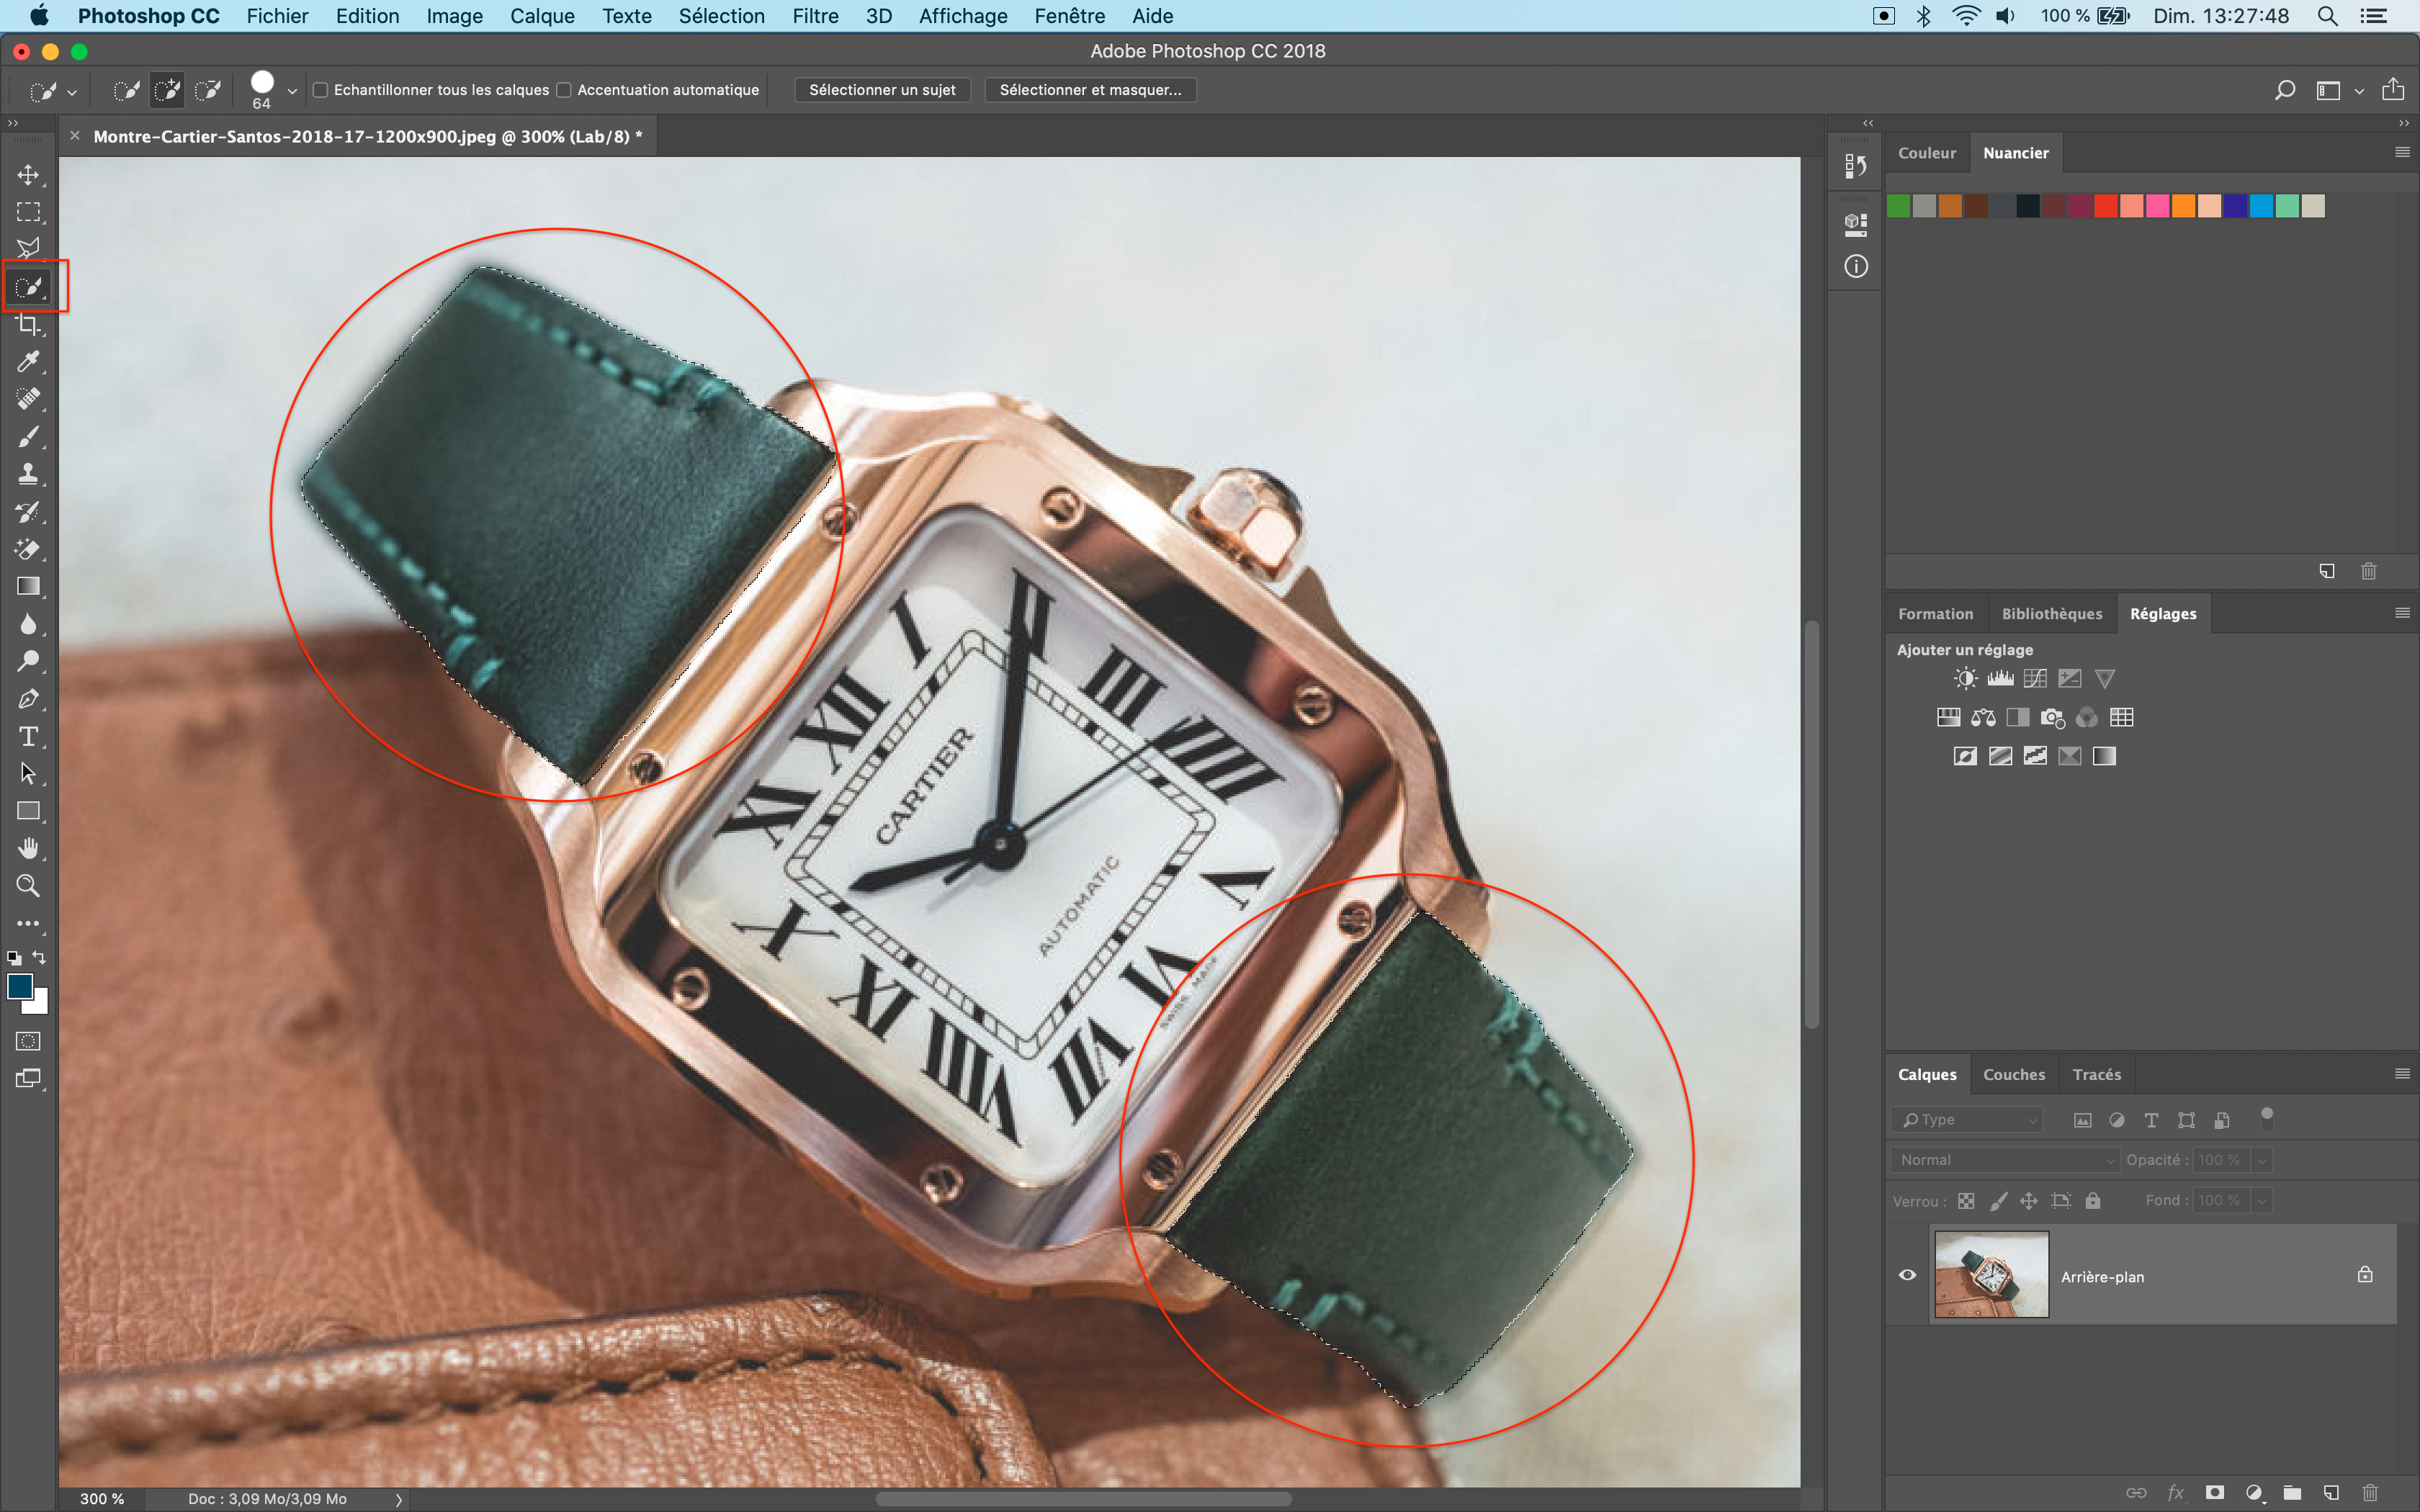
When you have made the selection of the bracelet, right click and select " Layer by Copy "
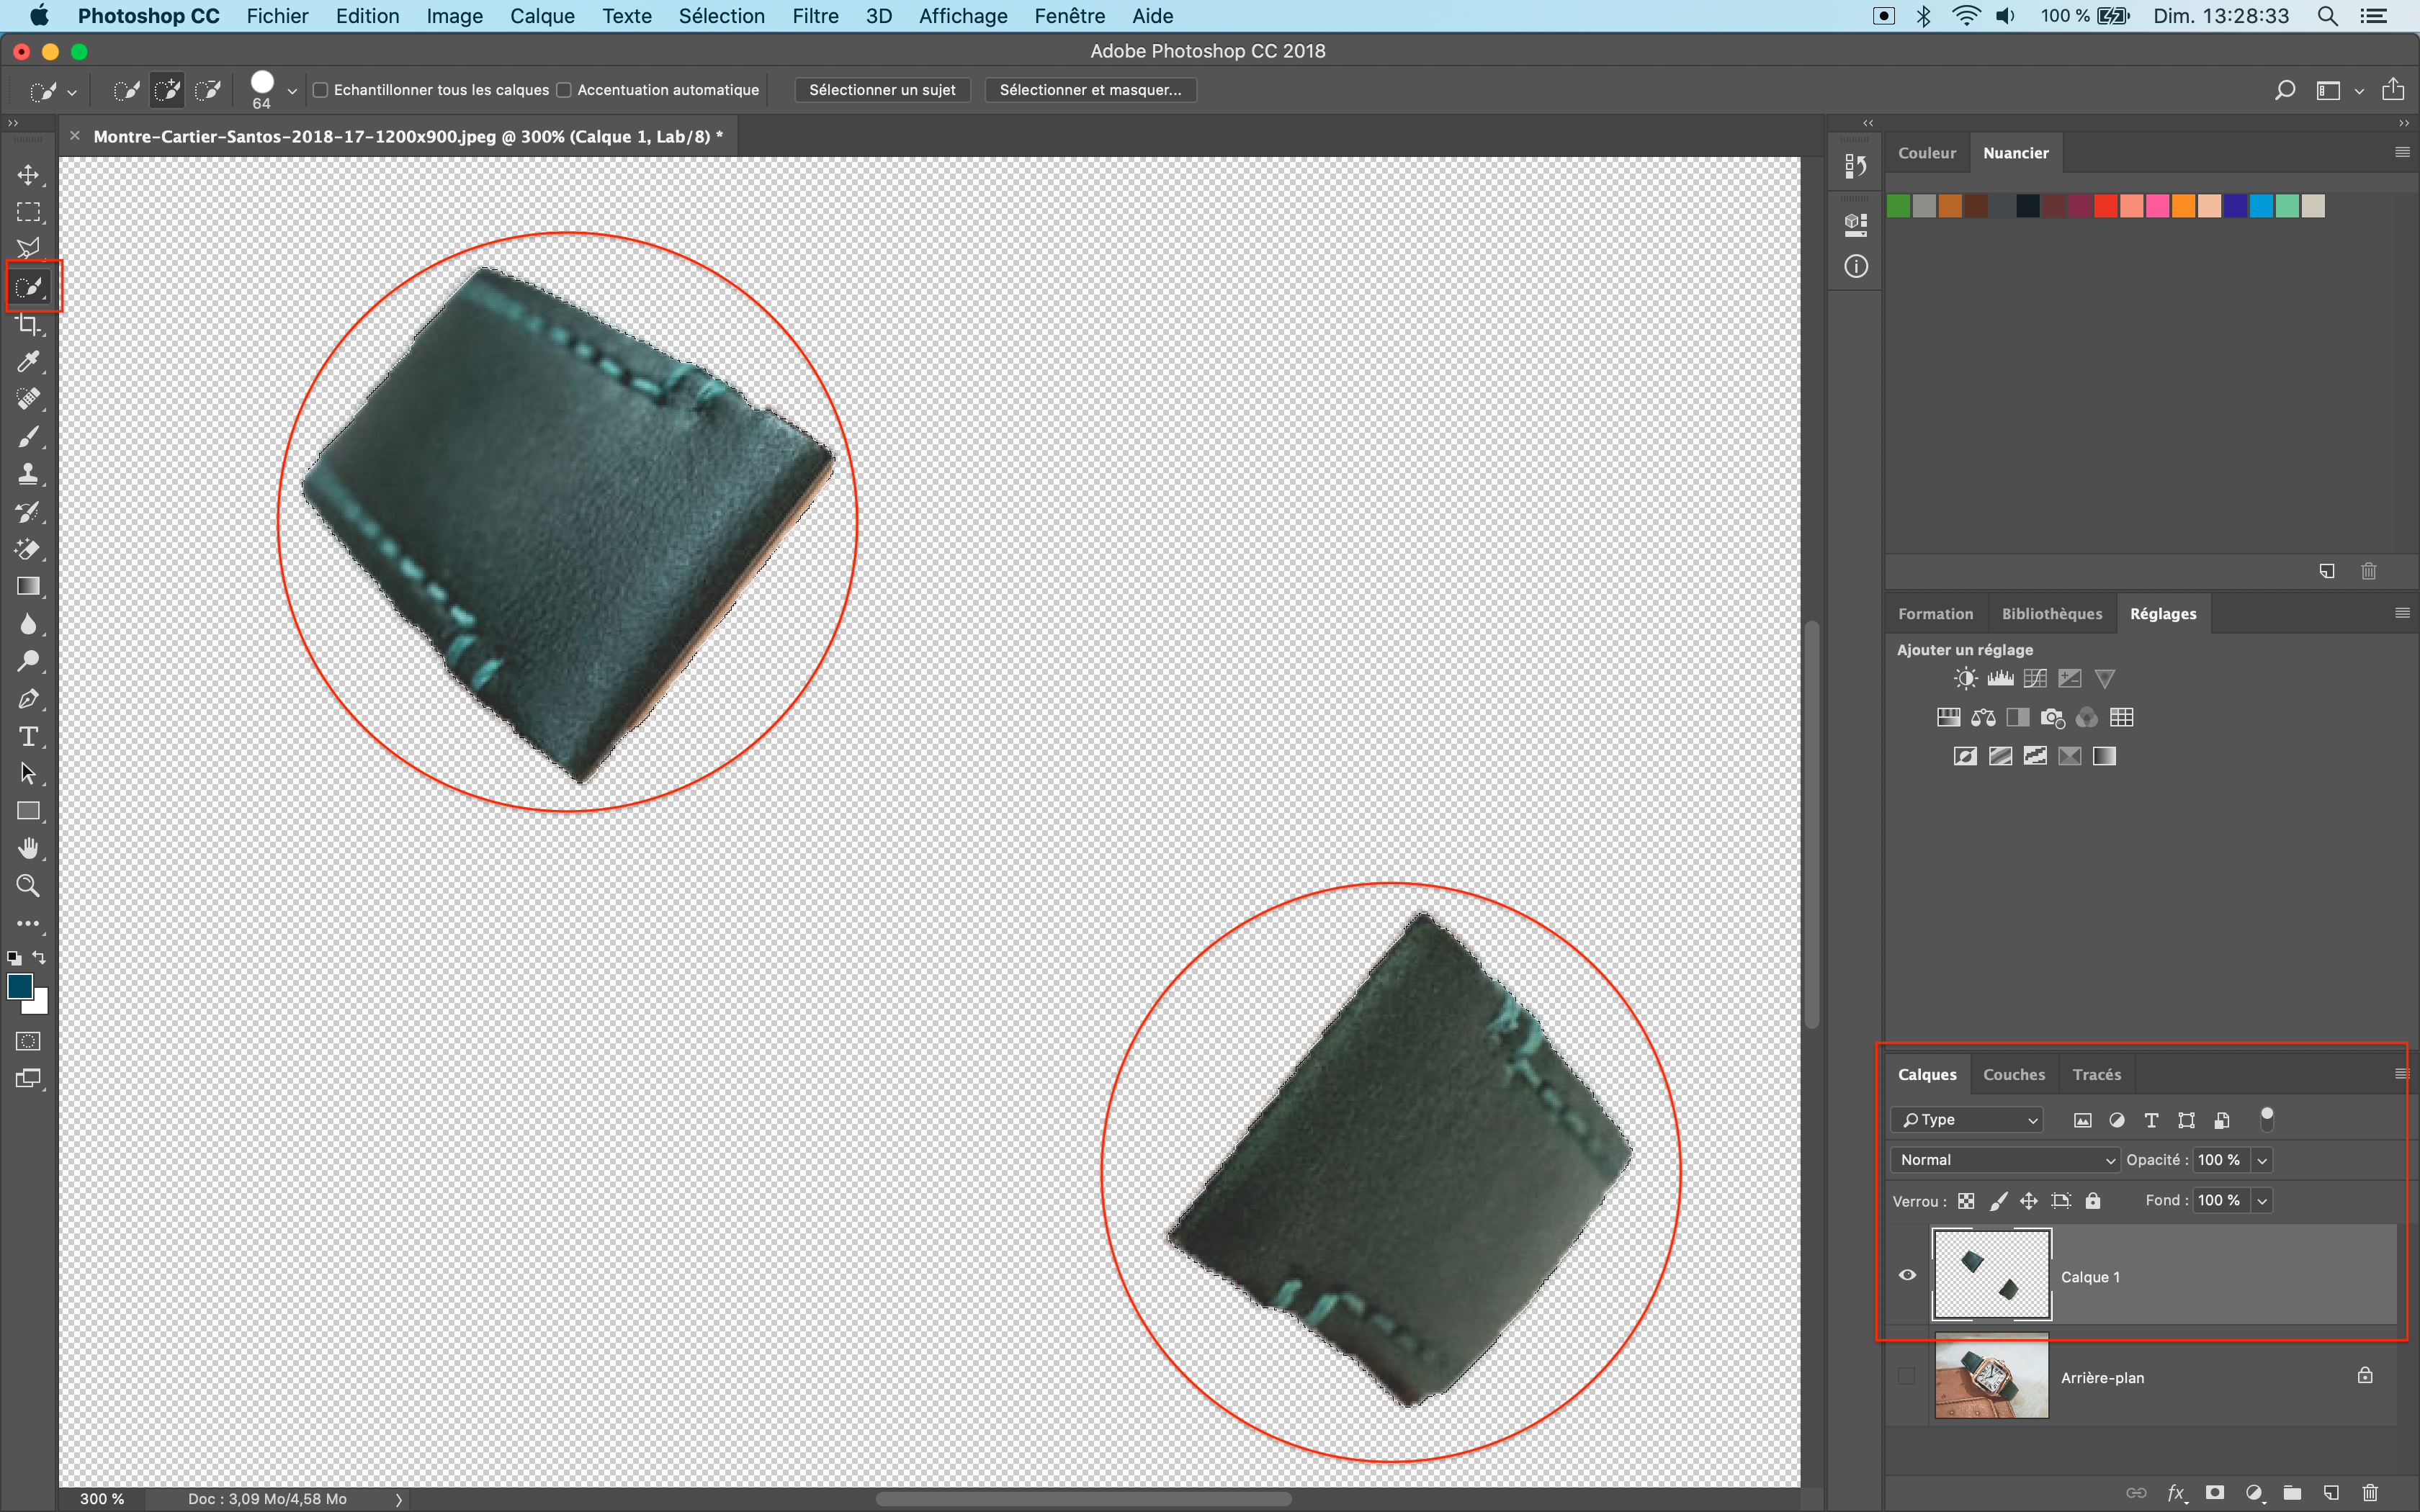
A new layer is then added to the list of layers.
Deselect the background layer and then select the new layer.
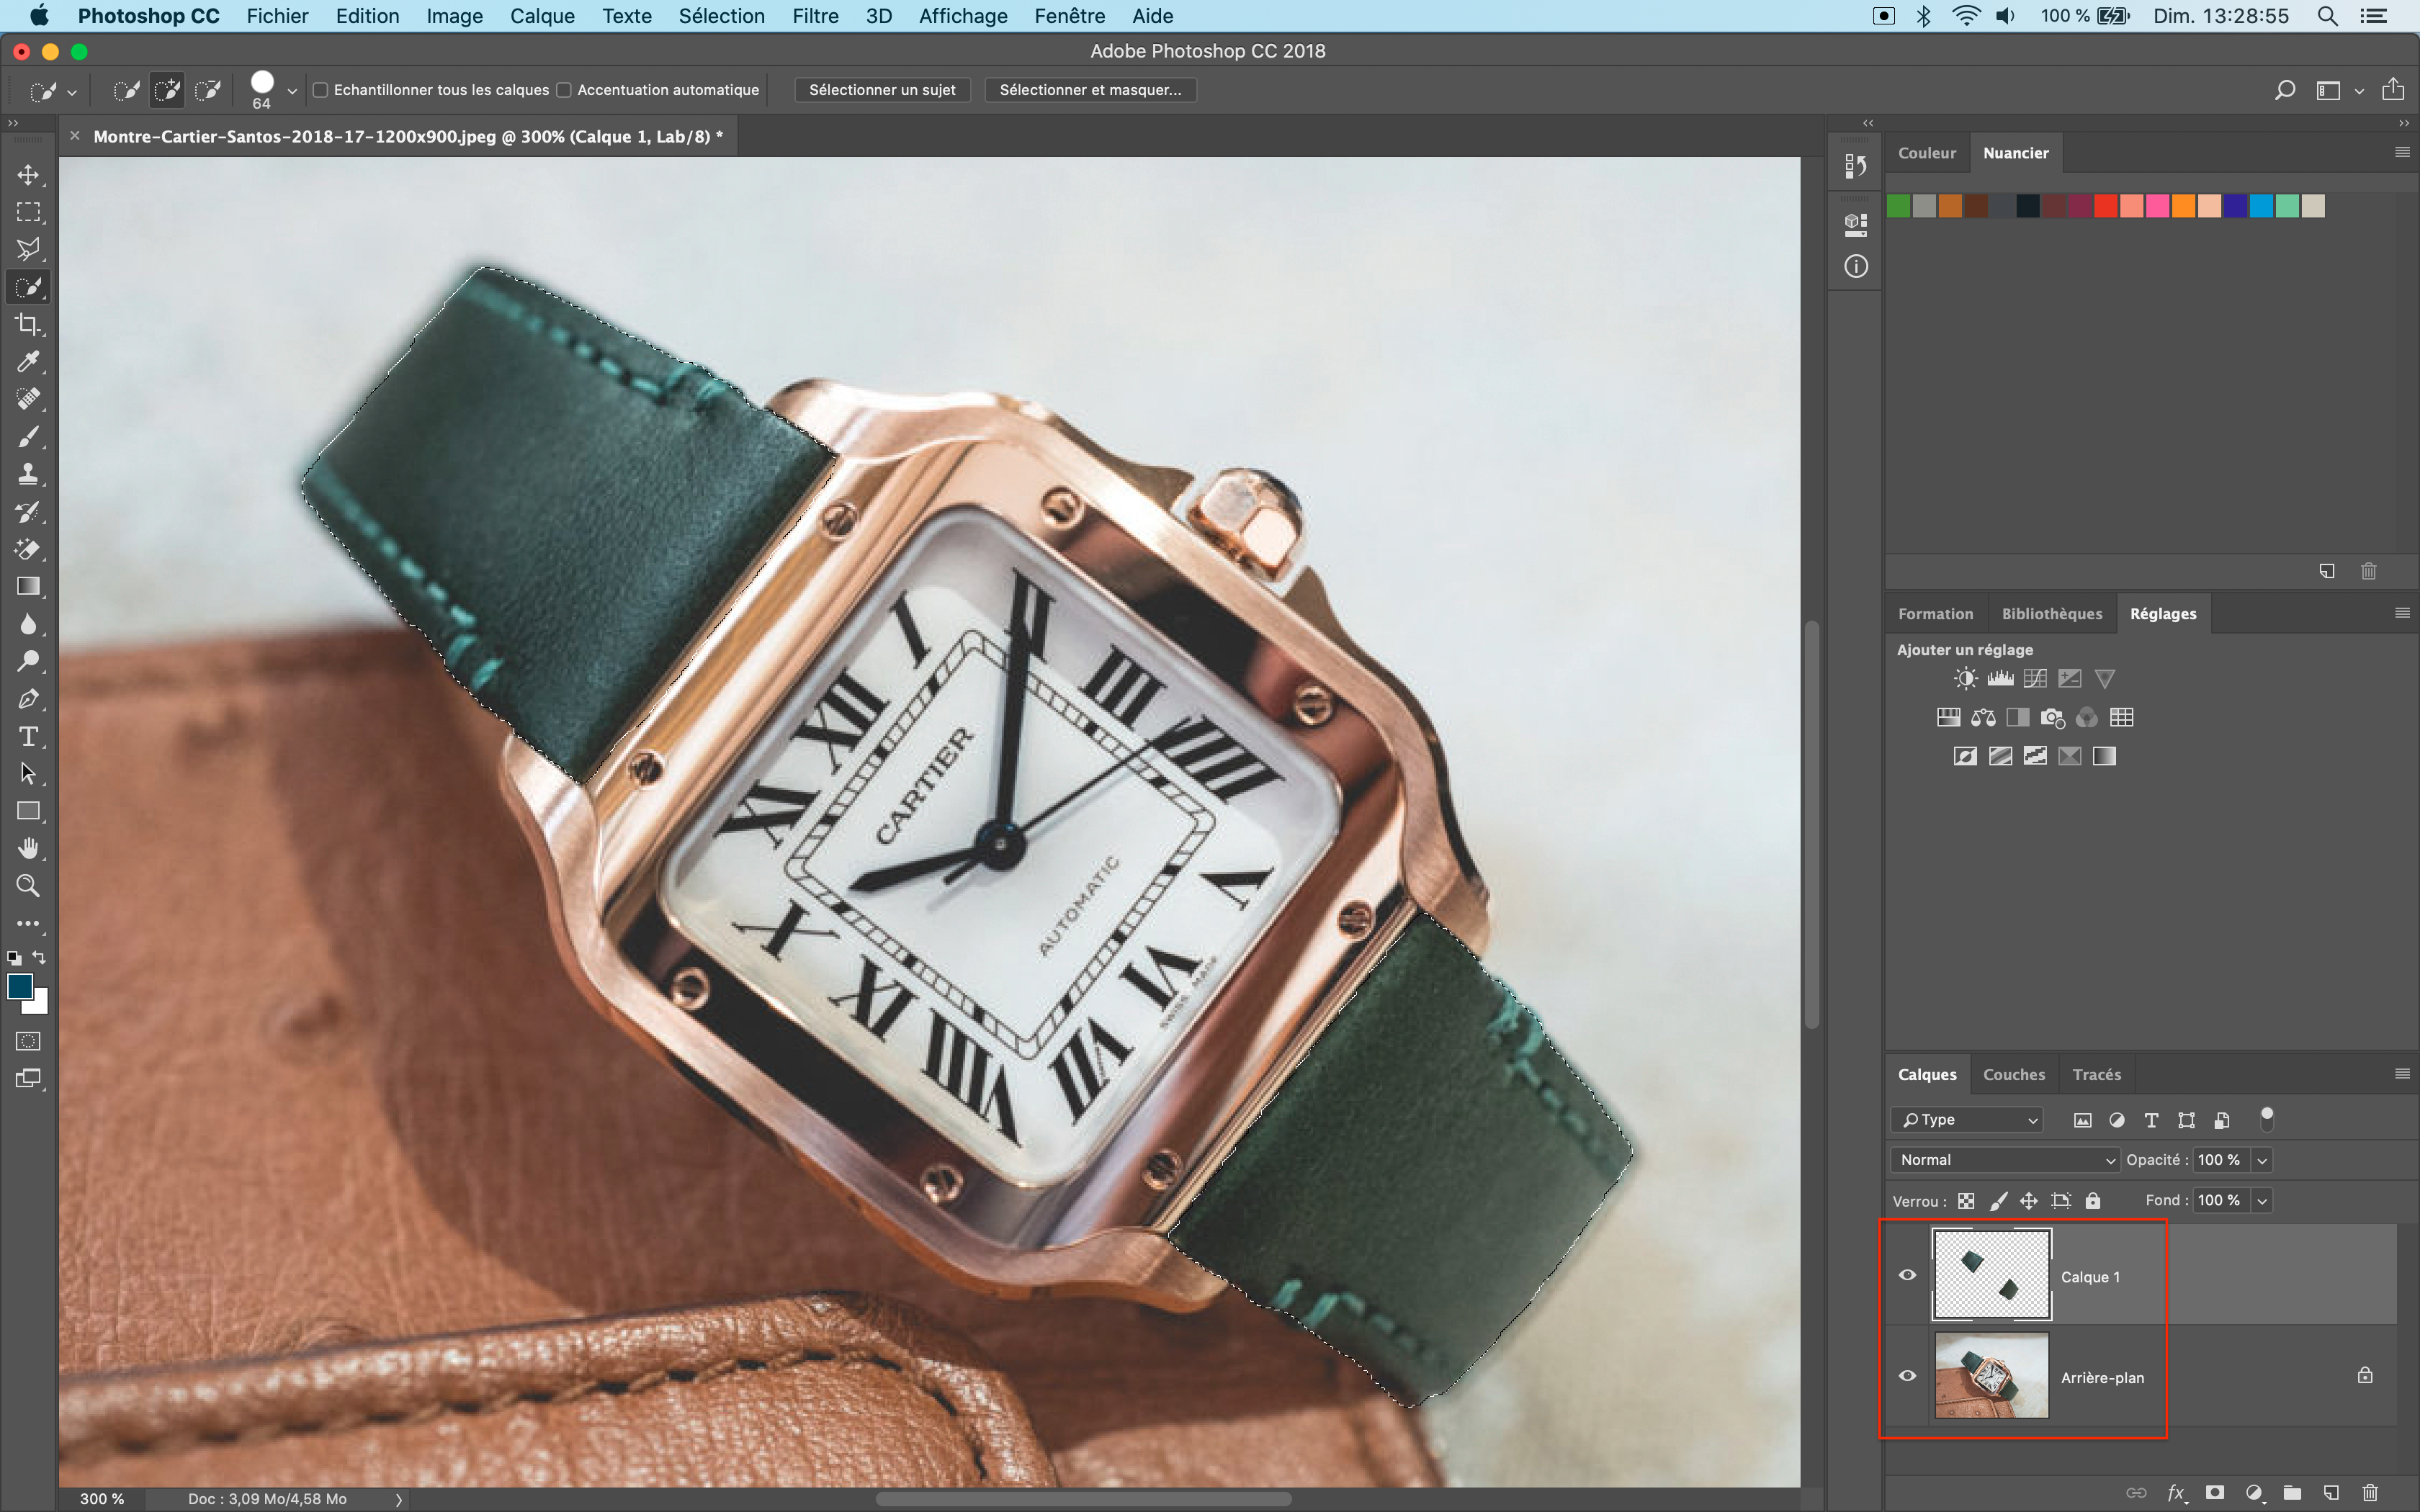
In the " Selection " menu, click on " Select all ".

Then with the " Quick Selection " tool, re-select the two parts of the bracelet.
Re-select the background
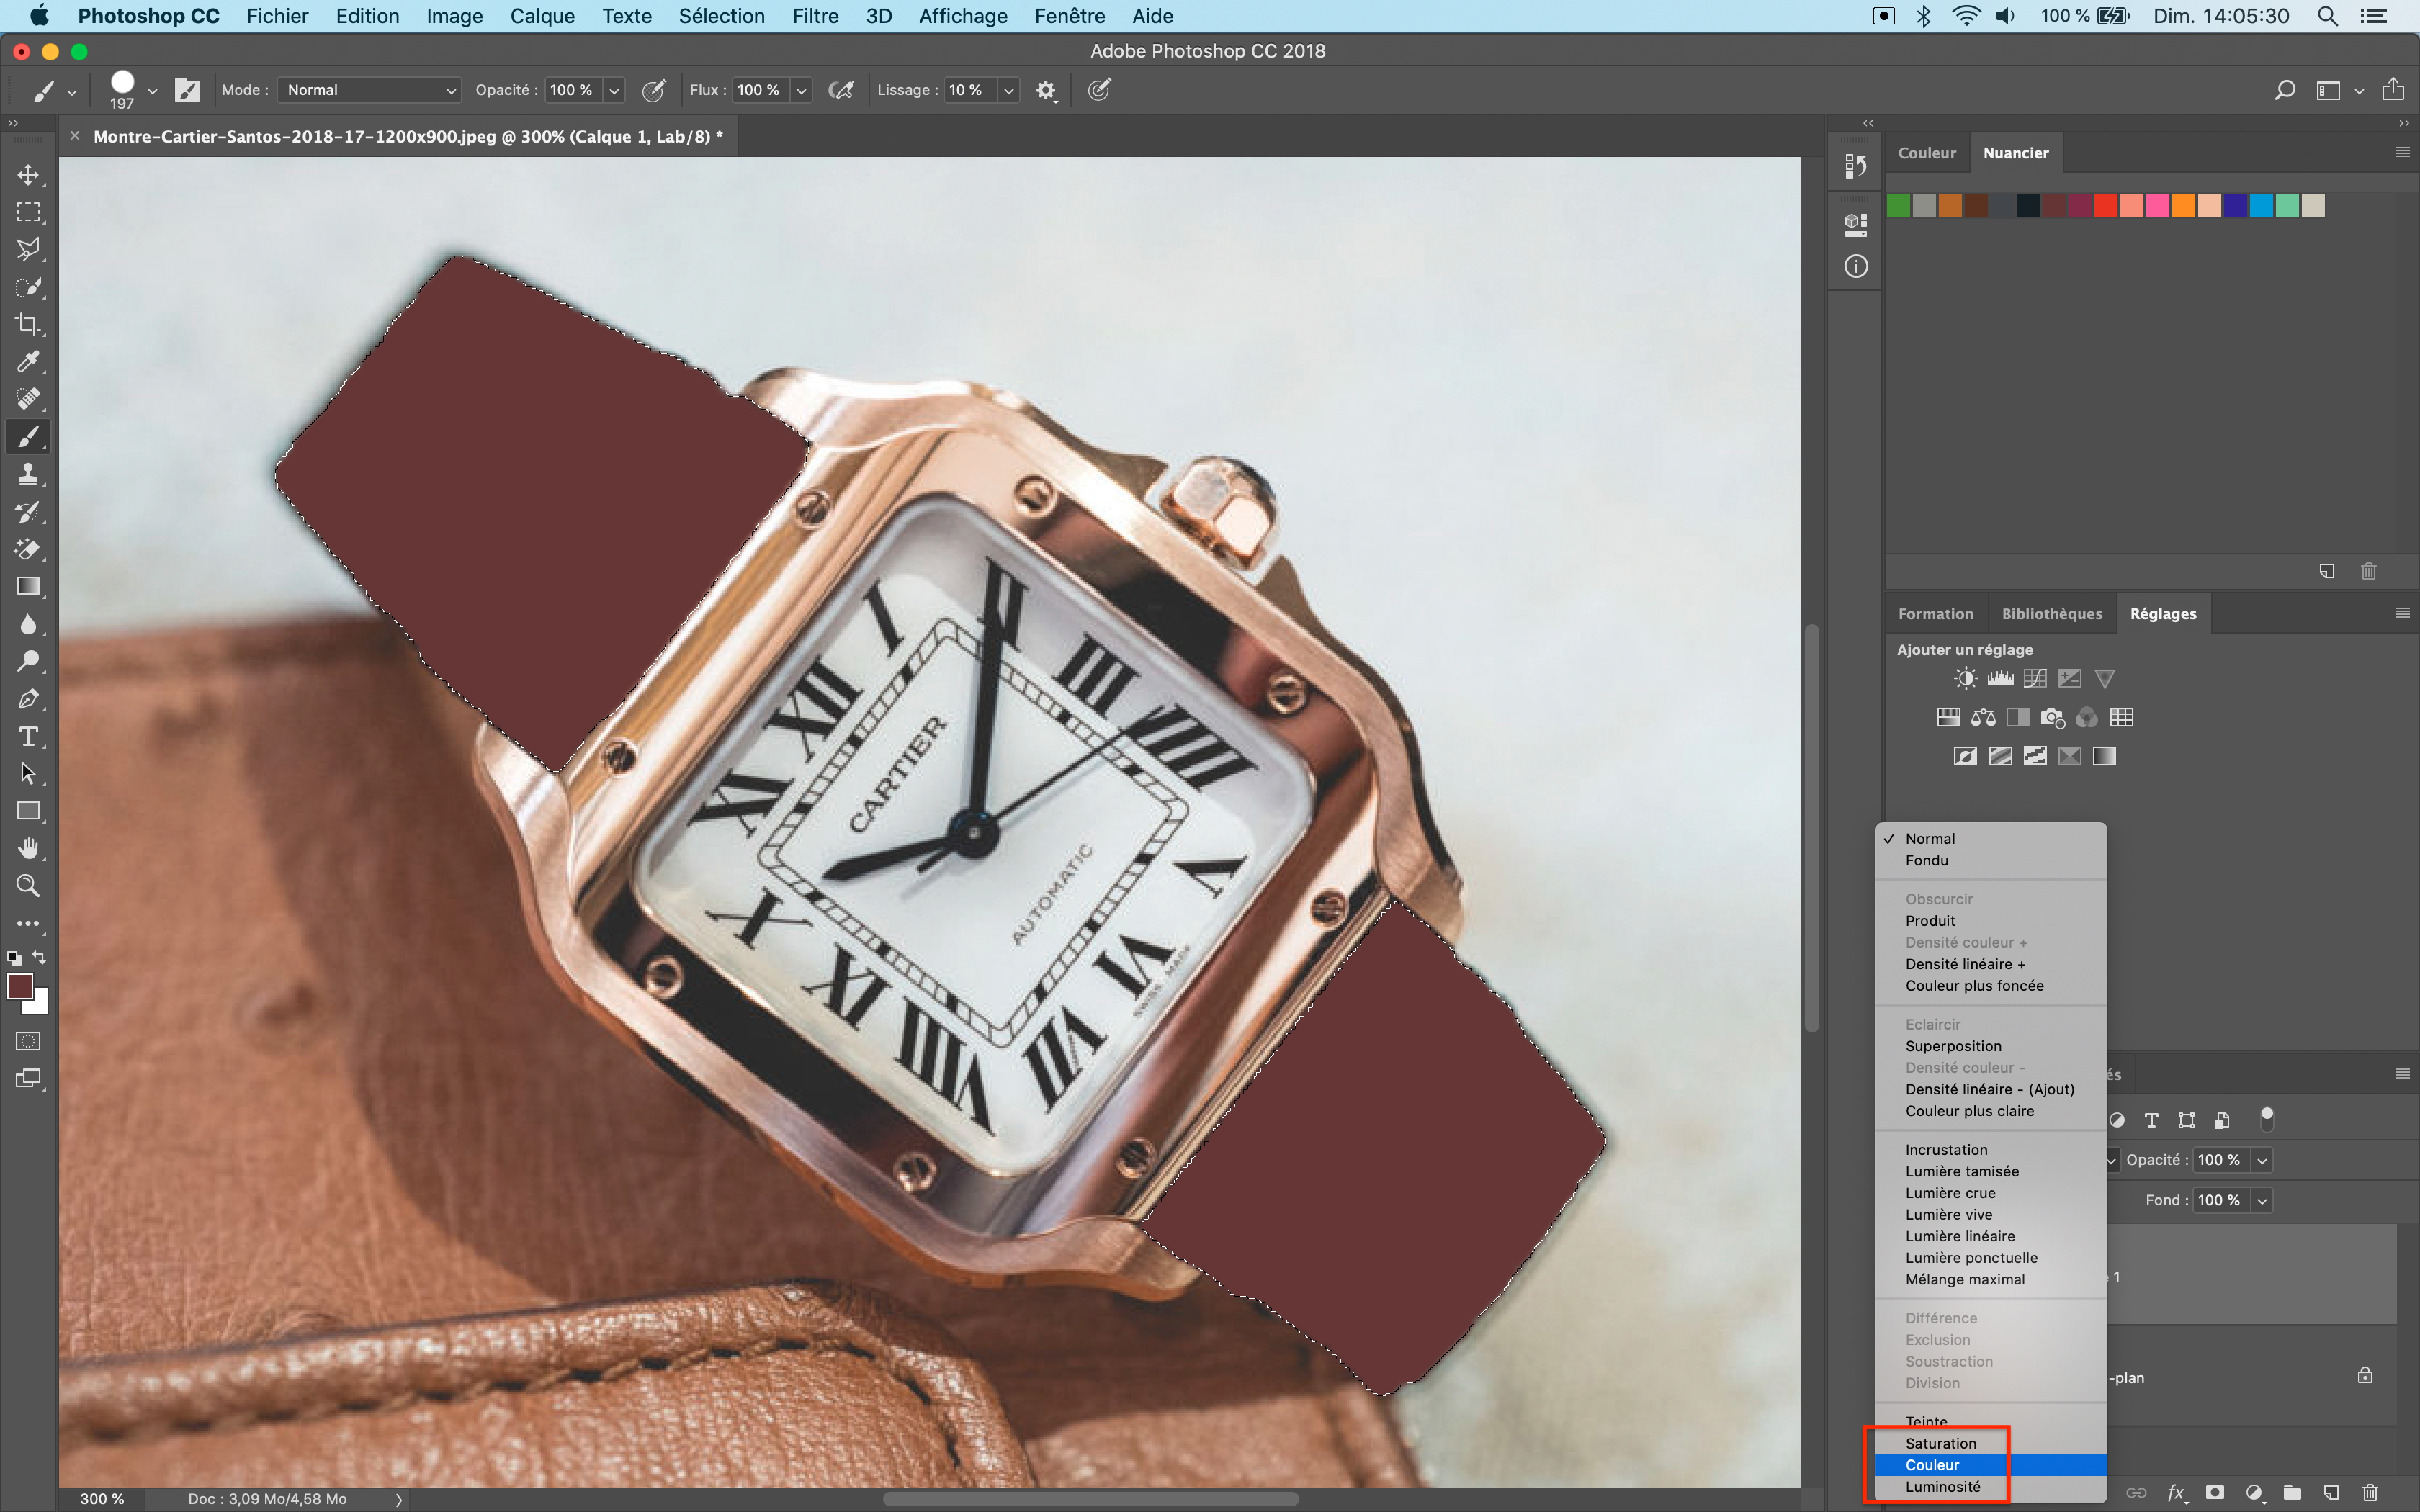
Select the Brush tool, then choose a color from the swatch. Choose a relatively large brush size and color the bracelets.

In the " Layer " tab in the " Define the blend mode for the layer " area ...
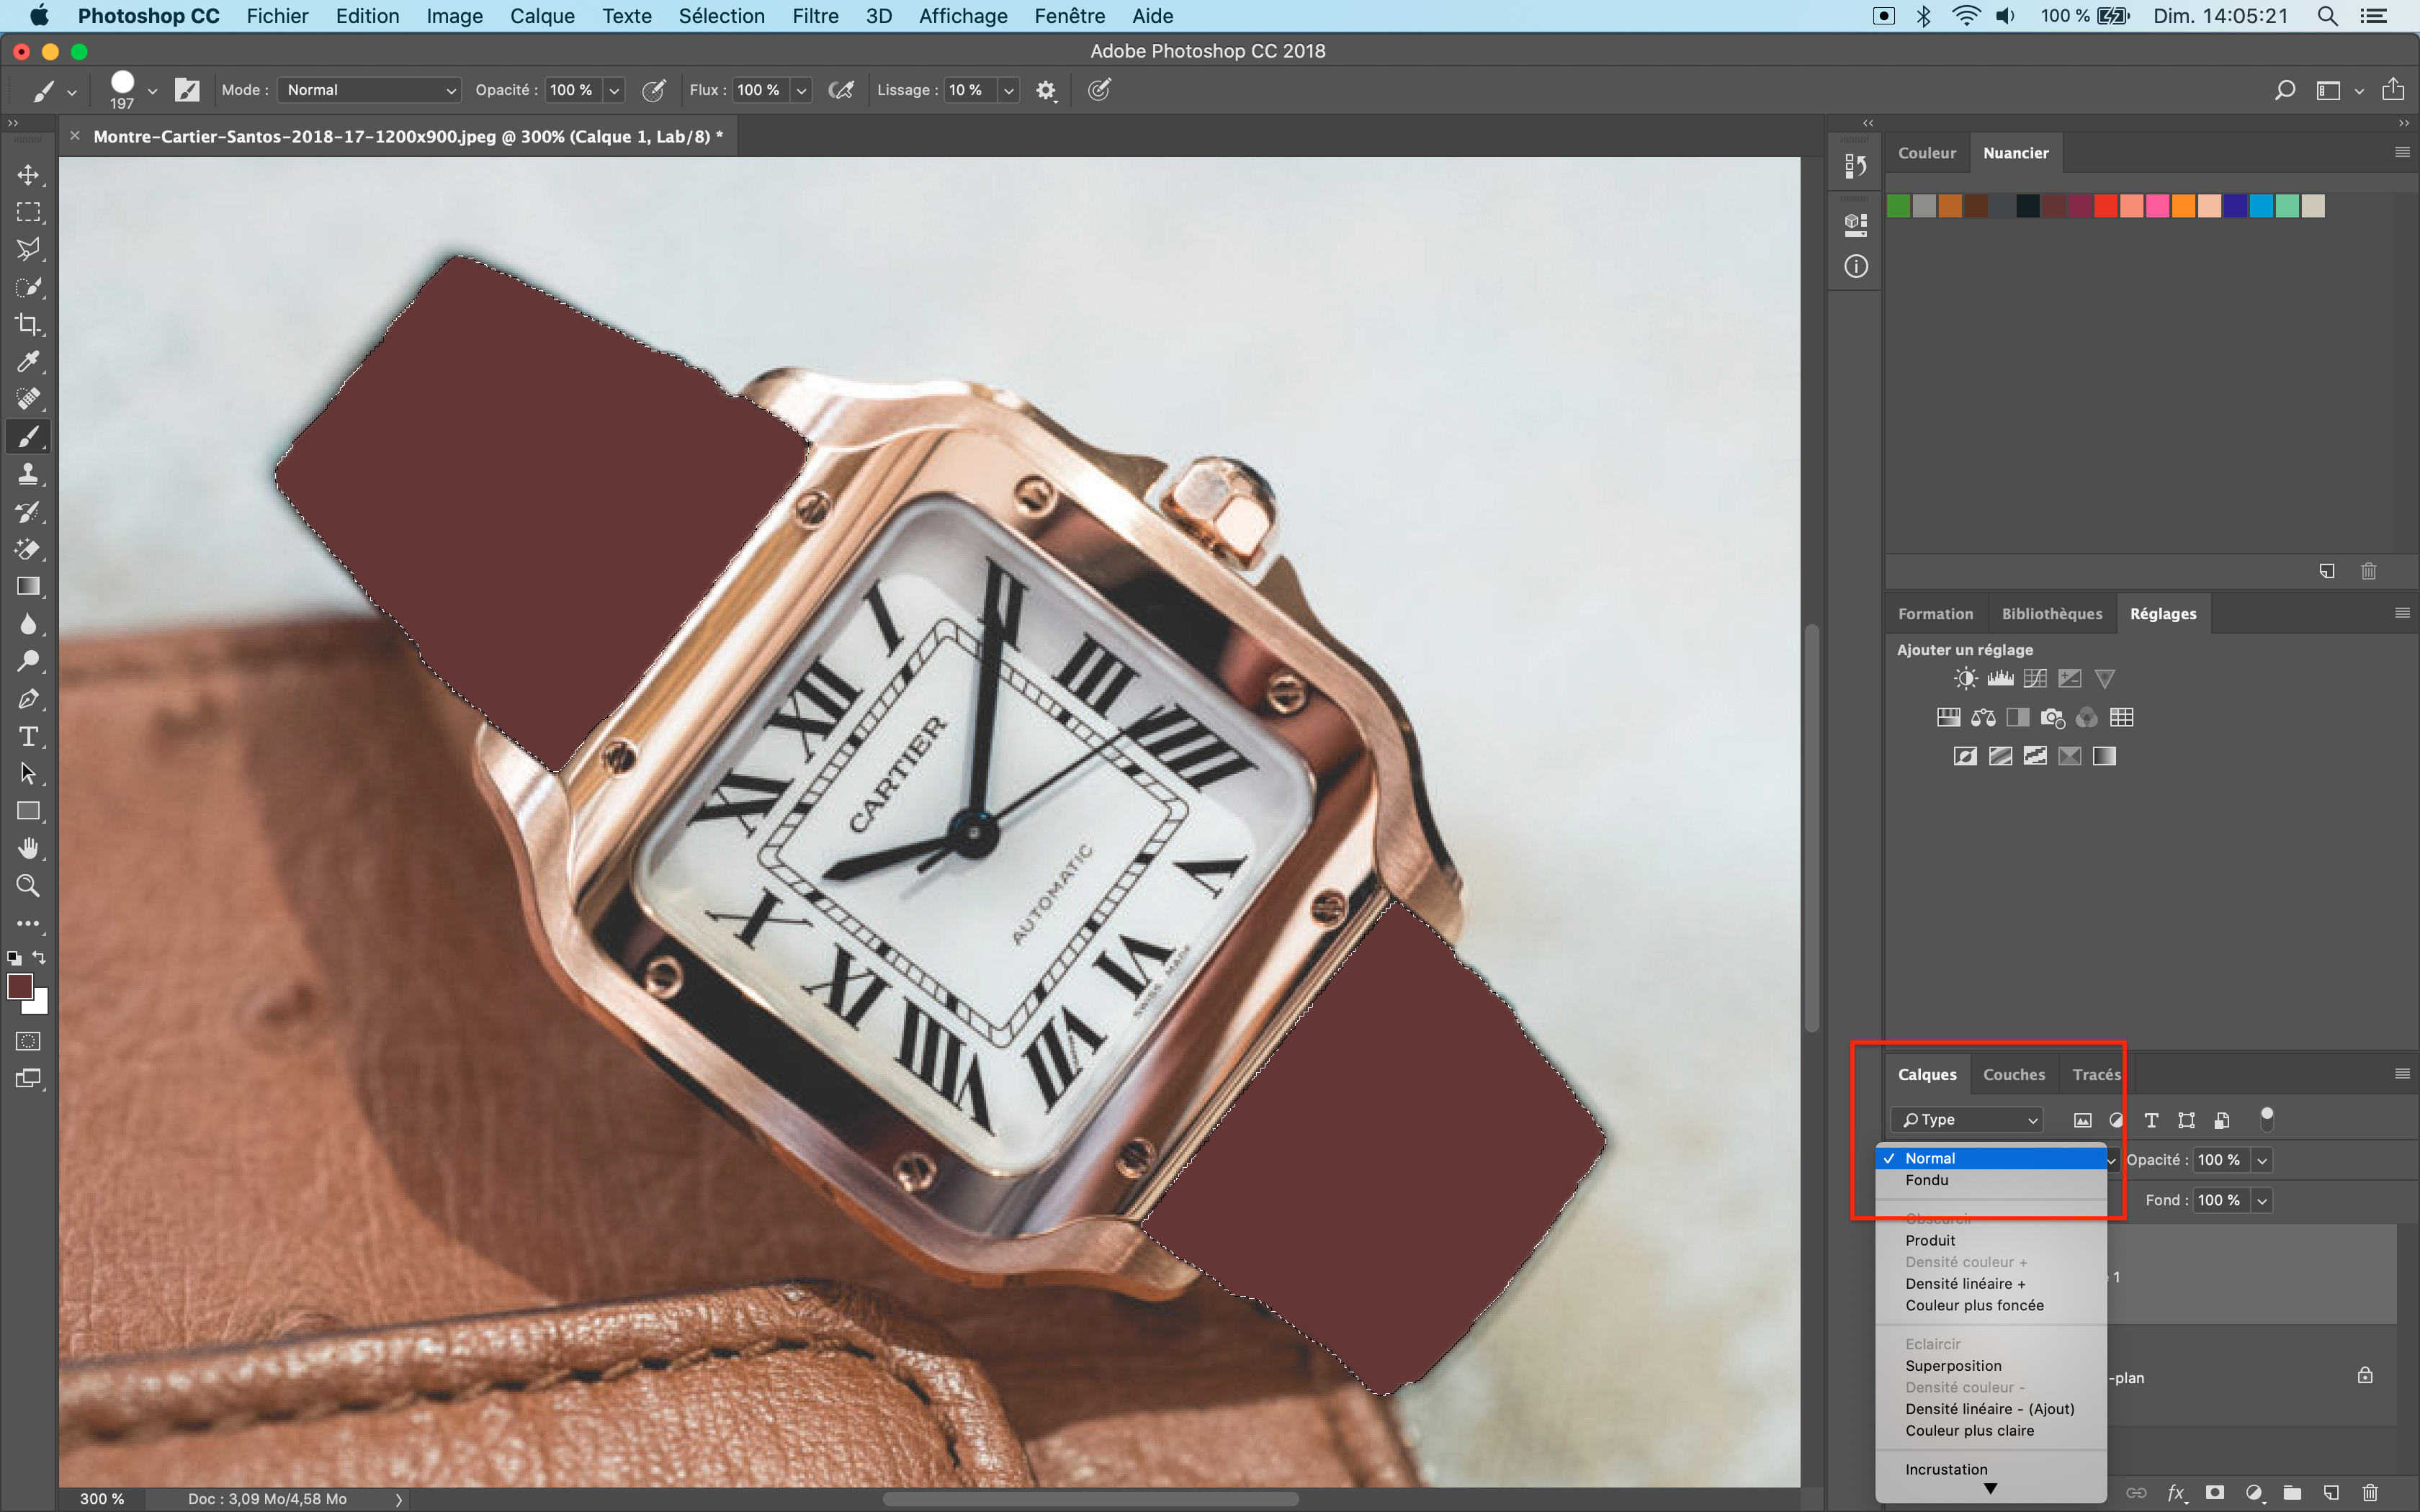
... Select " Color "
The bracelet will regain its texture associated with the color of the color chart
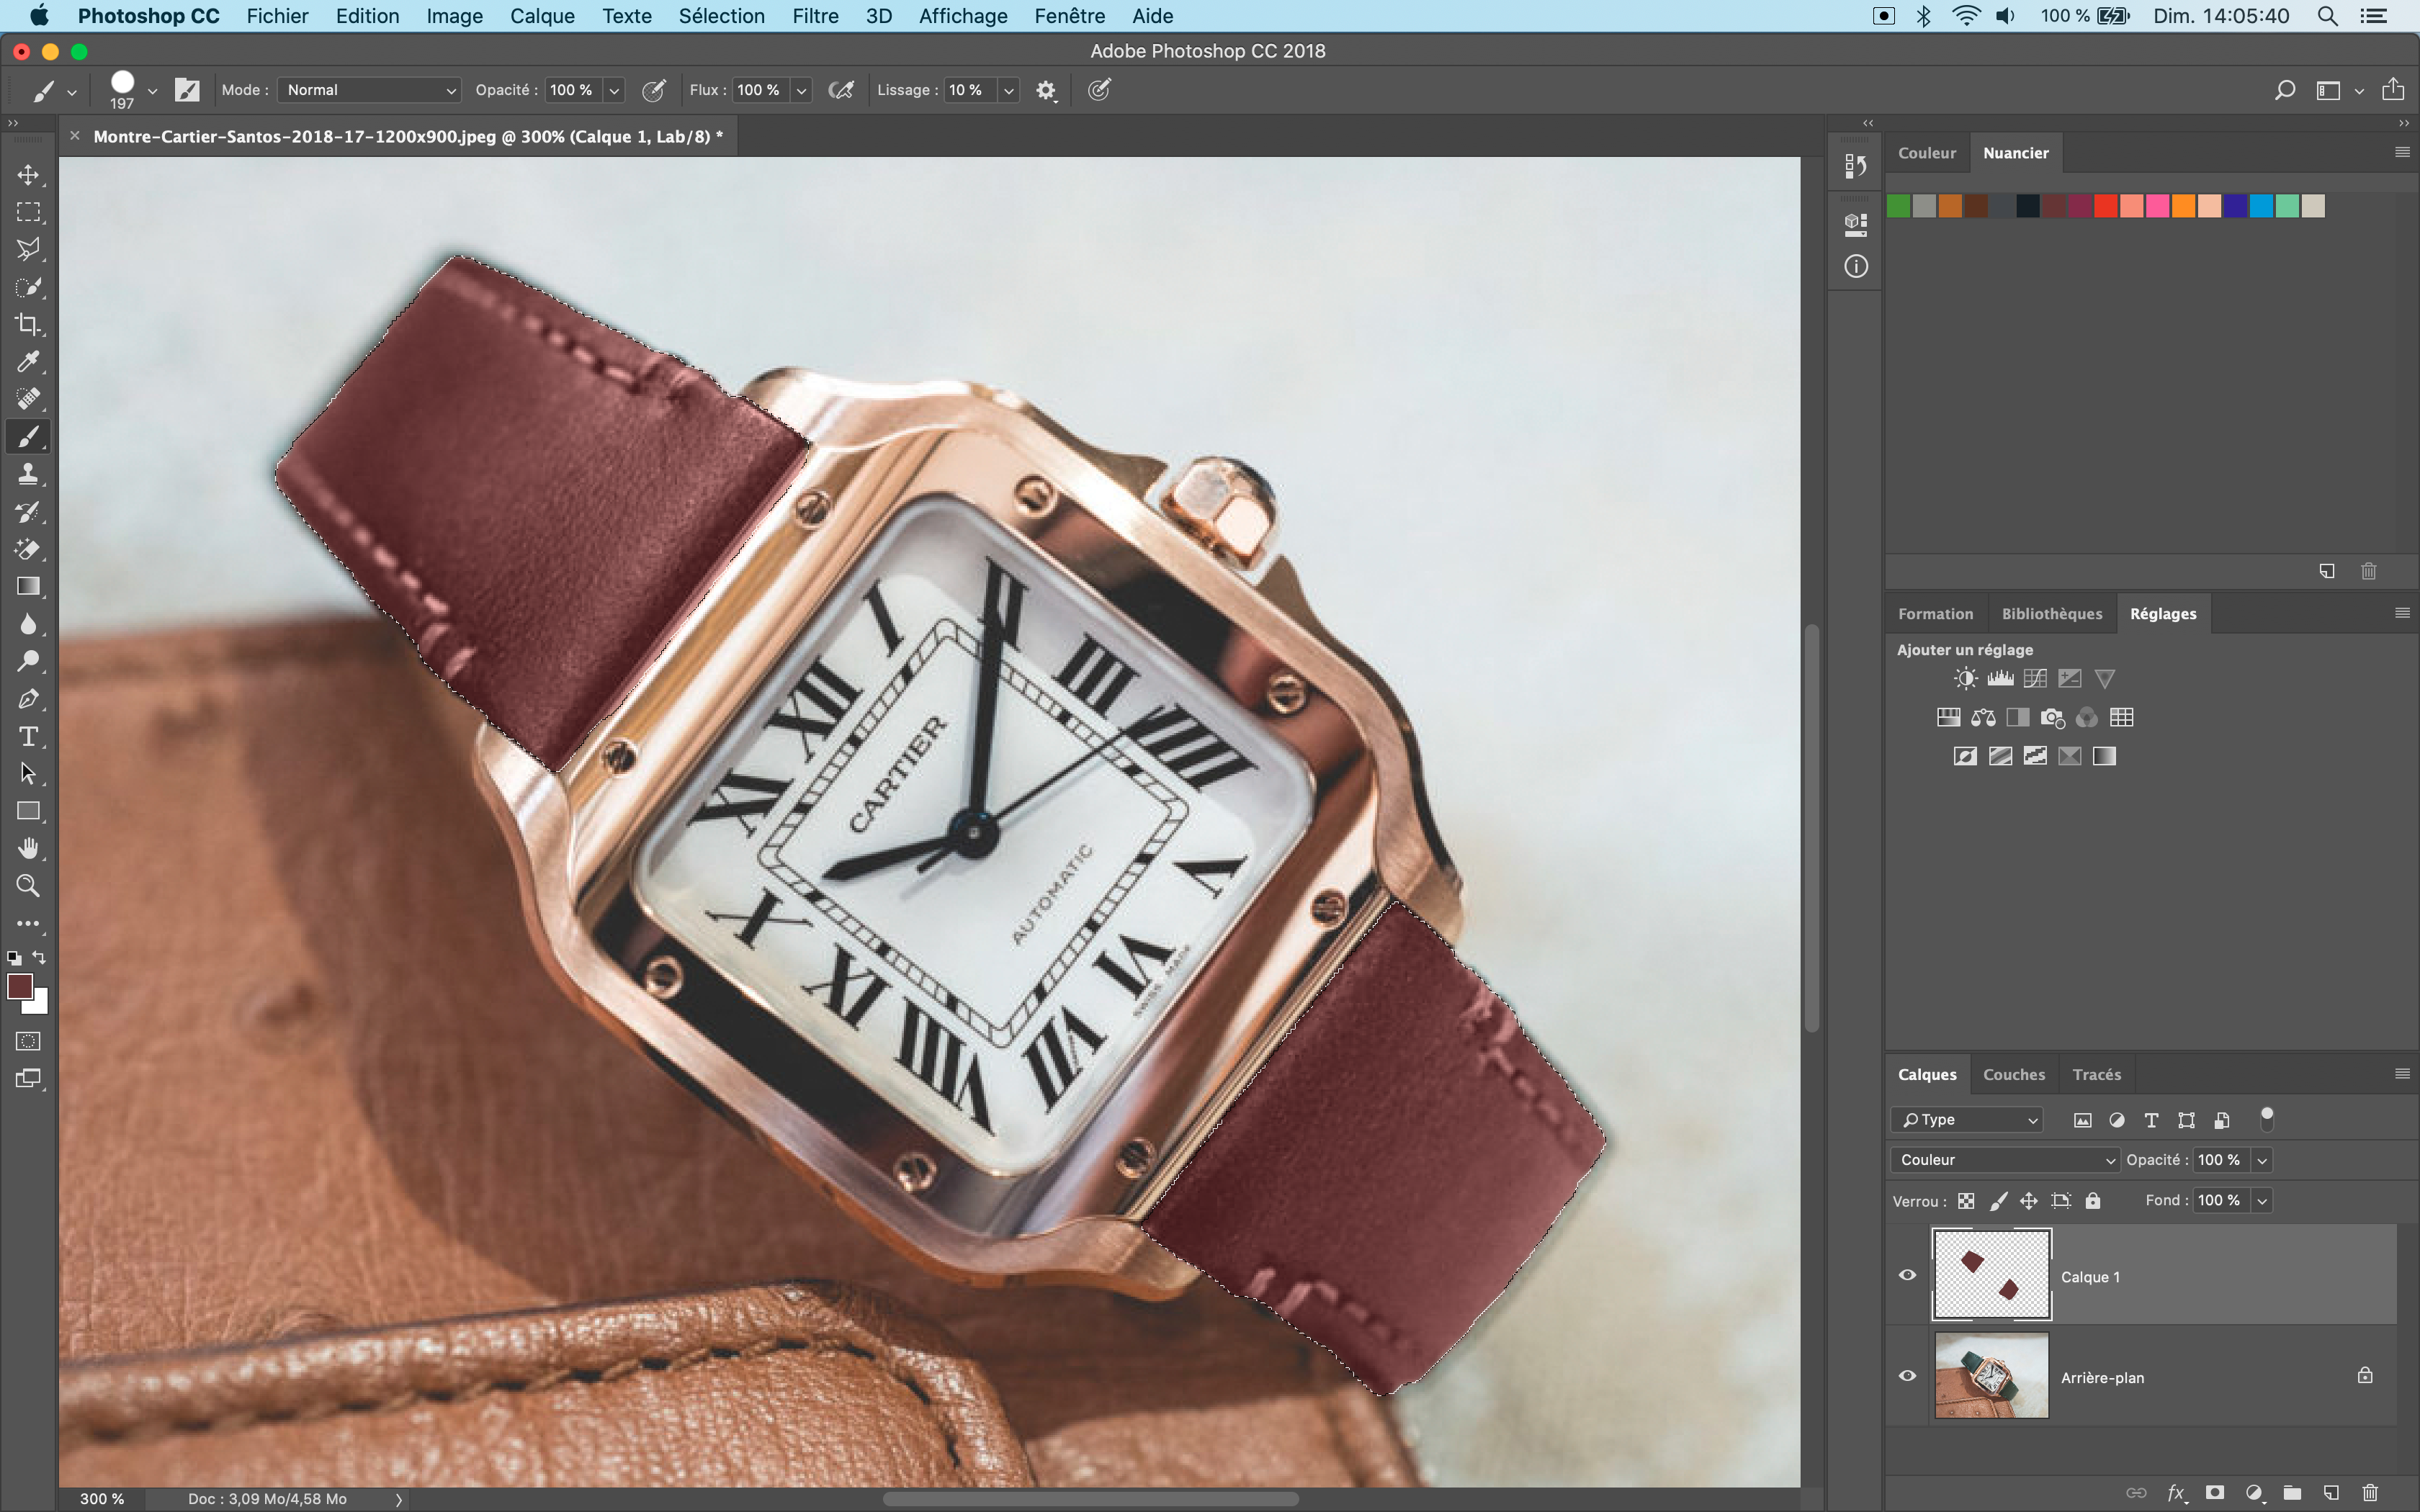
To modify and associate a new color, you just need to use the brush tool and use another color from the swatch.
