Create a color table from a spot color chart measurement
The best way to master the spot colors reproduced by your printing system is to print them, measure them and then create a color table from the measured values.
As you probably know, your printing system is not able to reproduce all the colors in your reference color chart.
But how do you get your customers or creatives, color tables that will accurately reflect what the colors will be in the final print?
The method we propose consists of generating charts made up of spot colors from your color chart (PANTONE® for example), printing them under normal conditions and then measuring them to create a color table that will serve as a reference later.
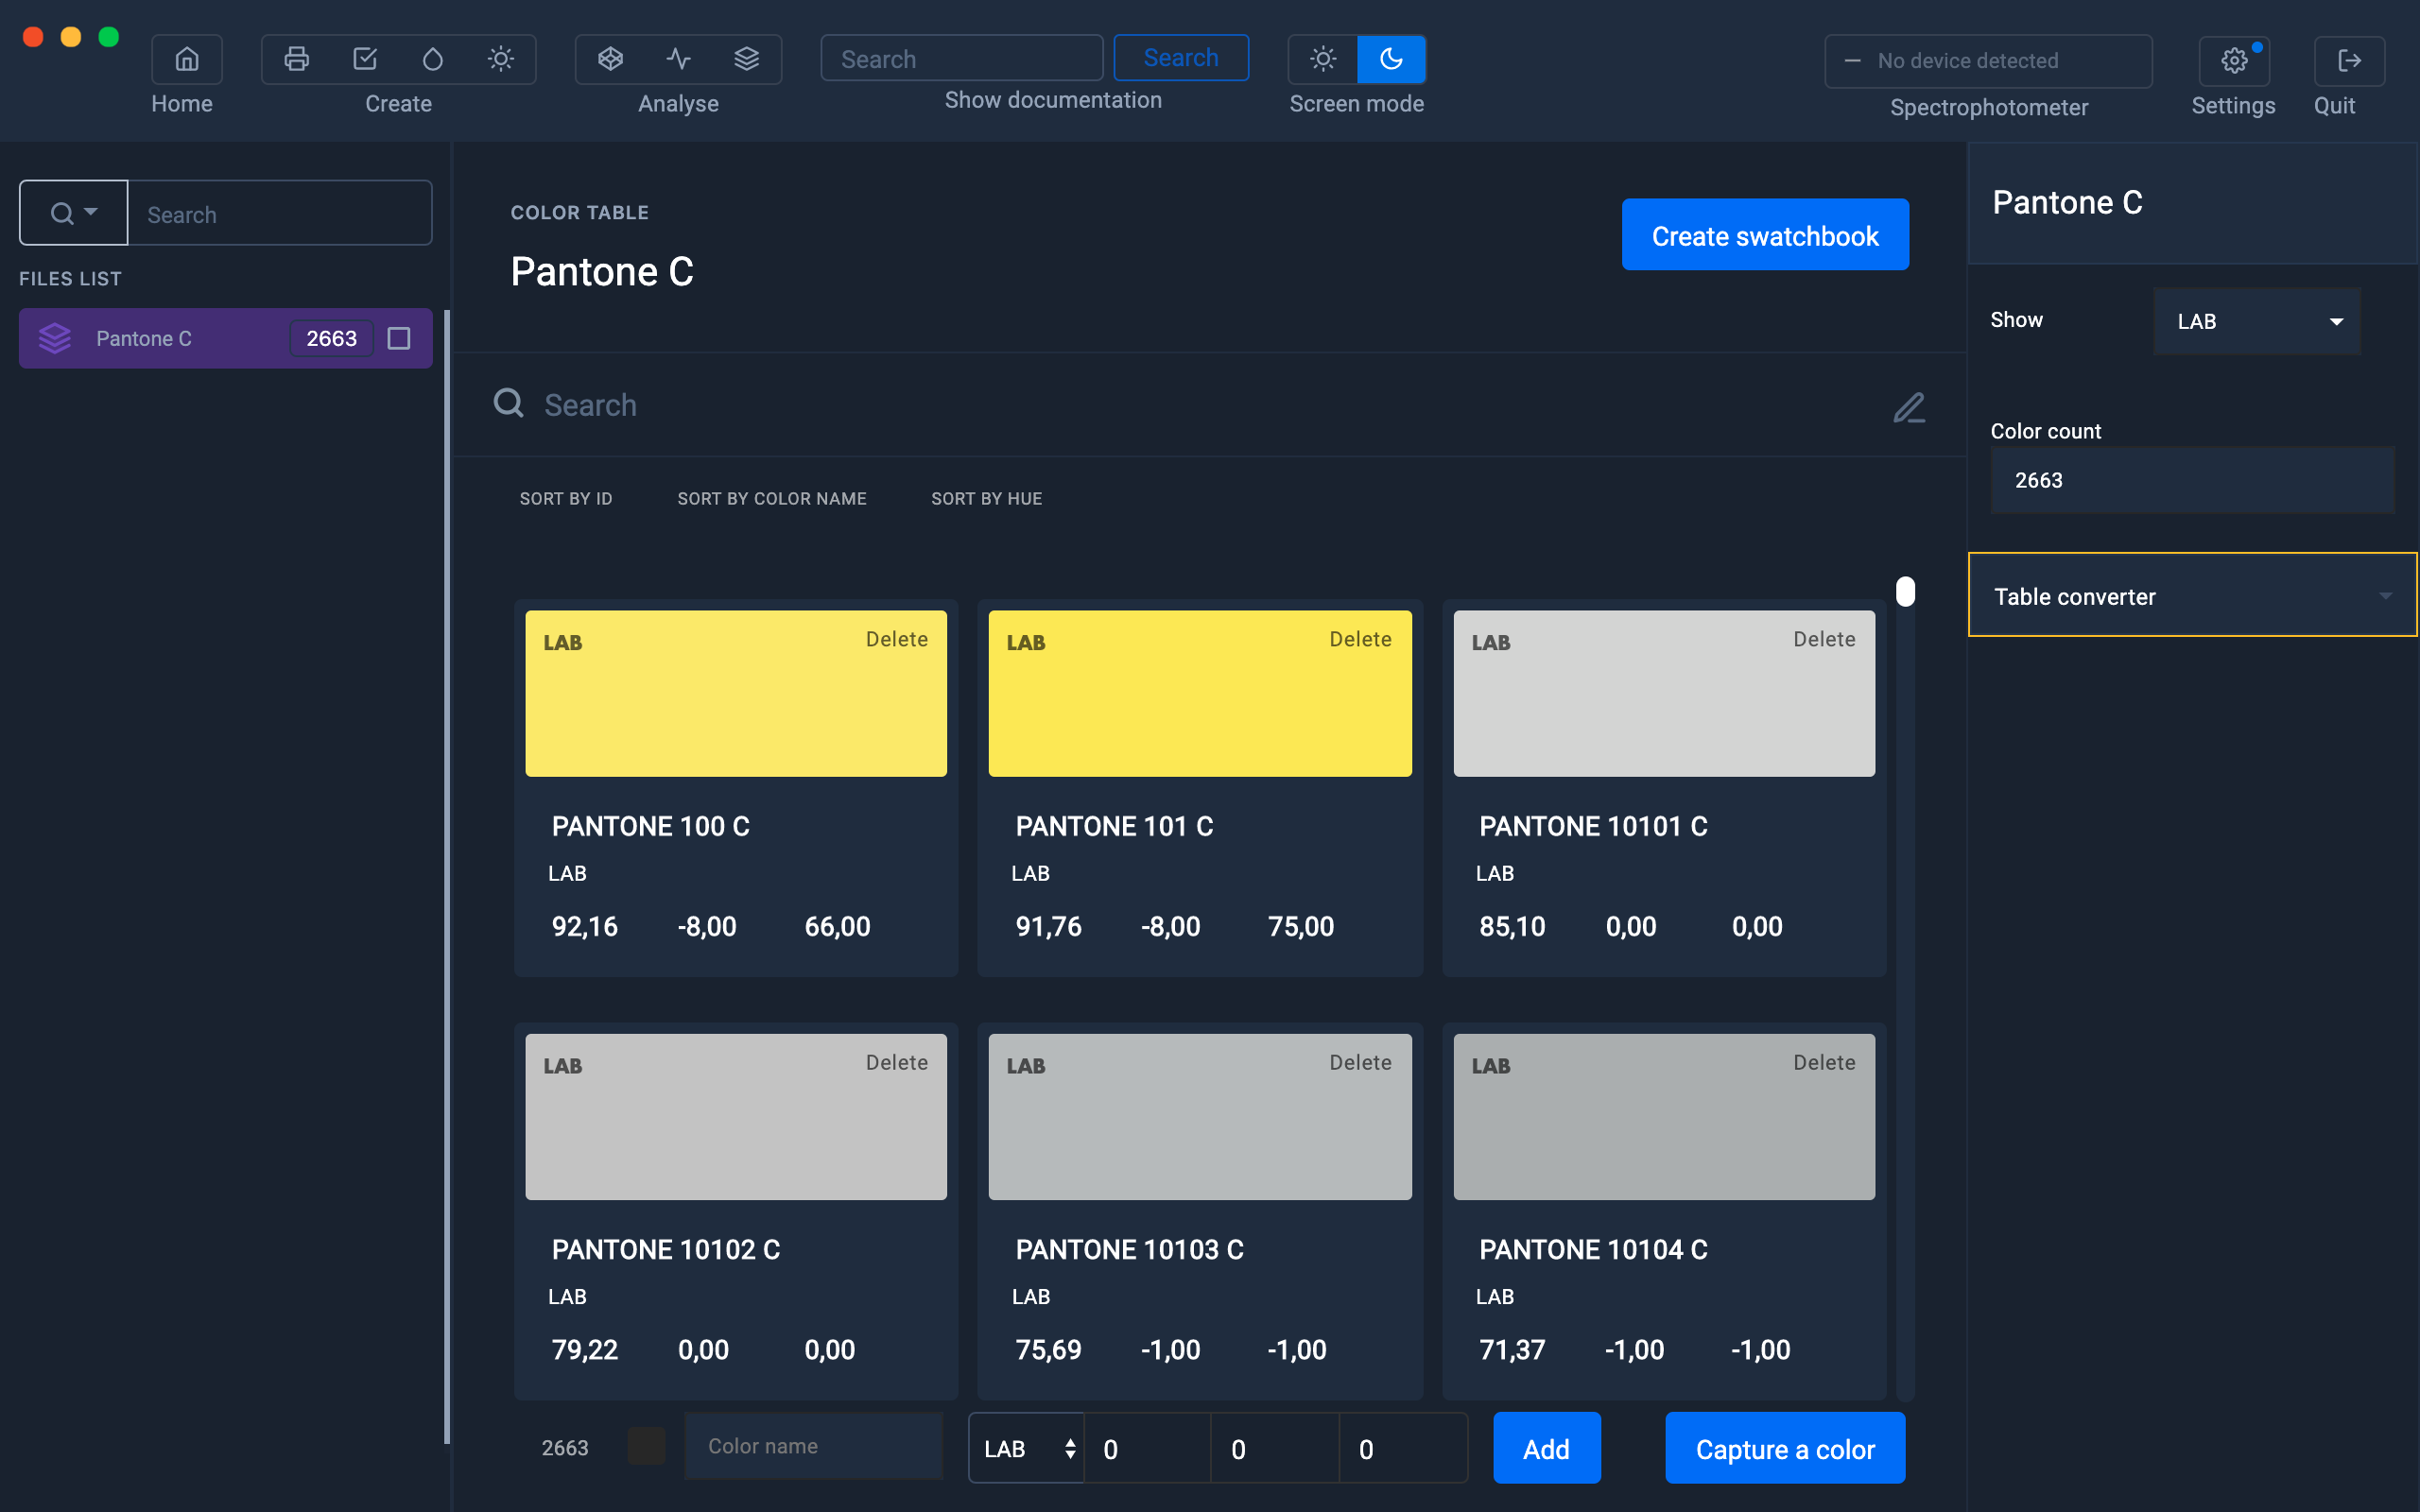
Import of color chart
Let's start by importing a color chart (for example PANTONE®) with File> Open file.
Select the file for your spot color table.
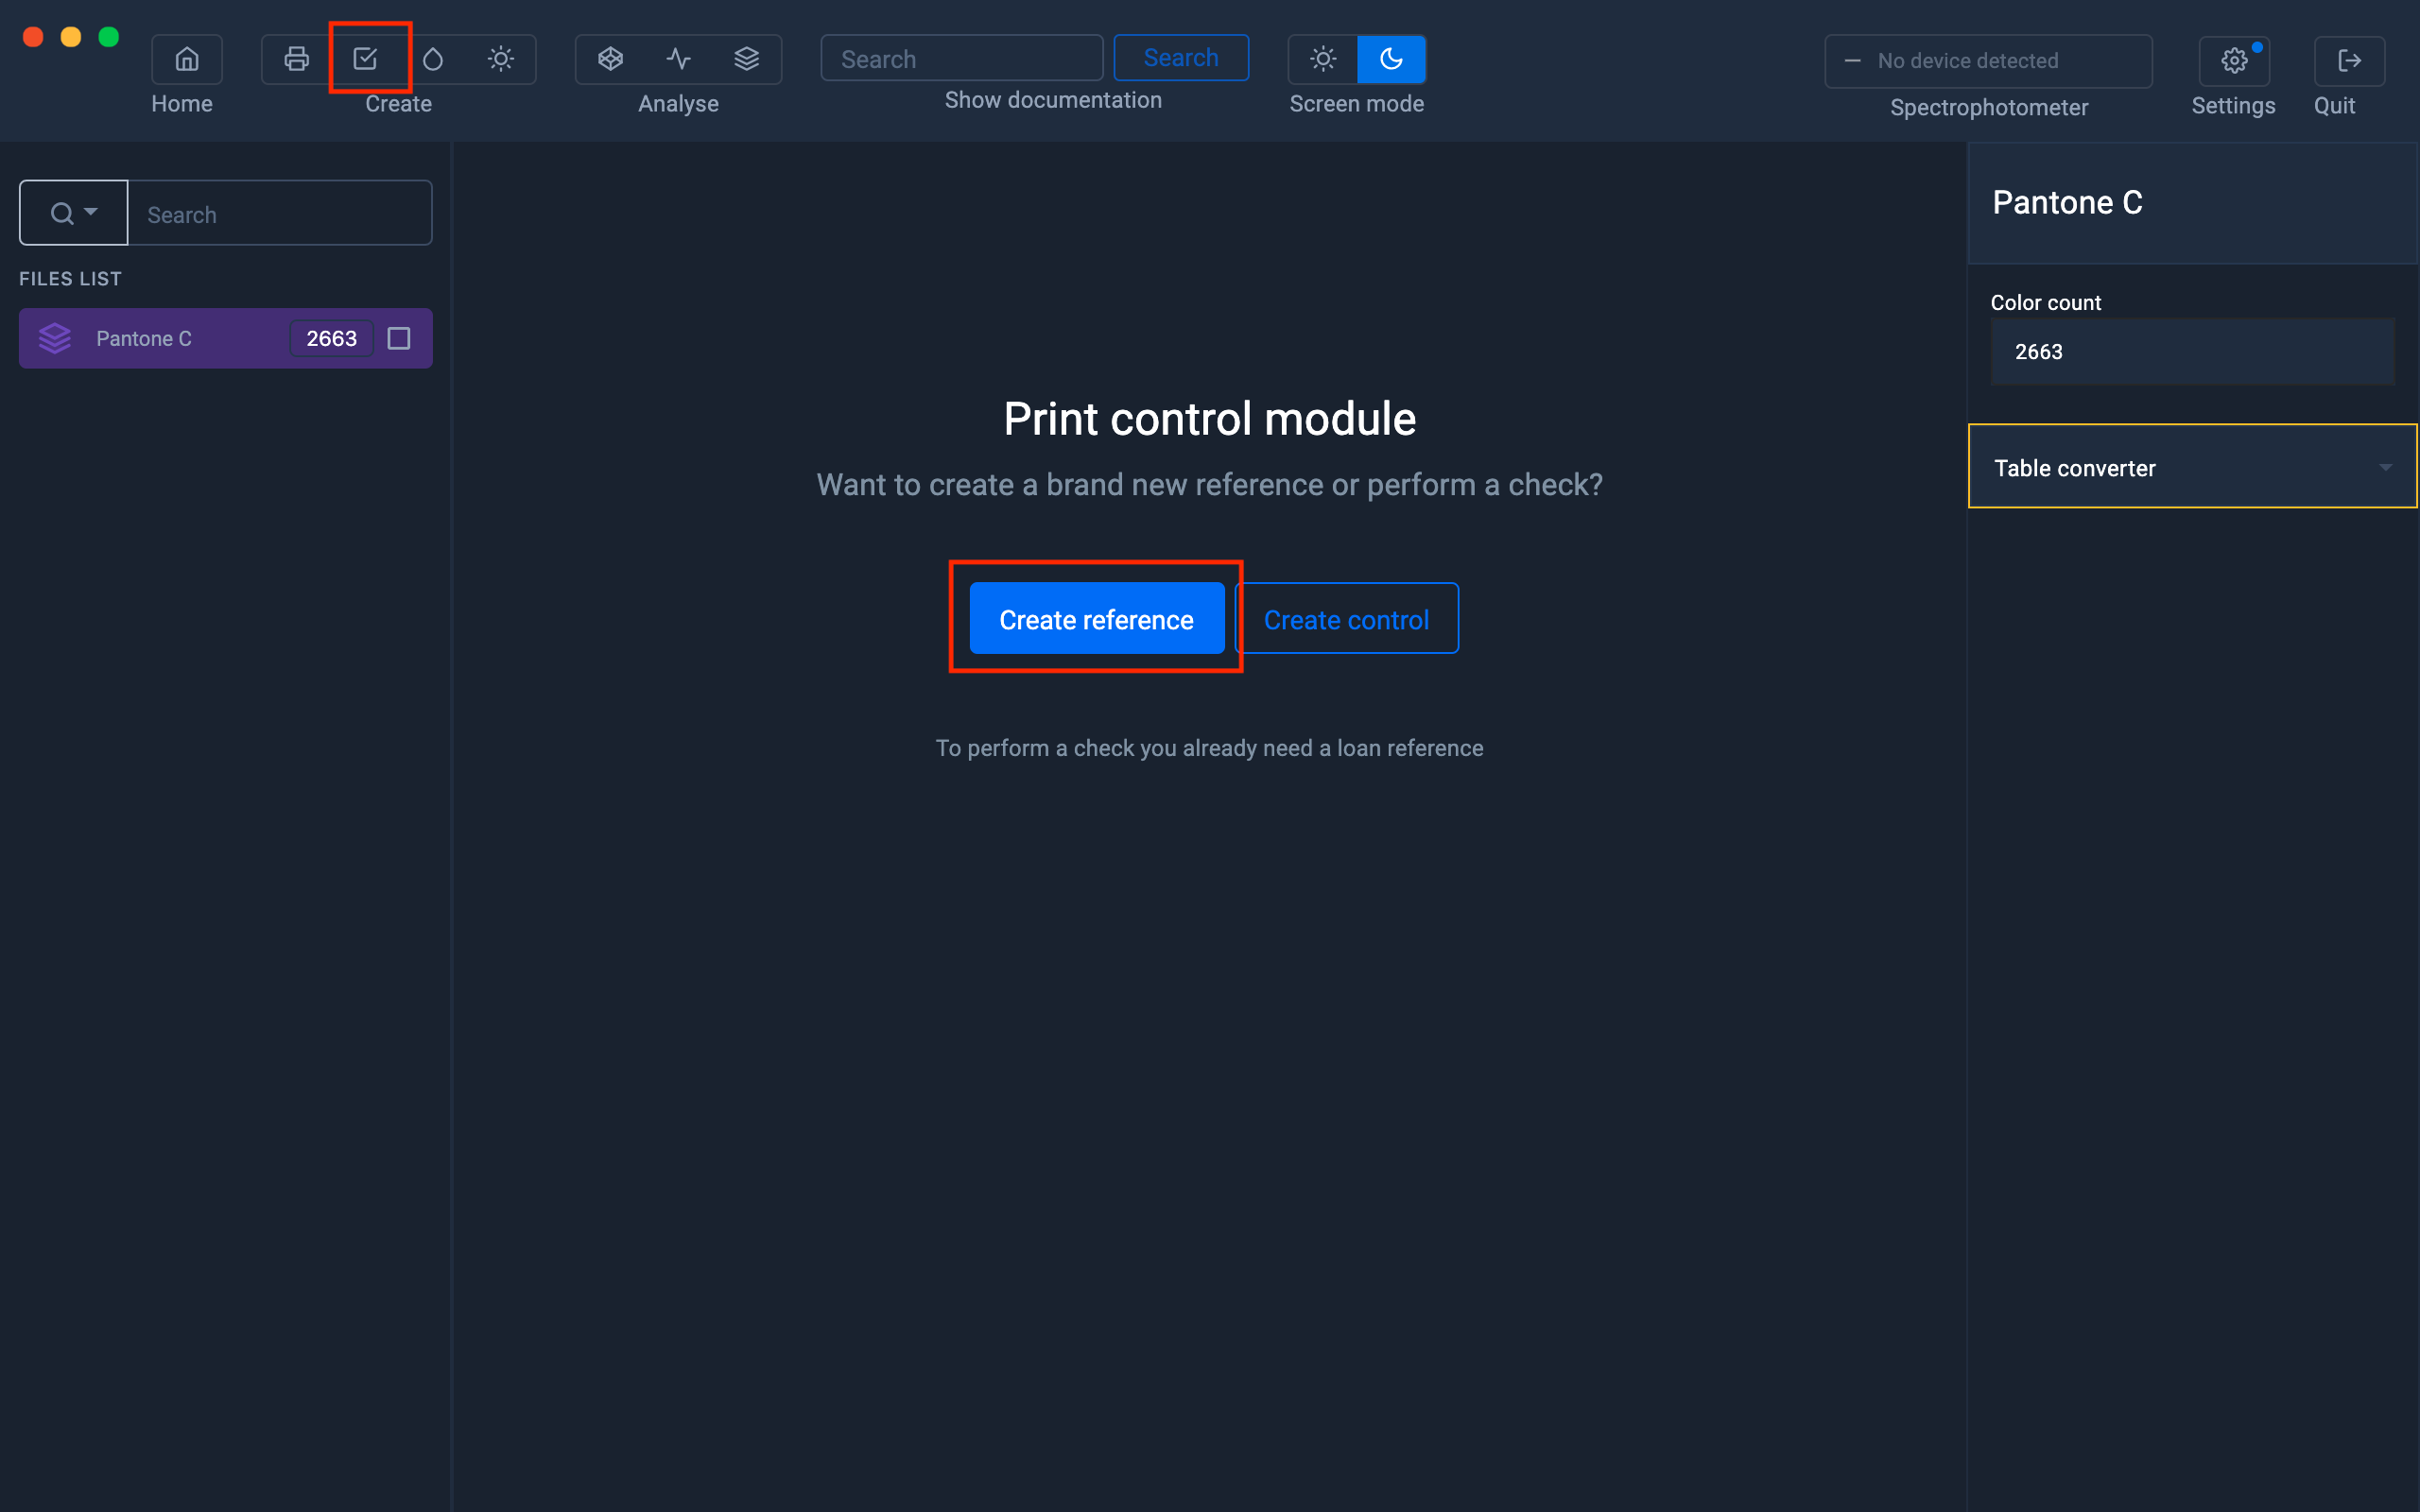
Creation of the test chart containing the spot colors in pdf format
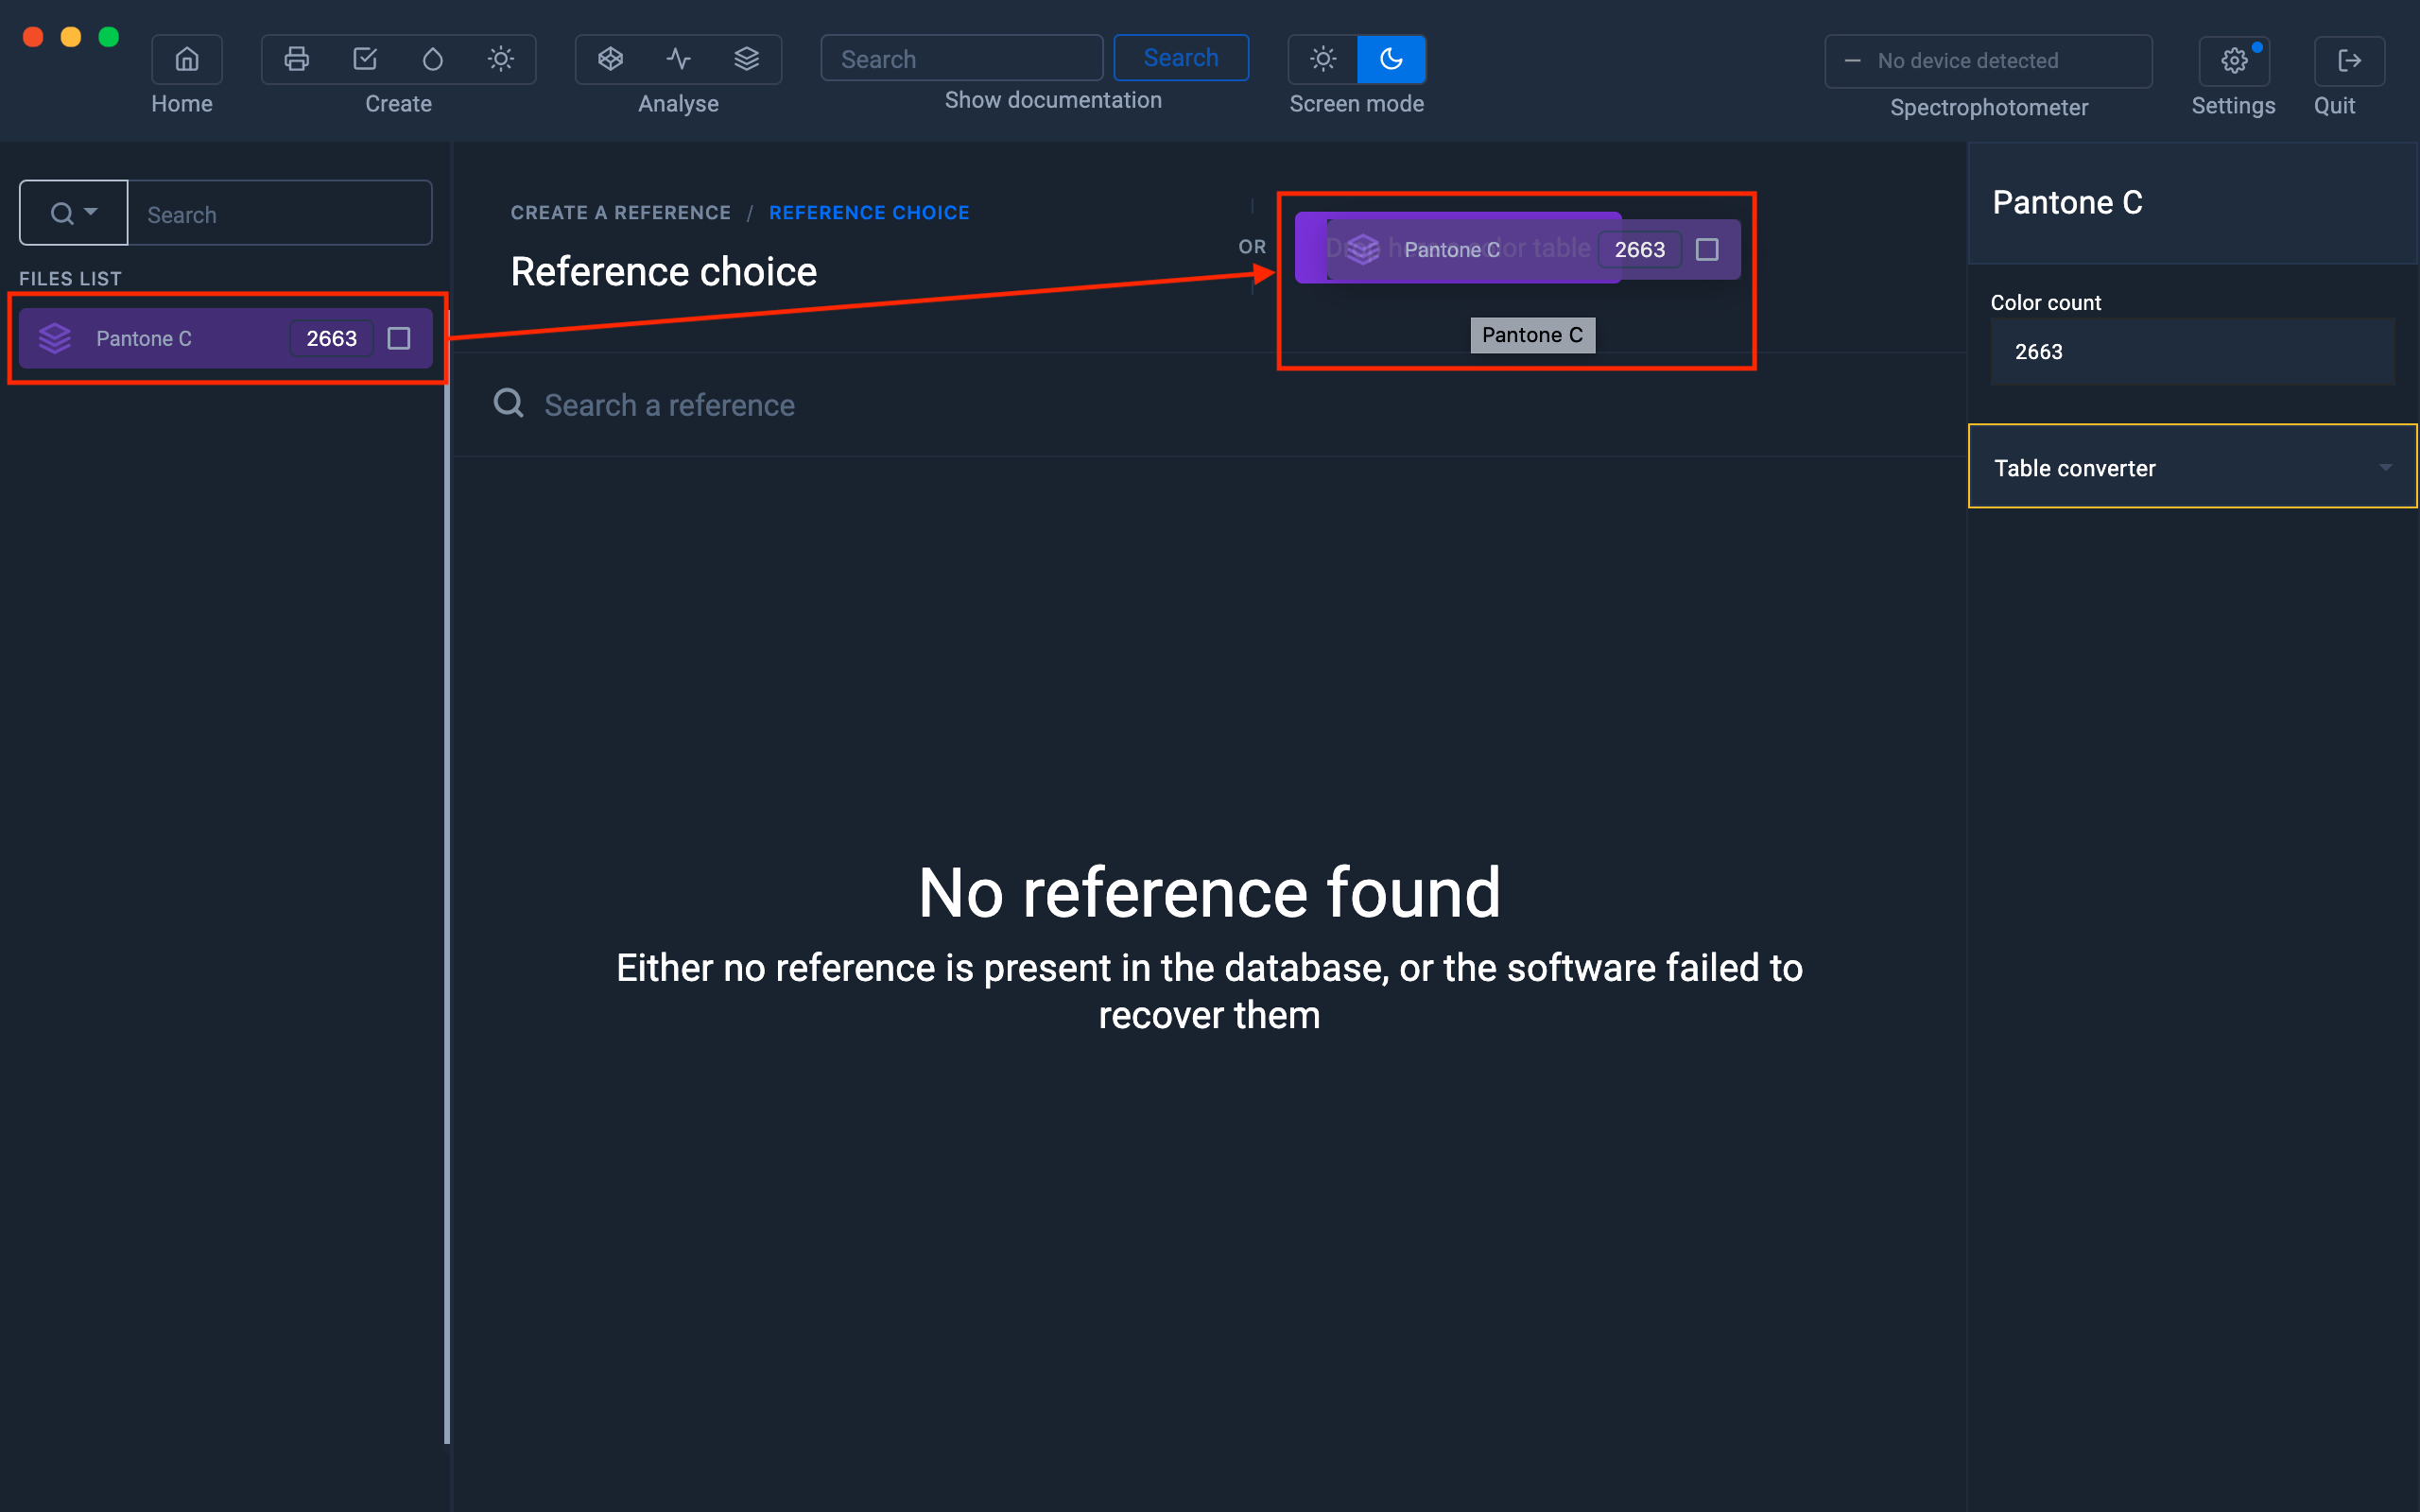
In " Print Control " click on " Create a reference "
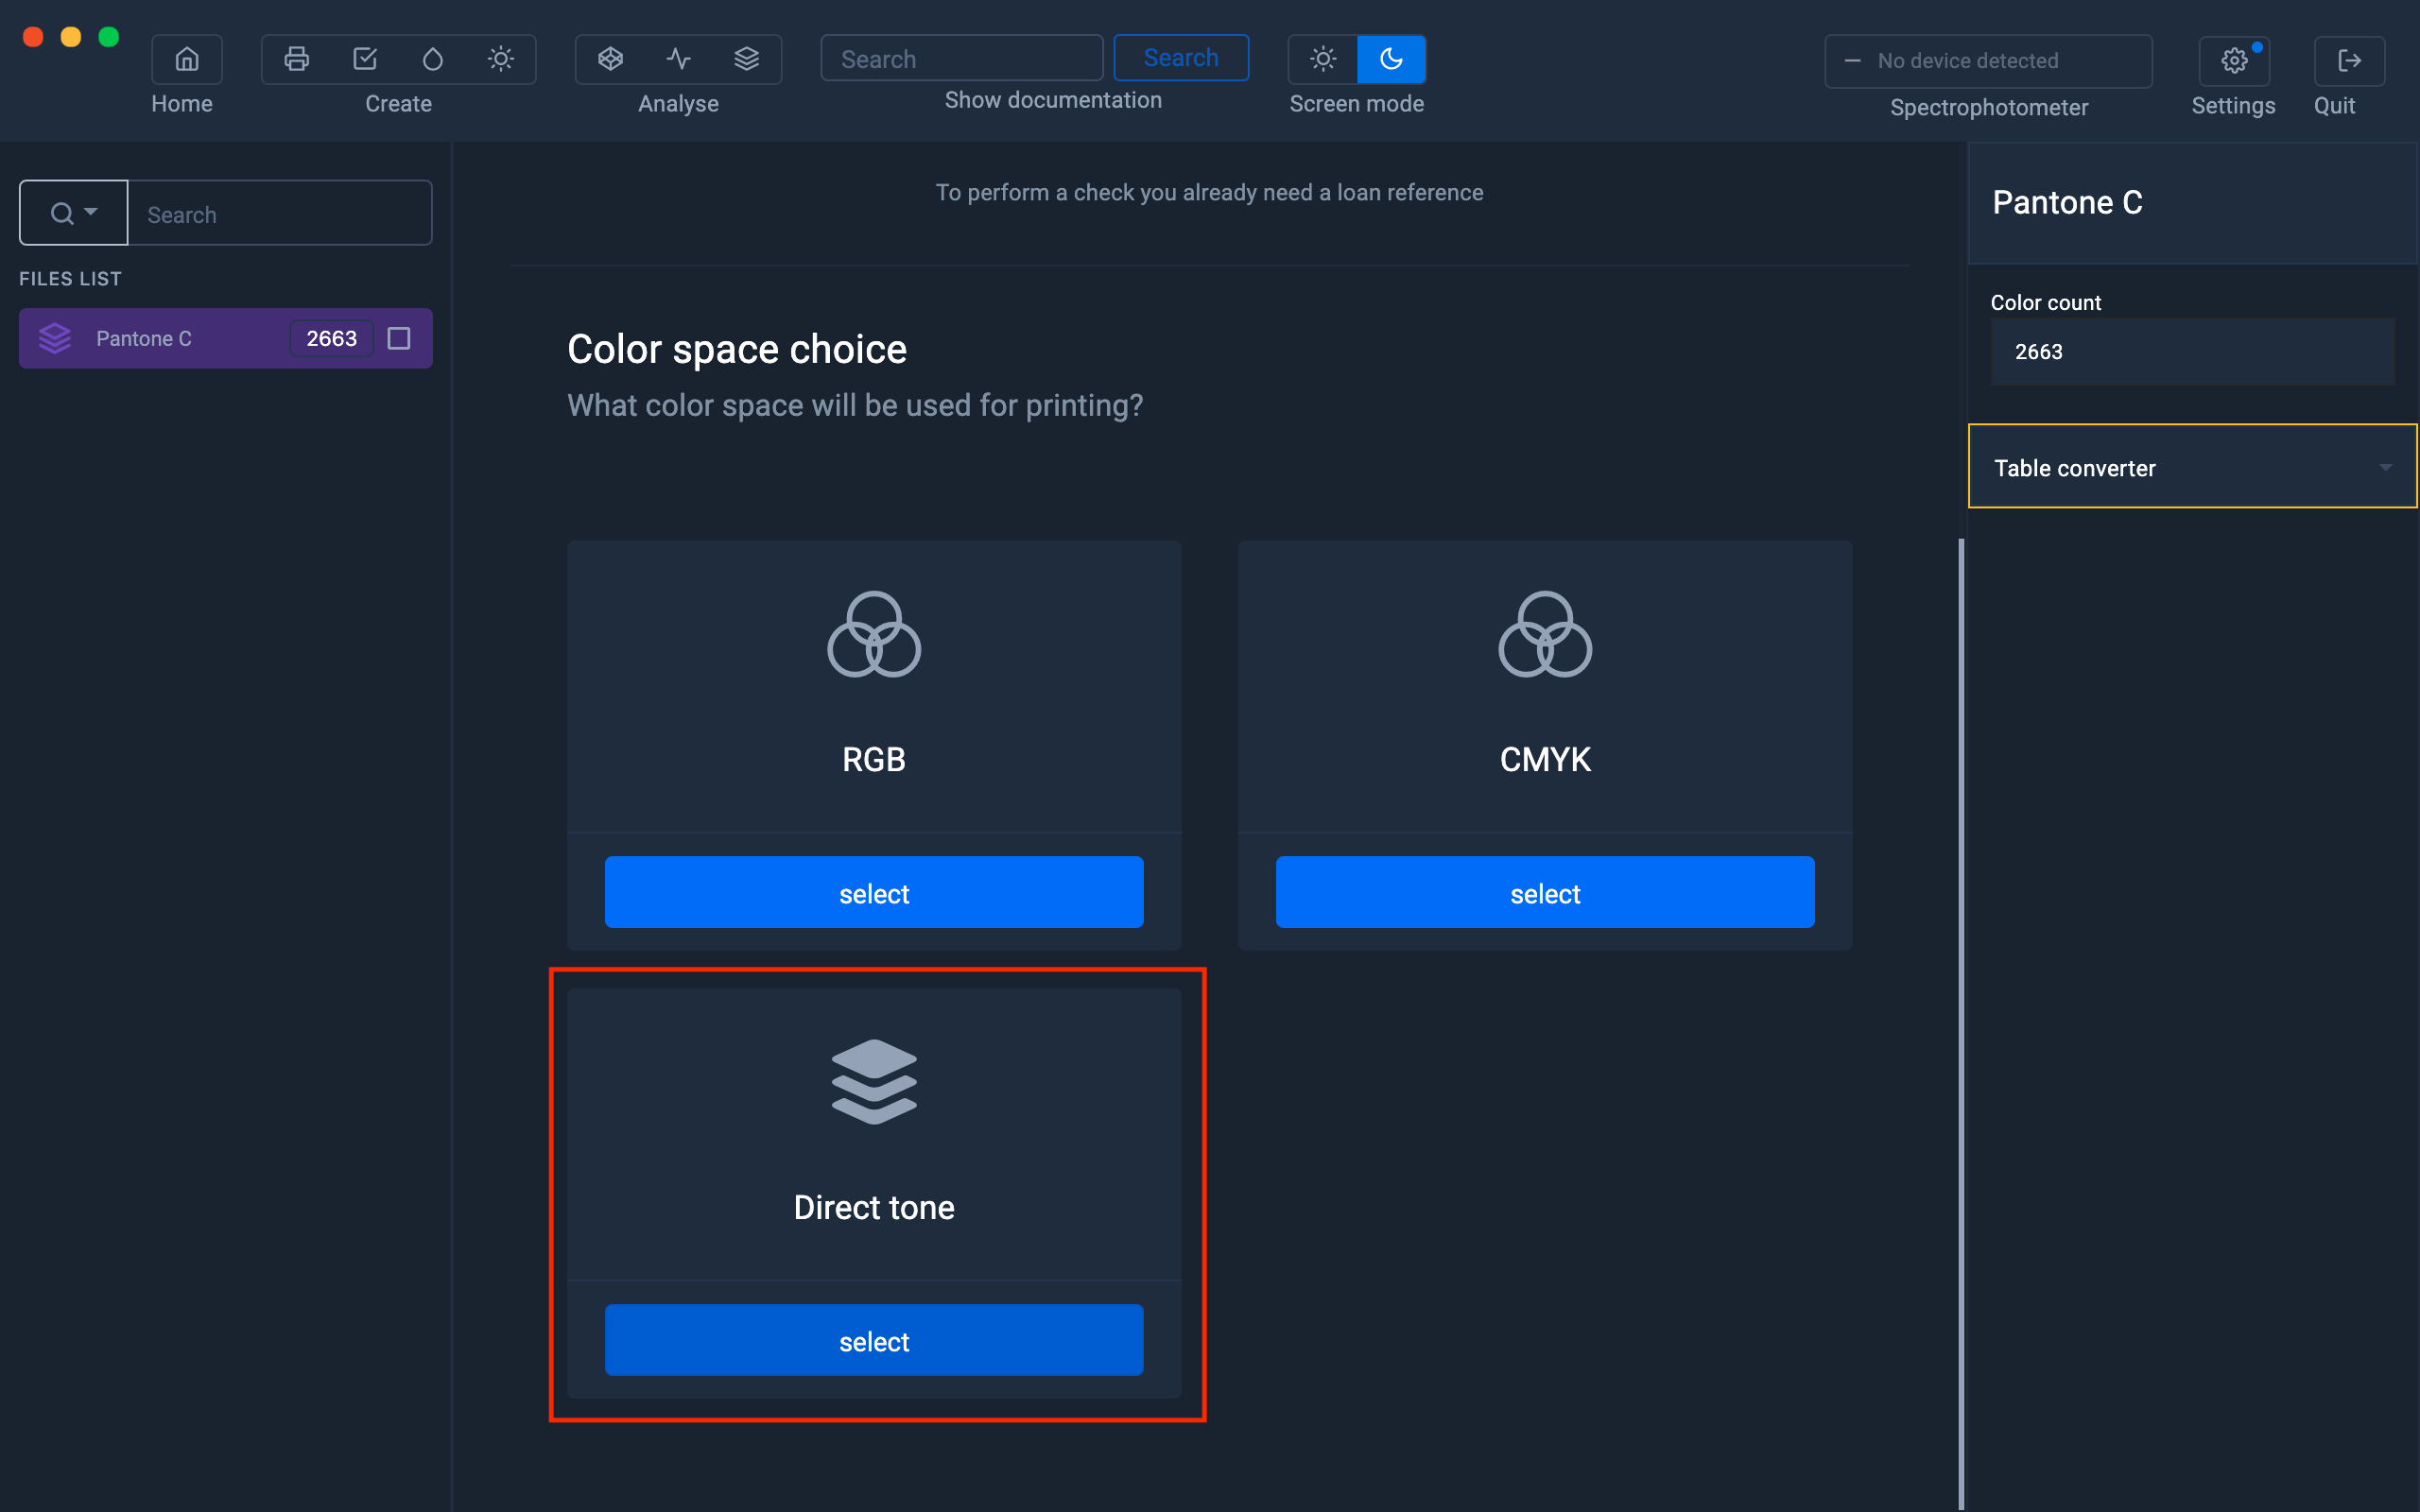
Select the color space " Tons direct "
Drag the color chart file located in the left column into the " Drag a color table here " area
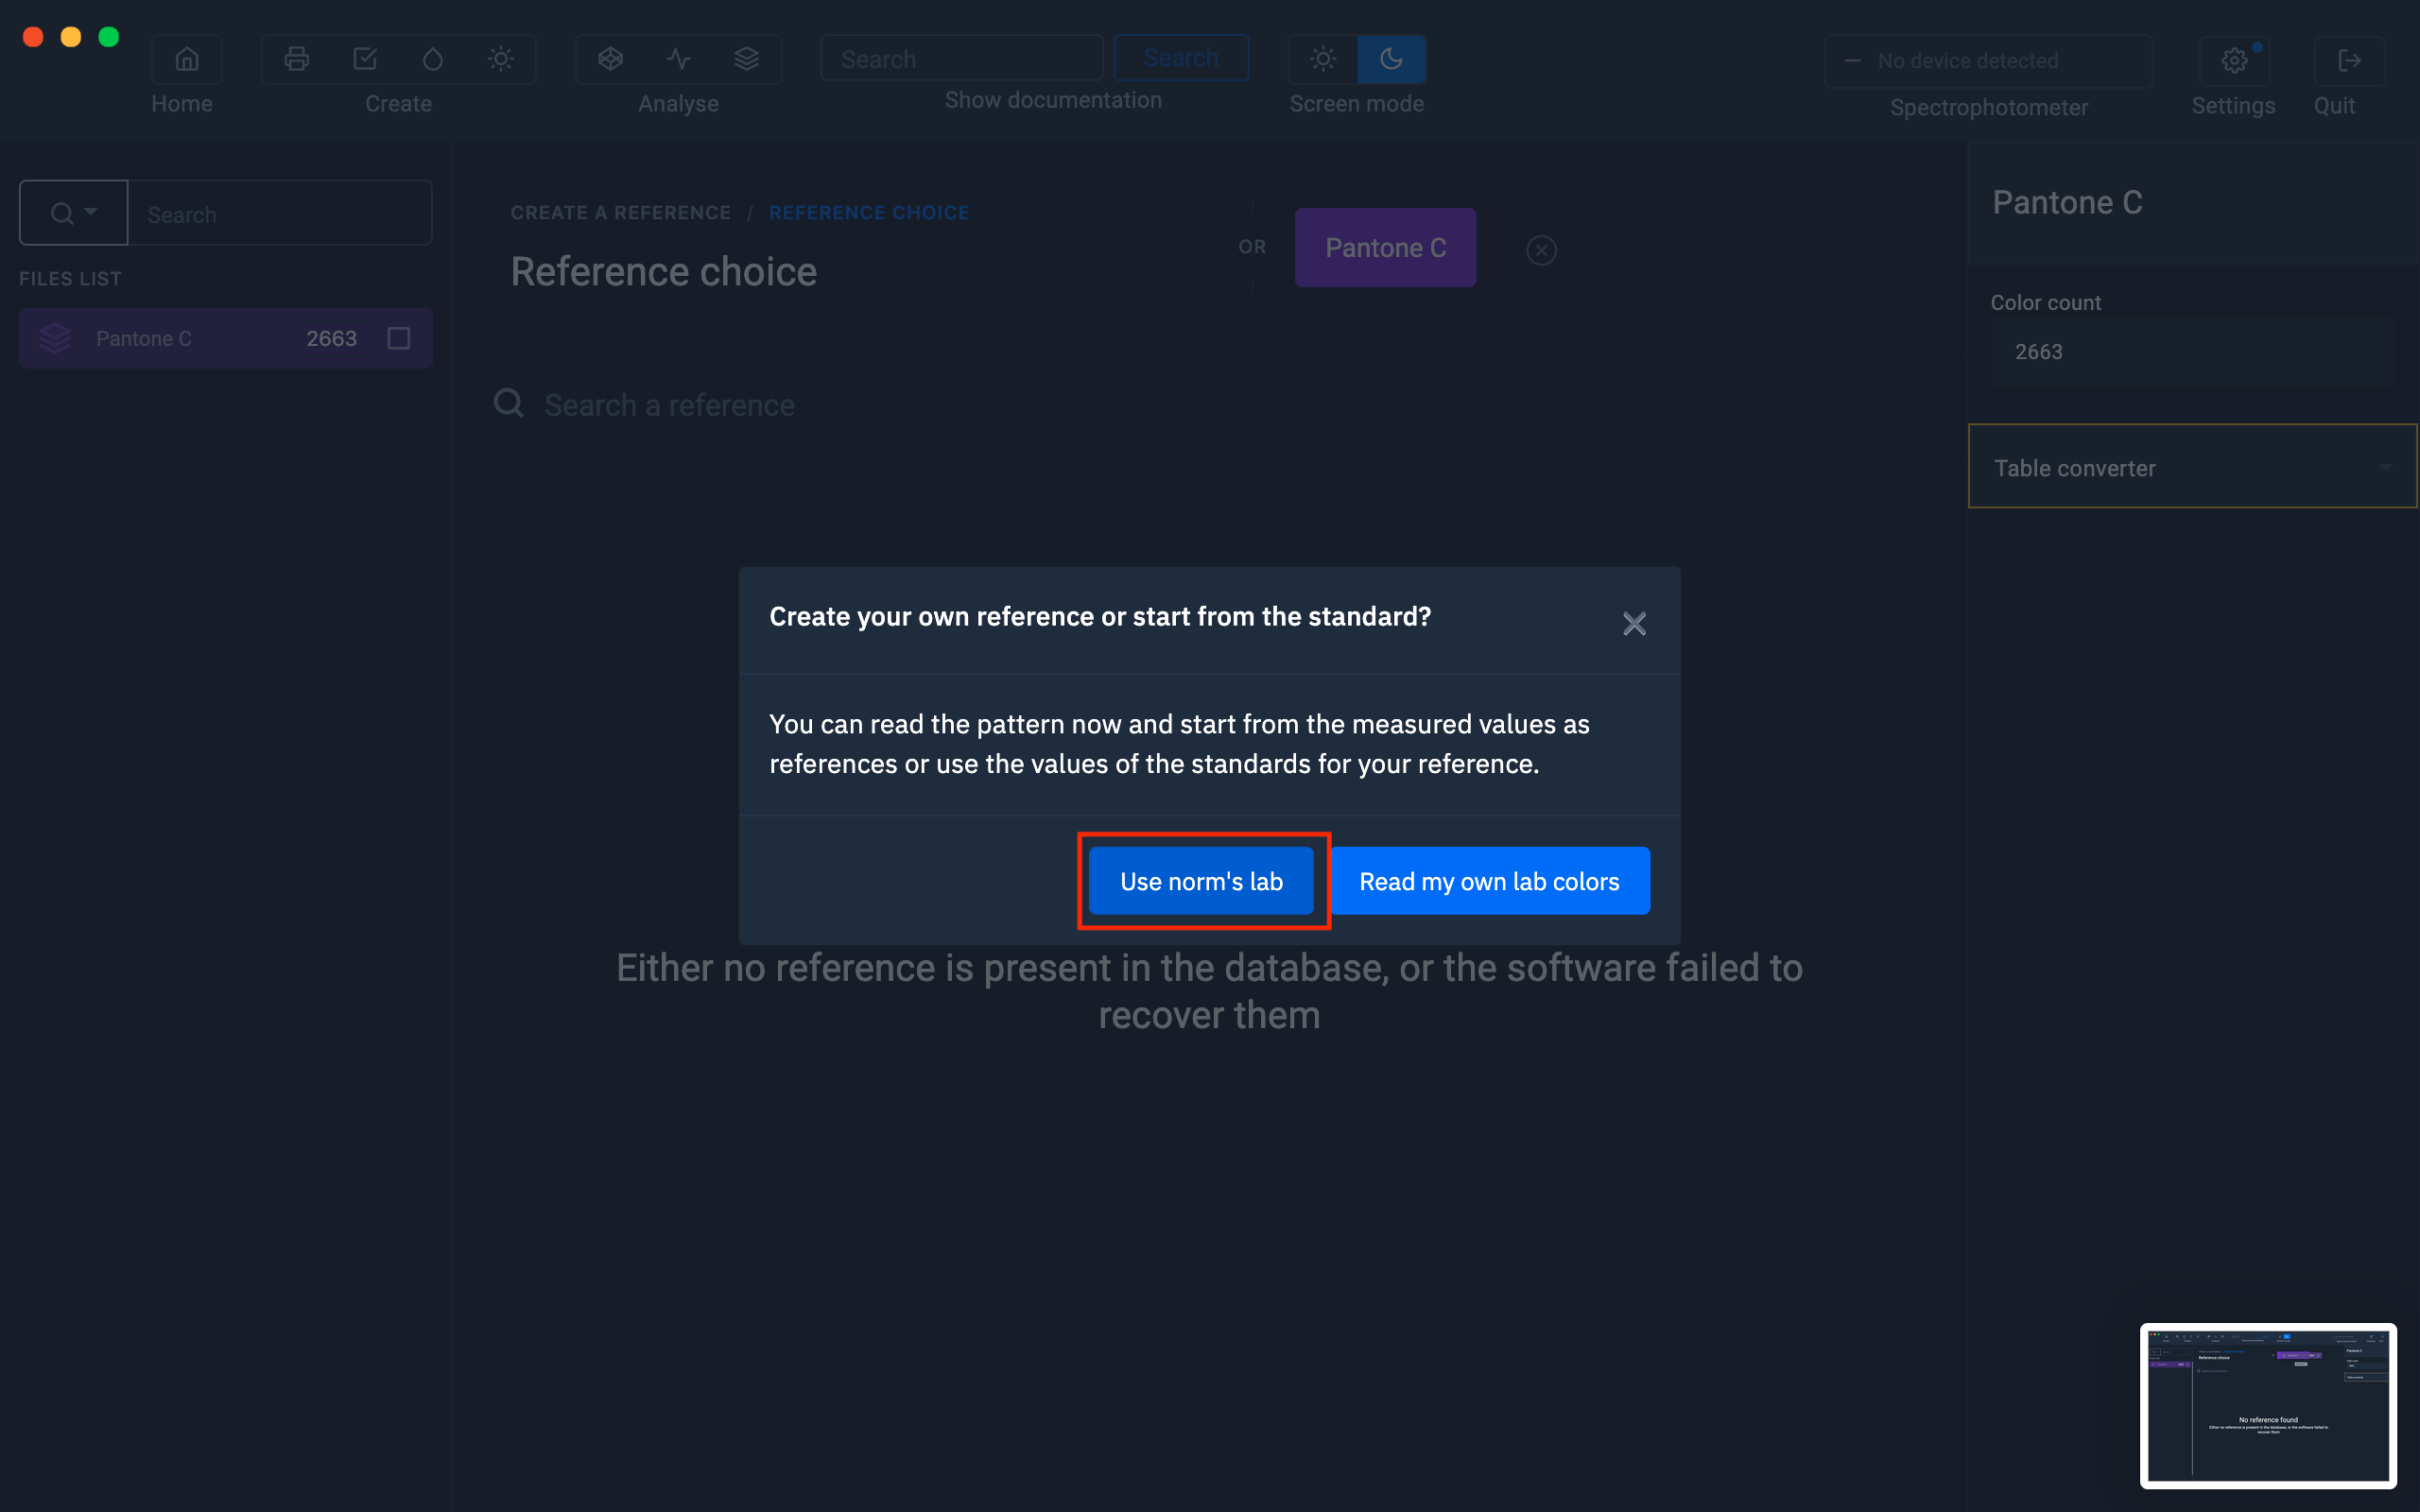
Click on the button " Use the Labs of the standard "
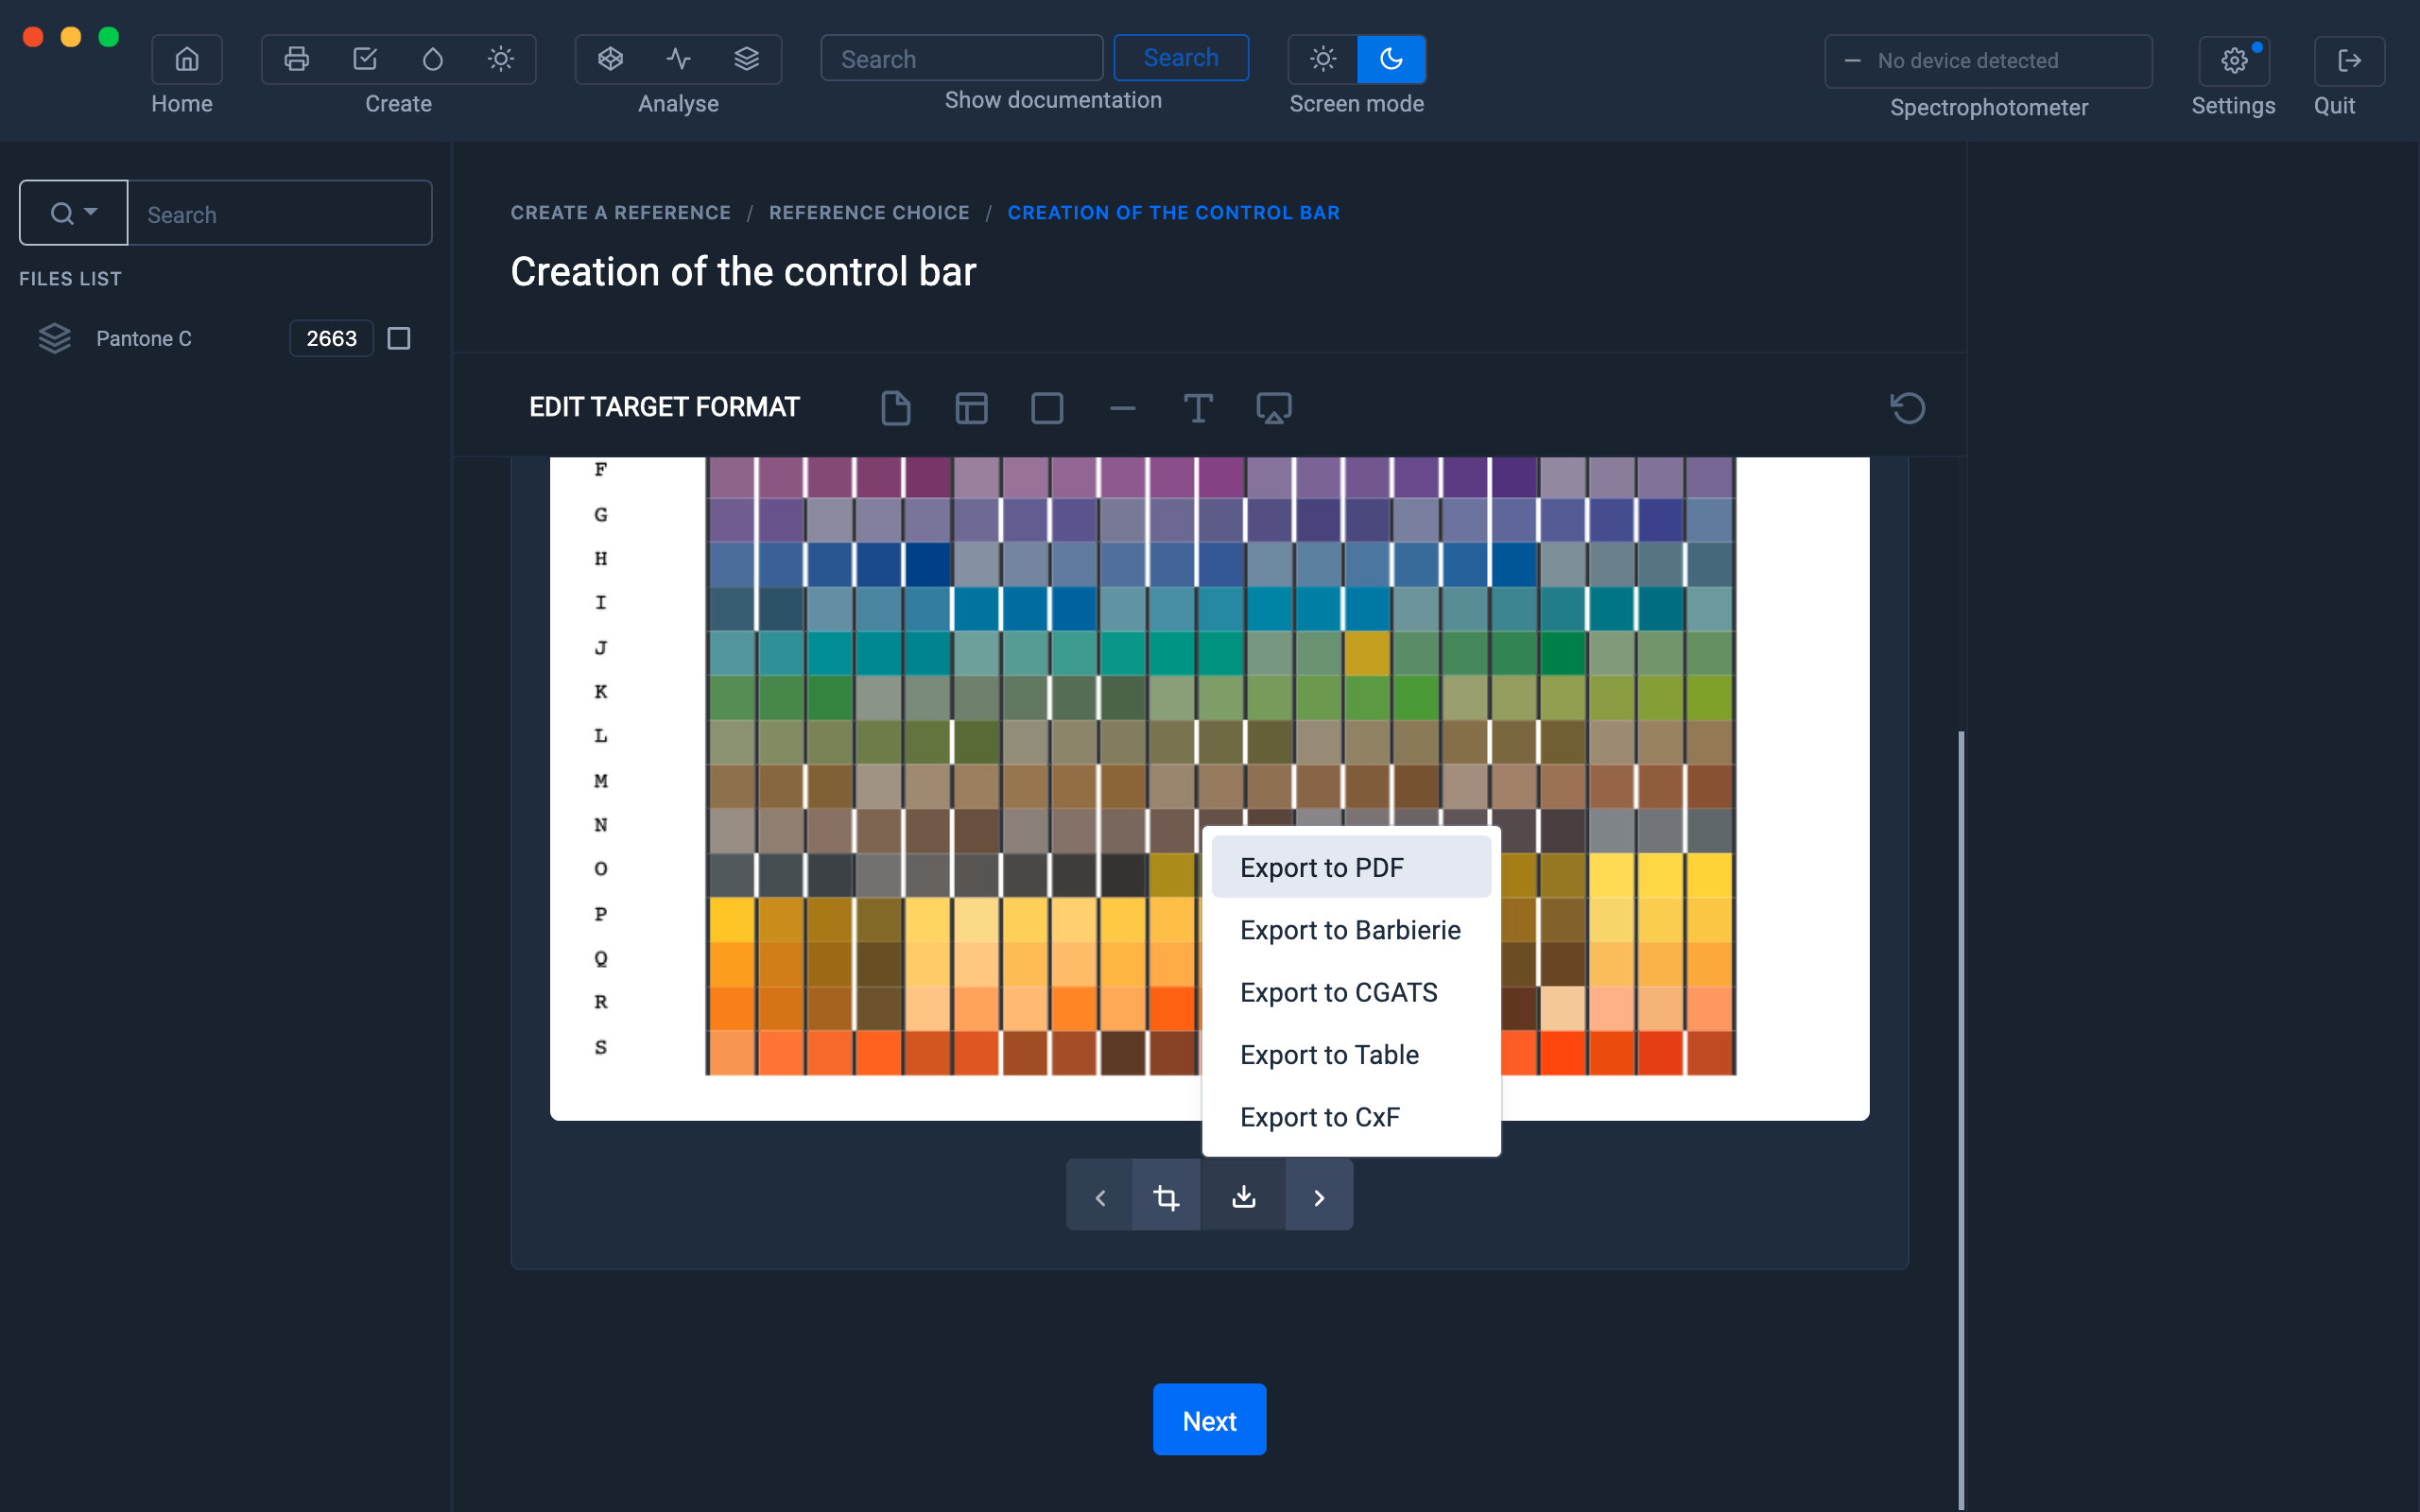
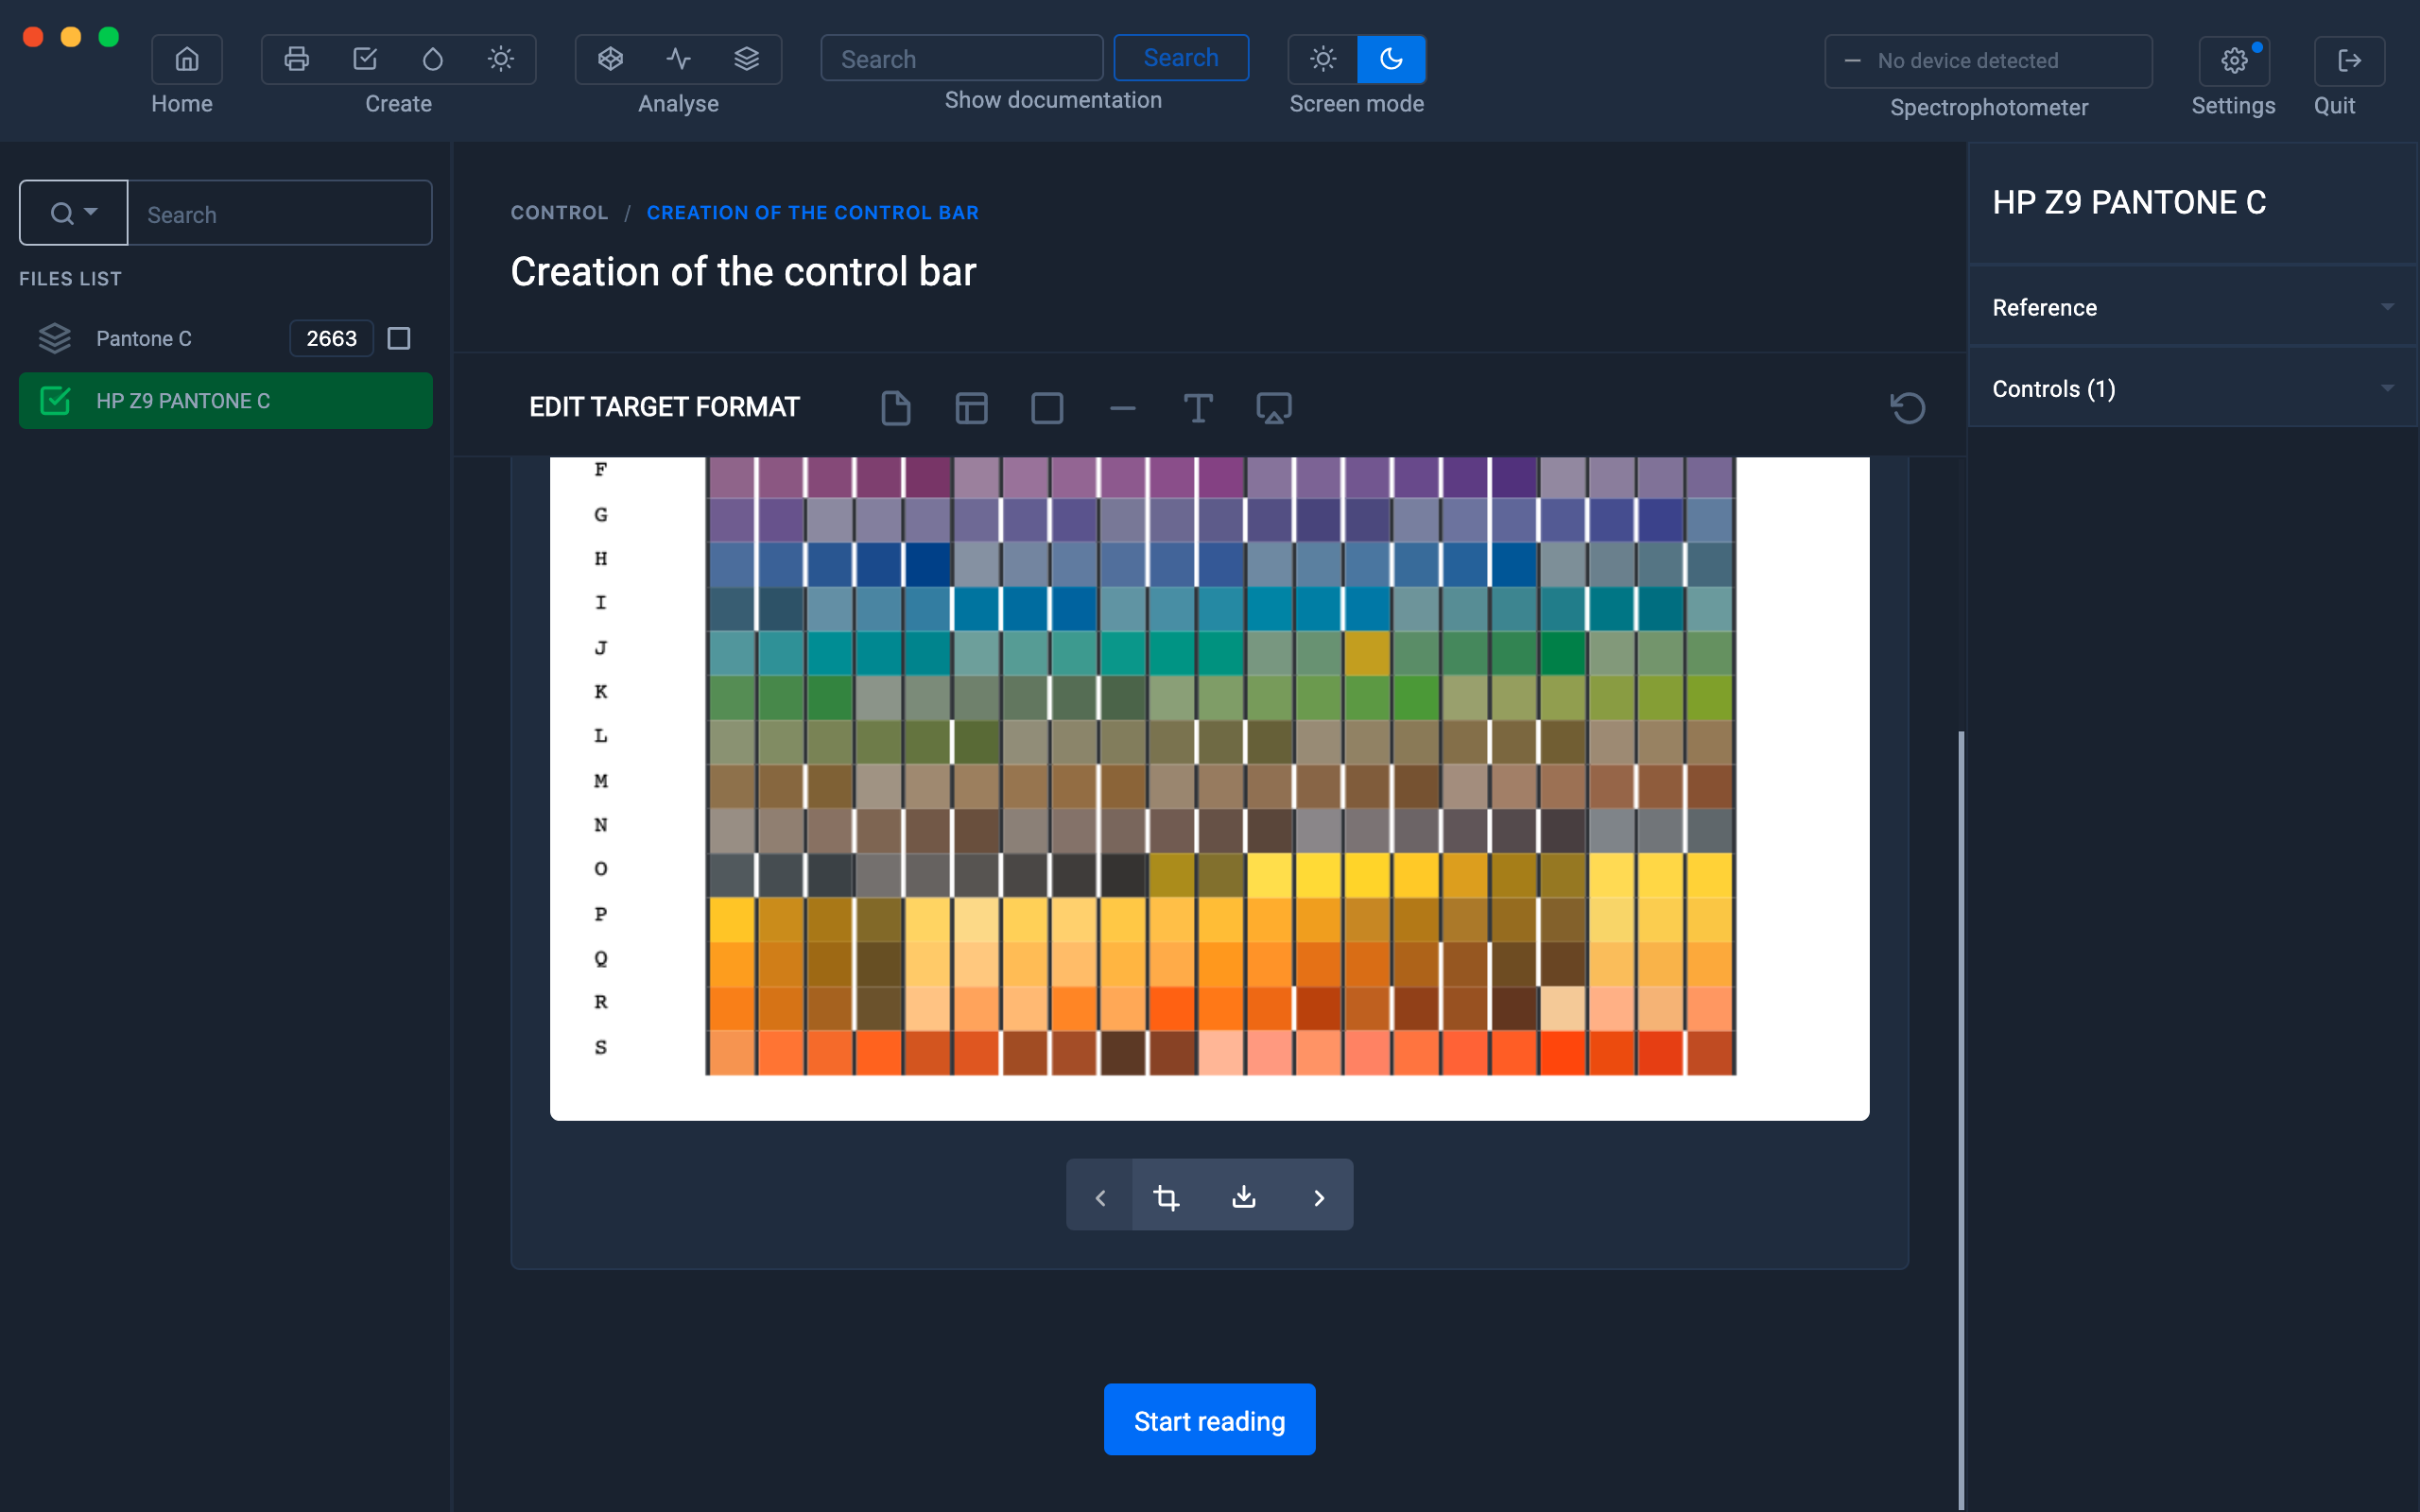
The test pattern containing the
spot colors is displayed Export this test pattern in Pdf in order to print it later, then click on " Next ".
Name the project " Print Control ": HP Z9 PANTONE C (The test chart was printed on an HP Z9)
In this information window, only the name of the setting is mandatory.
The other information is optional.
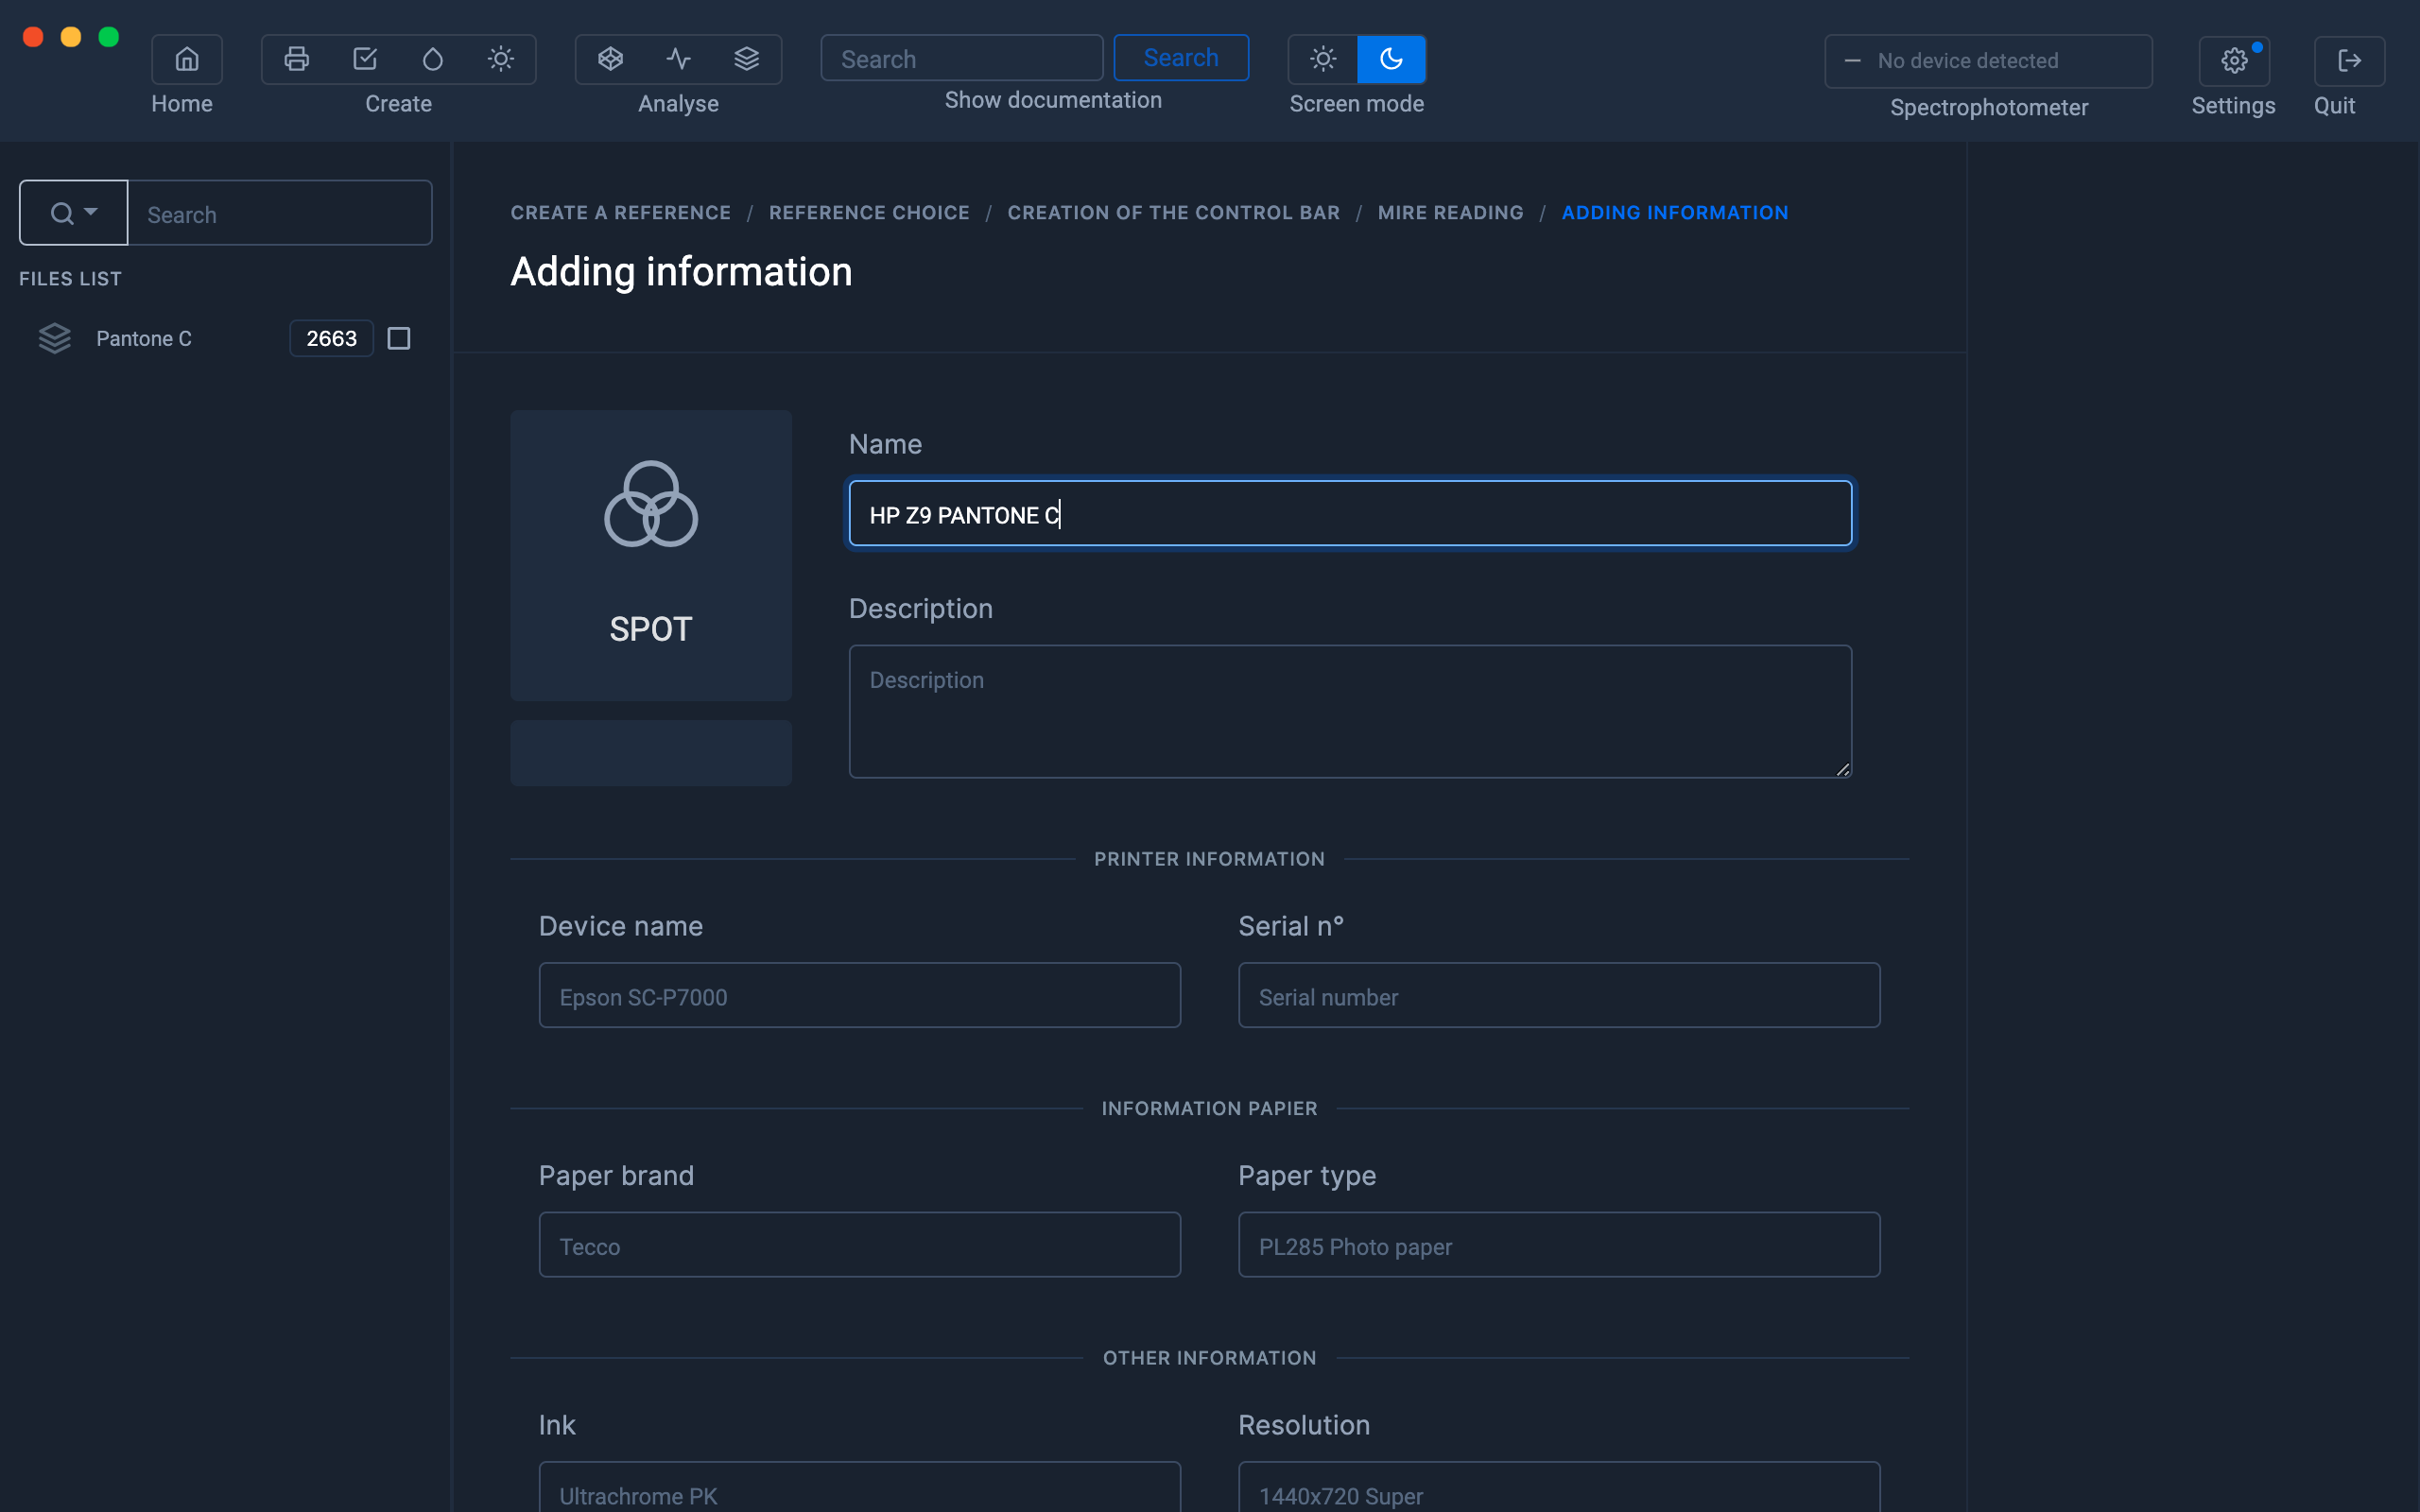
Click on the " Save and Exit " button

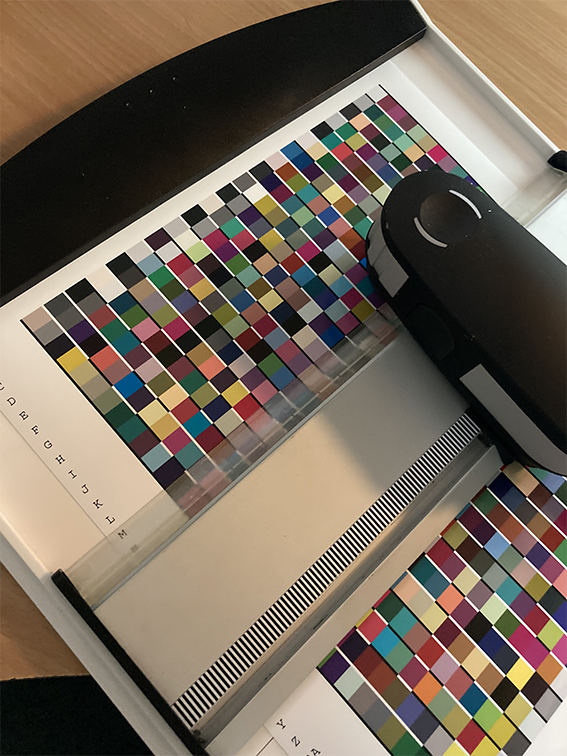
Printing the test pattern
The printout of the test chart containing the spot color chart must be printed under production conditions.
You must use a RIP capable of handling spot colors.
If you are using swatches containing custom colors, remember to import them into the RIP.
Importing the color chart into the RIP will allow the printers to automatically manage the colors contained in your file.
For more information, see chapter: Exporting a color table to the RIP Caldera
For more information, see chapter: Exporting a color table to the Onyx Postershop RIP
For more information, see the chapter: Exporting a color table to the EFI Fiery RIP
For more information, see chapter: Exporting a color table to the Epson Edge Print RIP
For more information, see chapter: Exporting a color table to the ColorGate RIP
Target measurement
The measurement of the printed test chart will be done from the " Print Control " file previously created.
Right click on the " Print Control " file then select " Start the control ".

Make sure the spectrophotometer is connected, then click " Start Reading "
Select the spectrophotometer options.
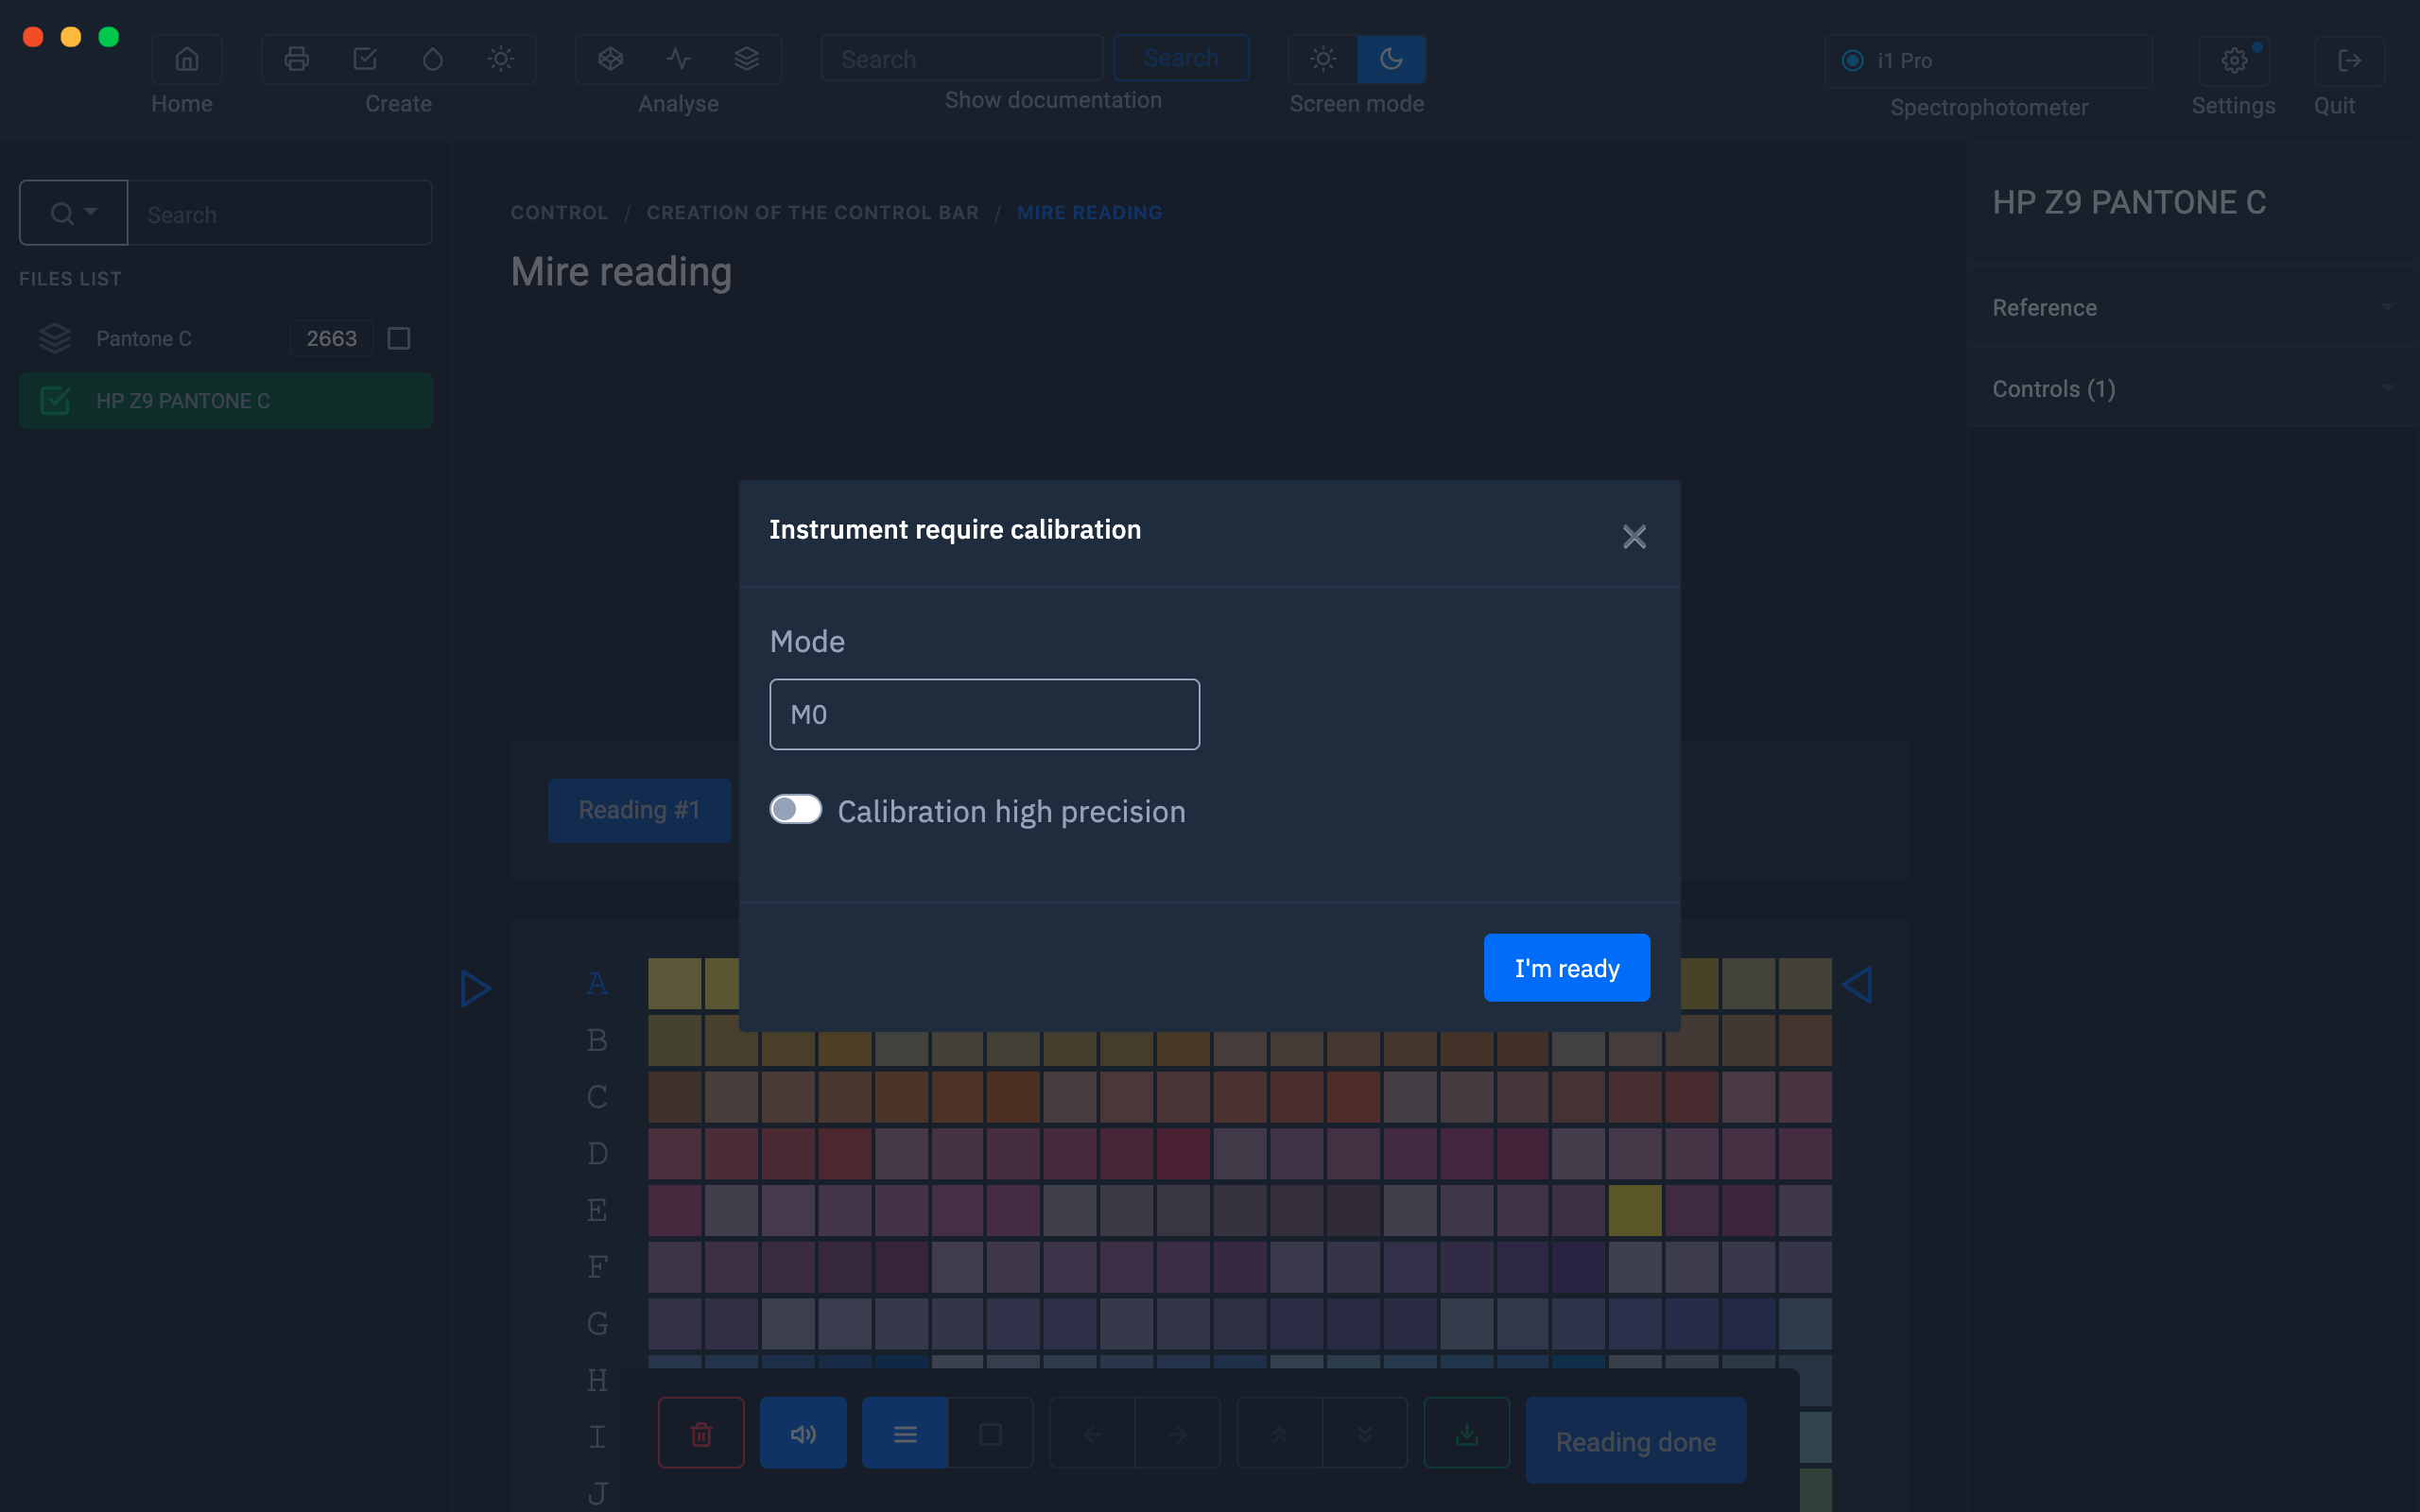
Position the spectrophotometer in its calibration position, then click on " Start calibration "
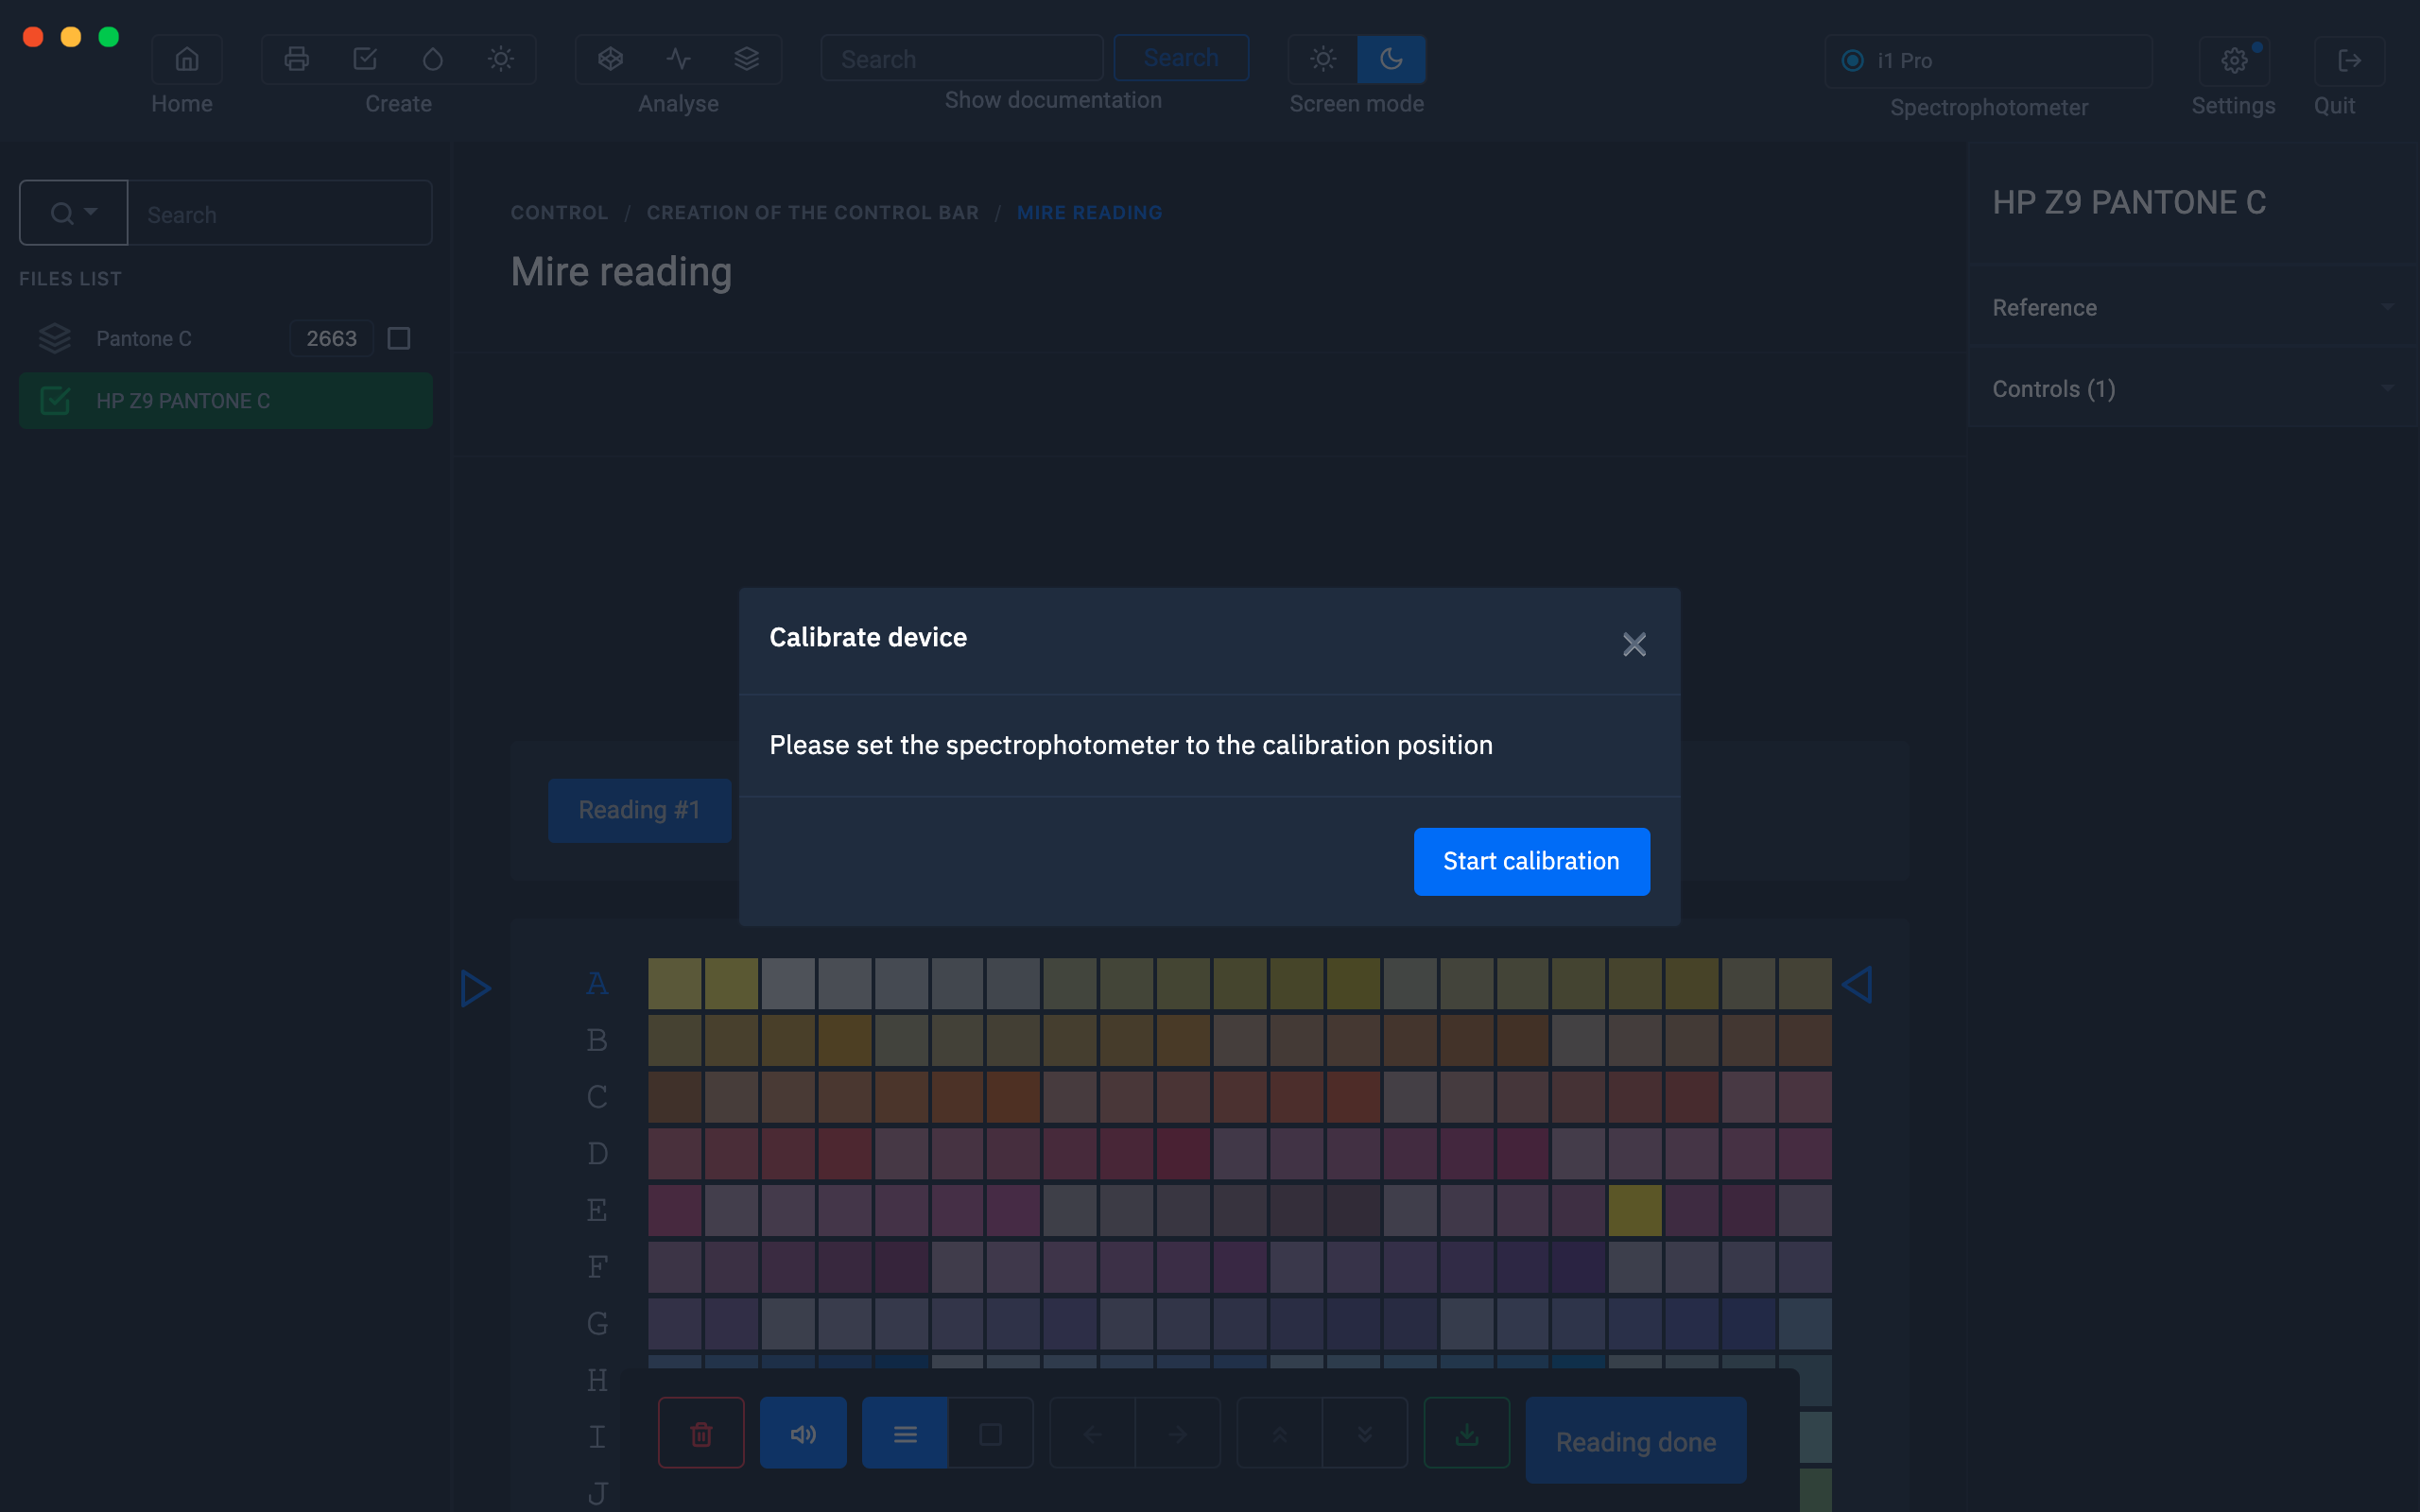
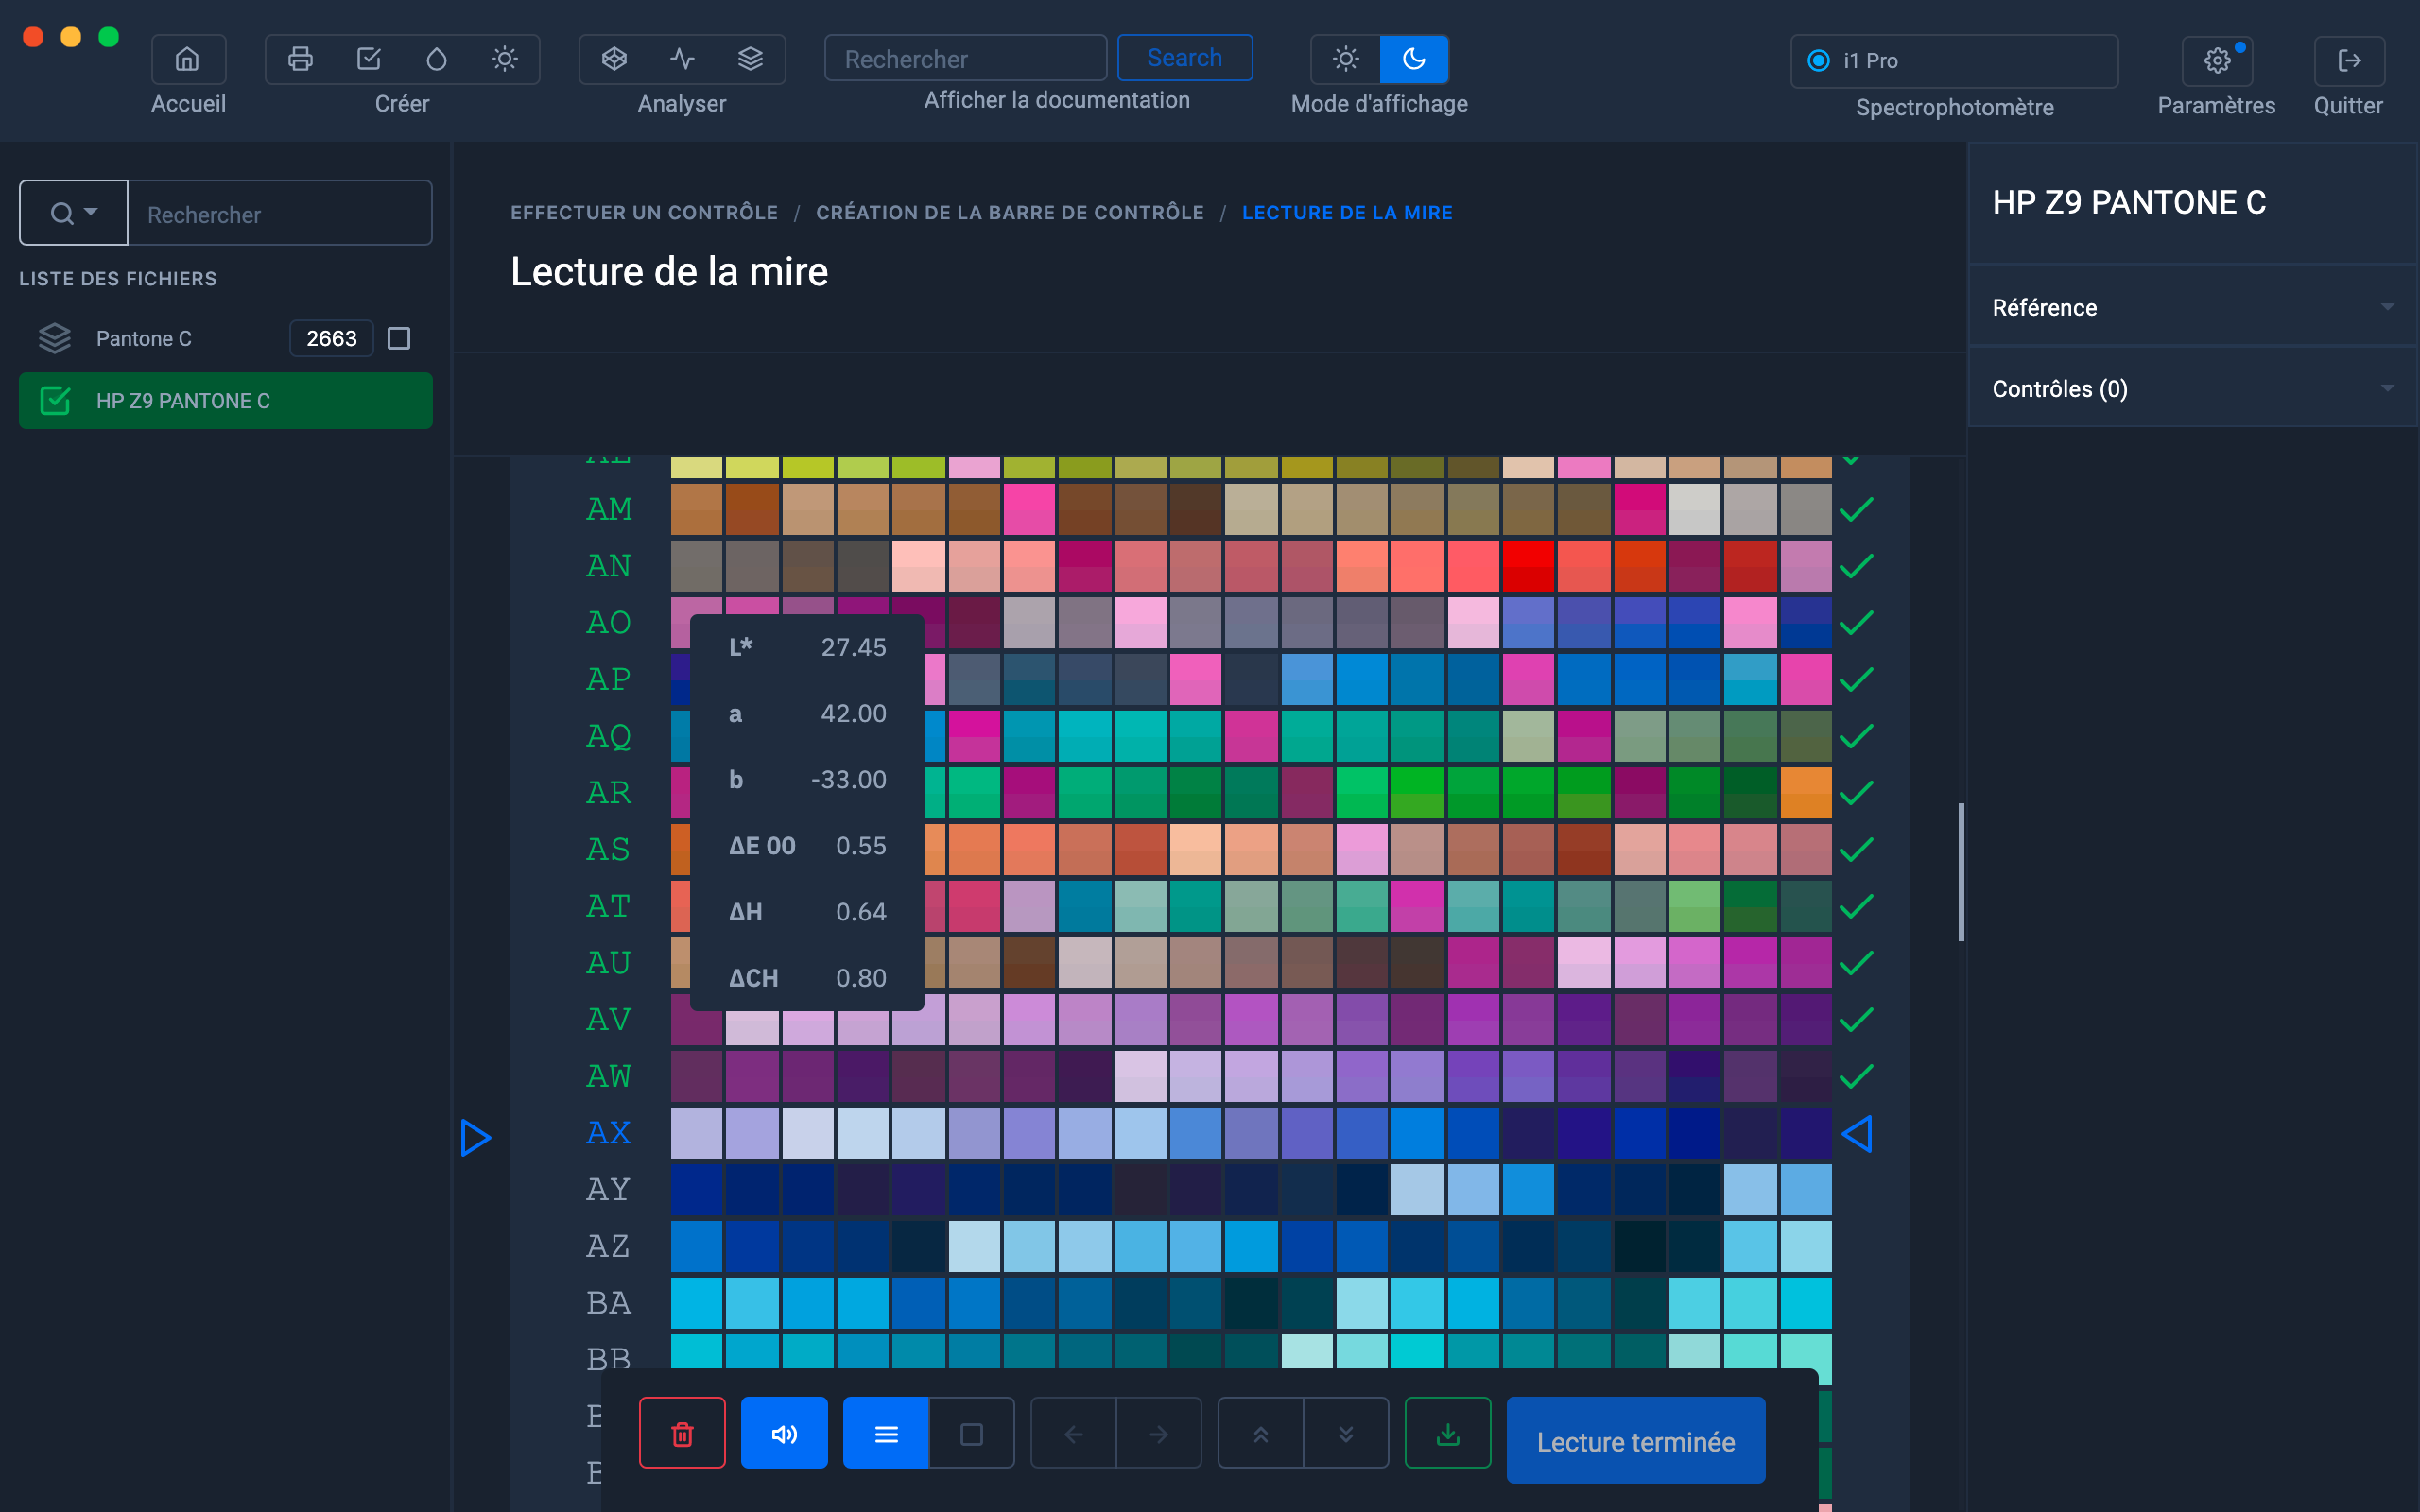
Start reading
While measuring the range, you have the possibility to view the differences between the reference values and the measured values, by hovering over the patches.
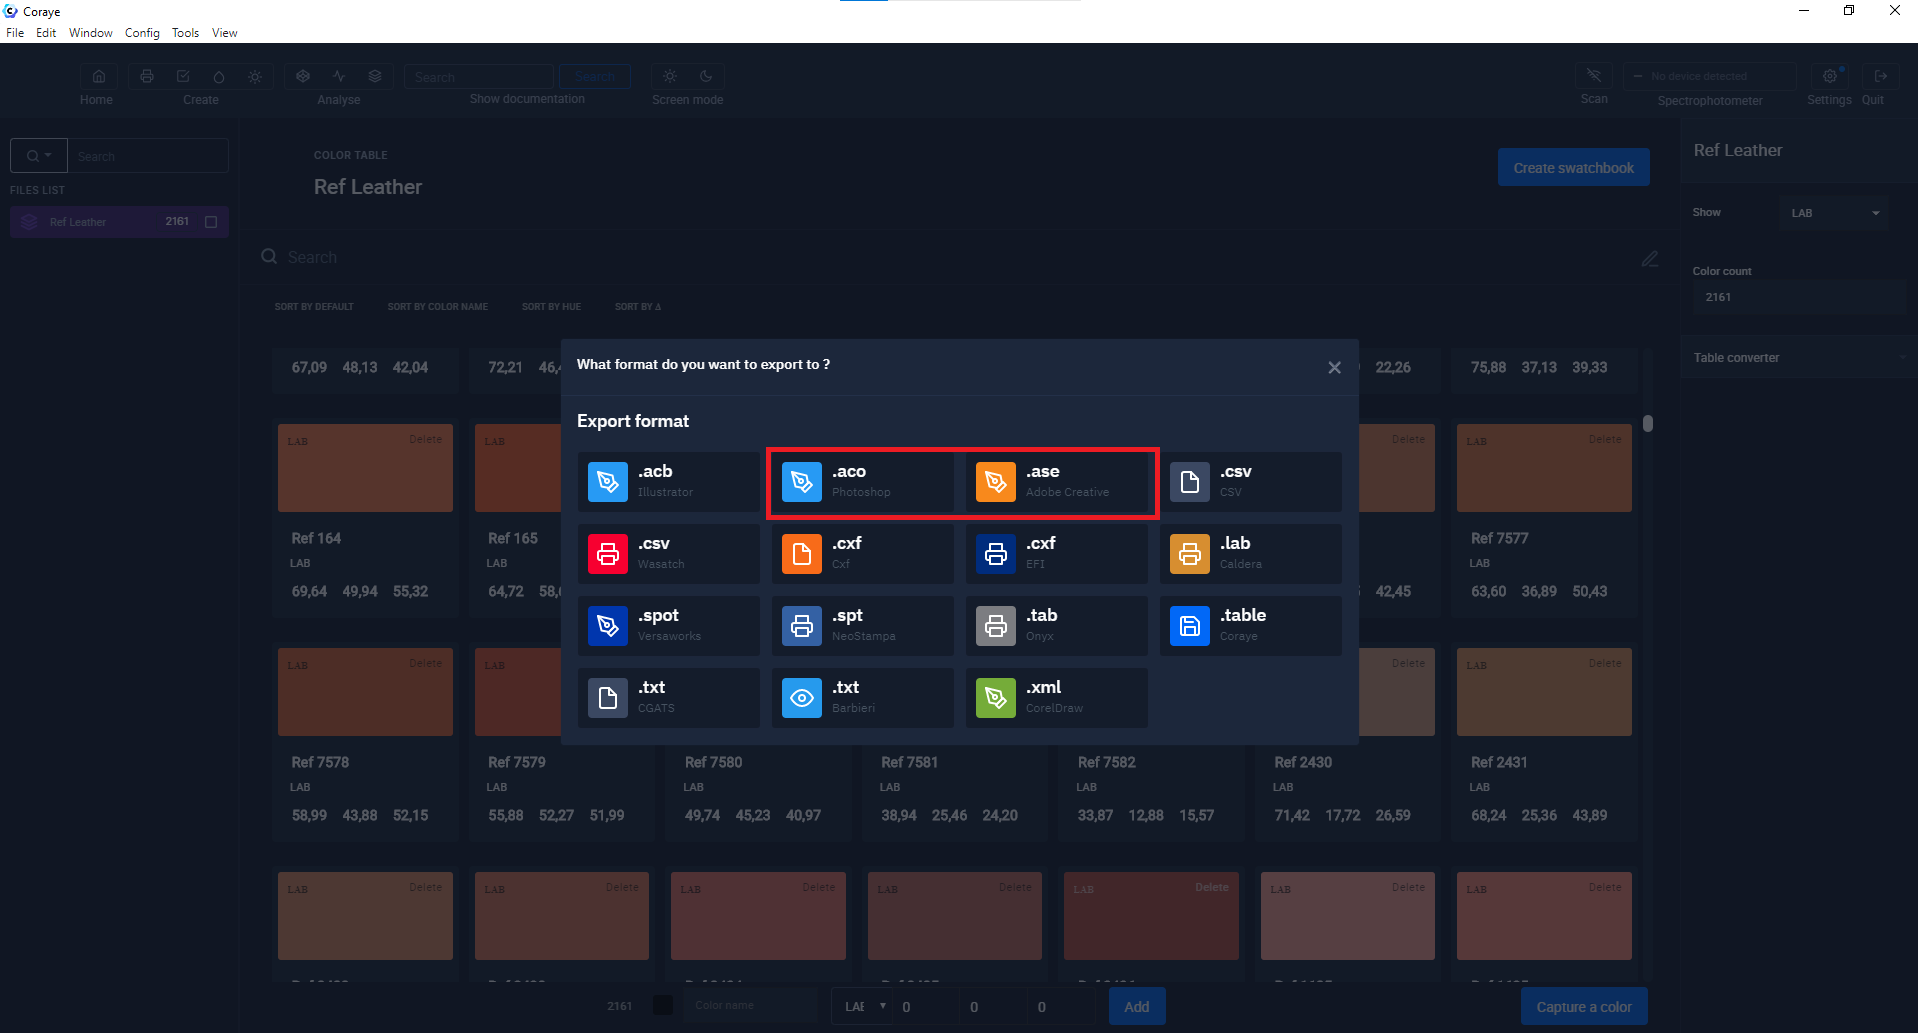
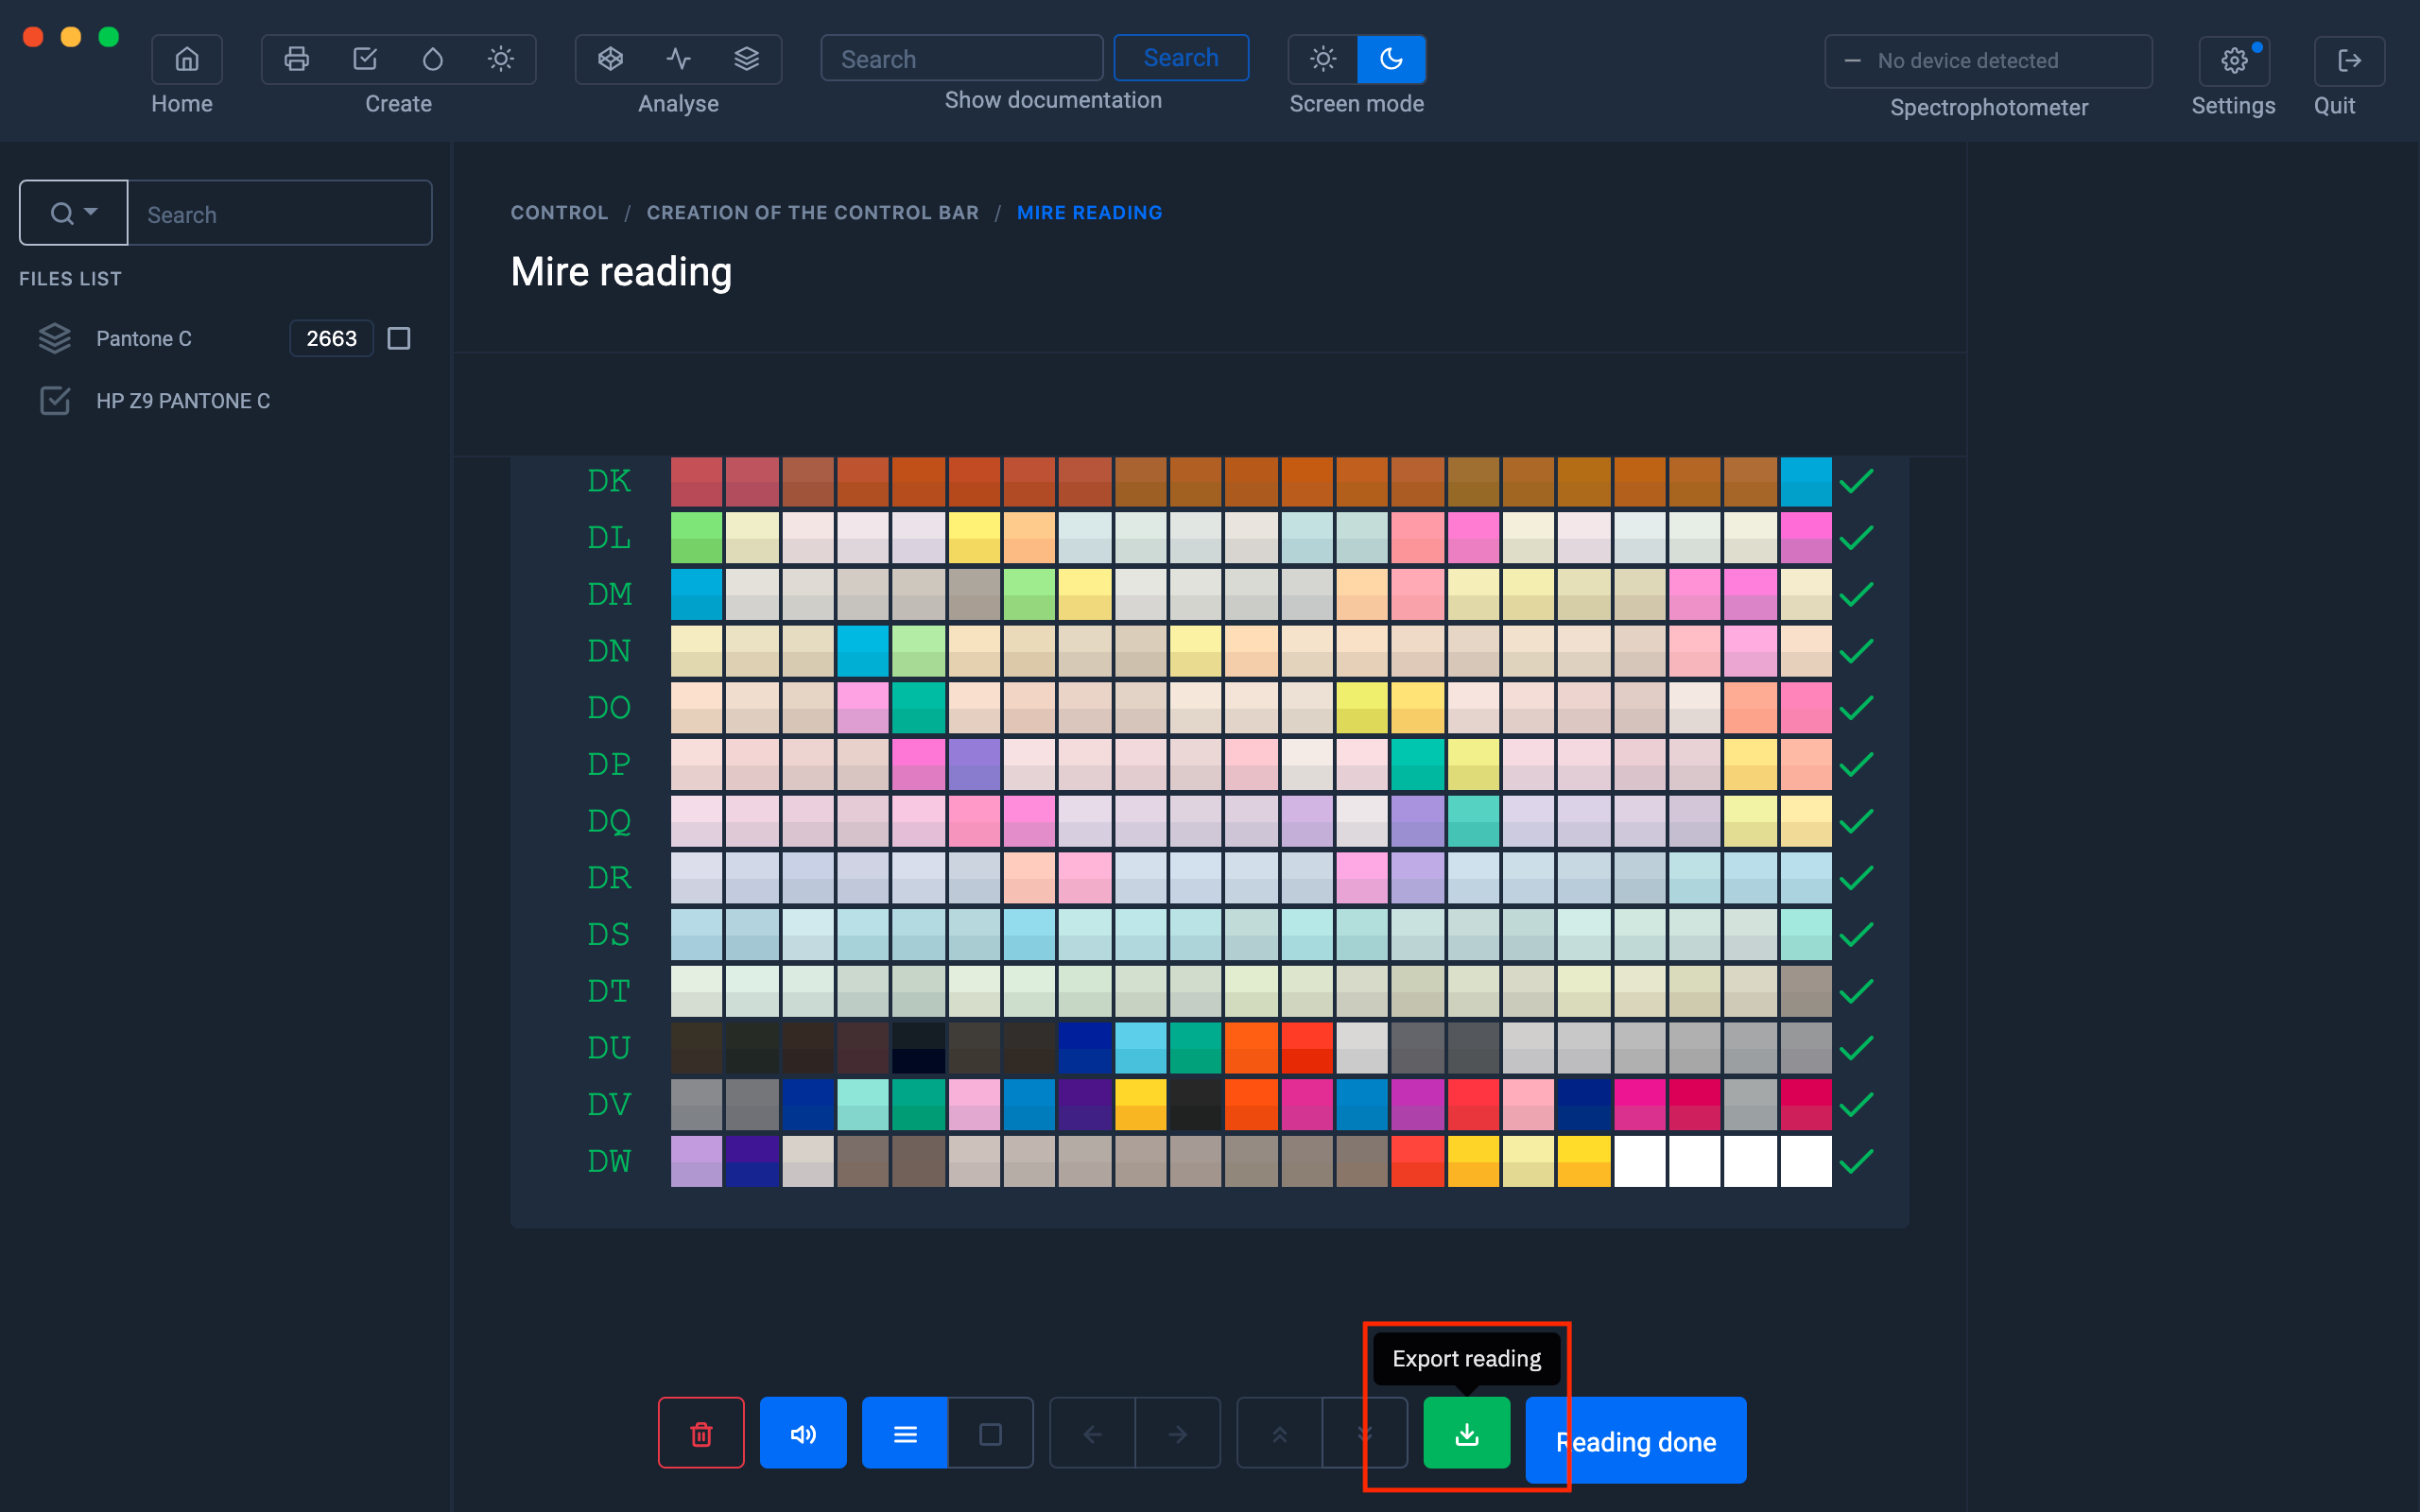
Export of the table
Once the test pattern is finished, export the measurement in .table format

The color table in .table format can be converted, subsequently, to be adapted in different formats compatible with RIPs or Adobe suite software.

The color table will appear in the left column.
Right click on the file and> Export> select the destination format according to the software used by the designer.