Create a baseline from a spot color swatch
The "Spot Colors" option of the Print Control allows you to check the color reproduction accuracy of a spot color chart on your printer.
Importing a color table
In this example, we will use the colors from a tinted vinyl swatch that we created by measuring samples with the "Color Table" module.
For more information, see chapter: Color Table
It is obviously possible to control the colors of other types of color charts such as PANTONES, RAL, etc.
Import a color table containing spot colors
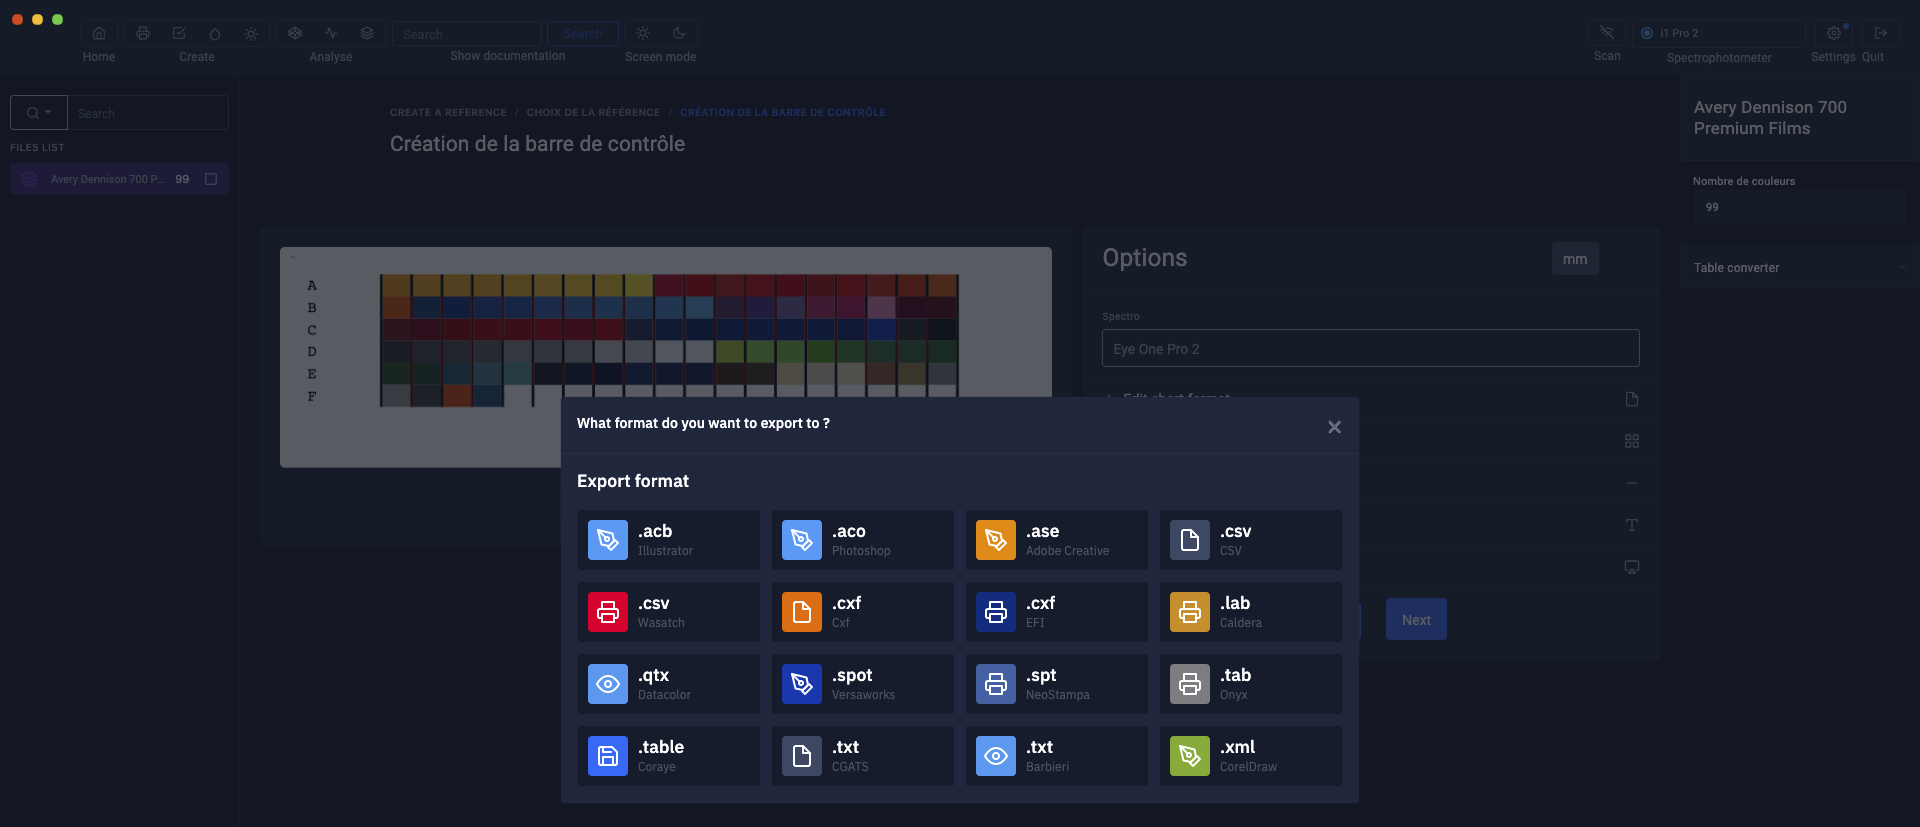
List of color table formats supported by Coraye:
- Native format in JSON standard (.table)
- CXF (.cxf) to share with EFI RIP, XRite, PANTONE, Xrite eXact ... (import / export)
- Adobe ( .ase, .aco, .acb) to share with Photoshop, Illustrator, Indesign and Epson Edge Print RIP Import / Export)
- CSV (.csv) to share with Microsoft Excel, RIP Wasatch (import / export)
- Caldera (.lab ) (export only)
- CorelDraw (.xml)
- NeoStampa (.spt)
- CIE CGATS (.txt)
- Onyx Postershop (.tab)
- Data Color (.qtx) (Only supports spectral data)
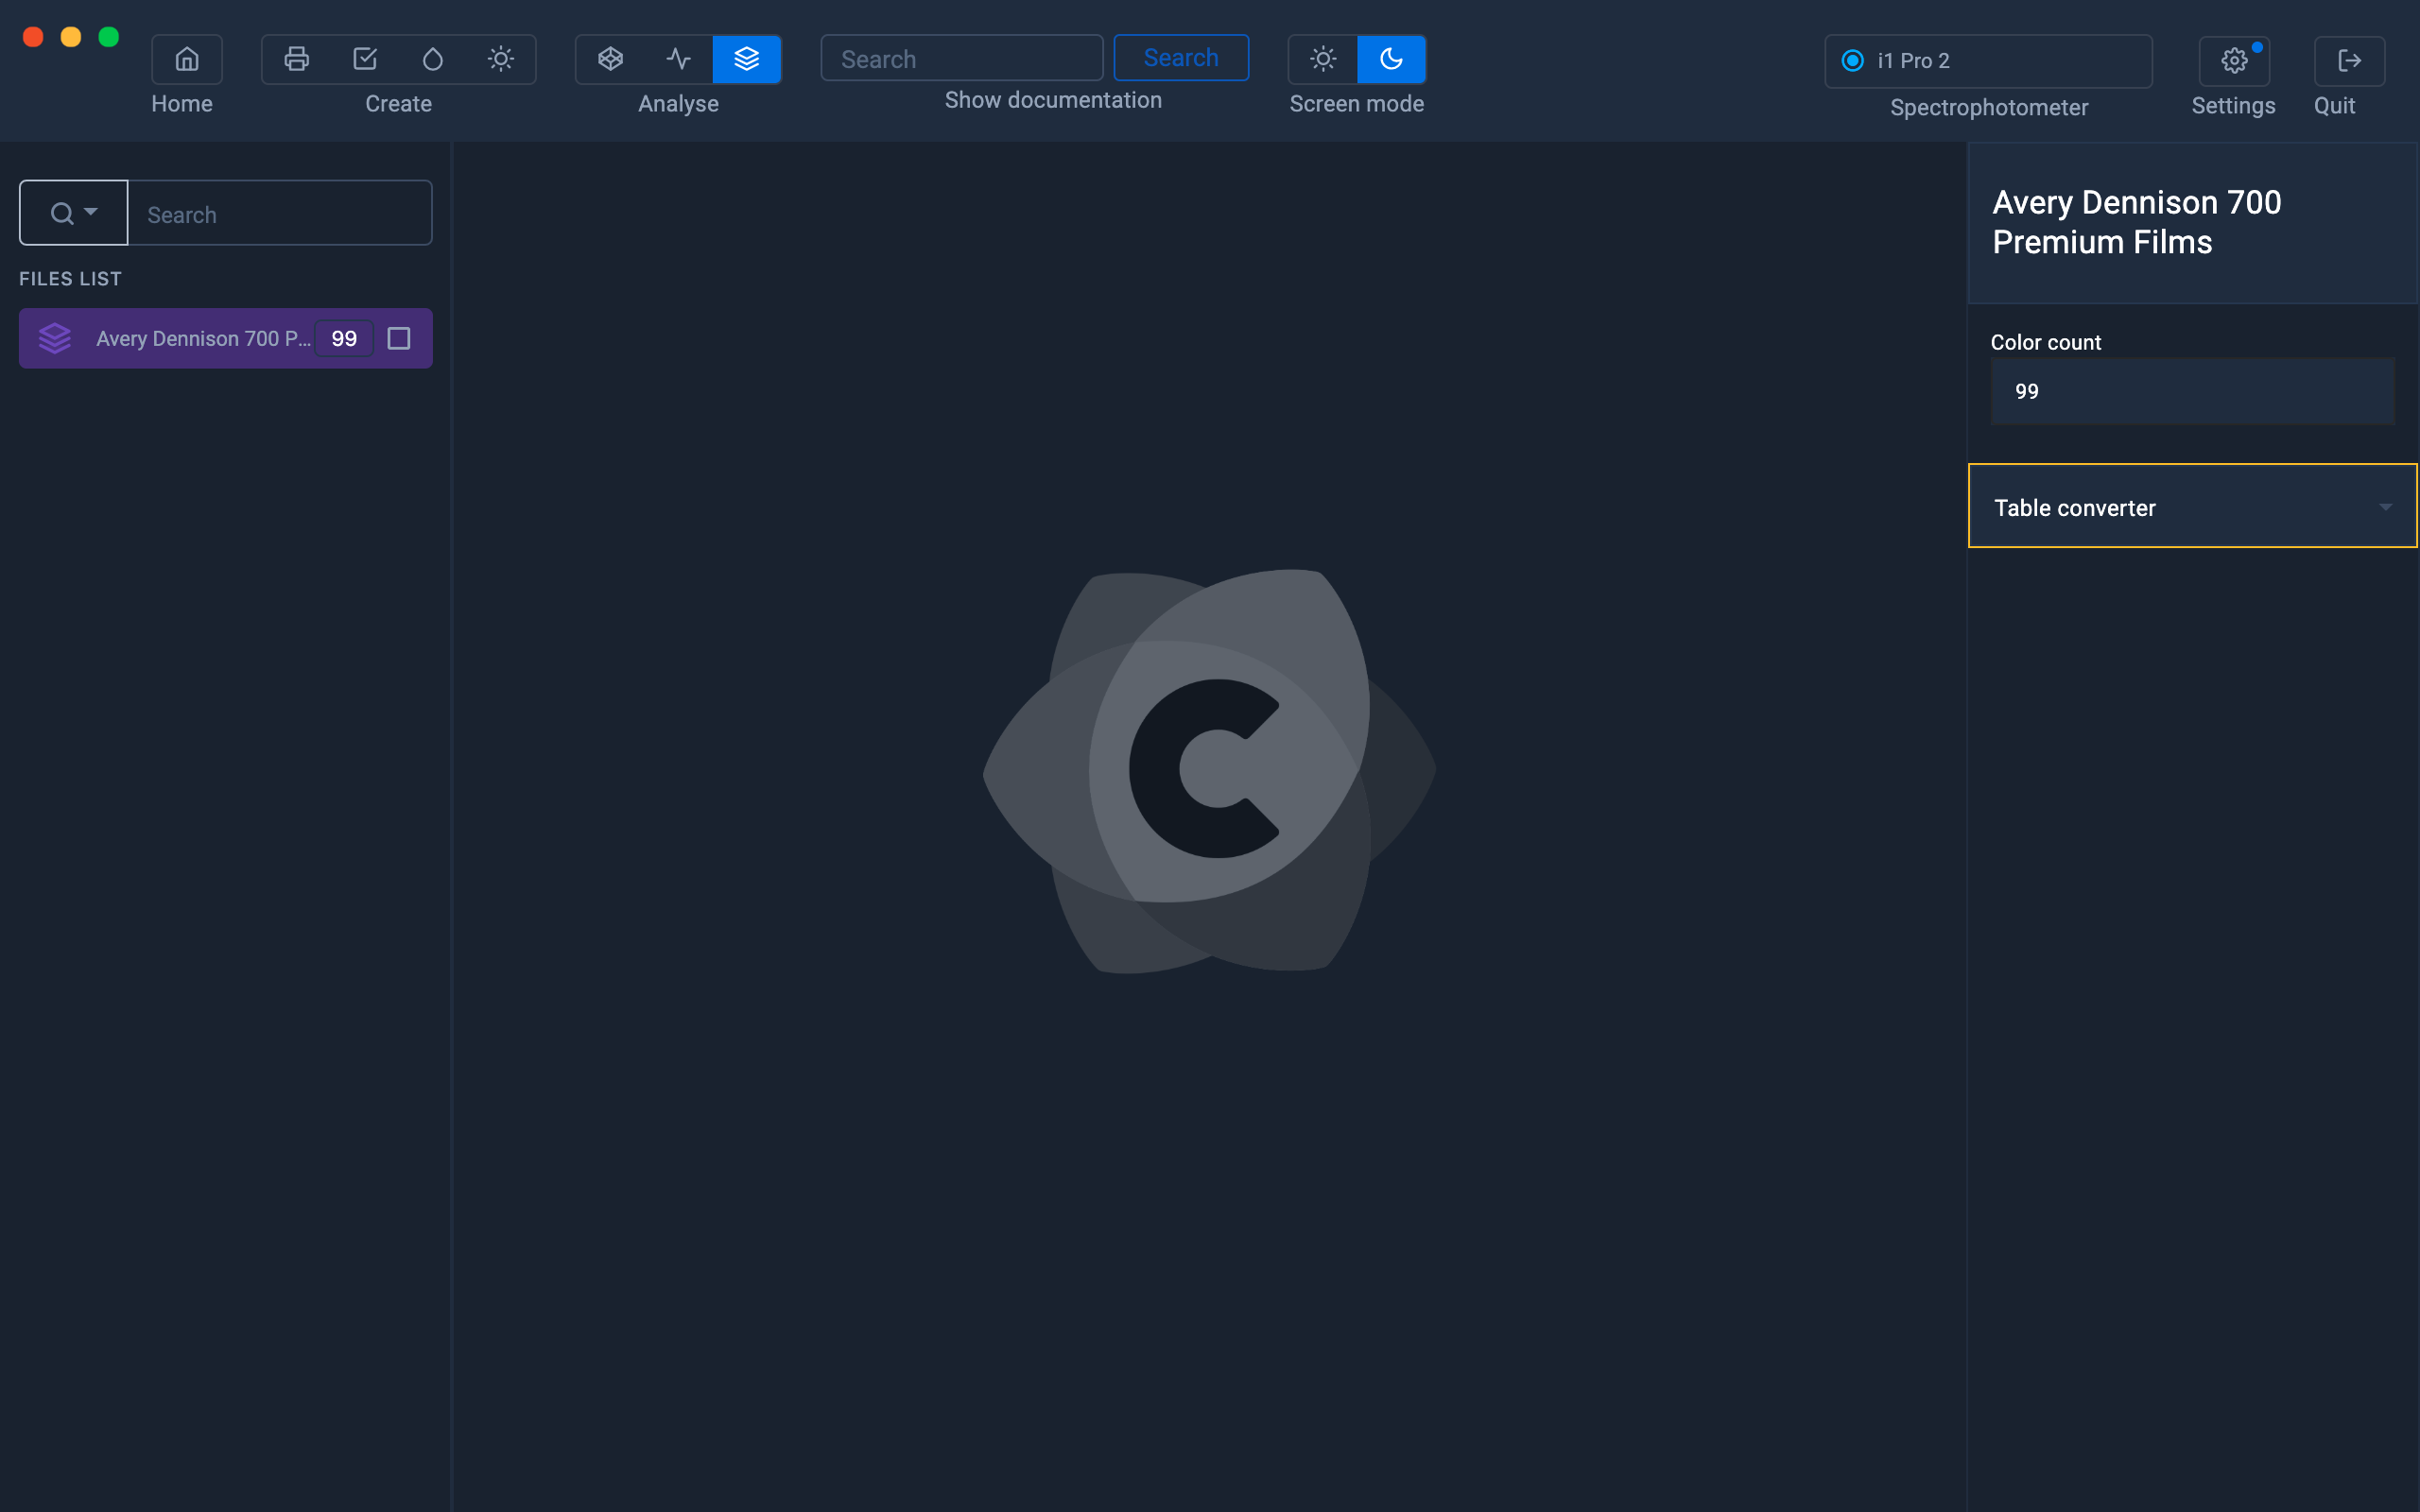
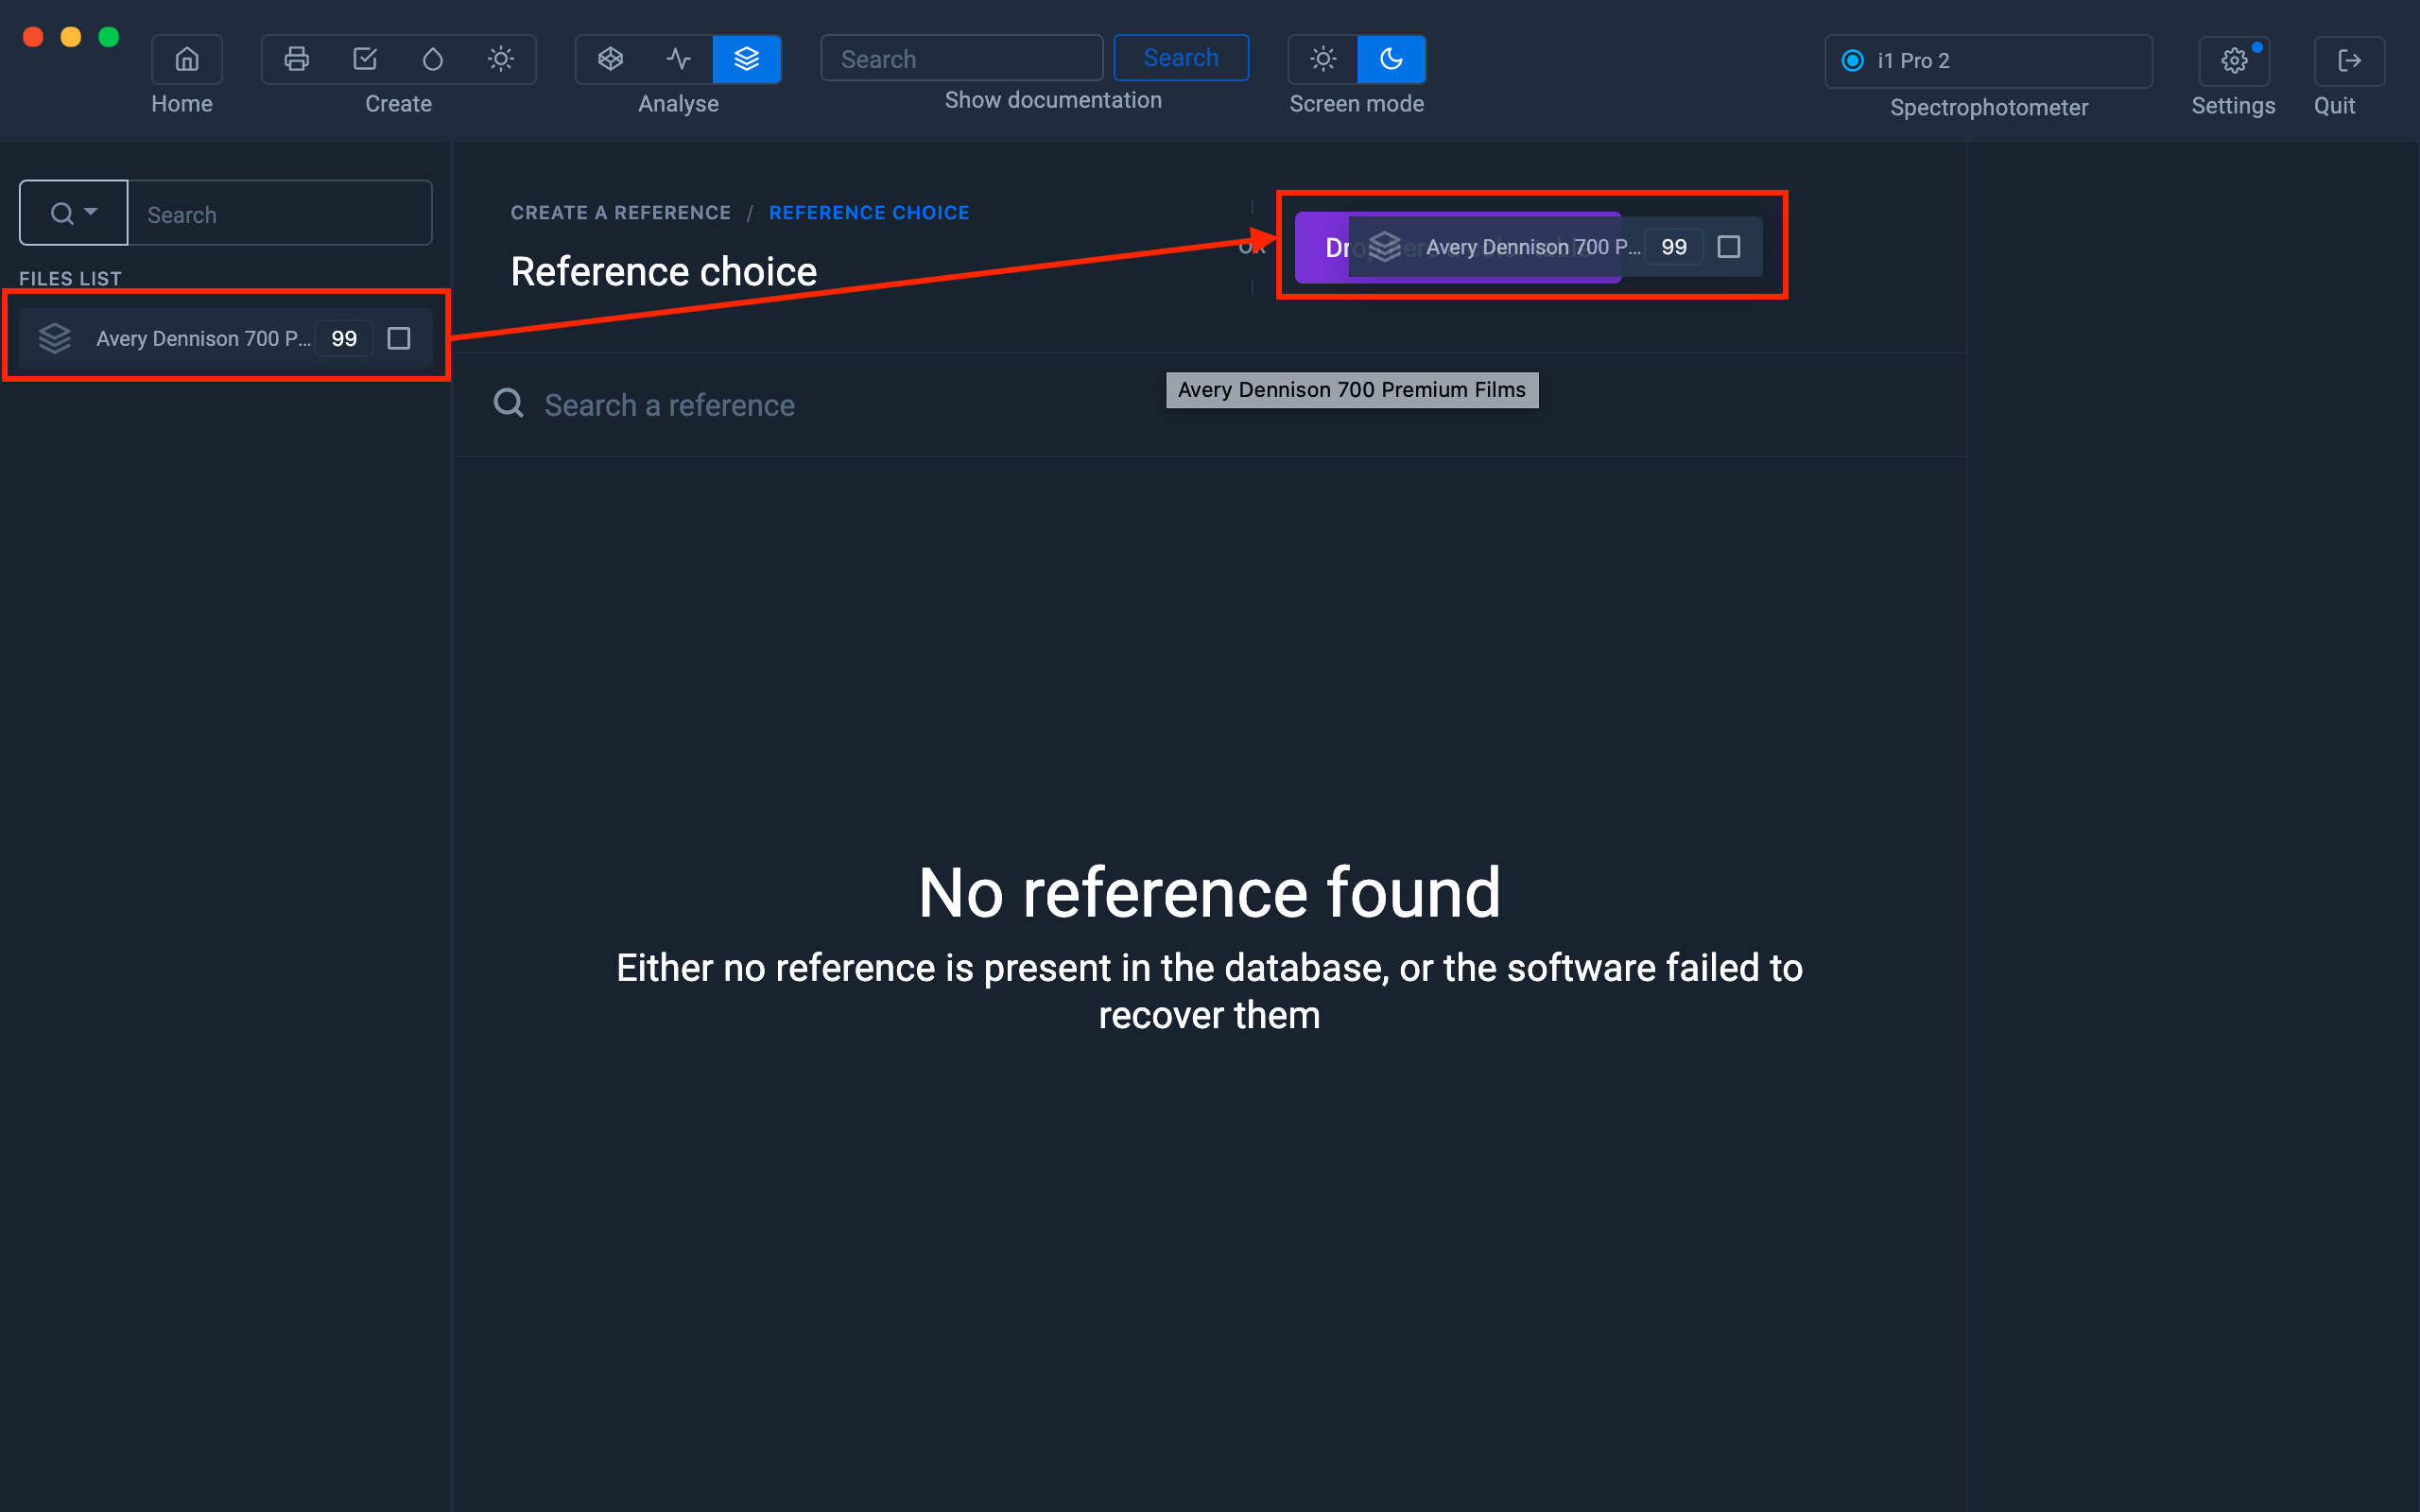
The imported table now appears in the left column
Creating the Print Control Reference File
Click on the Print Control icon located at the top left, then click on the " Create Reference " button.
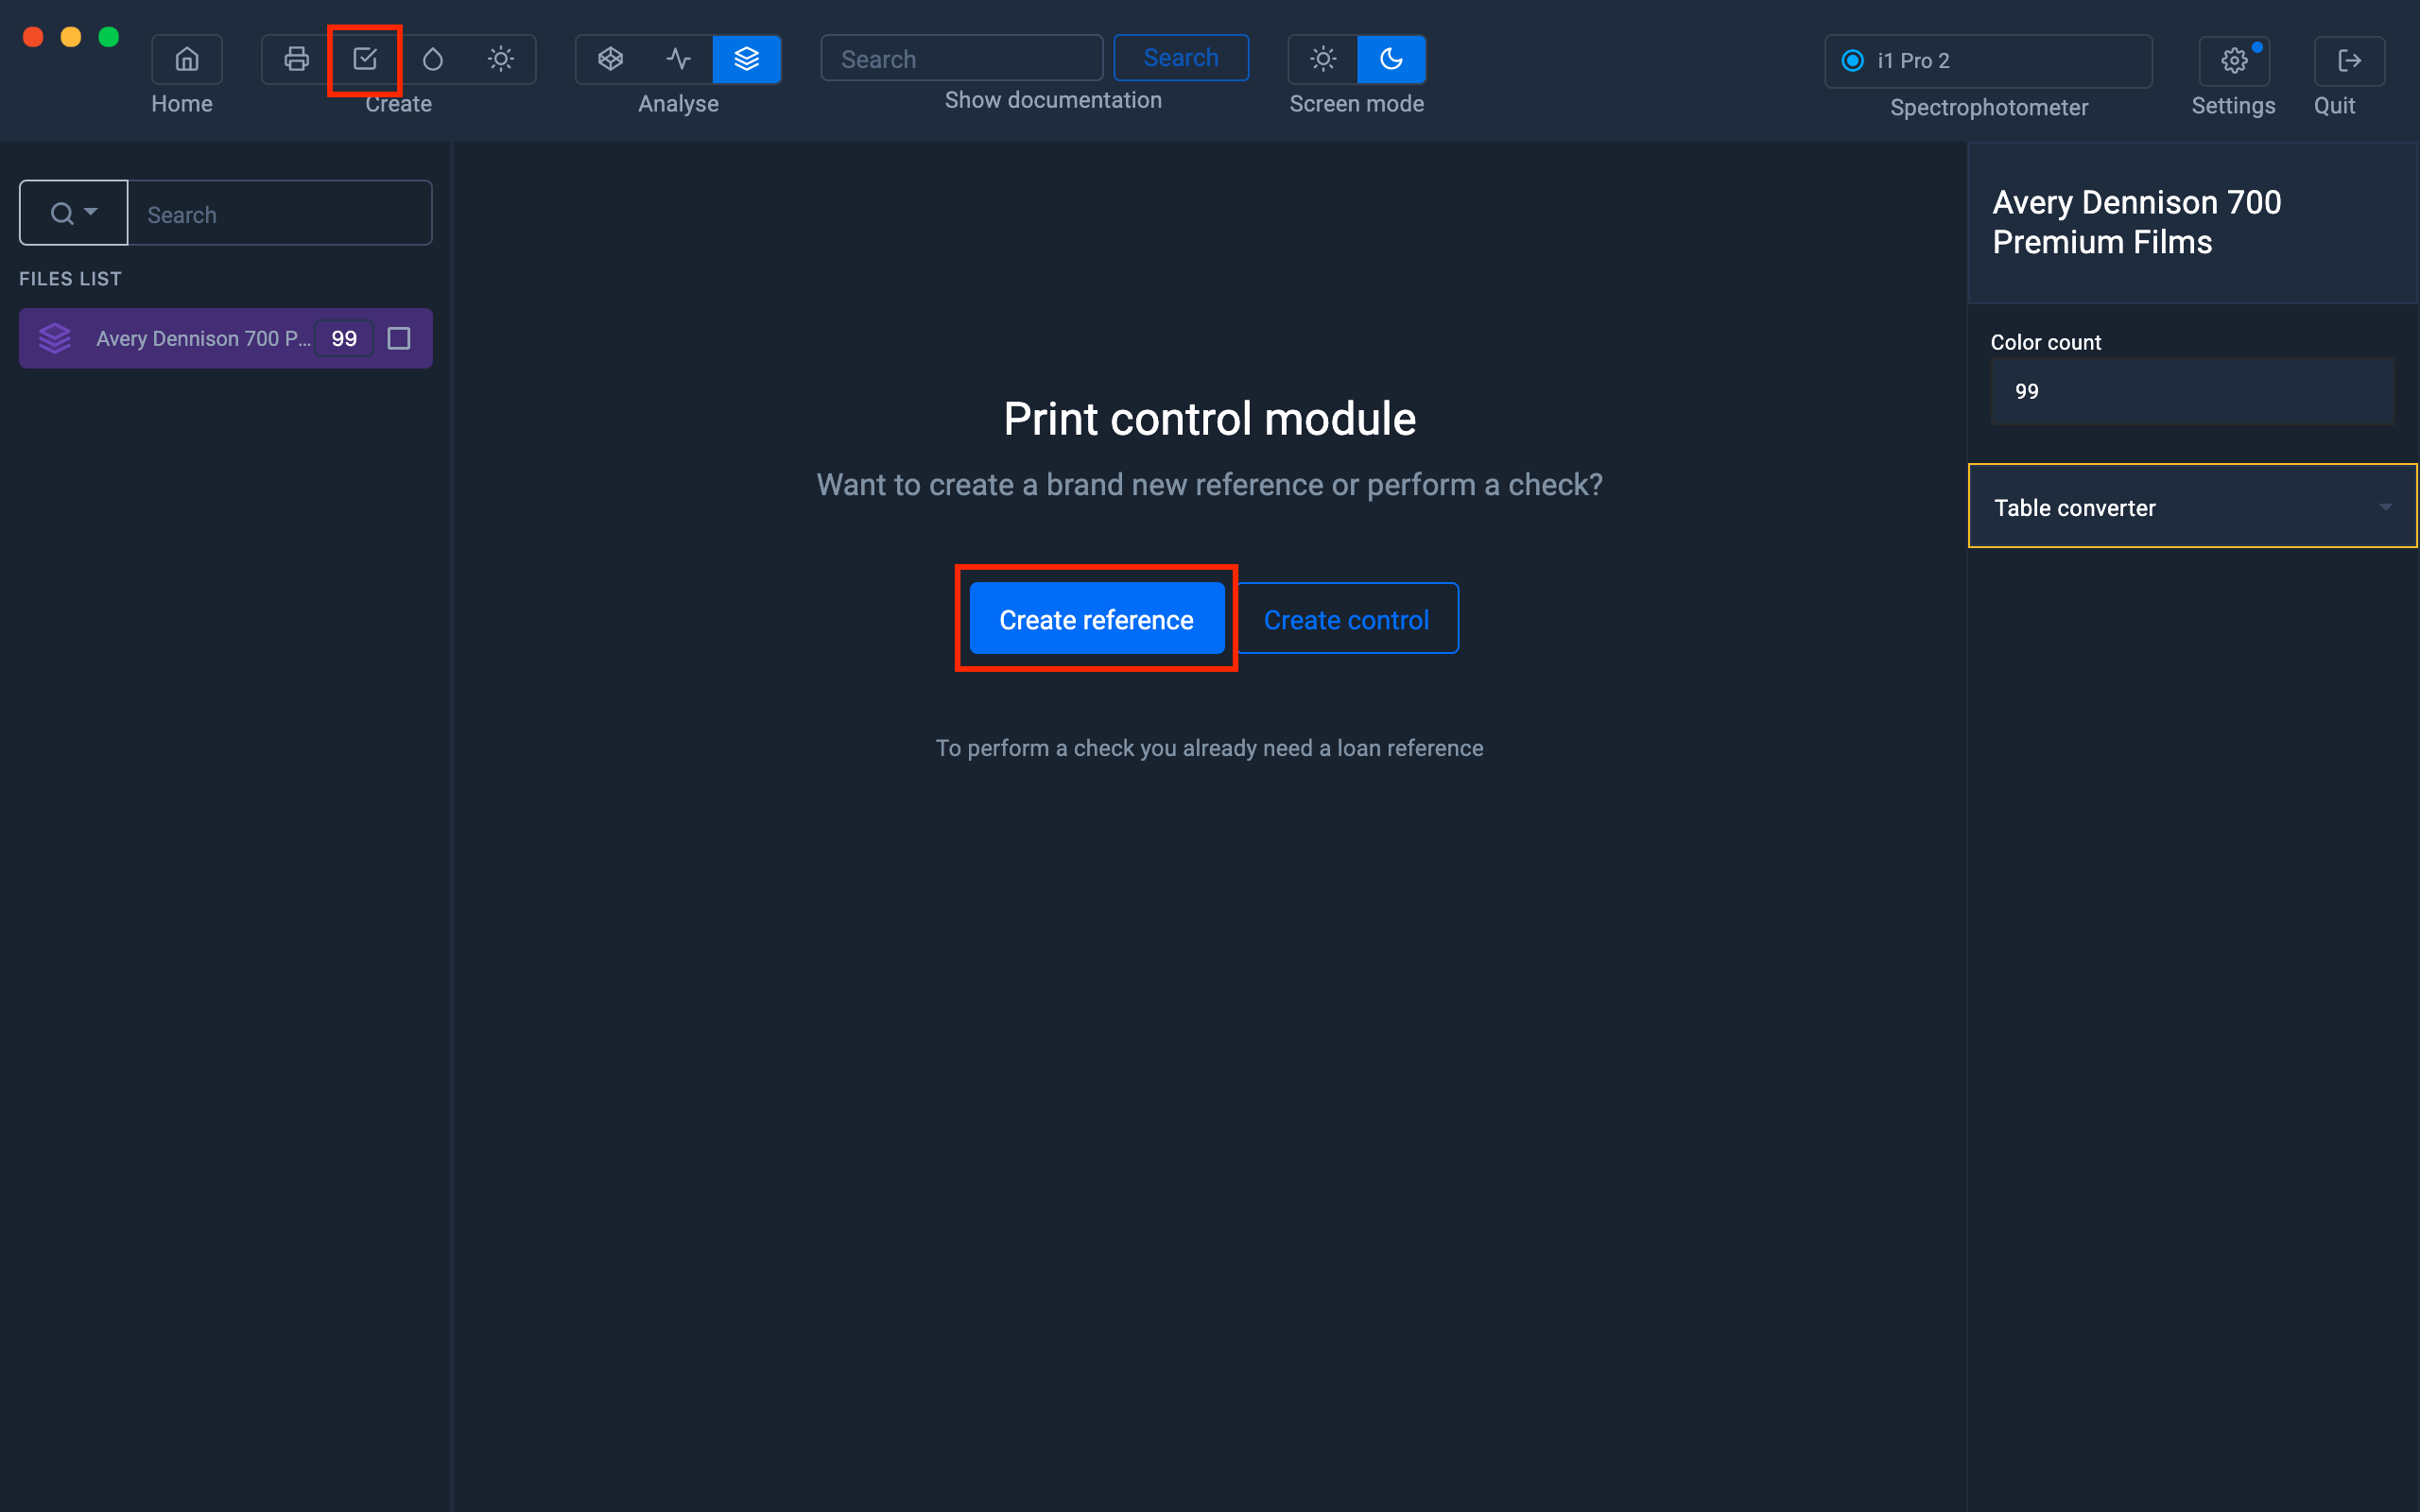
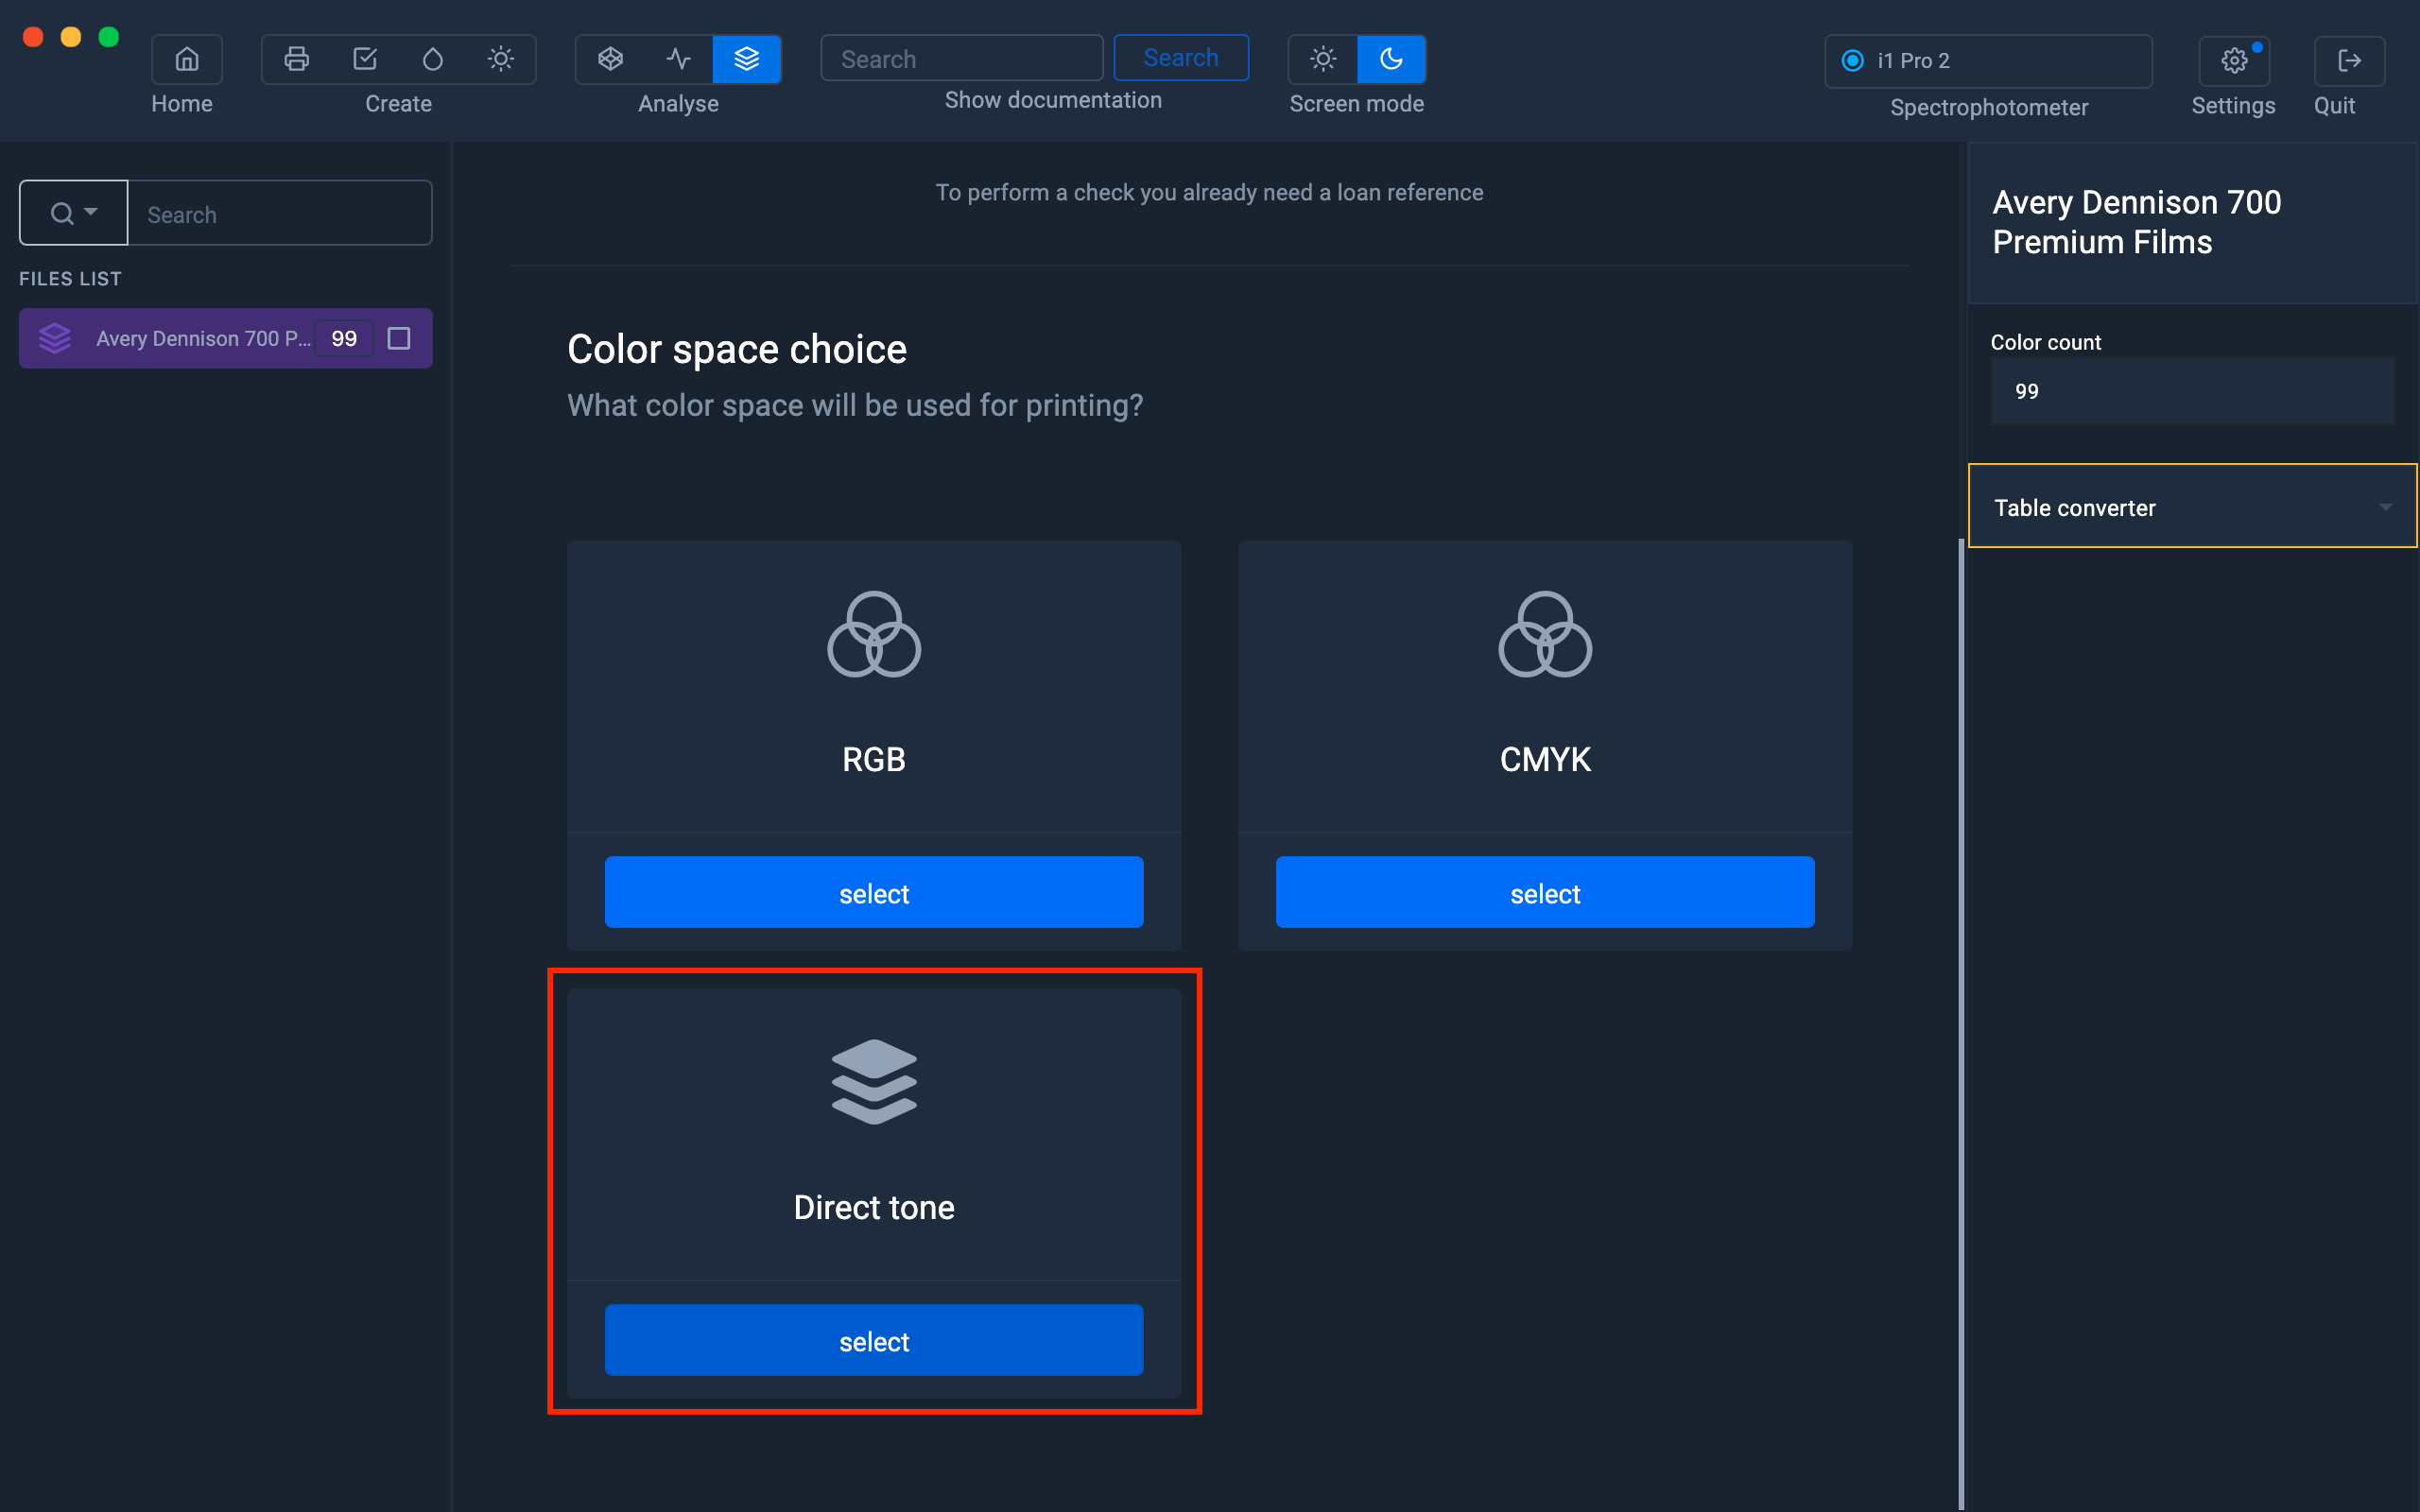
Since we want to control spot colors, we will select the " Spot color" pictogram.
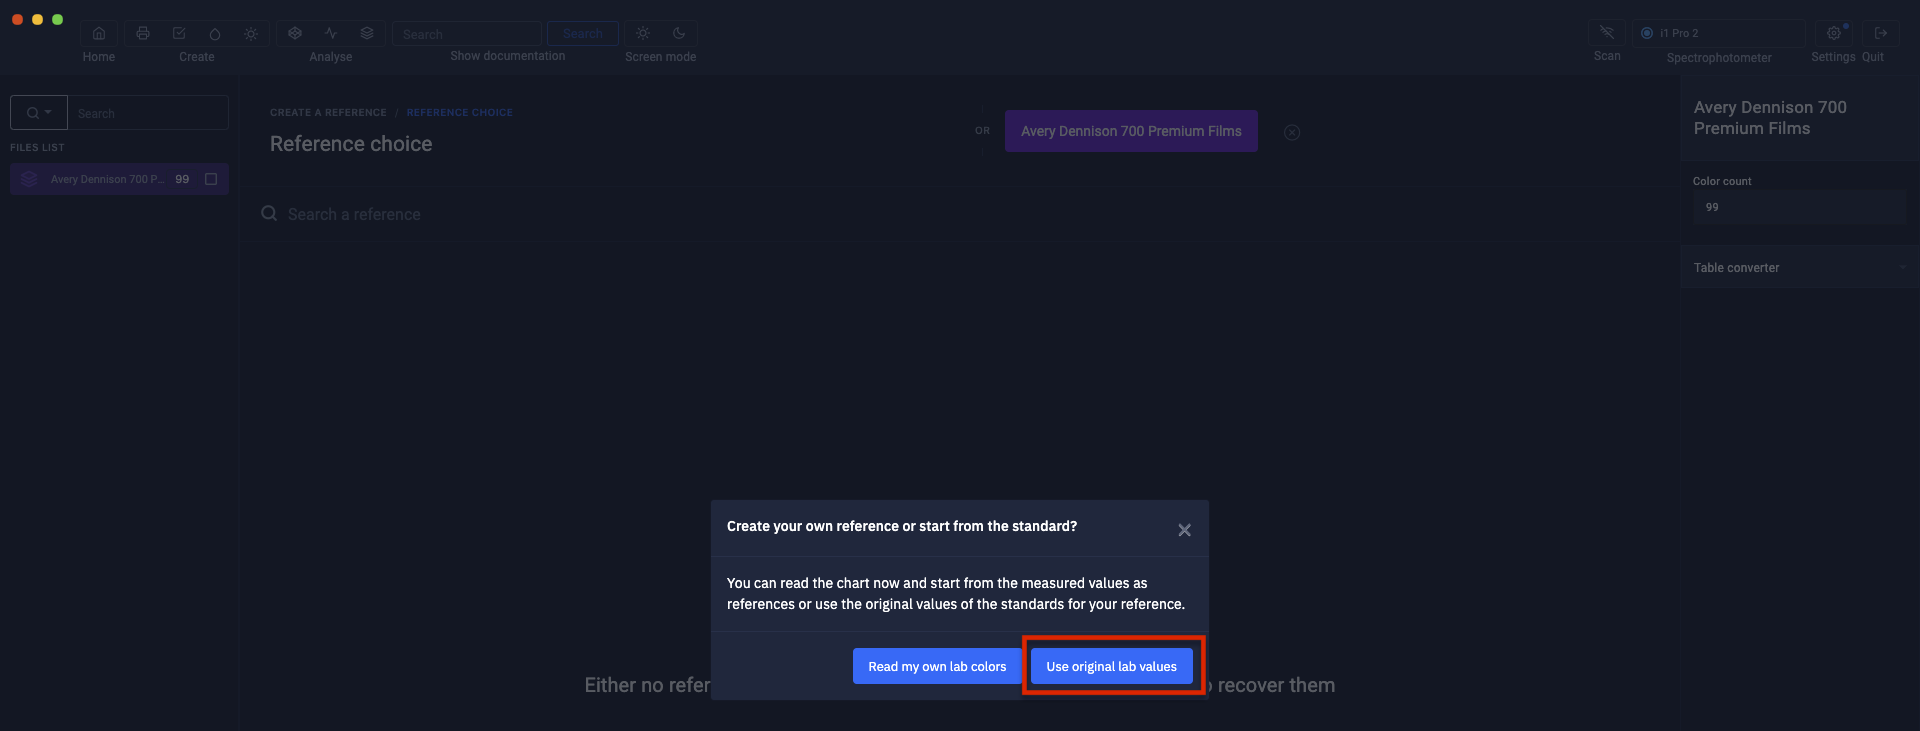
In this new window, drag the color table into the area: " Drag a color table here ".
Click the " Use Standard Labs " button to use the Lab values of the spot colors to perform the check.
Printing the test pattern
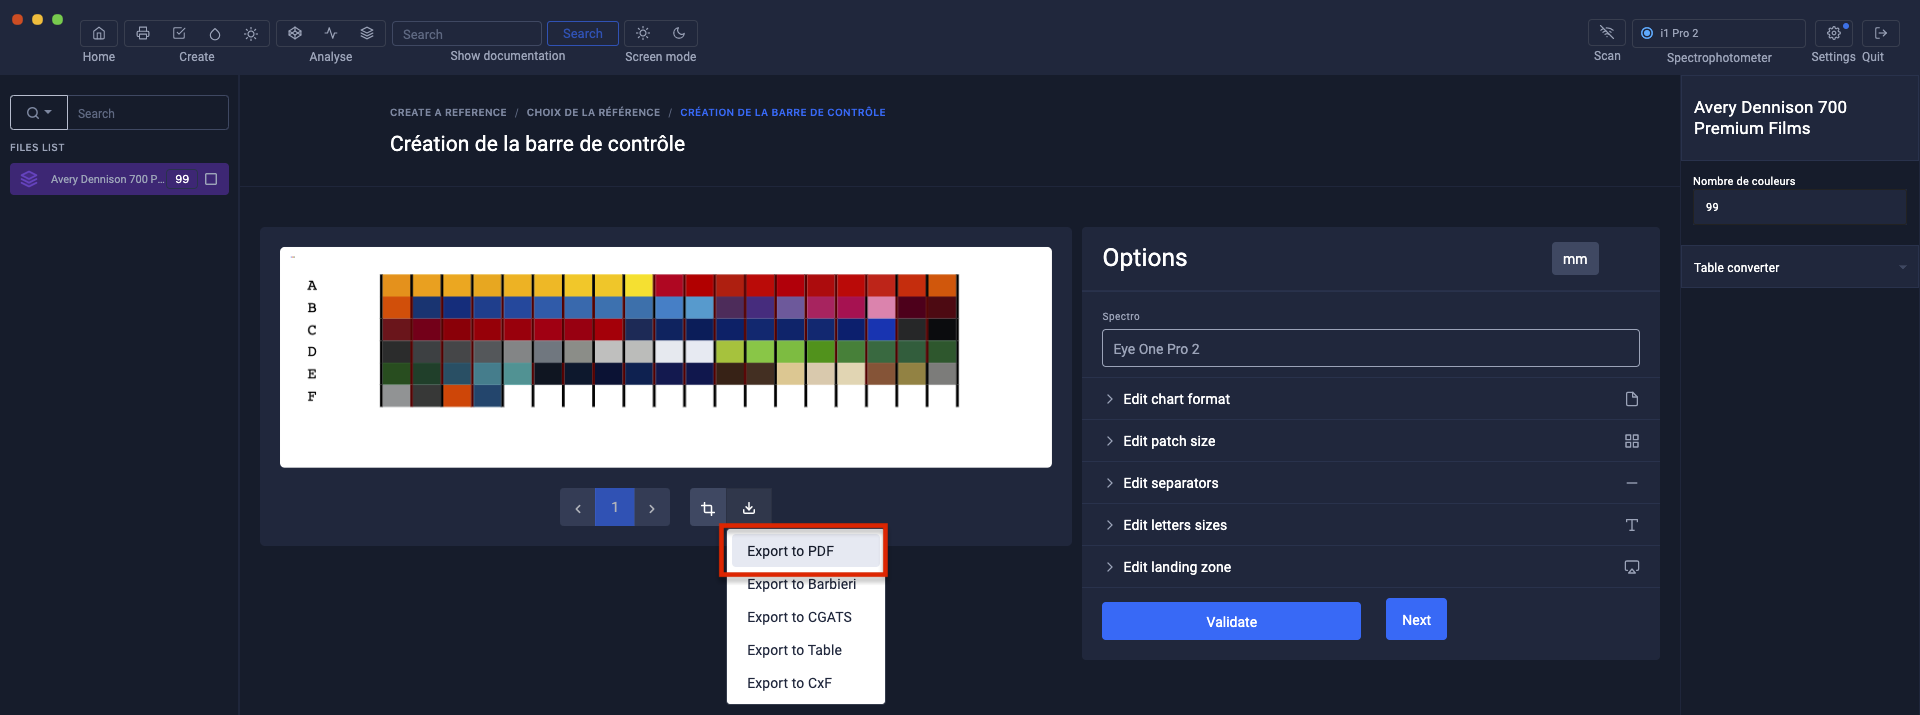
A test pattern containing the spot colors is created, you can customize the format of this test pattern using the editing tools located on the right.
To find out more, see the chapter: Customizing charts

Export the color table that you used to create the test pattern, in the format compatible with your RIP.
This step is important because RIPs recognize spot colors by their names.
Then, thanks to internal color tables, they associate these names with their reference values to print them. You must therefore import these reference values into your RIP to best reproduce the named shades.
To export the tables, right click on the table located in the left column, then select "Export".

Select the export format according to the RIP on which you will install the color table.
Tutorials on installing color tables on RIPs are available in "Color Tables"
For more information, see chapter: Color Table
Export the test chart in pdf format to print it in your preferred RIP.
It is not necessarily necessary to save your pdf now, you can also do it during the control step.
This pdf contains all the spot colors of your table.
Some RIPs are limited by the amount of named tints contained in a document
Click on "Next".
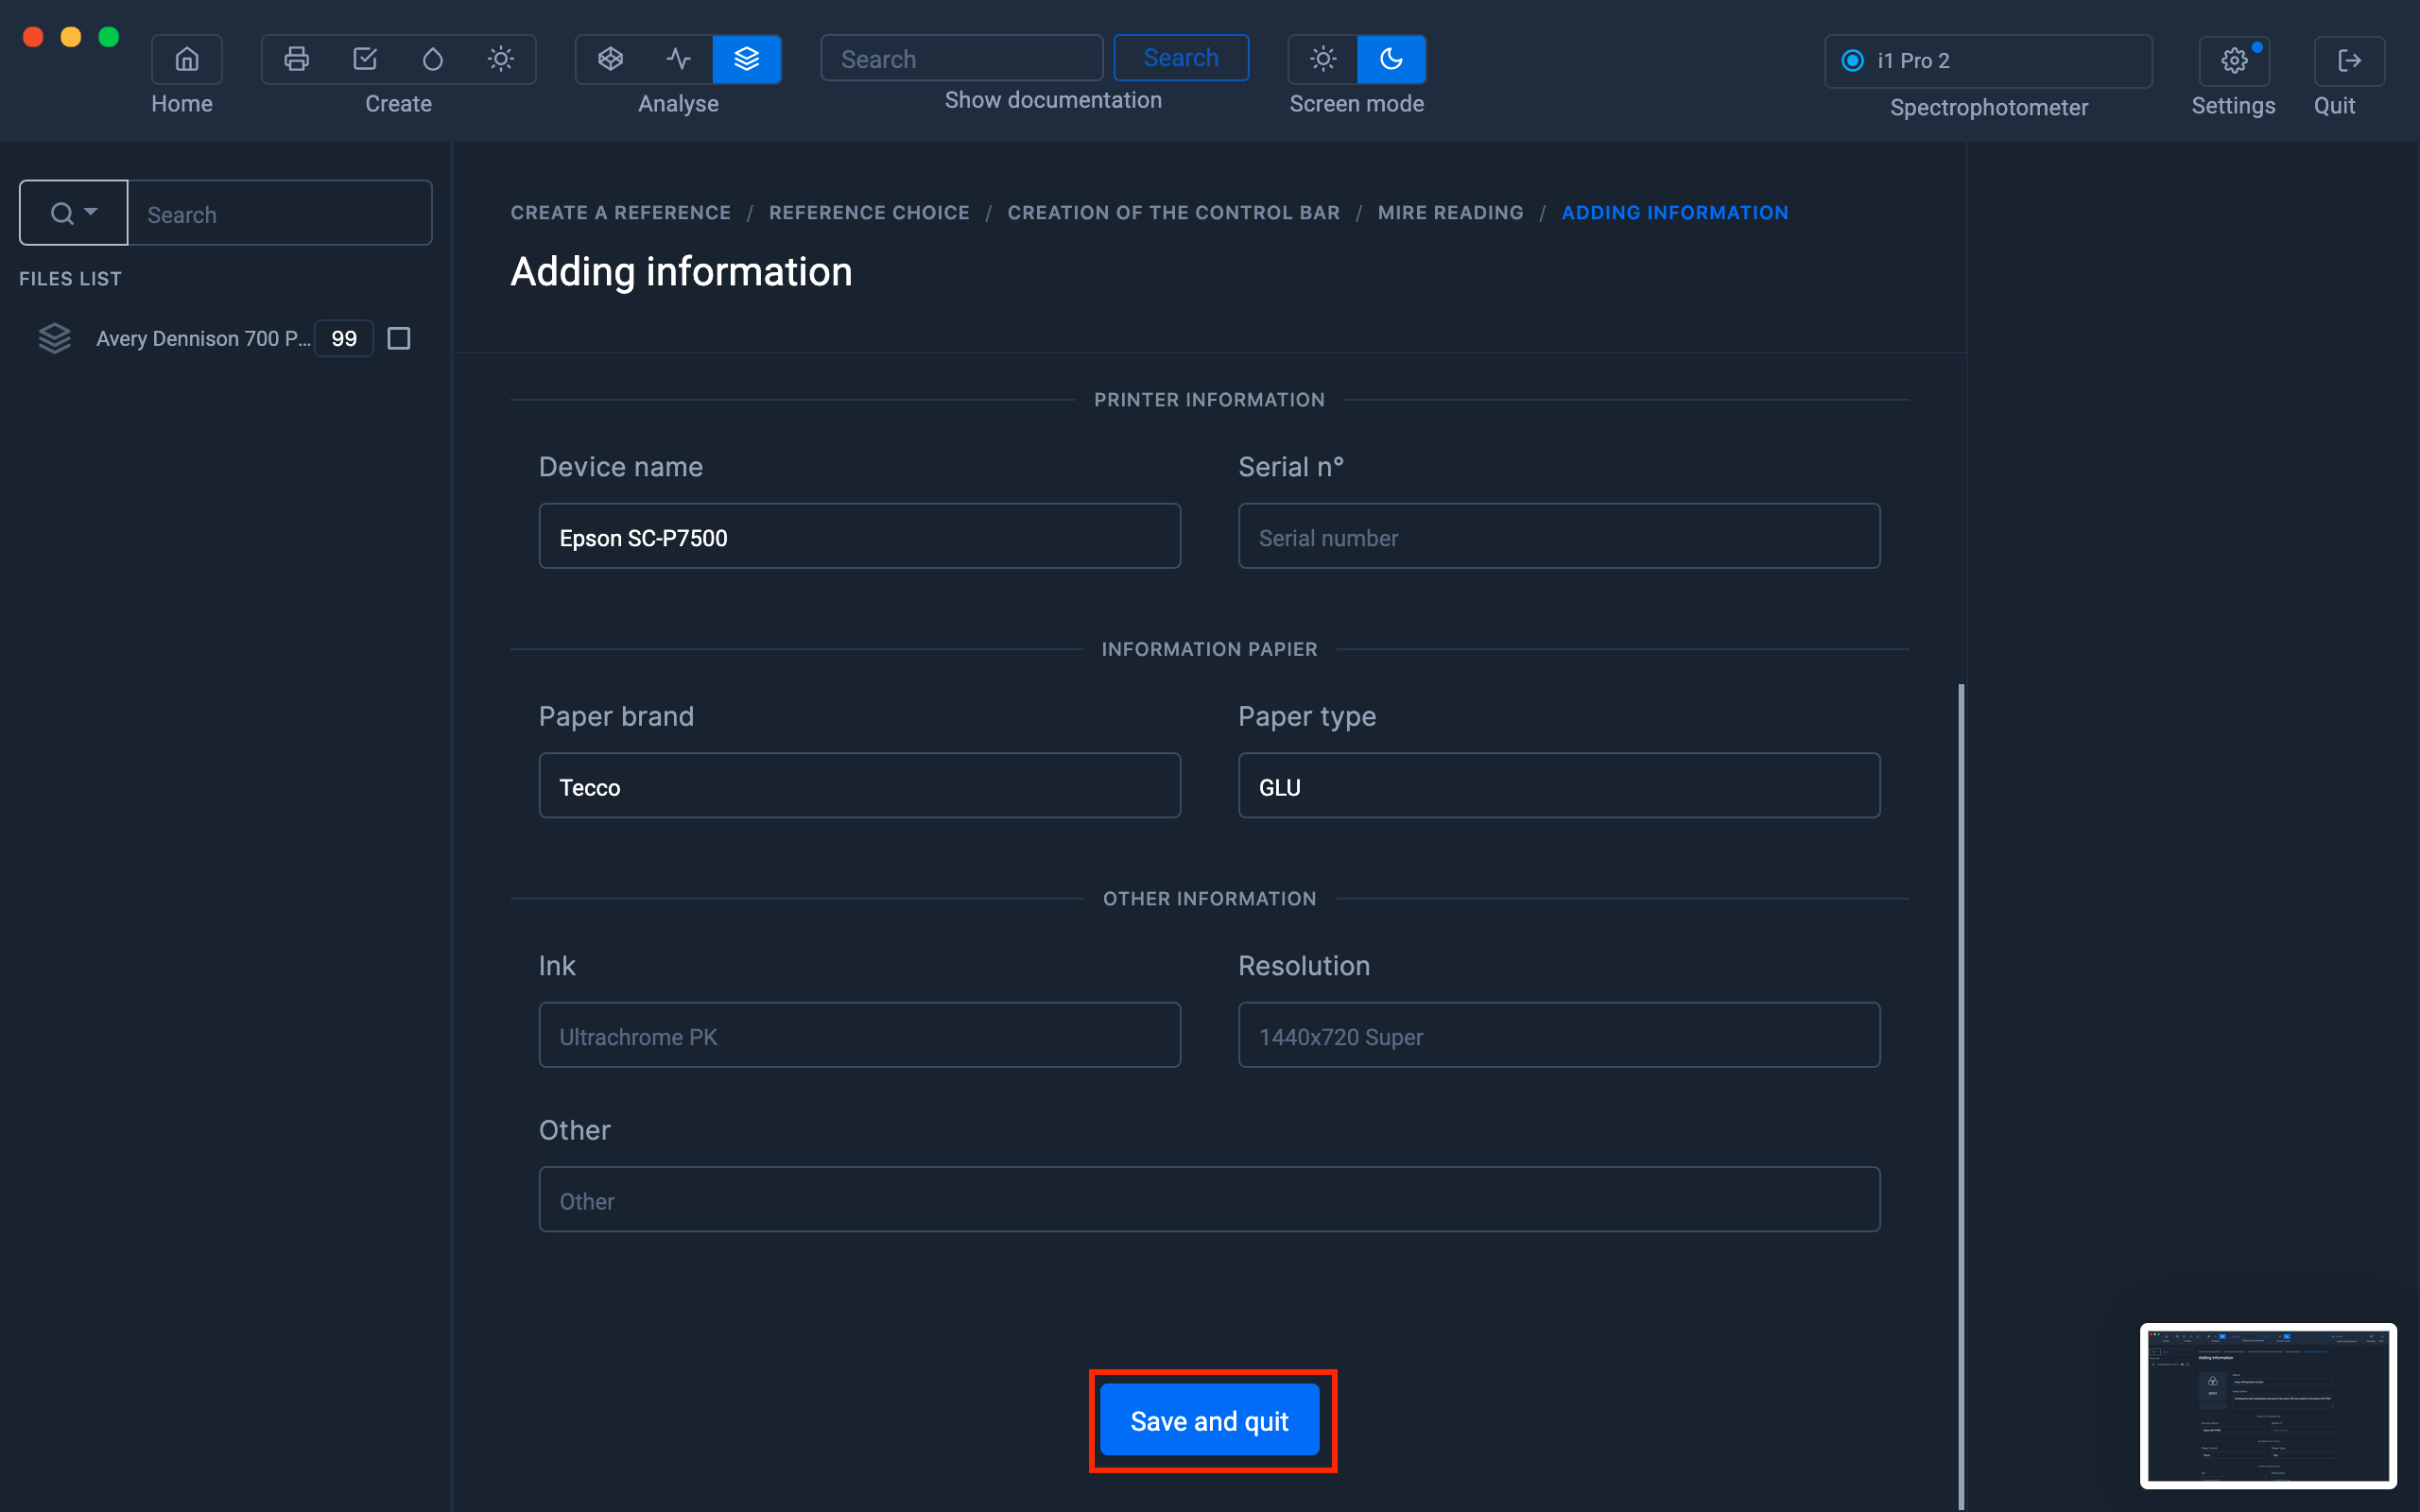
In the information window, only the name of the setting is mandatory. The other information is optional.
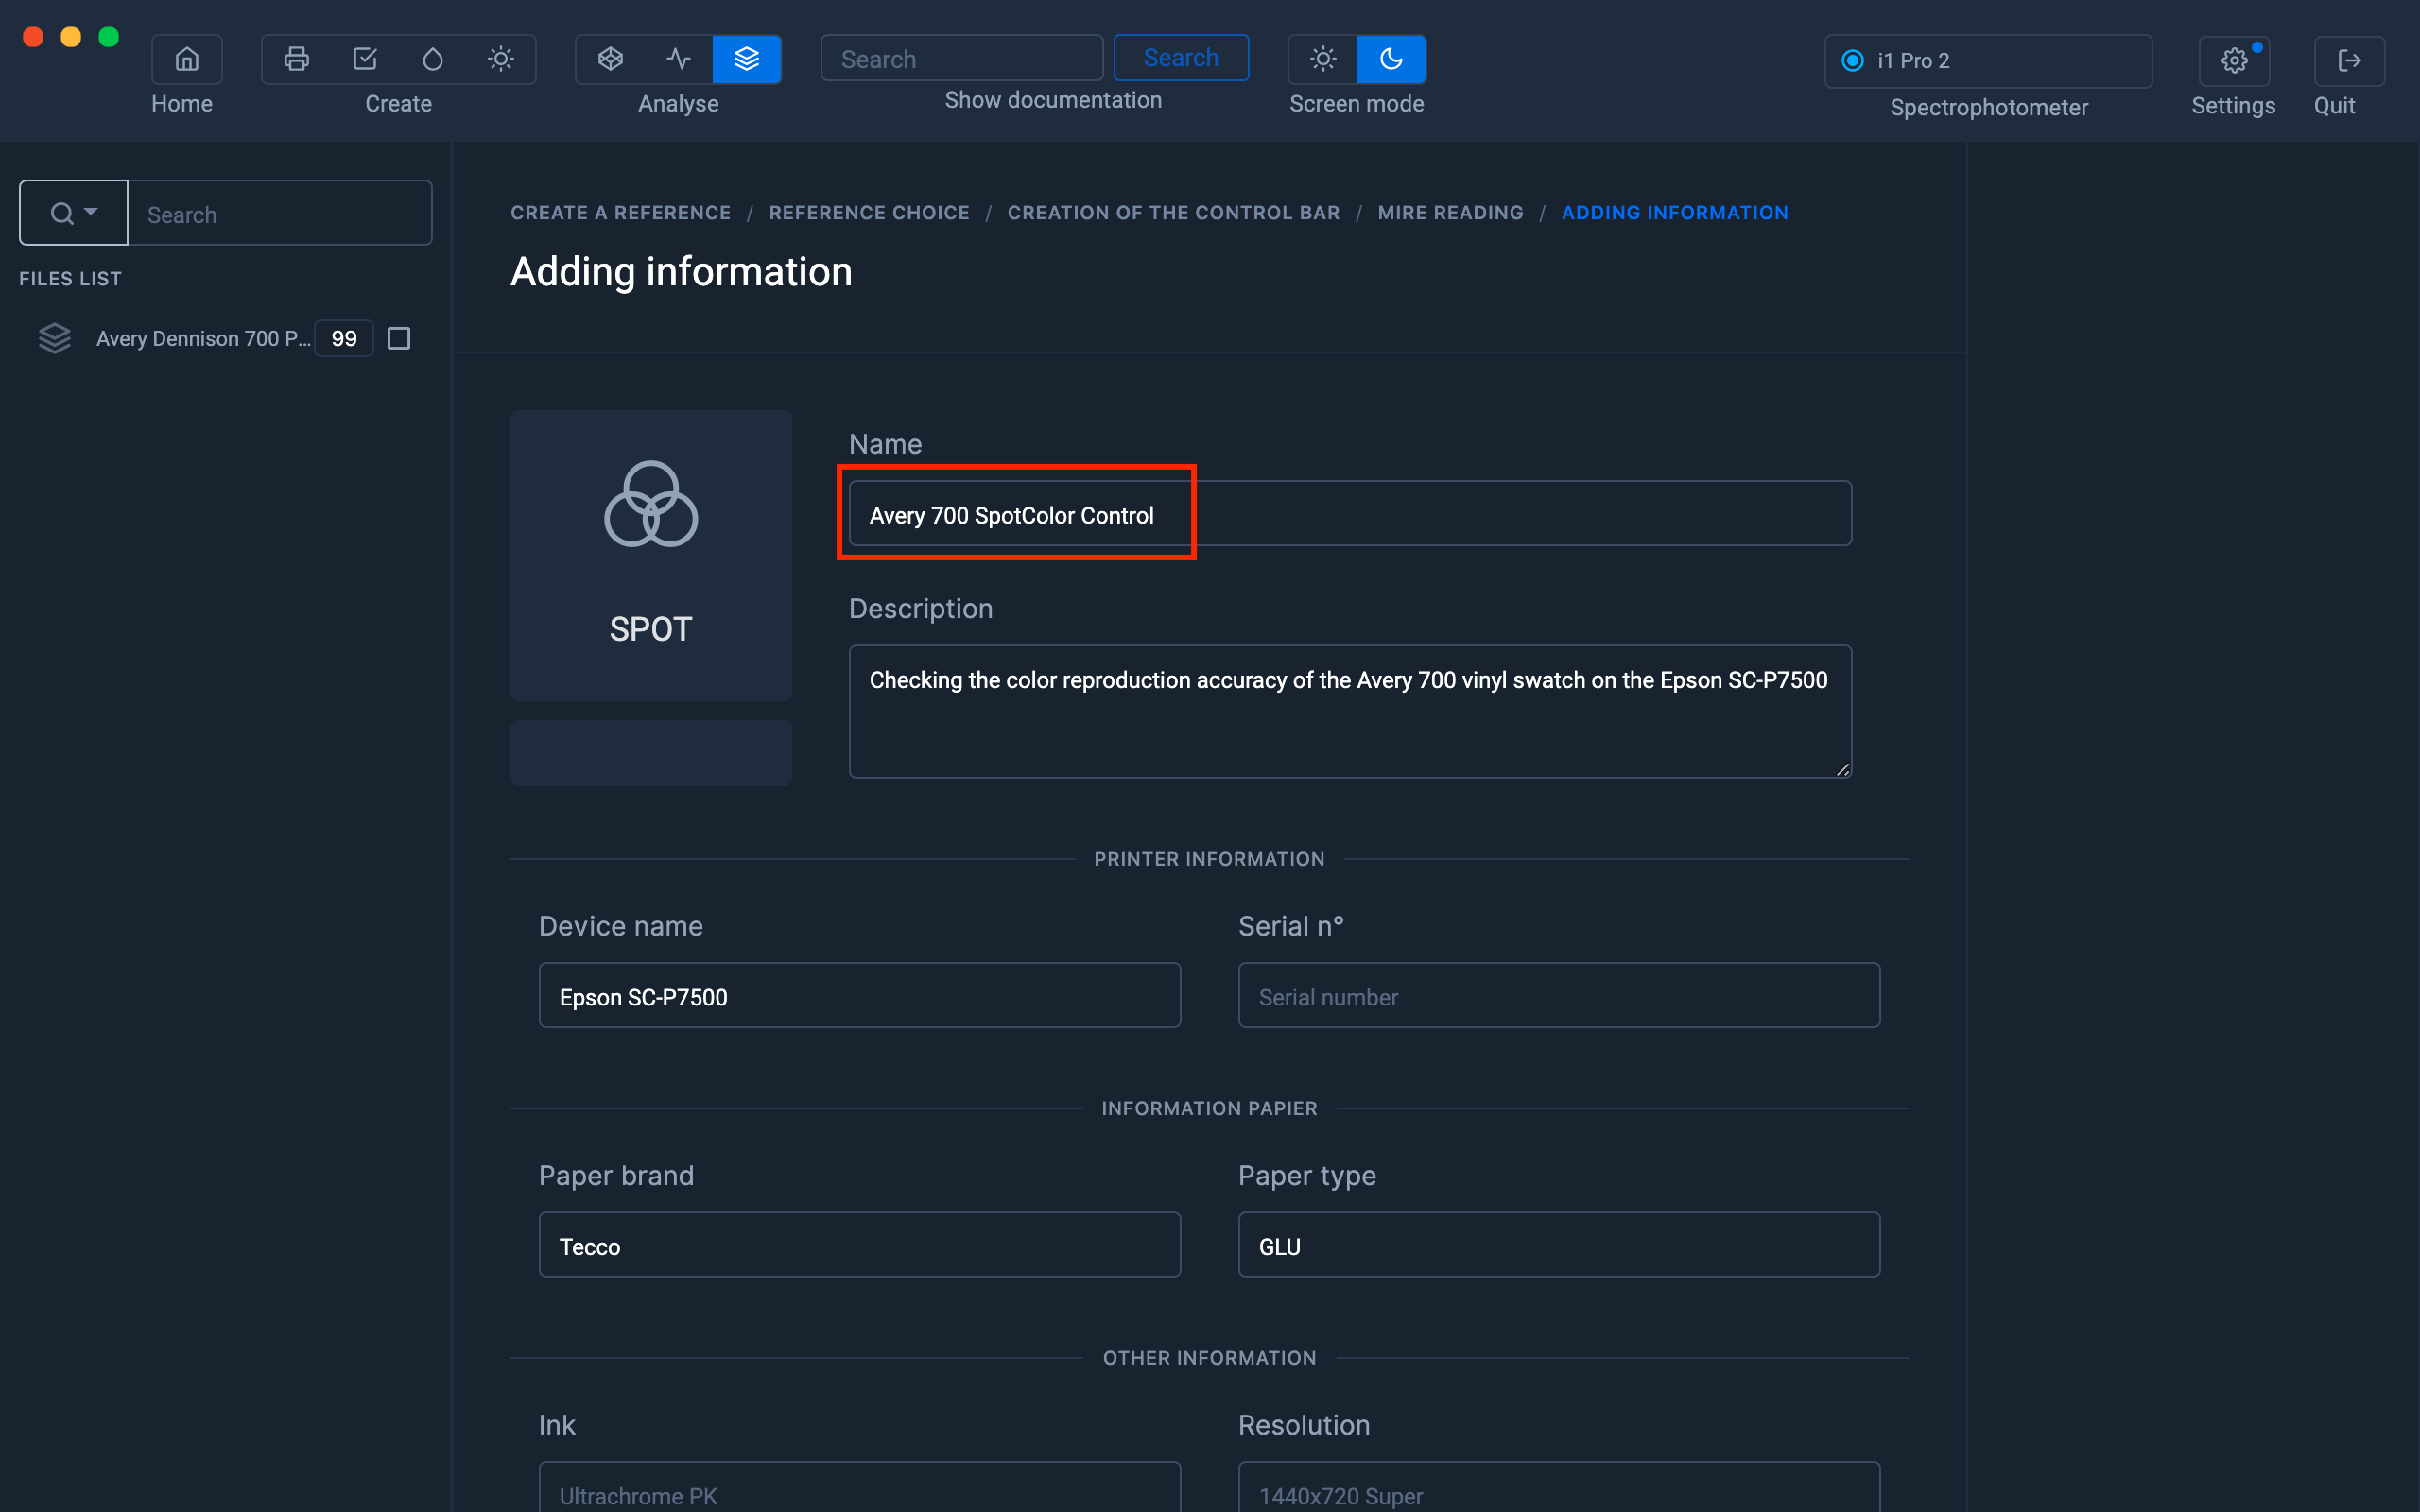
Click on " Save and exit " to create the Print Control file.
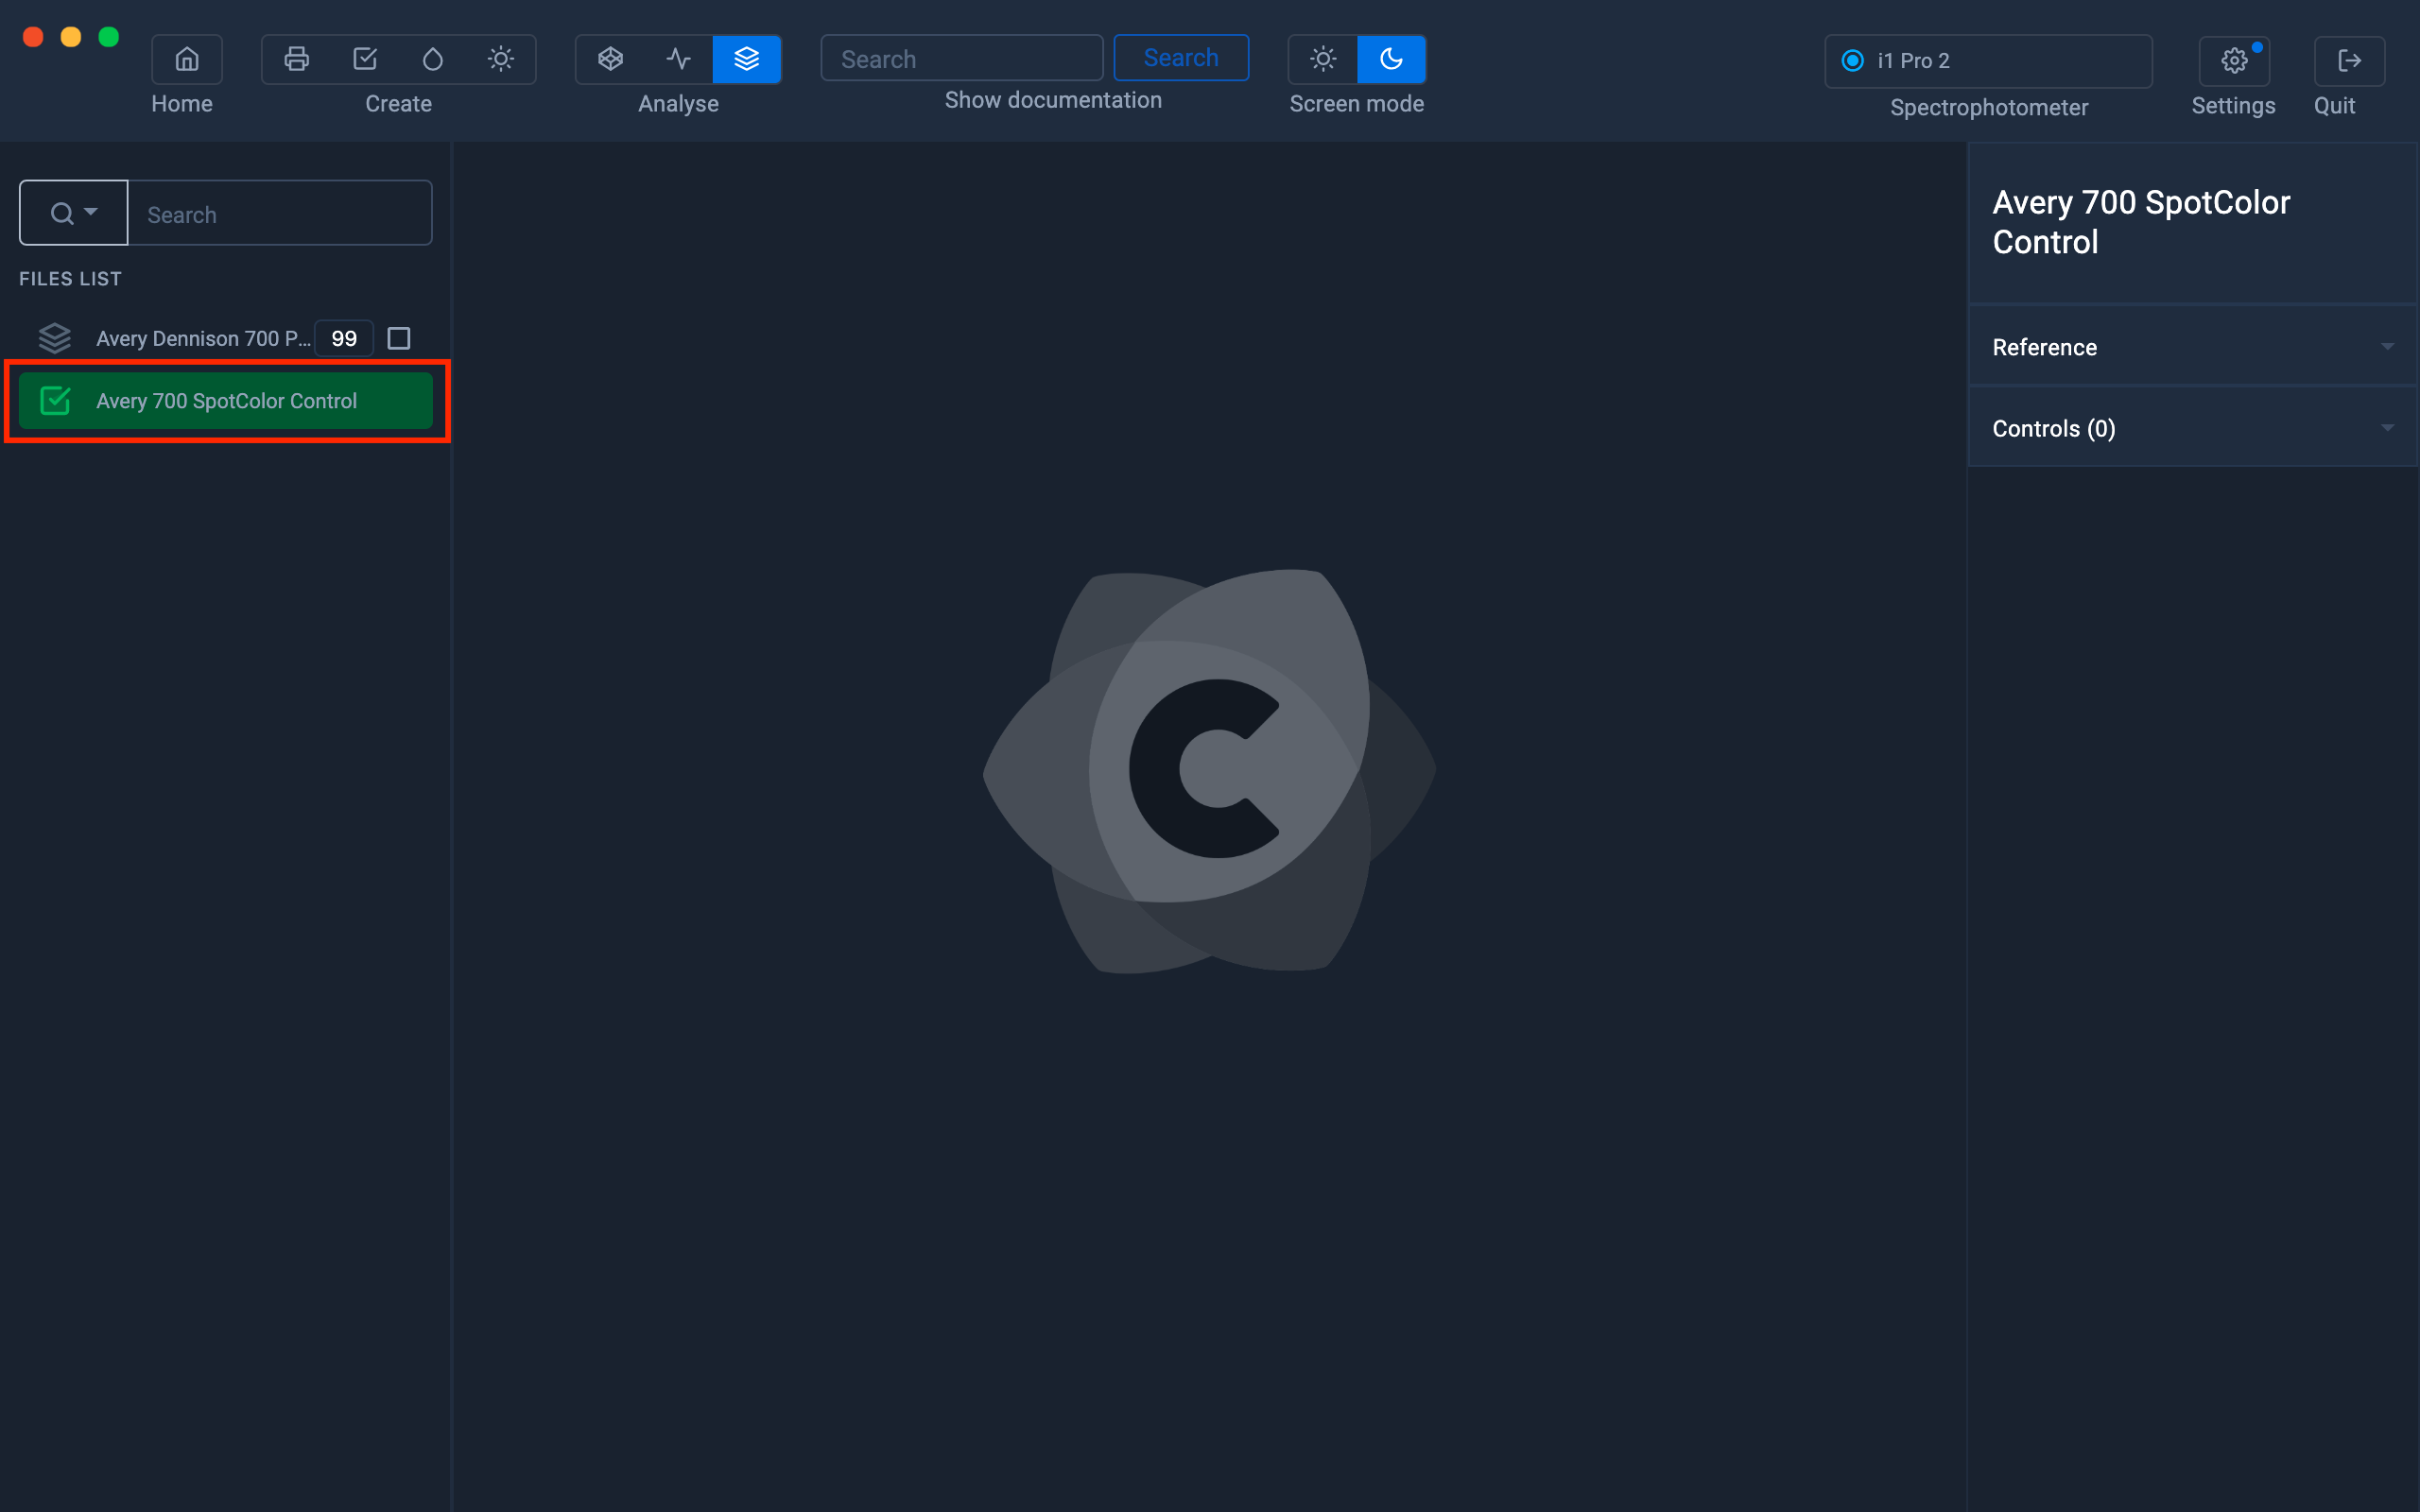
The Print Control file appears in the left column.
Reading the test pattern
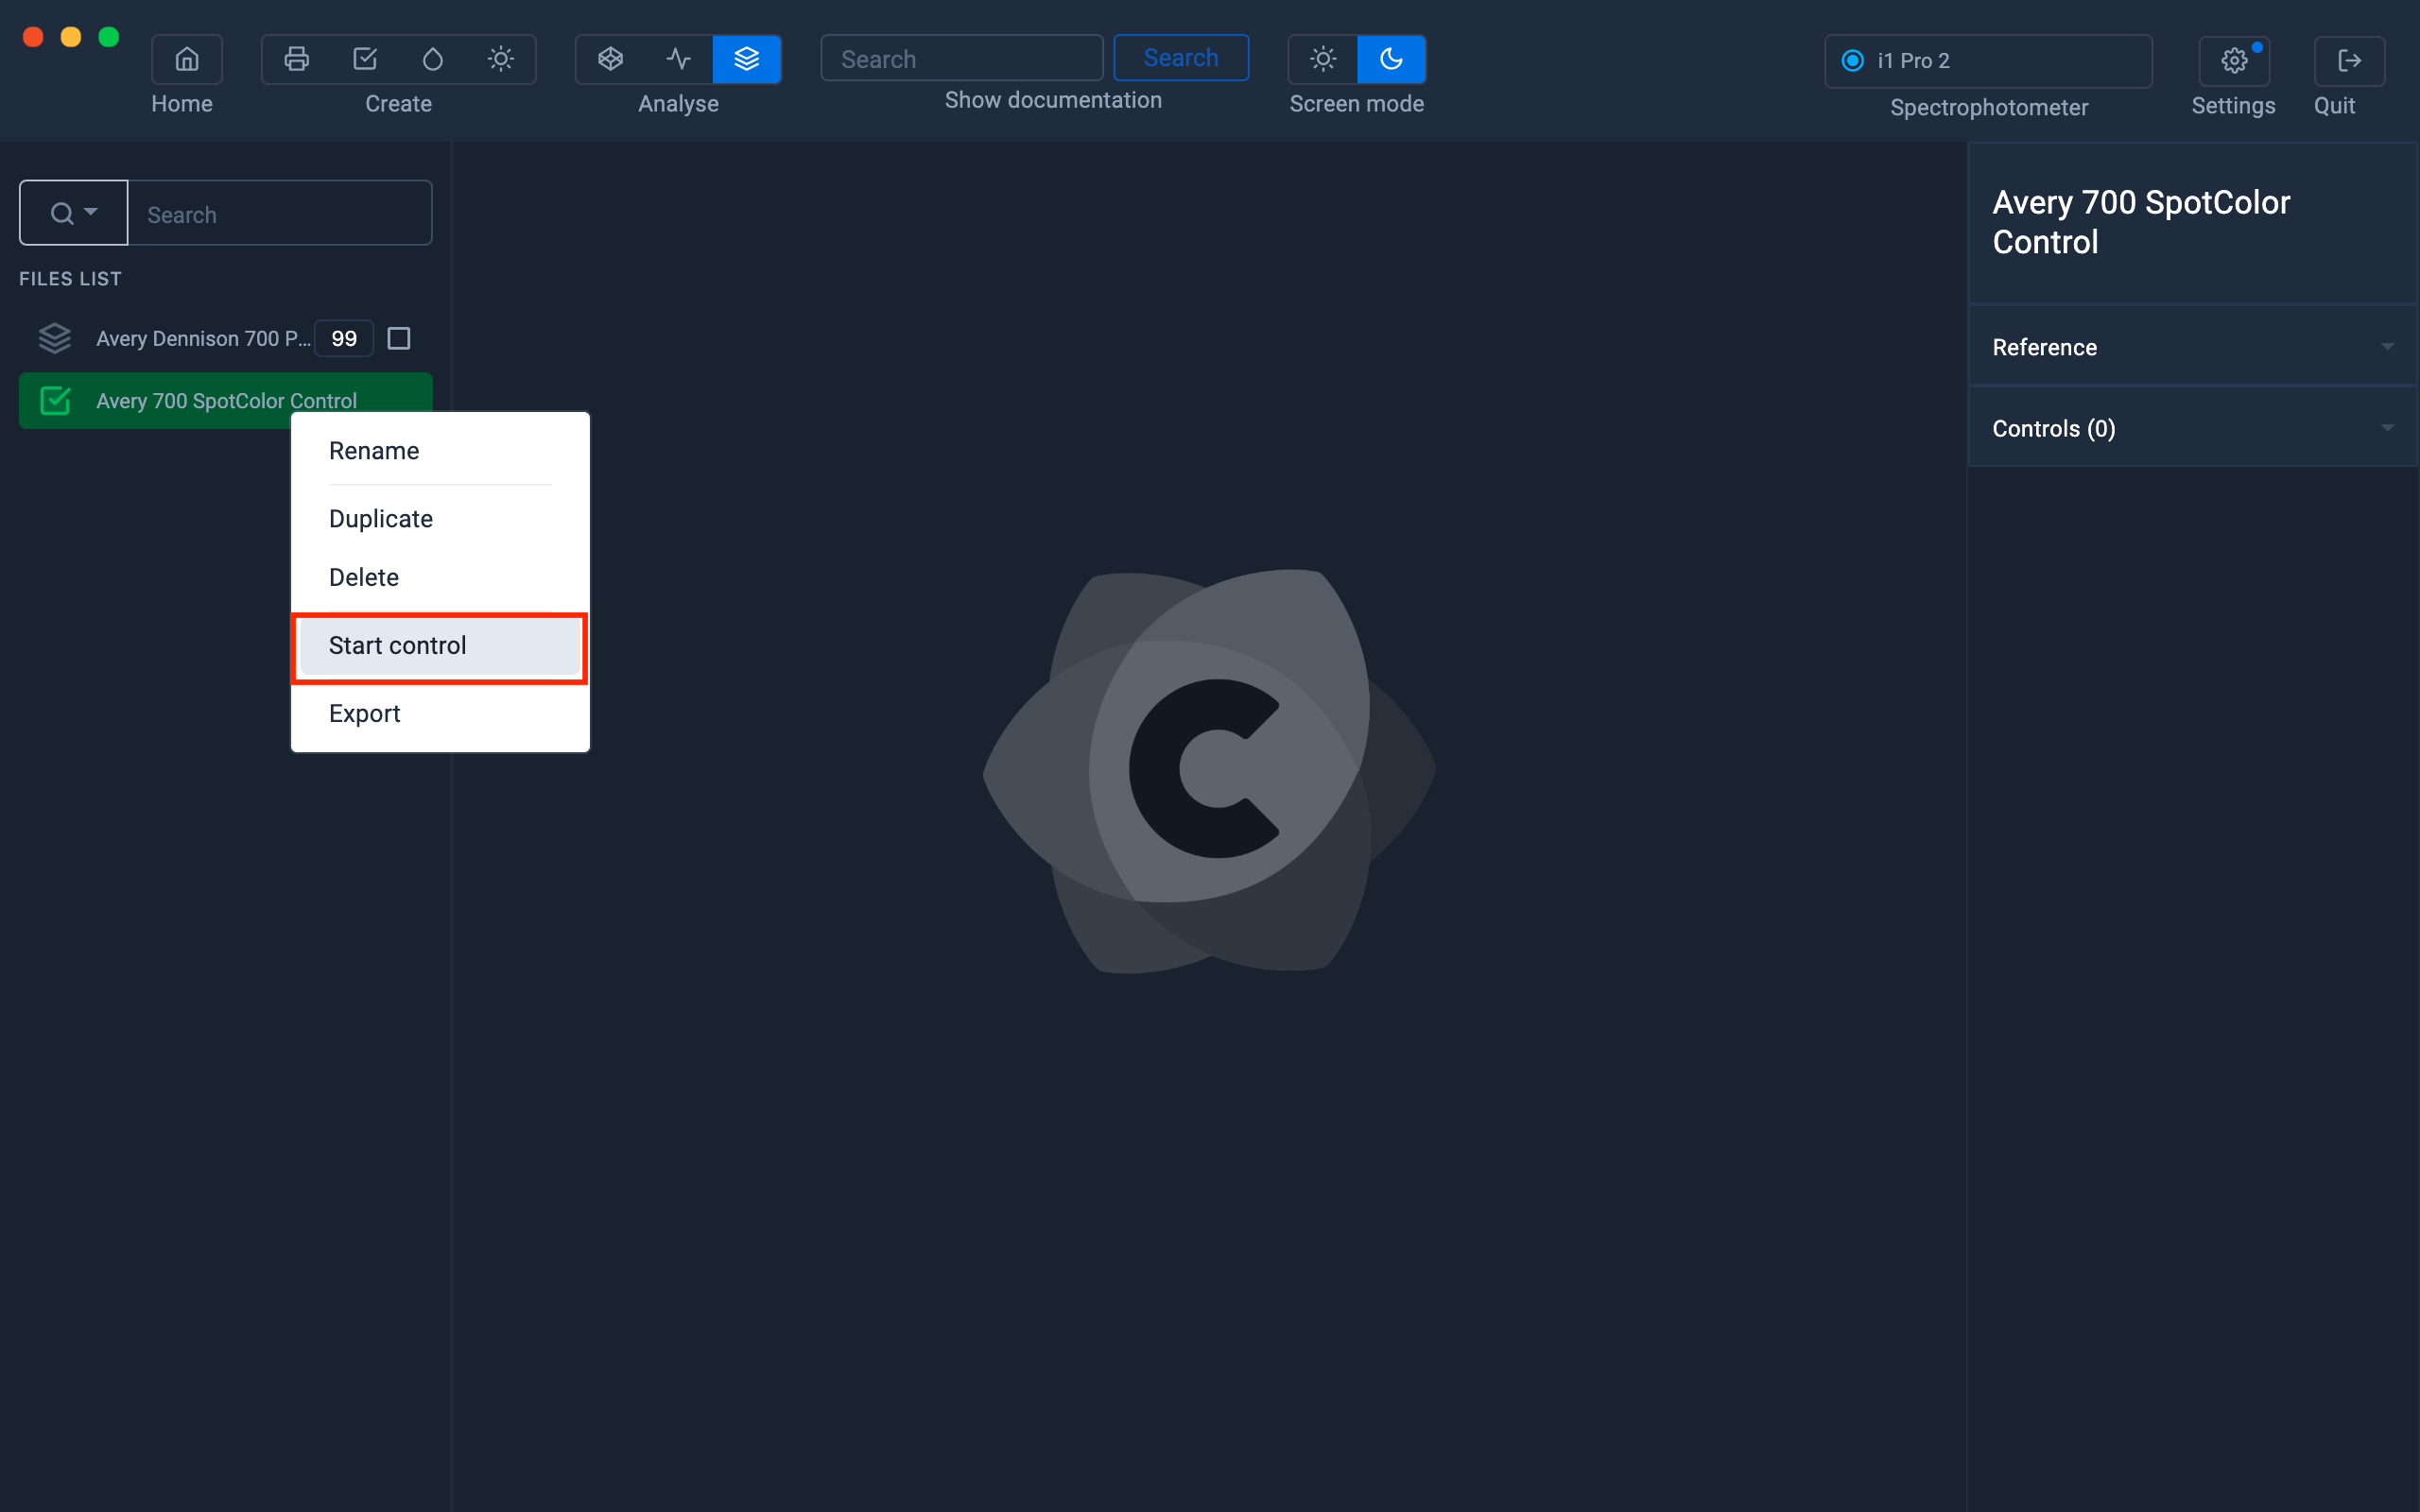
Once the test chart has been printed, start the reading by right-clicking on the Print Control file then " Start the control ".
The control of a spot color gamut is very similar to that of a CMYK RGB Mediawedge.
To find out more, see the chapter: Checking a range