Shade reproduction
Today, the colors displayed on your I-Mac and the colors printed on your textiles or other media do not really match.
And of course, your customers ask you to make color corrections based on your screen... uncalibrated and very flattering.
They come with a sample that you are supposed to reproduce and it takes time because you have to multiply the tests... but are you really sure that this color is reproducible on your printer?
The solution that we propose consists in printing a test chart containing 3000 colors of which we know the RGB values for each of the colors composing it.
We will print this target using your usual flow and we will measure it with a spectrophotometer suitable for the material you are printing on.
Match color
The principle
The goal is to create a color table corresponding to the material on which the chart was printed.
Then when your client asks you to reproduce the color of his sample, all you have to do is measure it with the spectrophotometer and carry out a color search in Coraye to find the closest color from the color chart (Mire of 3000 patches), and deduce the RGB values from it in order to faithfully reproduce the desired color.
All you have to do is use these values in your Photoshop or Illustrator software.
In this tutorial we offer two methods for applying colors in Photoshop or Illustrator:
- The first is to retrieve the RGB values directly in Coraye and then manually transfer these values to Photoshop or Illustrator
- The second is to create a color chart generated from the measured color table that you will use as a PANTONE color chart.
Regarding the simulation of the colors displayed on your screen, we have a solution: The Proofing software
A solution widely used in the fields of Graphic Arts.
And finally, a screen cannot replace the rendering of the material, Coraye also allows you to create a printable color chart
Of course, you will be able to share the simulation profile, the digital color chart and the printed color chart with the designers so that they can create patterns corresponding to their expectations.
- Creation of the reference color table
- Hue search and application in Illustrator or Photoshop
- Create a swatch to use colors directly in Illustrator & Photoshop
- On-screen color simulation (Soft Proofing)
- Create a printable swatch book
This procedure works just as well
in RGB than in CMYK
Creation of the reference table
In this tutorial, we will take the example of a textile printer who uses Epson SC-F10000 printers, an Epson Edge Print RIP and calenders to sublimate on polyester fabrics.
This method obviously applies to other technologies as well.
This first step aims to create a reference color table to match the RGB values with the Lab values actually obtained during the final printing on your materials.
Once this pattern has been measured, it will be used for:
- Perform color research
- Create a color chart for Photoshop and/or Illustrator
- Create an icc profile to simulate colors printed on screen.
- Create a spot color swatch to install in your RIP
If you print on different media, the color rendering may also be different depending on the material.
It will therefore be necessary to create as many color tables as you have materials.
Necessary Coraye modules:
-RGB Profiler
- Color Table
1) Creation of an RGB pattern of 3000 patches
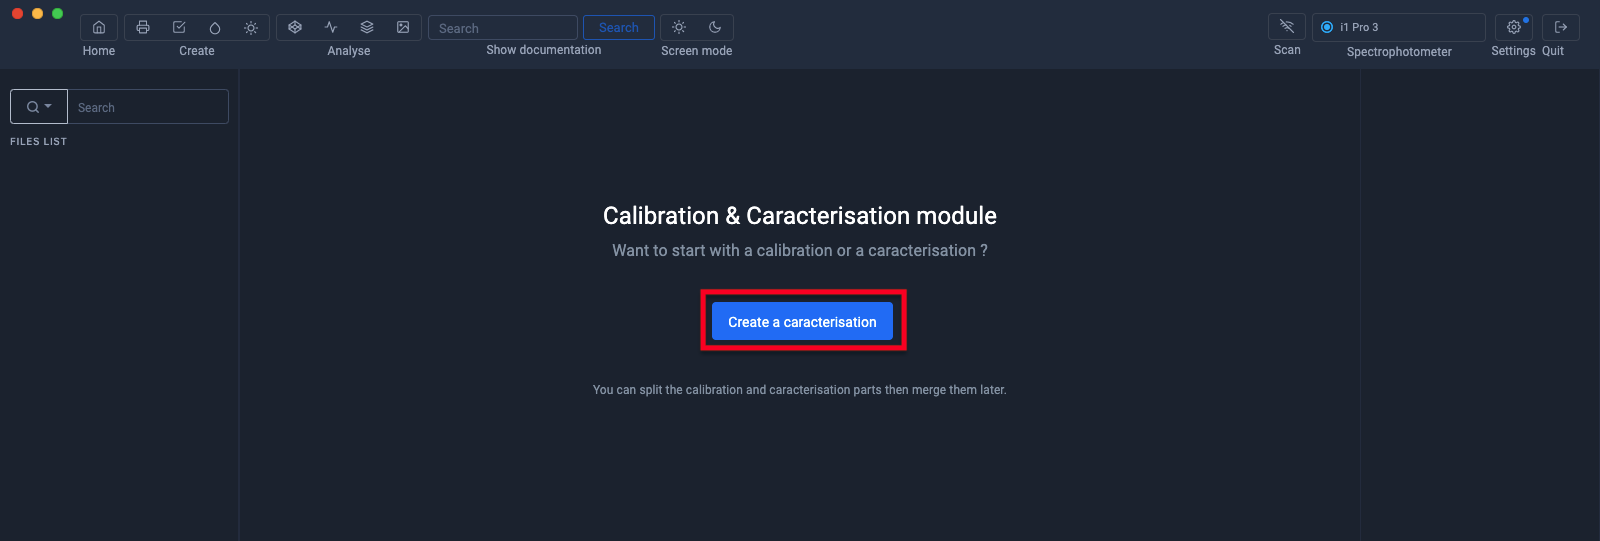
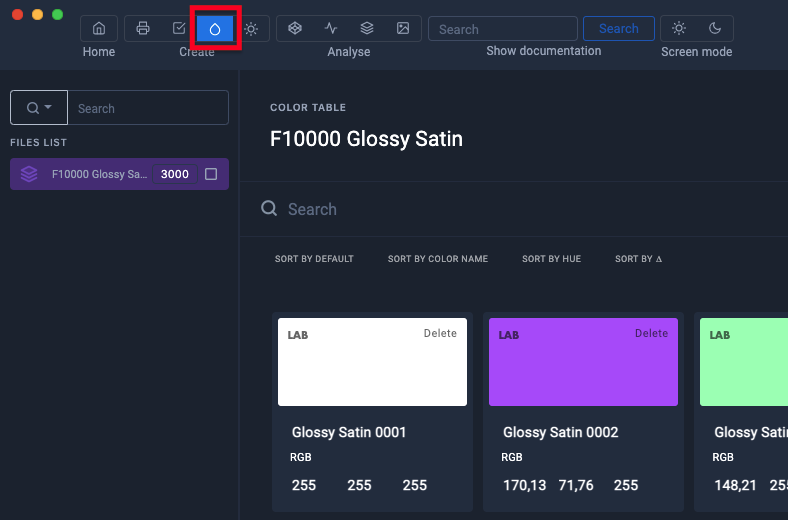
In the Coraye software, we will use the RGB Profiler module symbolized by a printer.

Click on the "Create a characterization" button
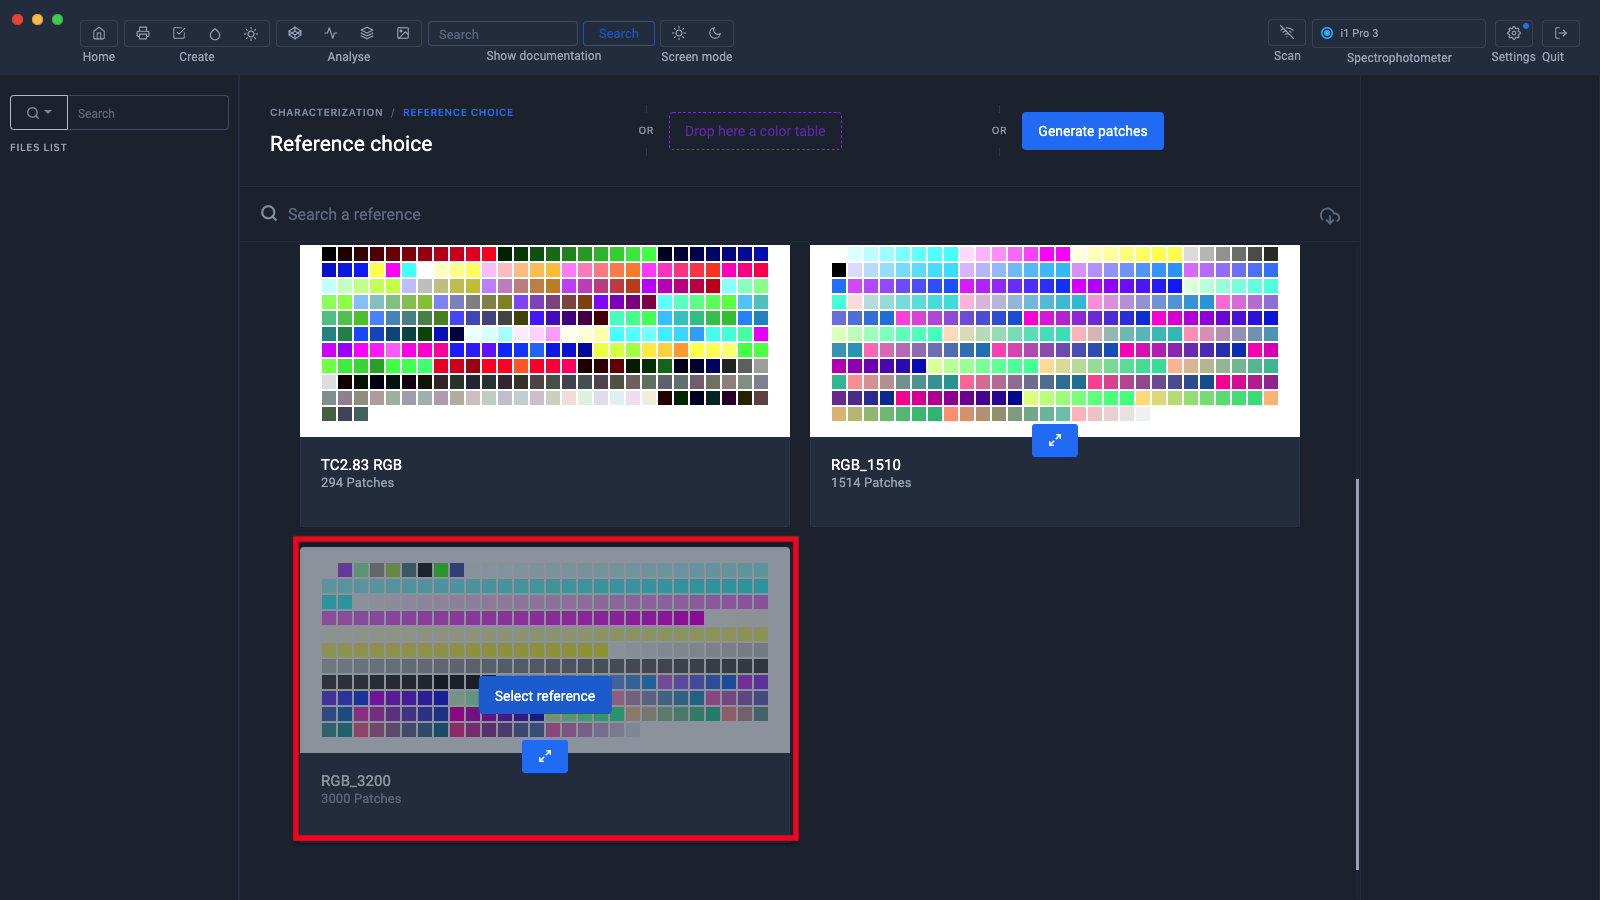
The patterns rendered in Photoshop are in RGB, so we'll create an RGB/Lab table.

Select the pattern of 3000 patches.
Note that the more the test chart contains a large number of colors, the more the colors will be precise.
It is possible to customize patches by clicking on the "Generate patches" button
To measure colors on fabric, we will use an XRite I1 Pro 3 PLUS spectrophotometer with a large aperture of 8mm and the possibility of using a polarizing filter (M3).
The patches being very large, I recommend that you use the following parameters:
- Format 520 x 1350 mm
- 150 dpi resolution to limit file size
- Patch size 18 x 18
- White space between the letter and the first patch (Landing) 30 mm
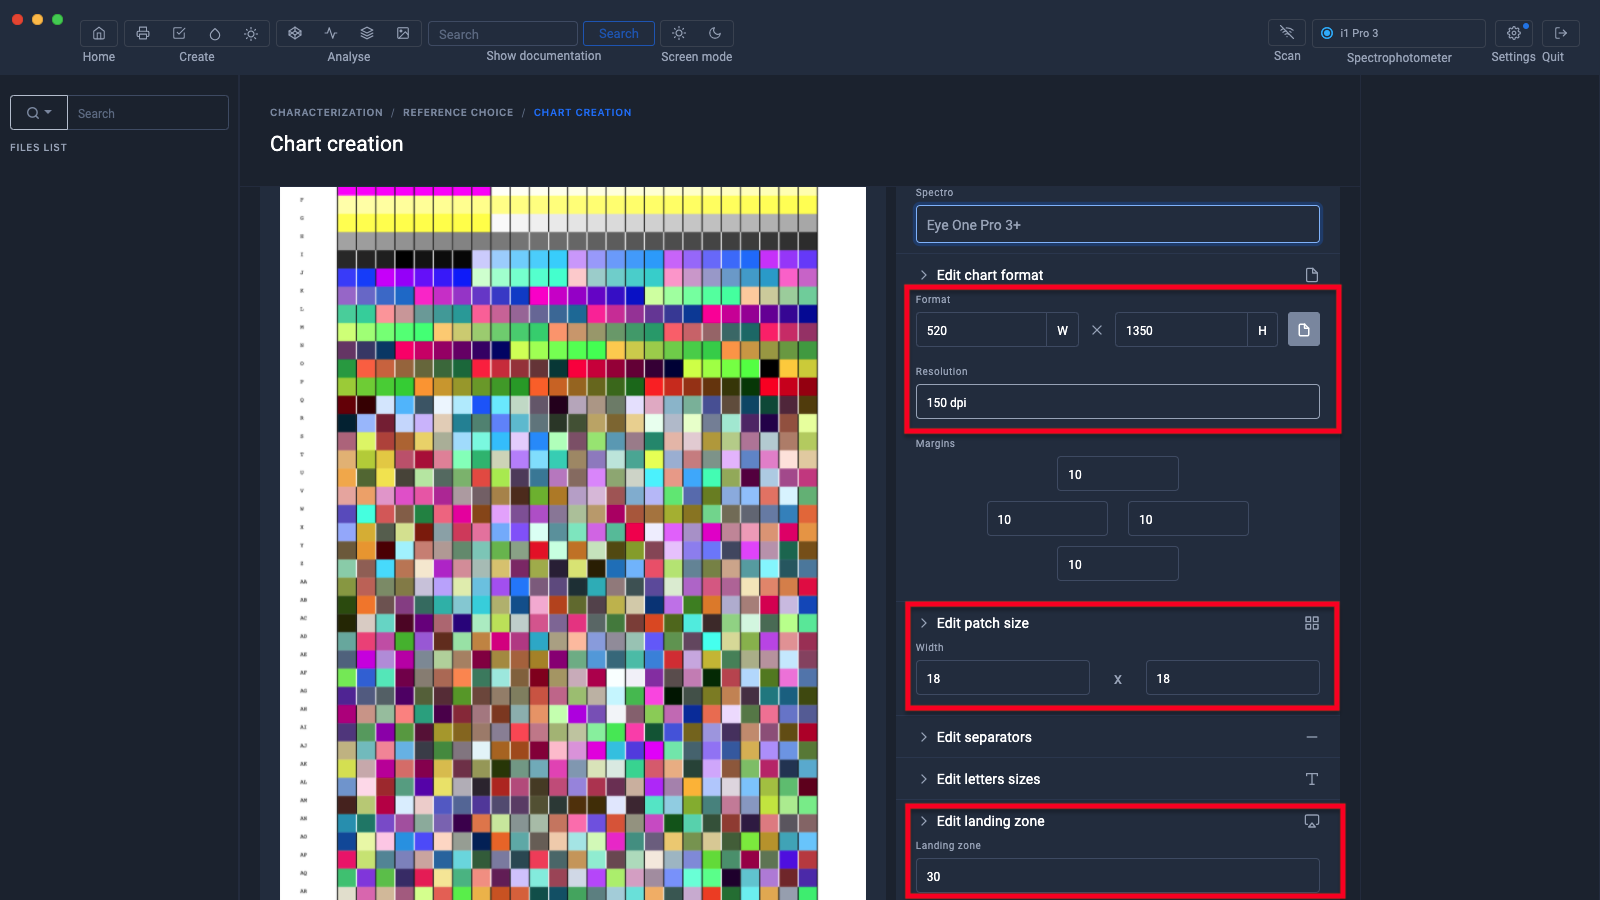
When the chart format is defined, I advise you to save the settings.
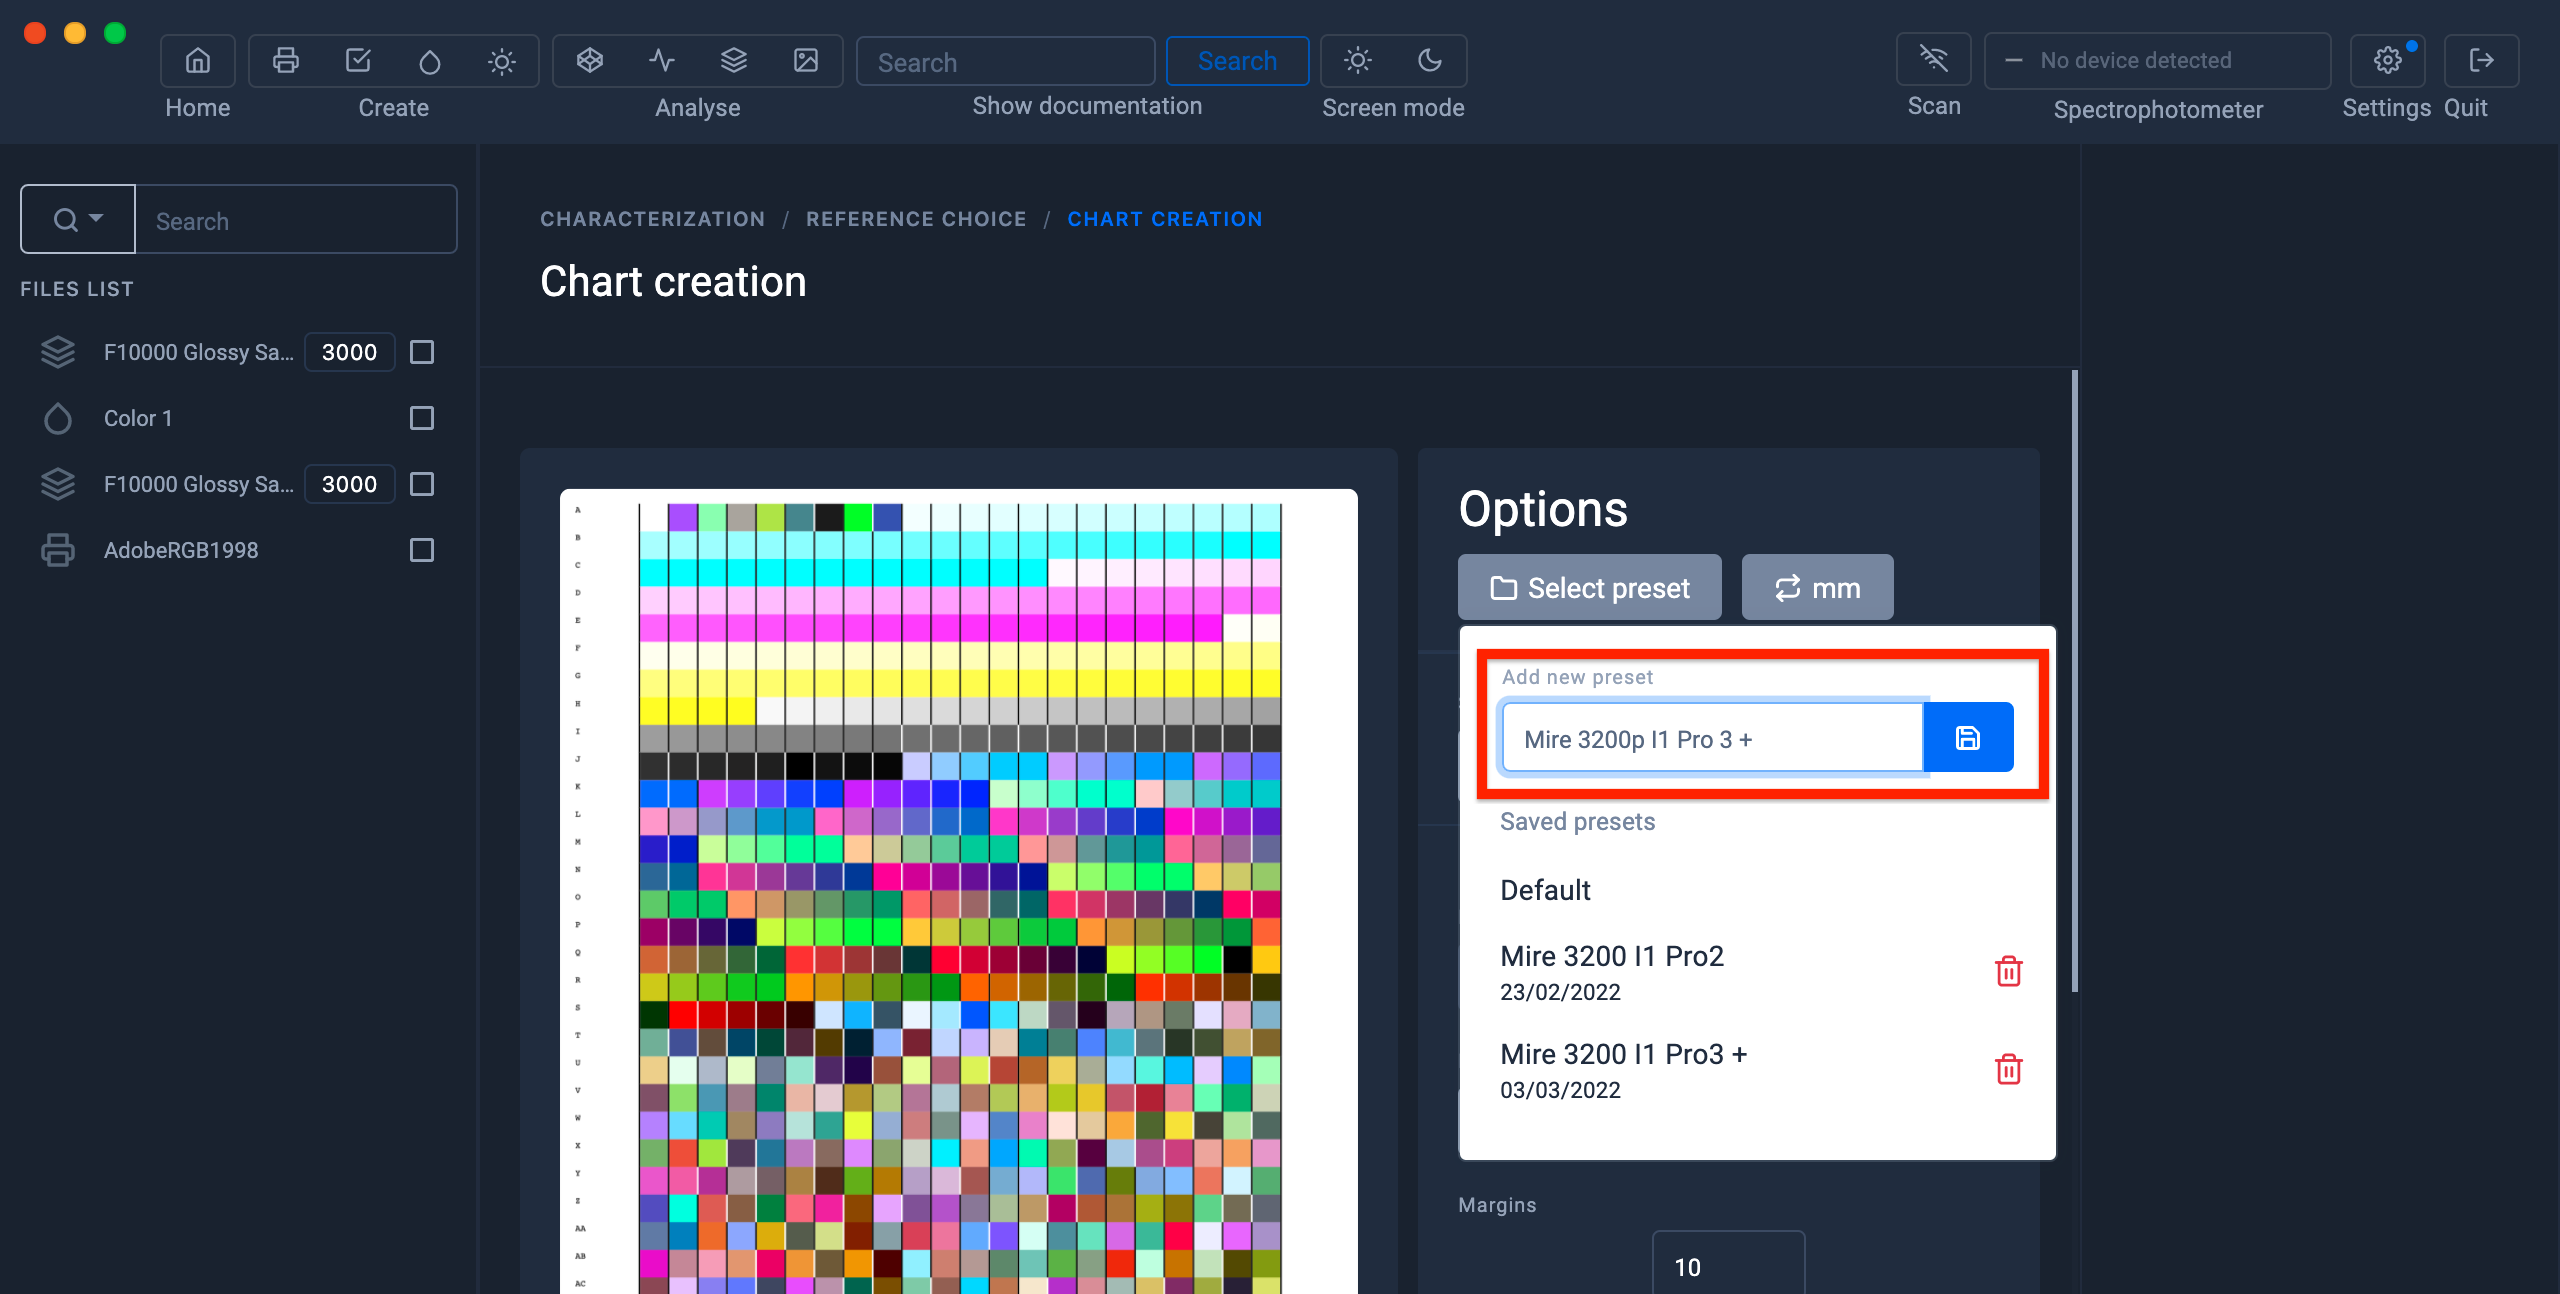
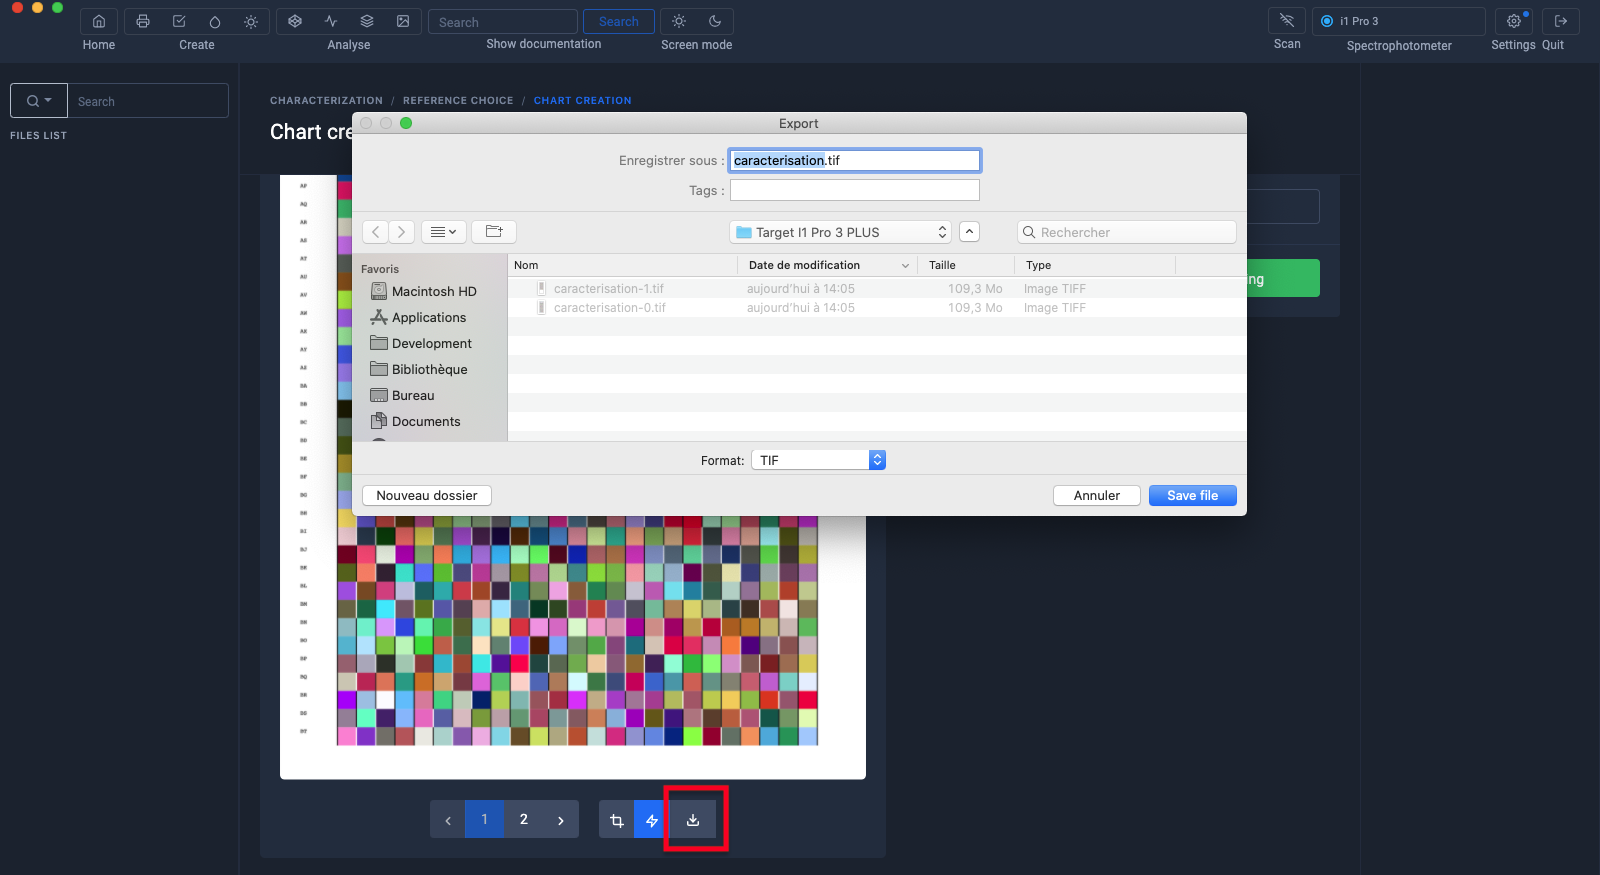
Save the pattern in Tiff format
In our example you will generate two Tiff files of 520 x1350 mm
2) Pattern printing
It is important to be extremely rigorous concerning the settings of the icc profiles of references
The 3000 patch chart must be printed with the same reference space as that used in your Photoshop or Illustrator software.
Choosing the reference space helps to optimize color reproduction on your printing system.
For example, if I overlay the sRGB.icc color space with the media profile of the satin polyester fabric, we can see that the printer is able to reproduce colors in "dark blue-green" which does not exist in the sRGB.icc space...
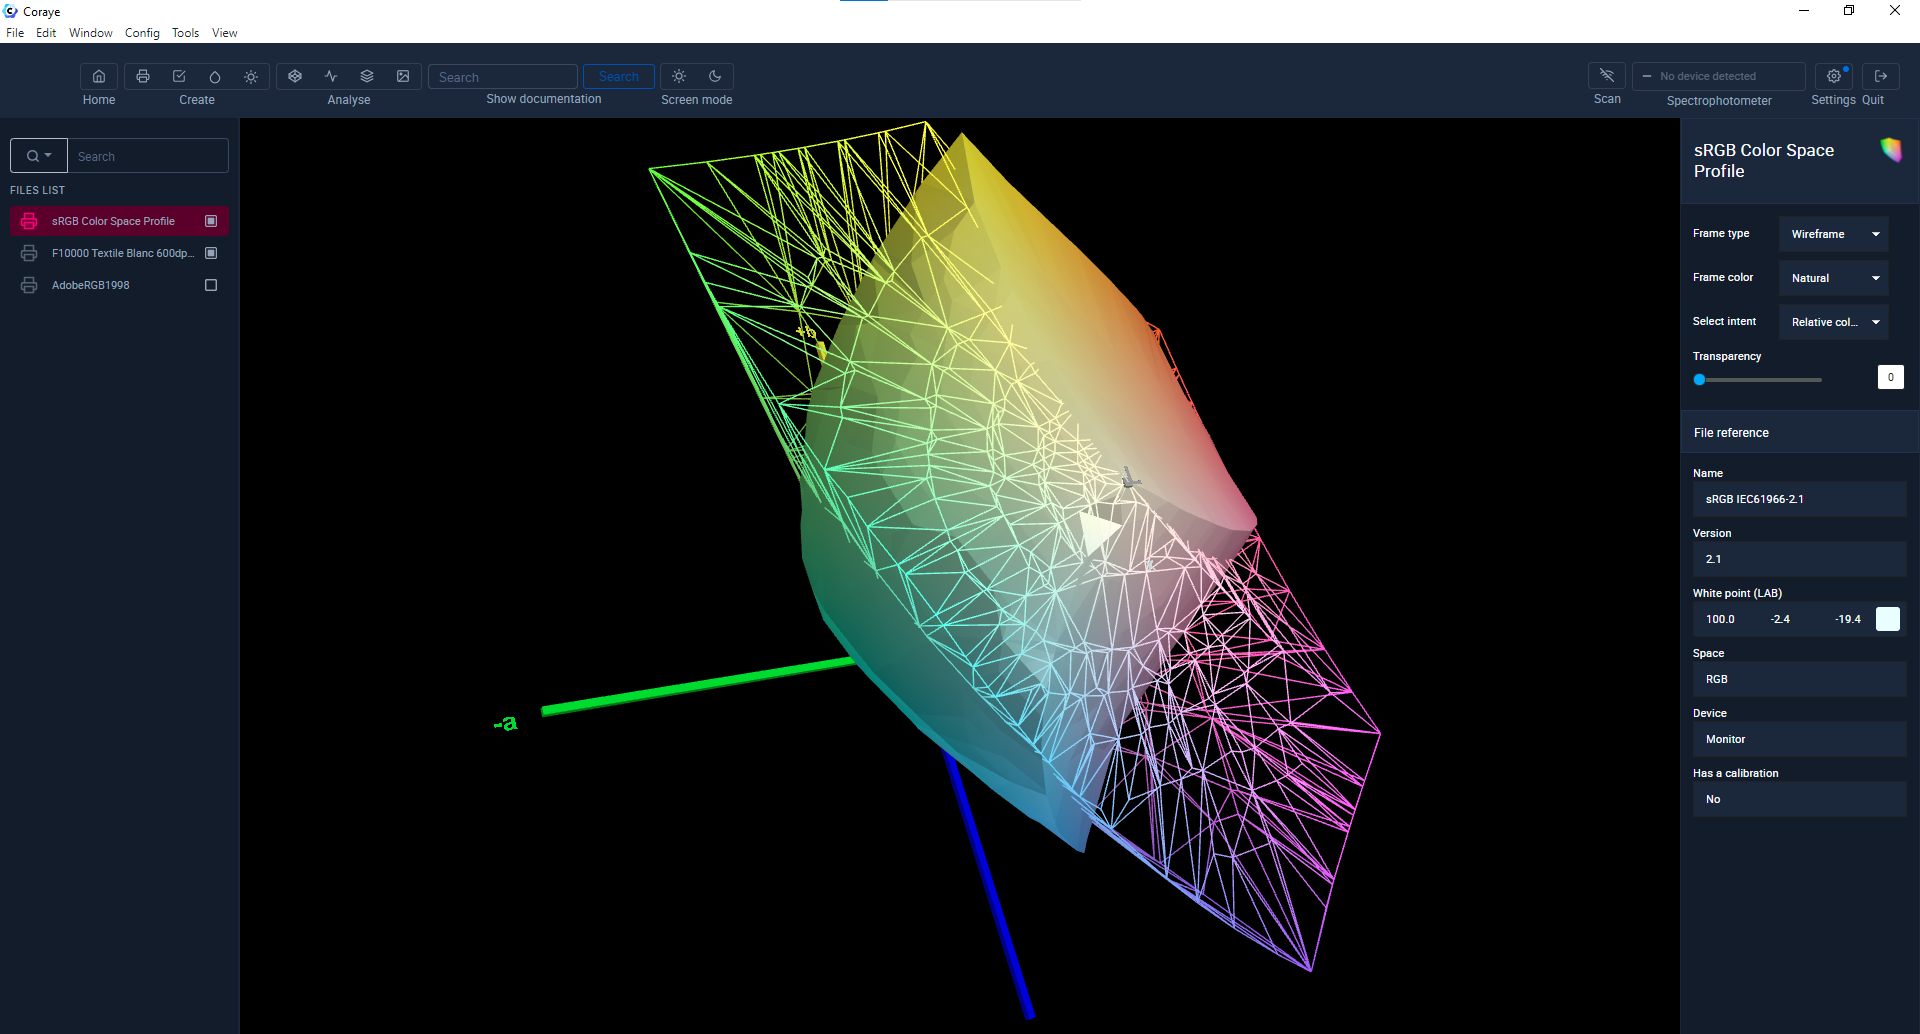 Gamut Viewer : Profil Media Satin vs sRGB
... but which exists in the AdobeRGB1998.icc space.
So it makes more sense to use the AdobeRGB1998 space as the reference color space.
 Gamut Viewer : Profil Media Satin vs AdobeRGB1998
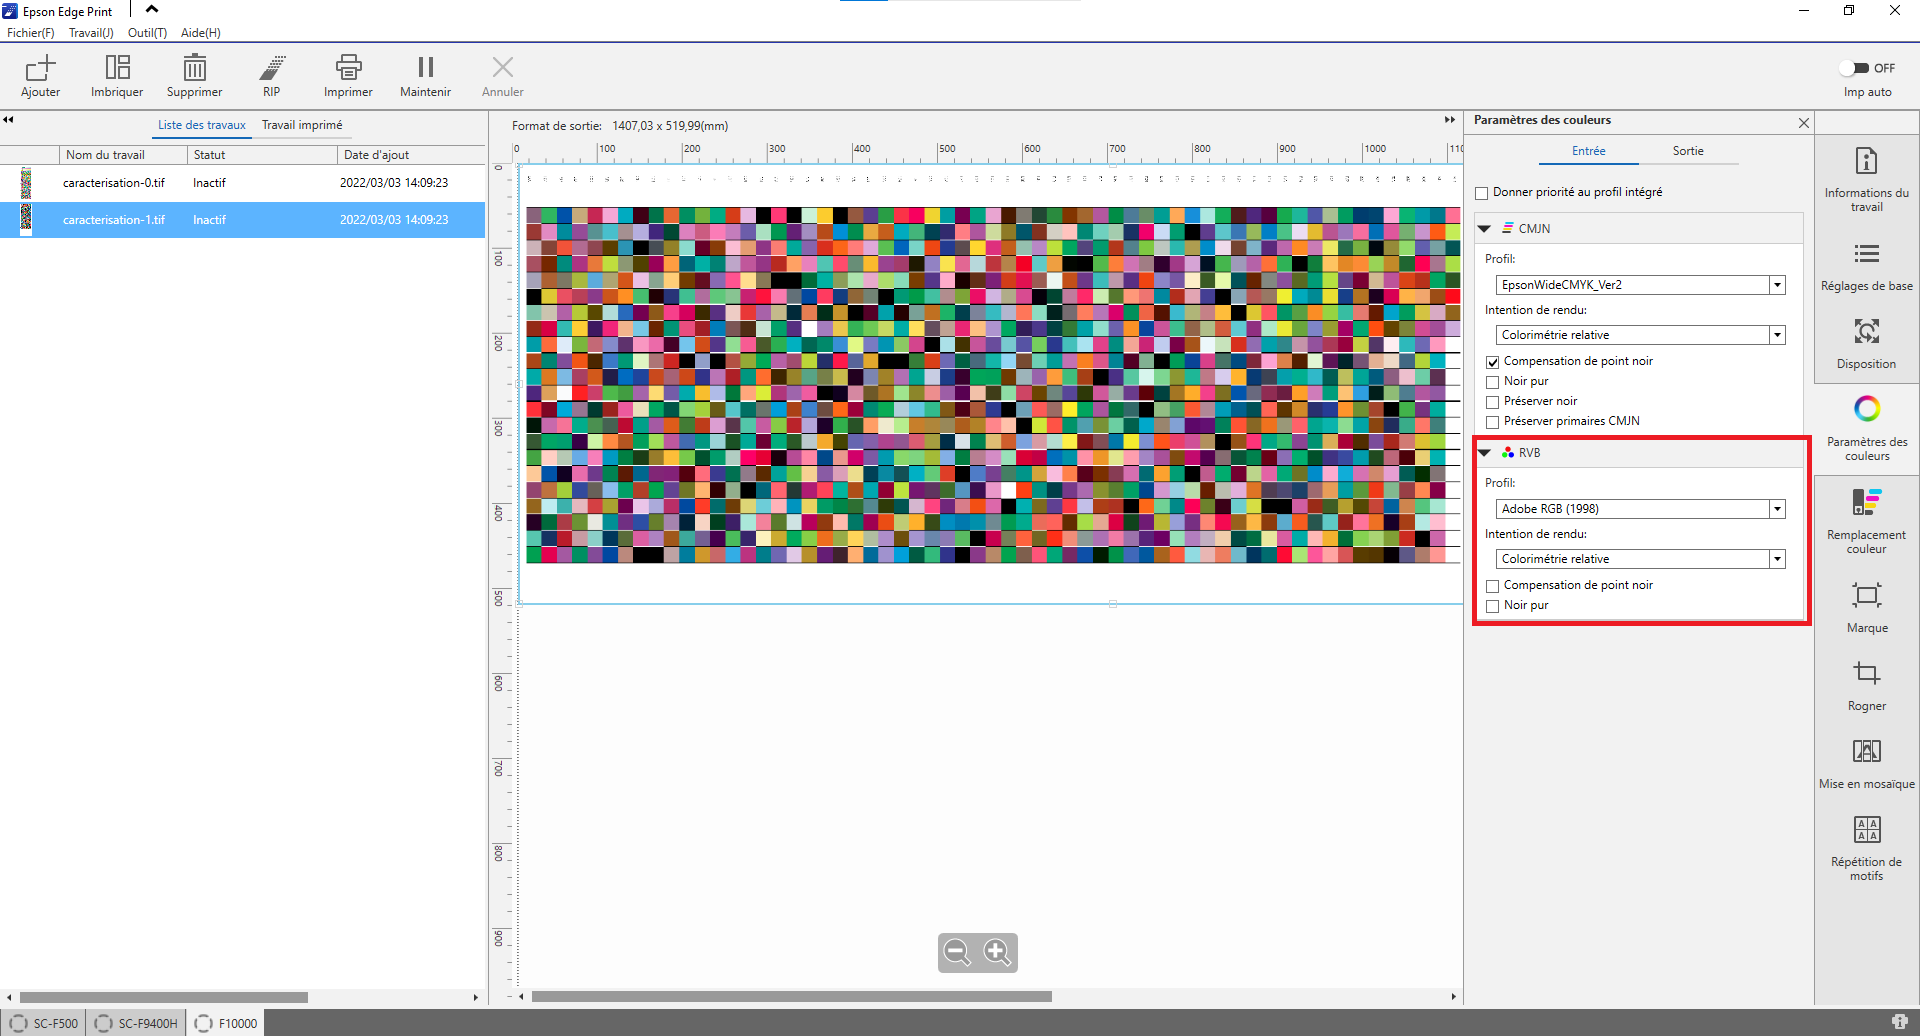
Using the Epson Edge Print RIP
When you are going to print the target (composed of two Tiff files in our example), it is important that the two images are printed with the same settings, using the AdobeRGB1998 space as a reference.
For pattern printing, I also advise you to use the relative mode.
 RIP Epson Edge Print
In our example we are printing on an Epson SC-F10000 printer on a transfer paper which will then be used to allow the hot transfer of the printed paper on the polyester fabric using a calender.
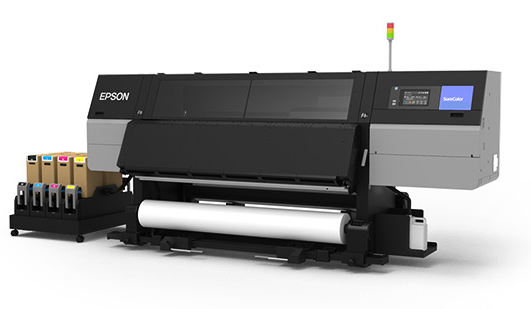 Impression Sublimation Epson SC-F10000
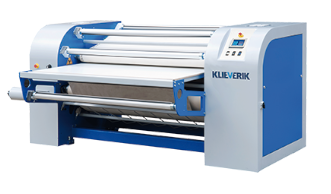 Transfert sublimation Calandre Klieverik
3) Pattern measurement
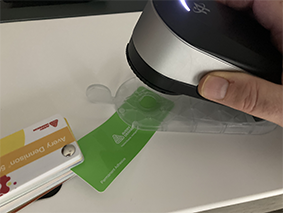
Once the pattern is printed and then sublimated on the polyester textile, you must measure it with the spectrophotometer and the Coraye software.
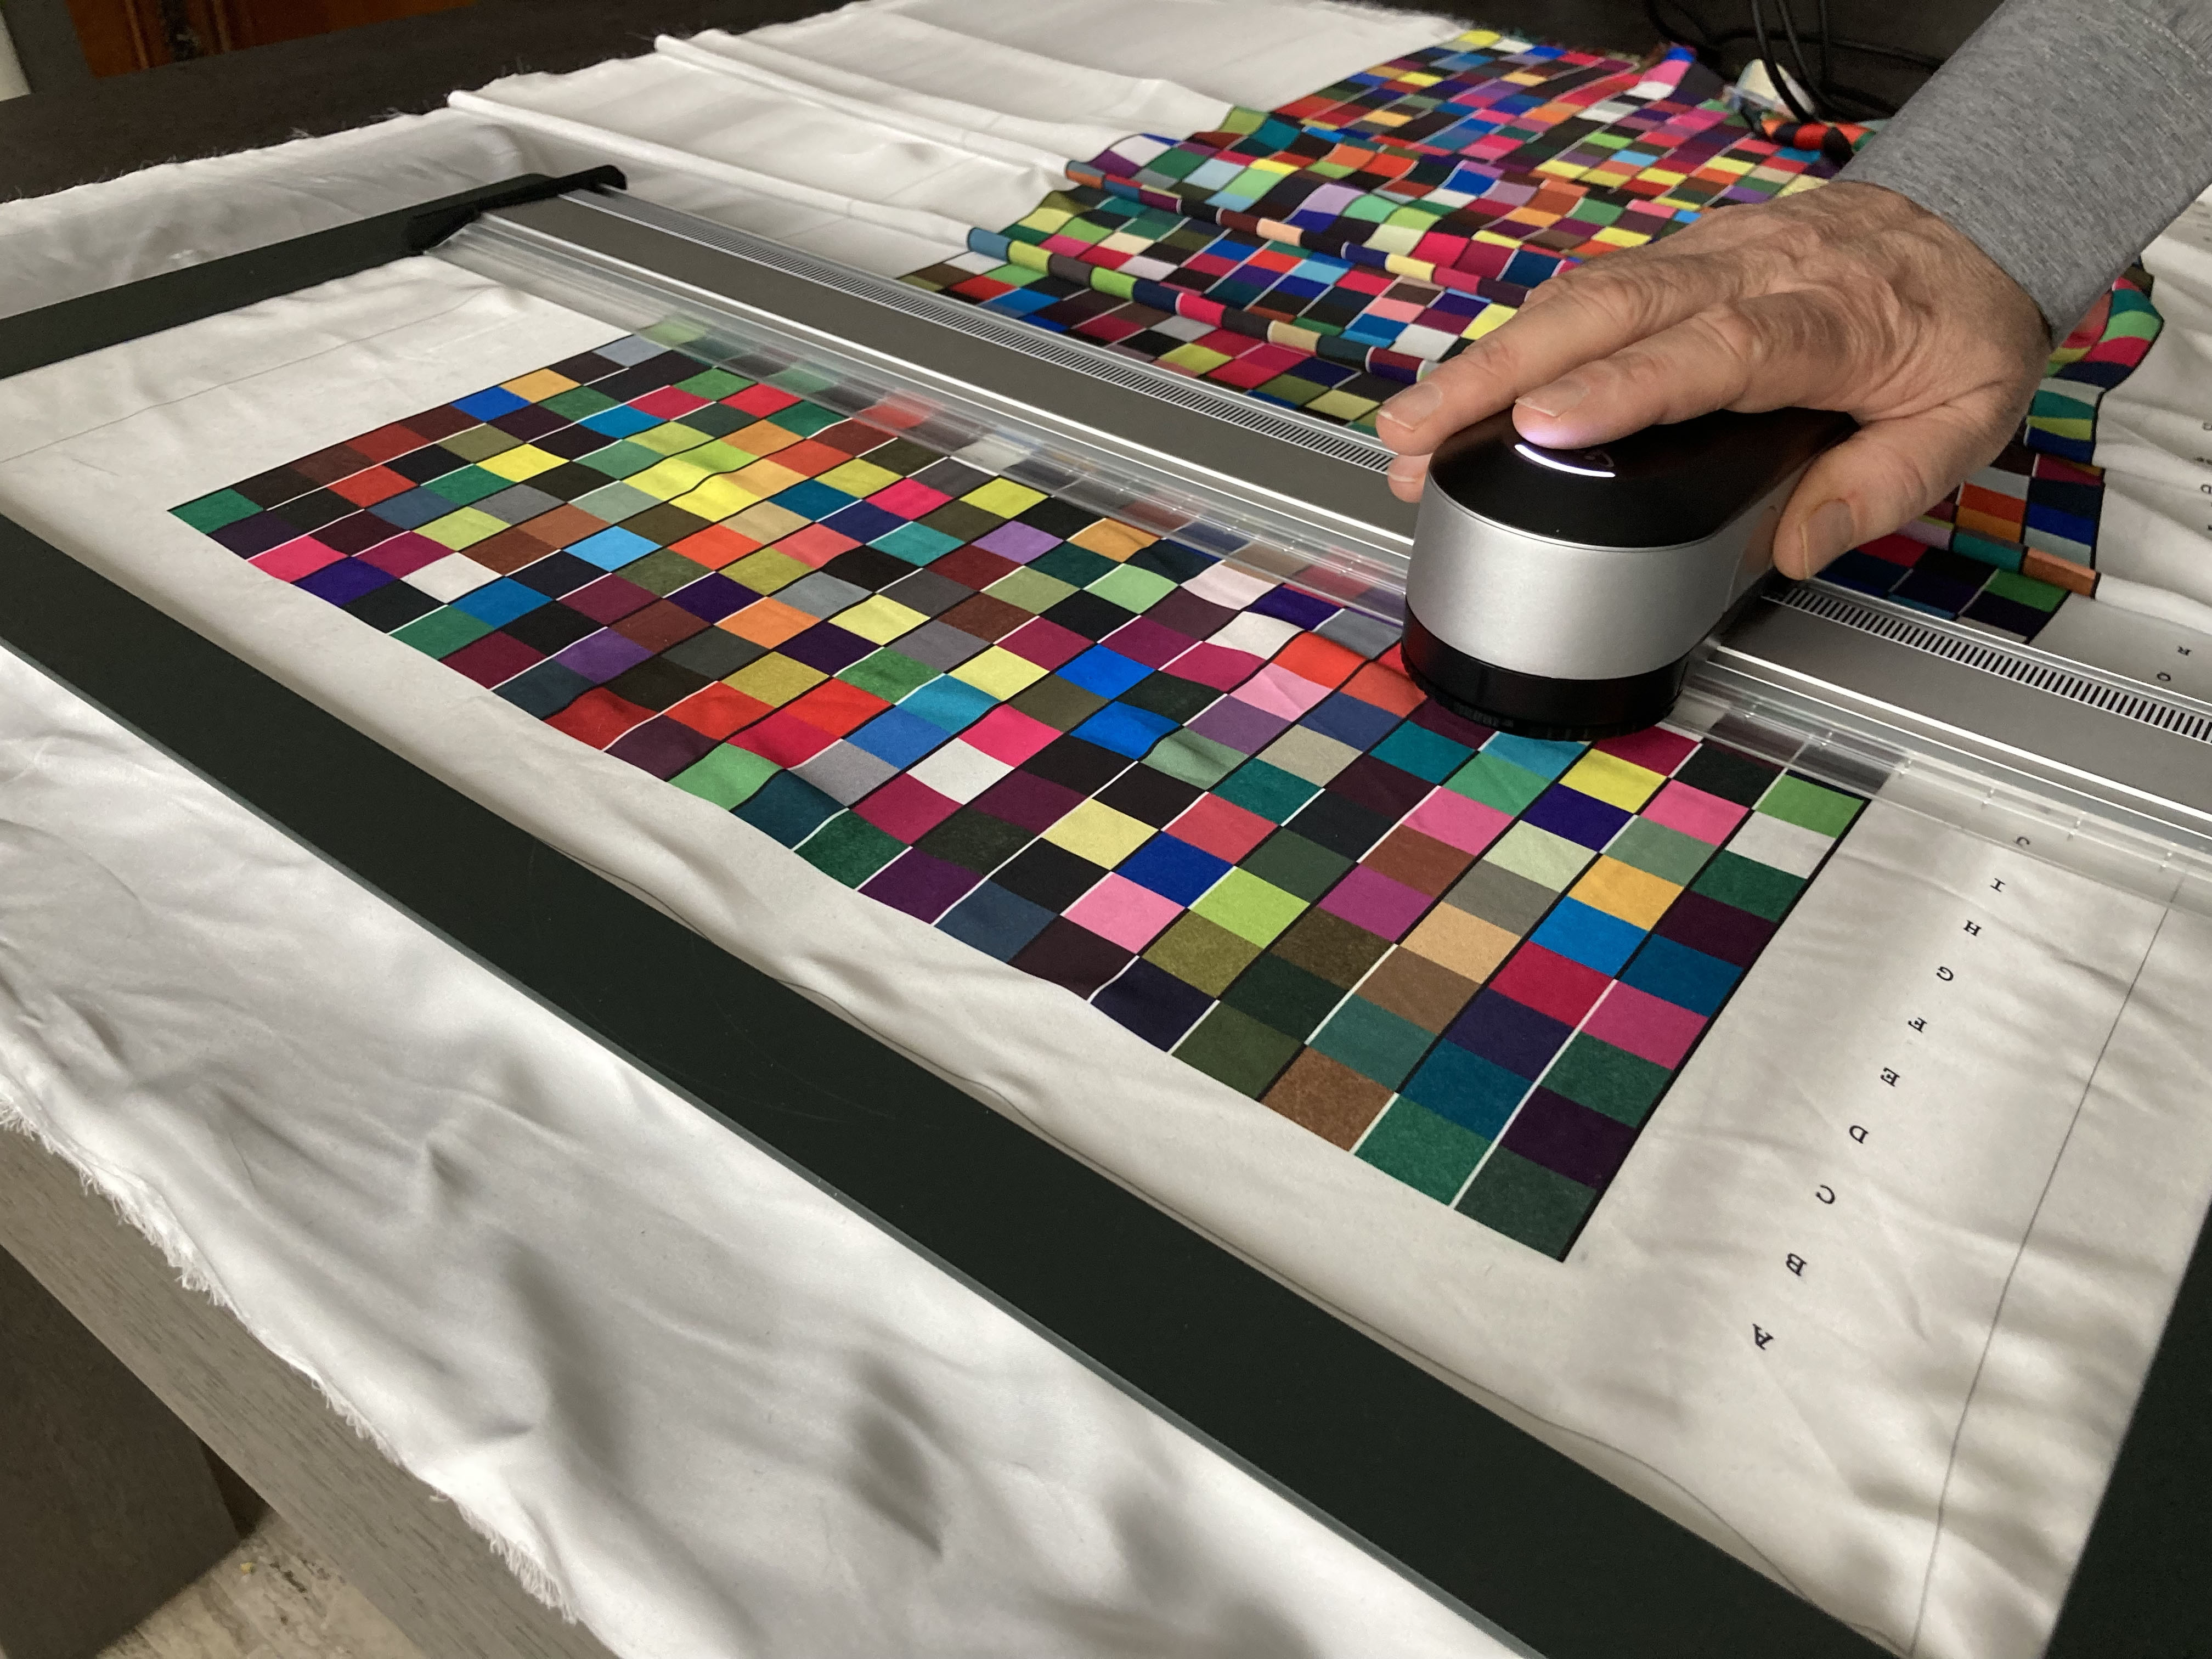
XRite I1 Pro 3 PLUS Textile Measurement
Once the measurement is finished, export the measurement table by clicking on the "Export reading" button.
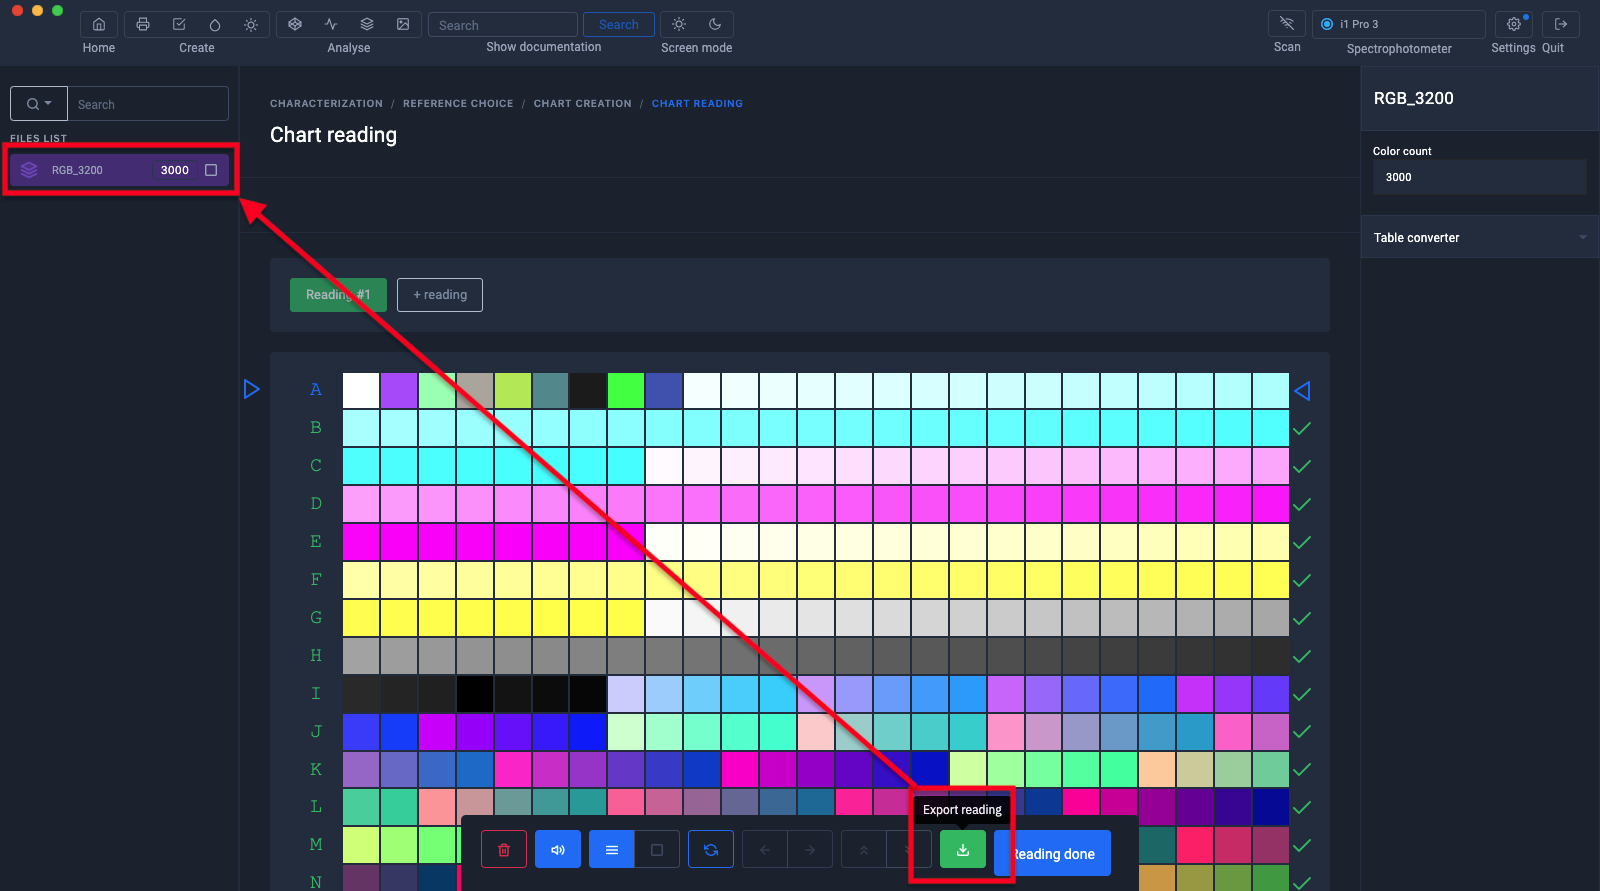
If you want to create a simulation profile, click on the "Reading done" button then go to the chapter "Simulating colors on screen"
4) Rename the target and the measured samples
To rename the pattern, right click then select "Rename"
To rename table colors, click the pen icon.
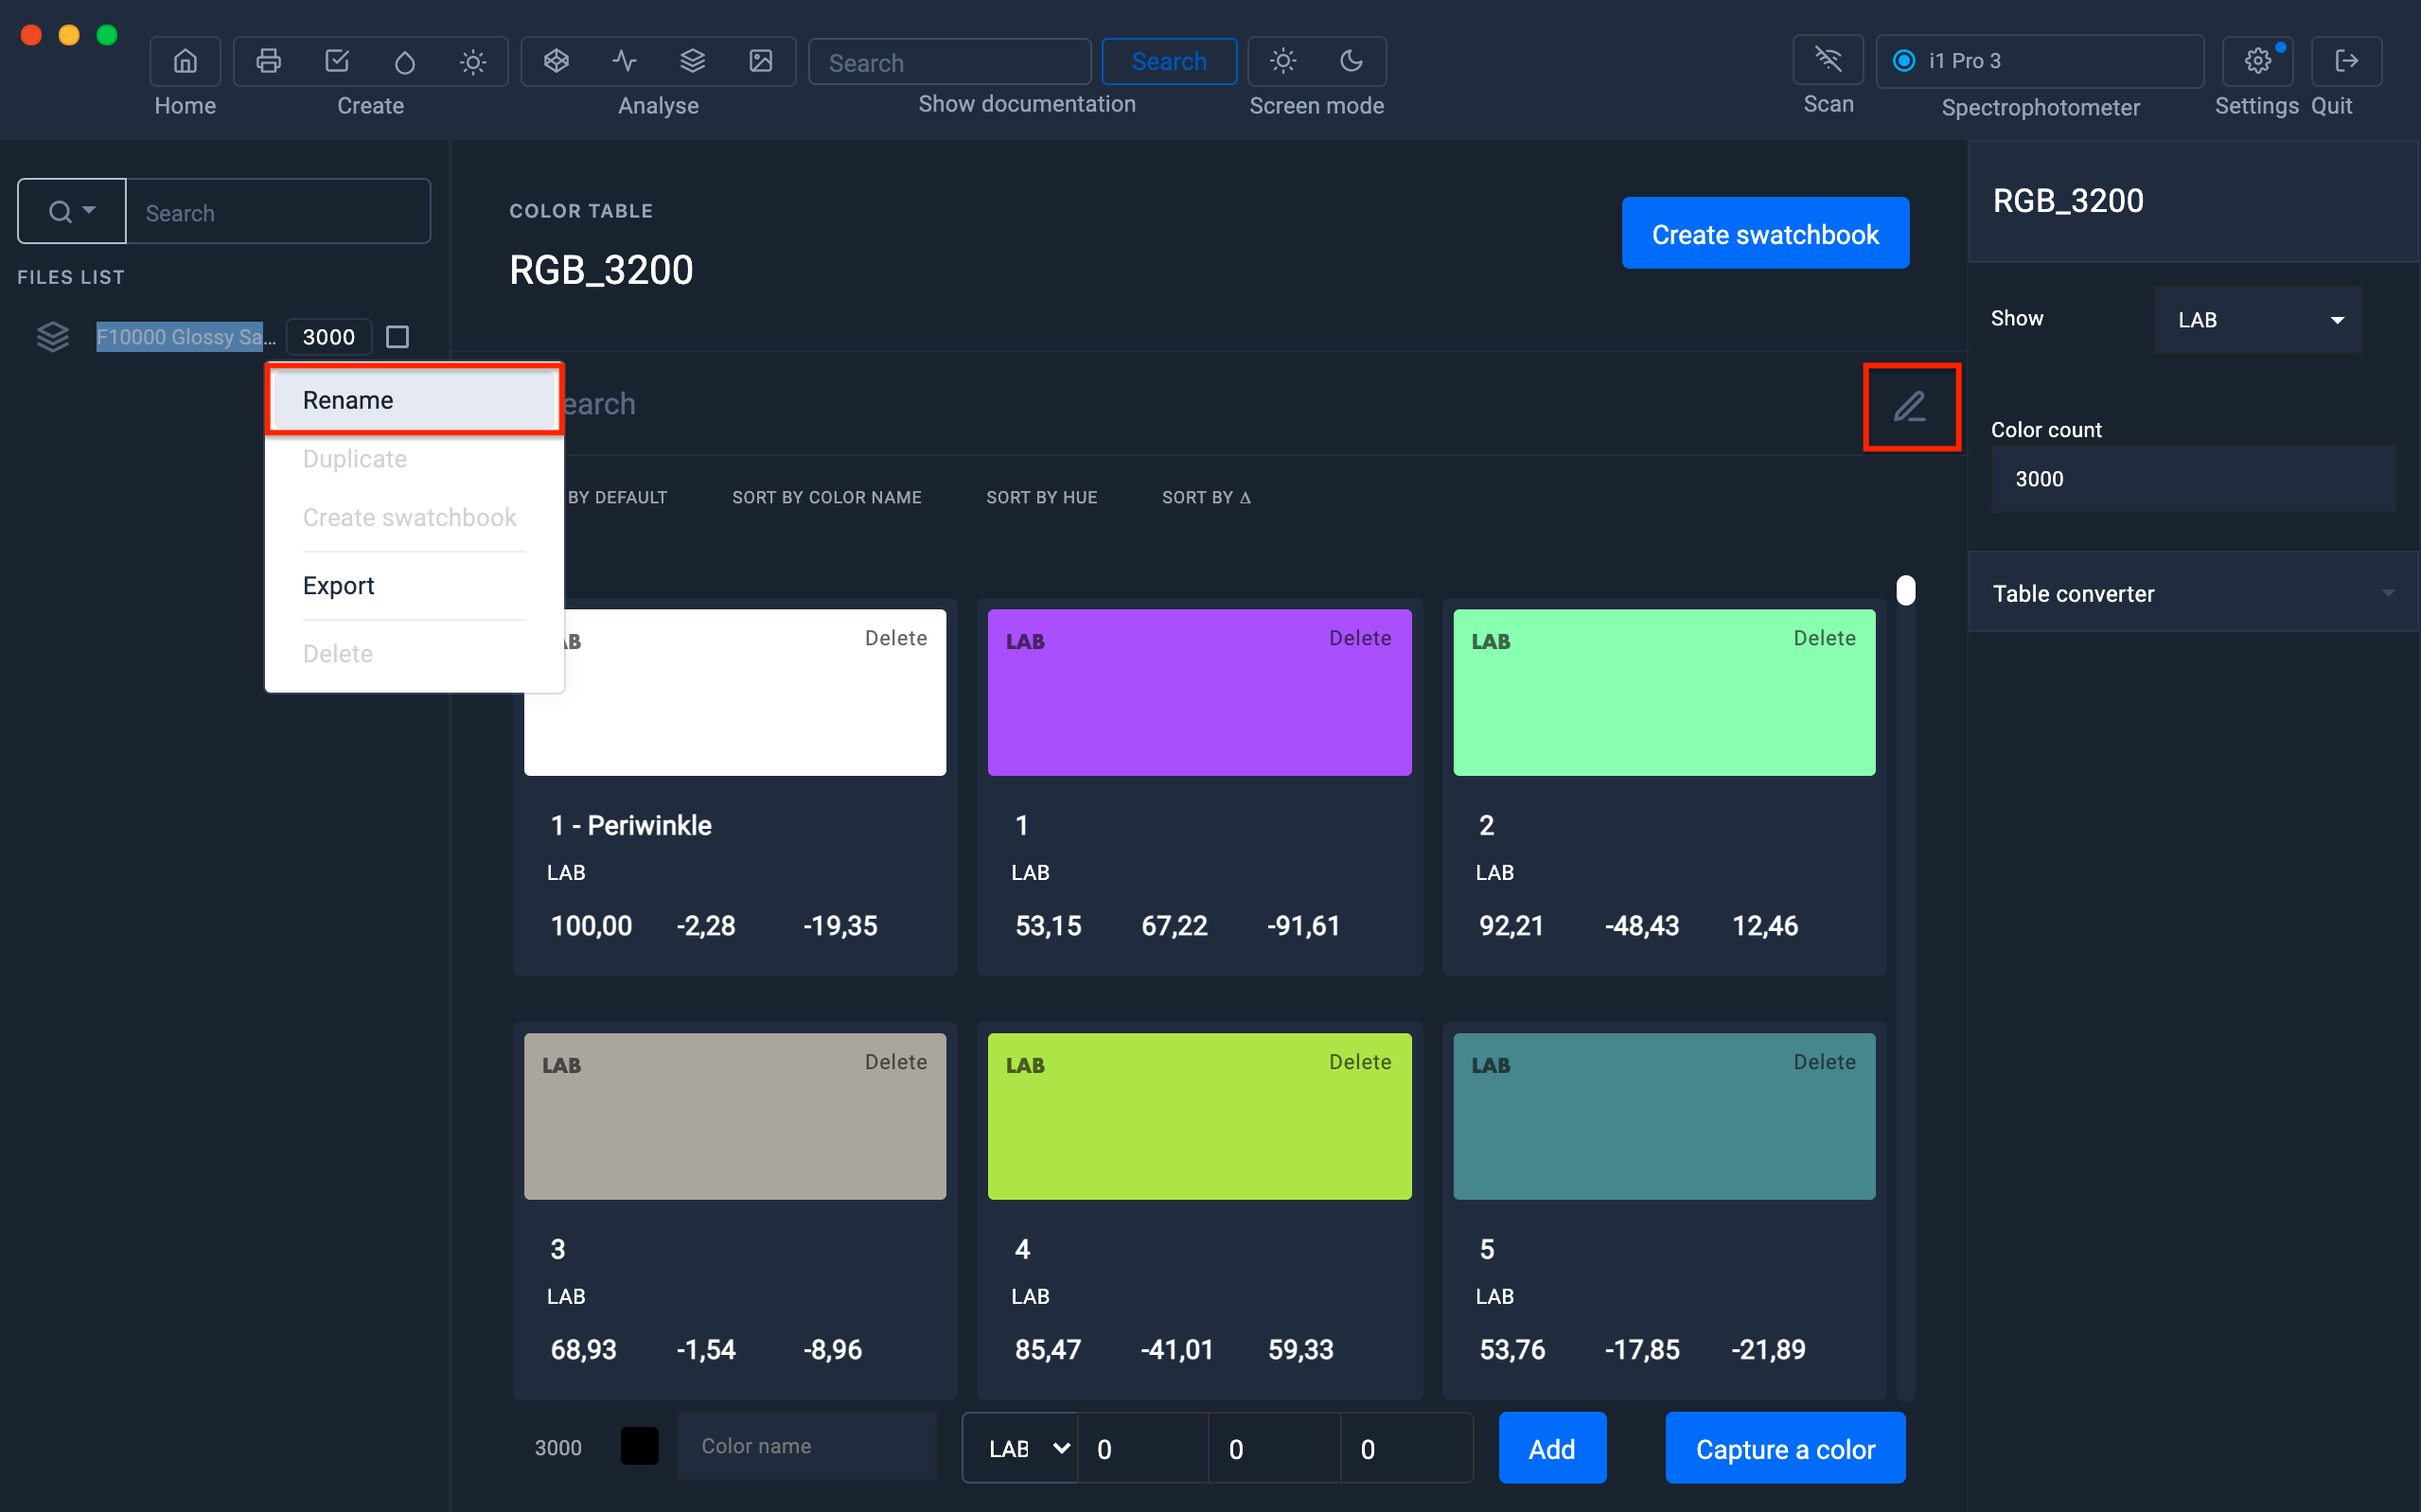
Coraye uses a naming convention to modify the name of the colors contained in the table very simply.
In this example we will call our colors "Glossy Satin + sample number".
The rule used will be: Glossy Satin ID
 Convention de nom
When your table is renamed, don't forget to save it
Color search
From now on, you are ready to satisfy your customers...because not only can you quickly tell them if you can reproduce the color they want, but you can also determine the RGB values to use in Photoshop or Illustrator software to restore this color perfectly.
Coraye Modules:
- Color Capture
- Color Table
- Gamut Viewer (optional)
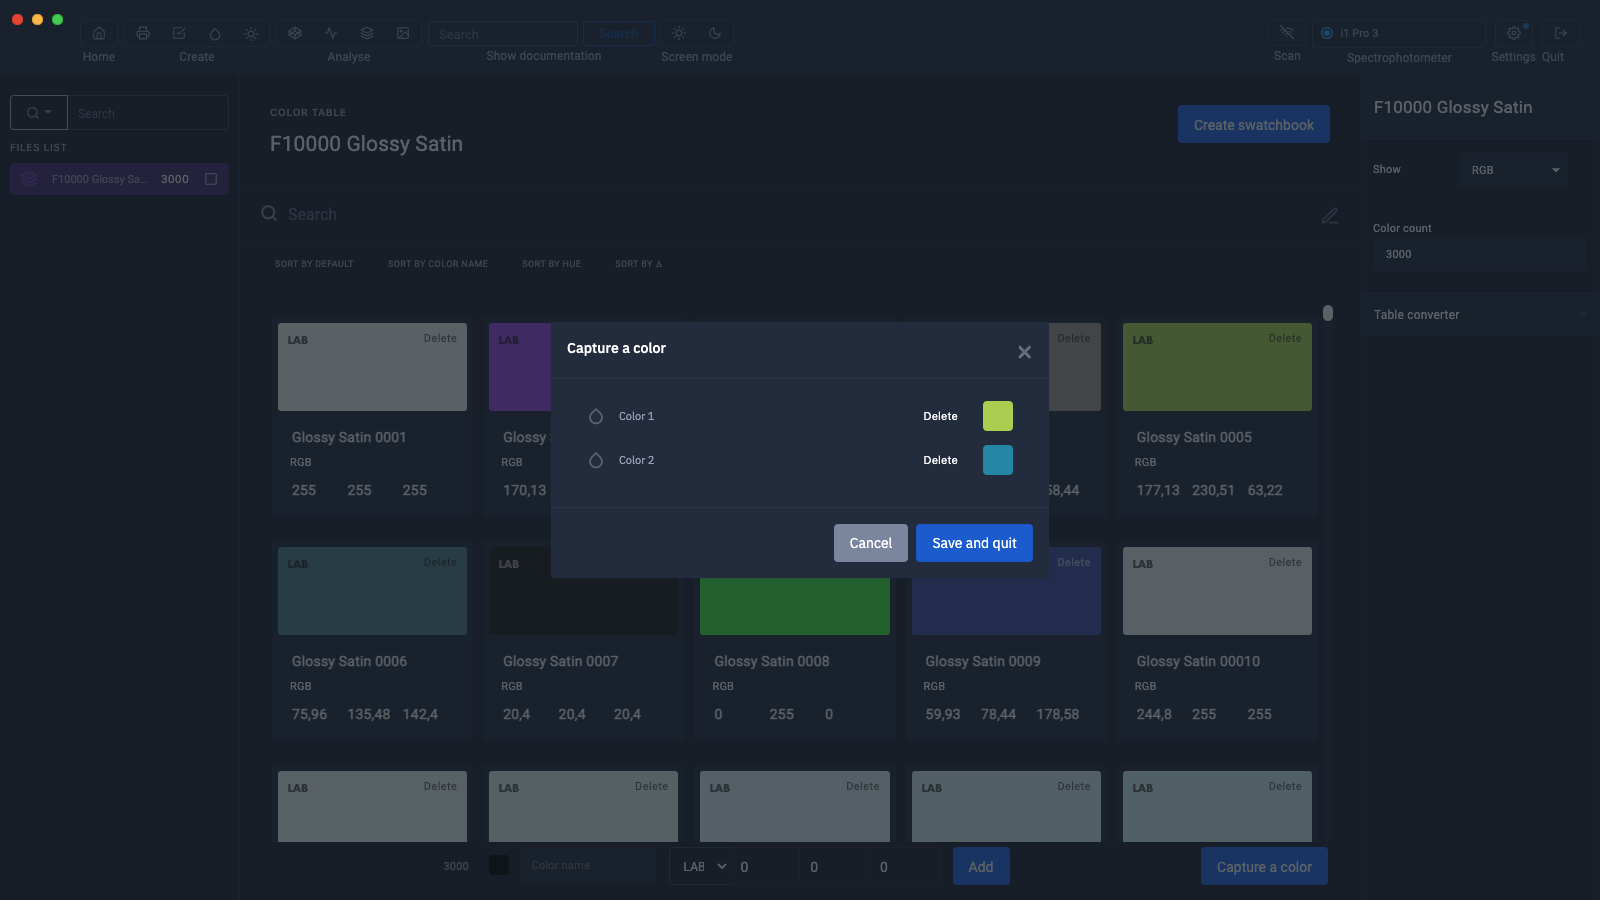
1) Measurement of the sample(s) to be reproduced
In coraye, connect your spectrophotometer, then launch the color capture module.
Measure the sample to reproduce
 XRite I1 Pro 3 PLUS sample measurement
You have the option to measure multiple samples if you wish
Check if the color is reproducible with the Gamut Viewer module (Optional)
If the color is outside the media profile gamut, the resulting color will be less saturated when printed. (Geranium Red)
If the color is in the gamut of the media, the color obtained will be very close to the desired result (duck blue)
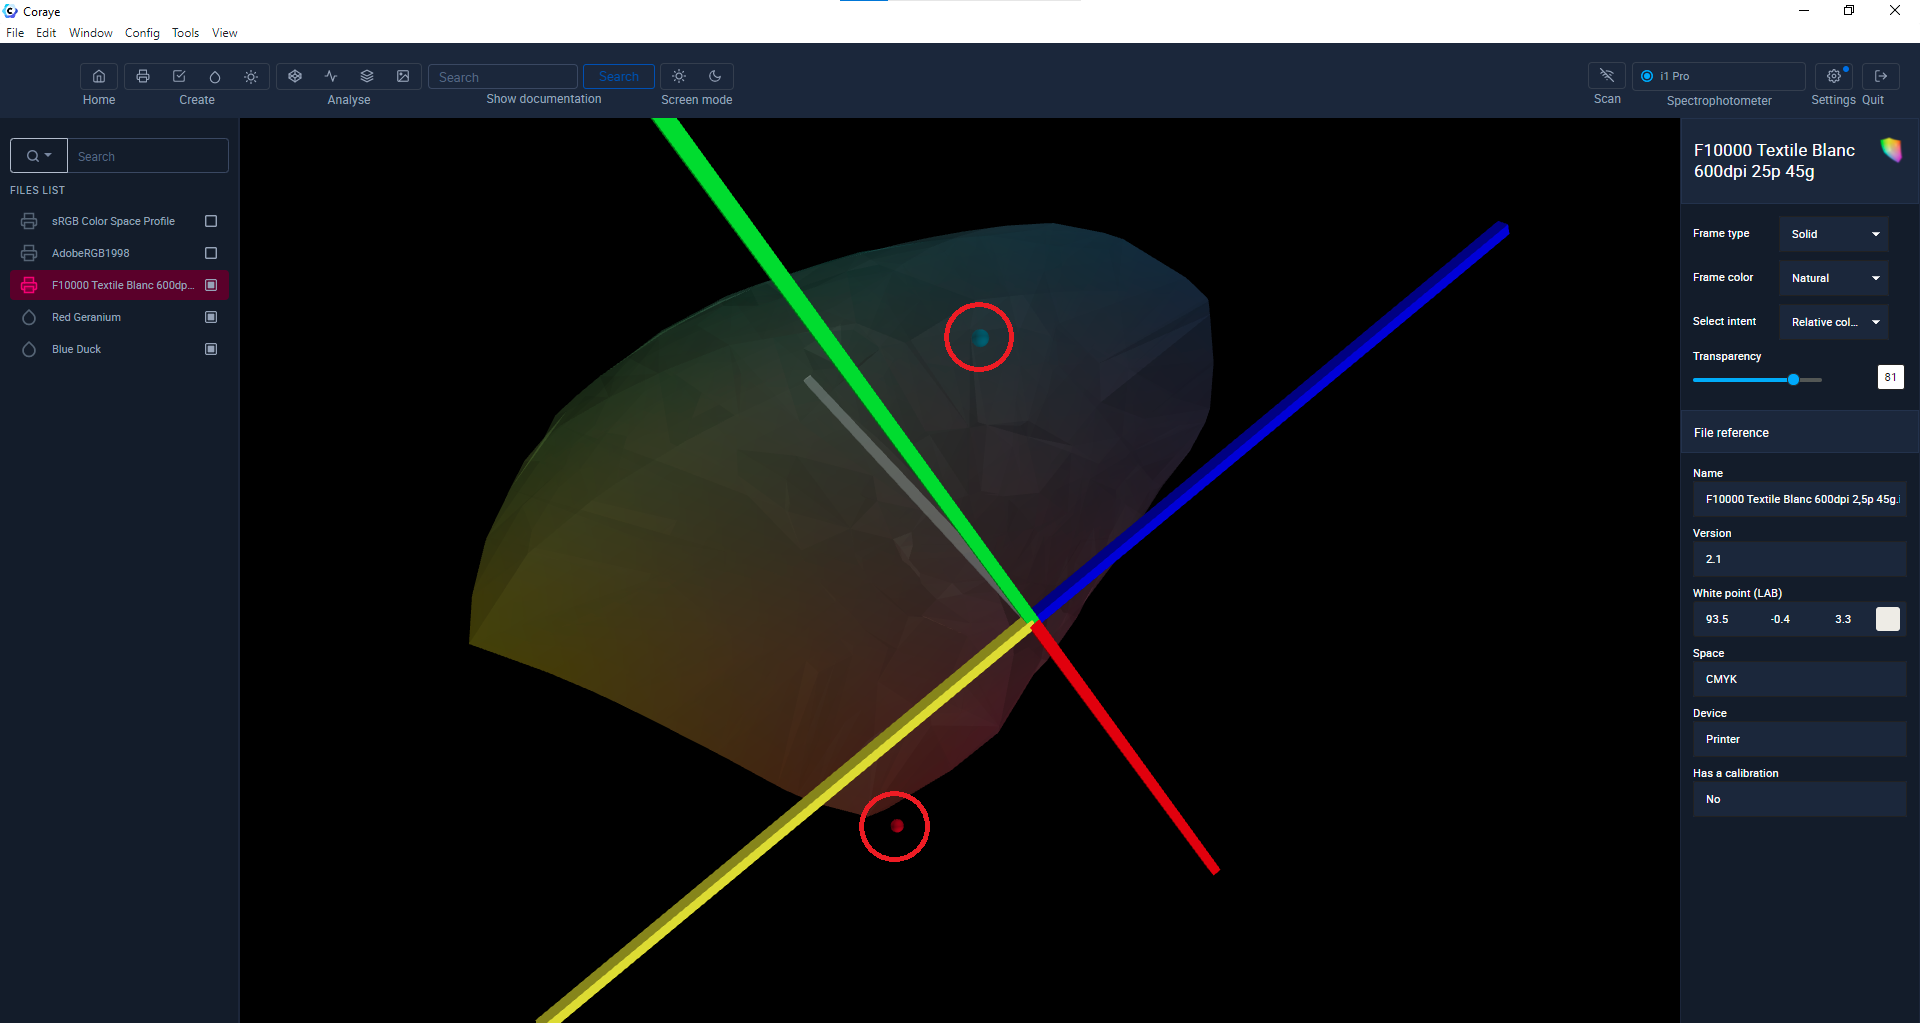 Is the color reproducible?
2) Hue search with Color Finder
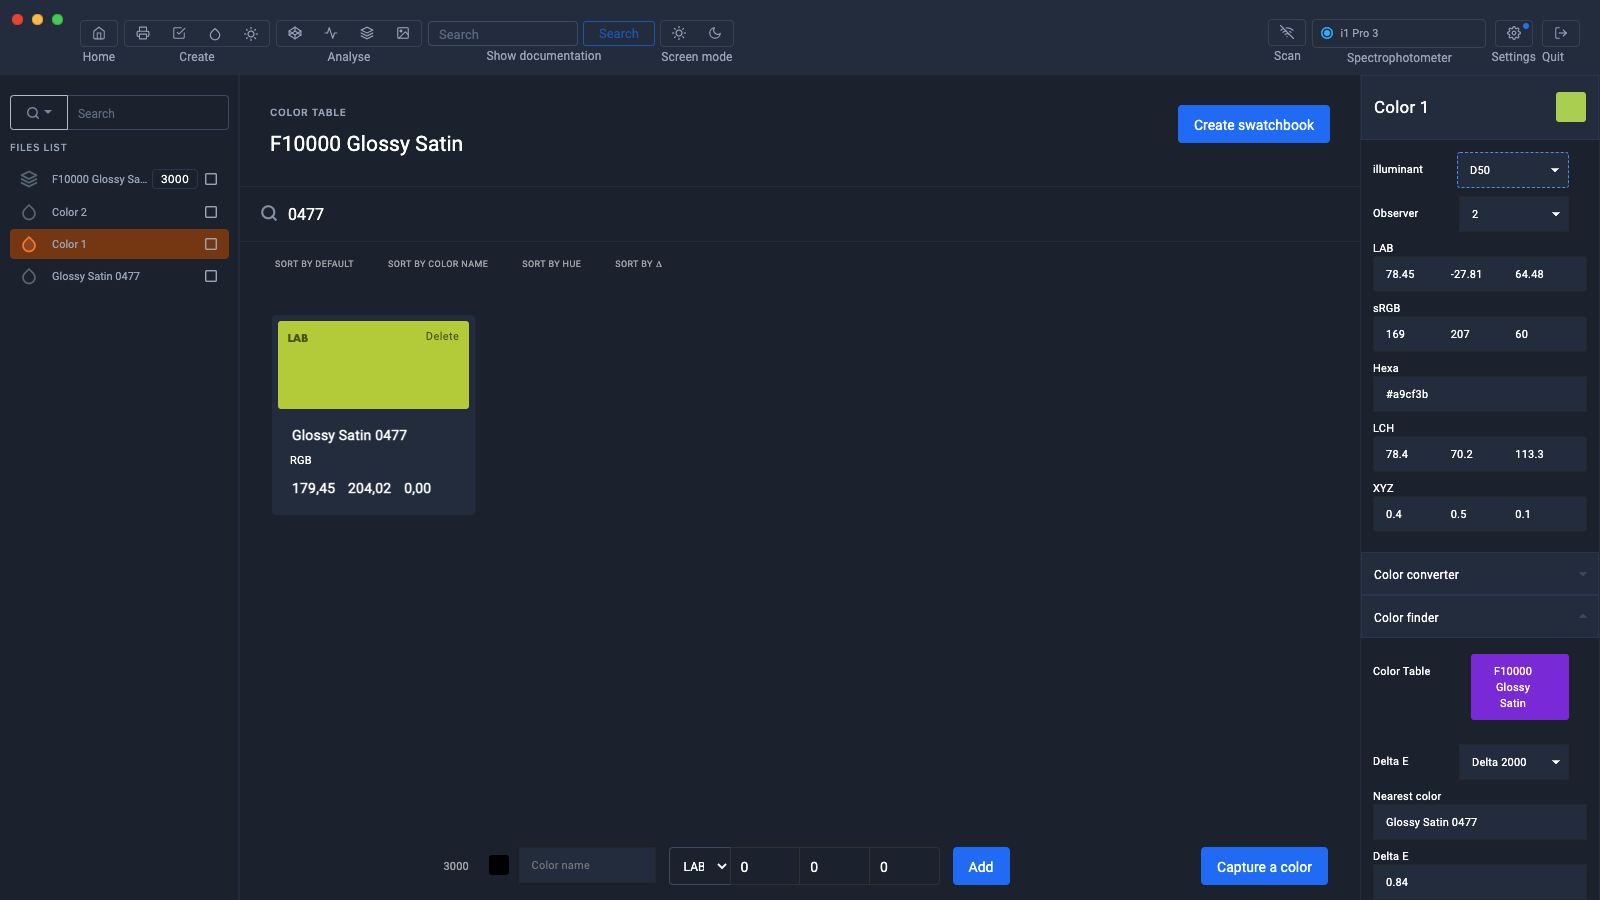
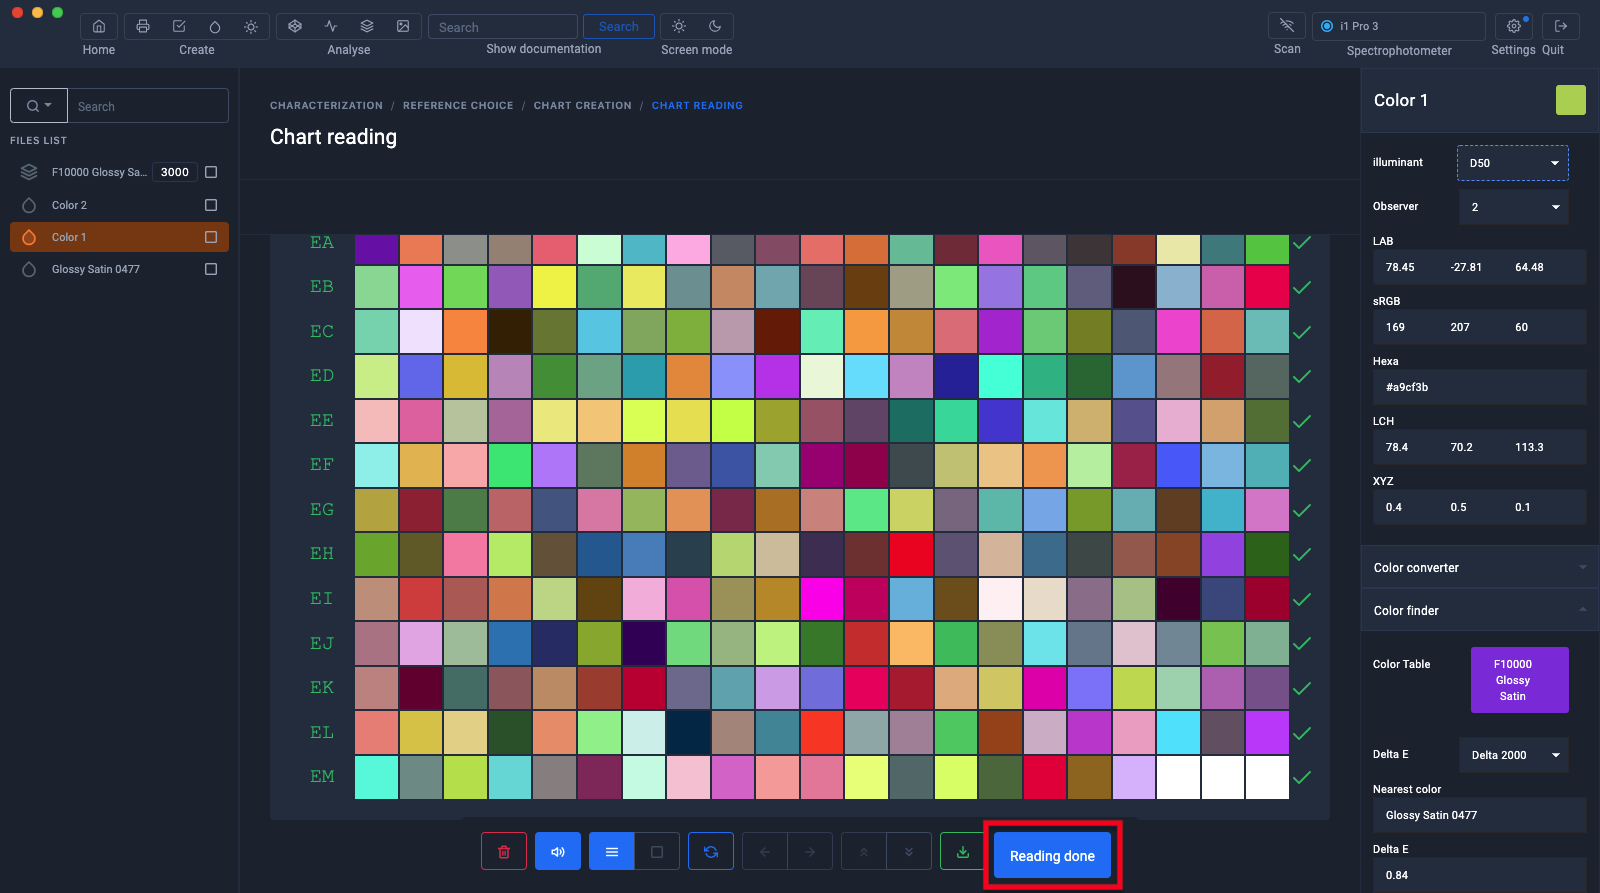
Select the sample, pull down the "Color Finder" menu then drag the color table corresponding to your media into the "Color Table" area.

The nearest table color is displayed in the "Nearest color" cell
In our example: Glossy Satin 0477

Show RGB values instead of Lab values
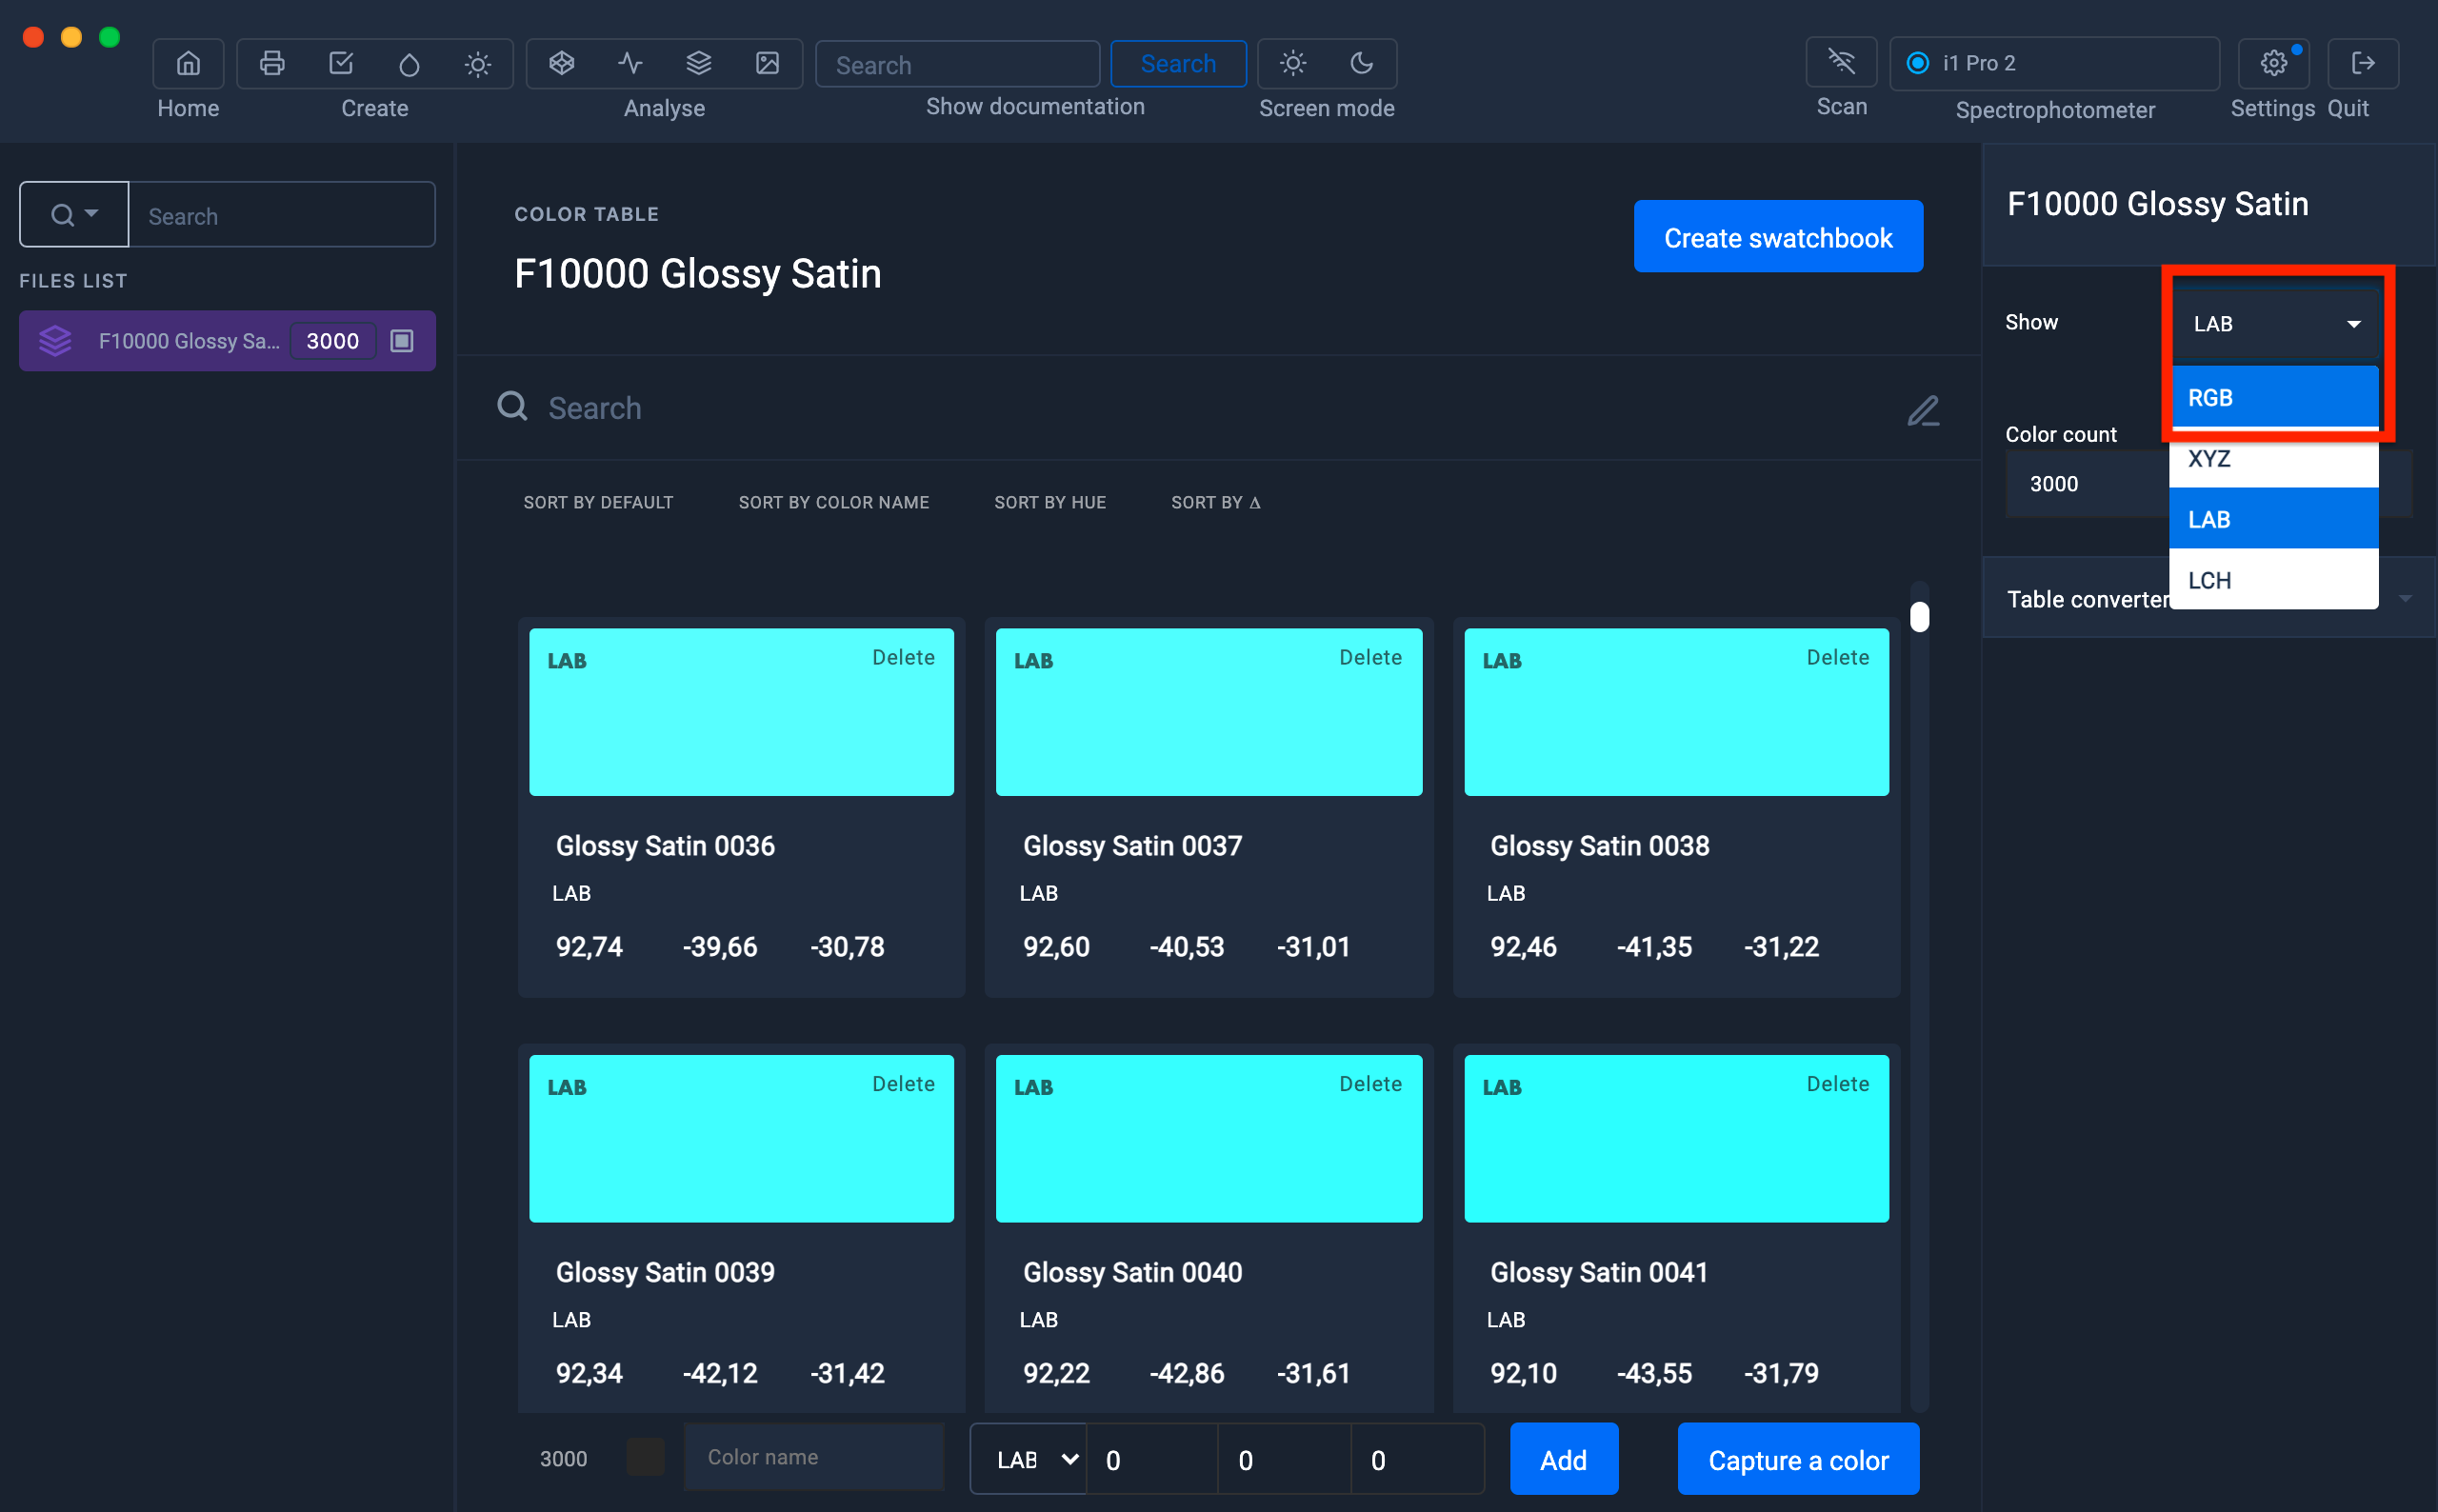
In the "Color table" module isolate the sample using the search field, you will obtain the RGB values to use to reproduce the color on your satin polyester fabric.
The table having been printed using the AdobeRGB1998.icc reference color space, the RGB value therefore corresponds to the AdobeRGB1998.icc space
In our example the RGB value corresponding to our sample is R = 180, G = 204 and B = 0
Editing colors in Illustrator & Photoshop
1) Check Illustrator's "Colors..." settings
The first thing to do when working in Photoshop or Illustrator is to check the "Colors..." settings.
All software in the graphics chain must be configured with the same color reference.
In our case, we saw that the AdobeRGB1998.icc space was the most appropriate for optimizing printed colors.
So your RIP (Epson Edge Print), your Adobe software (Photoshop & Illustrator) must use the same reference color space.
This setting is located in the same place on Photoshop and Illustrator:
Edit > Colors...
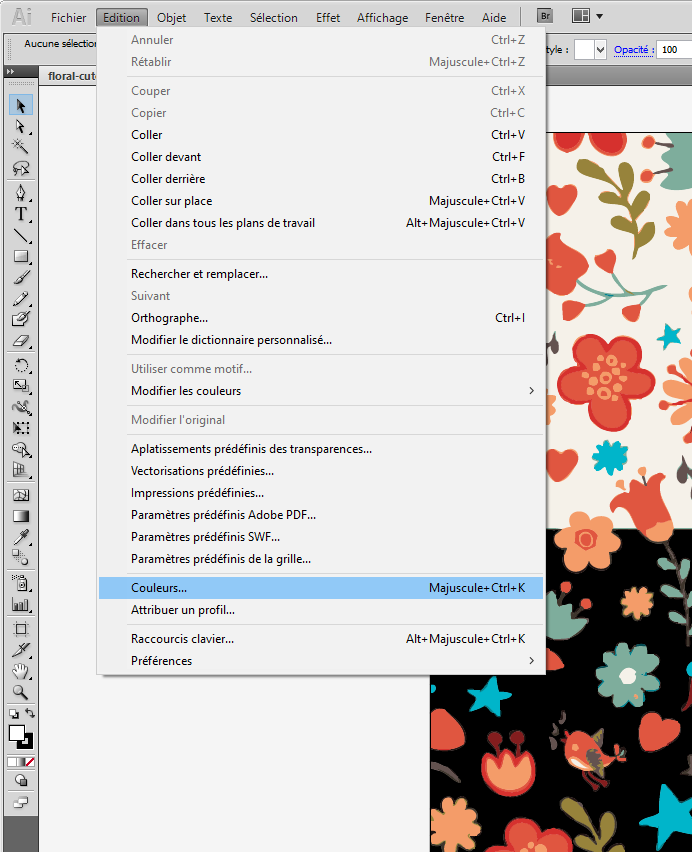
Then take inspiration from the screenshot below to define the parameters.

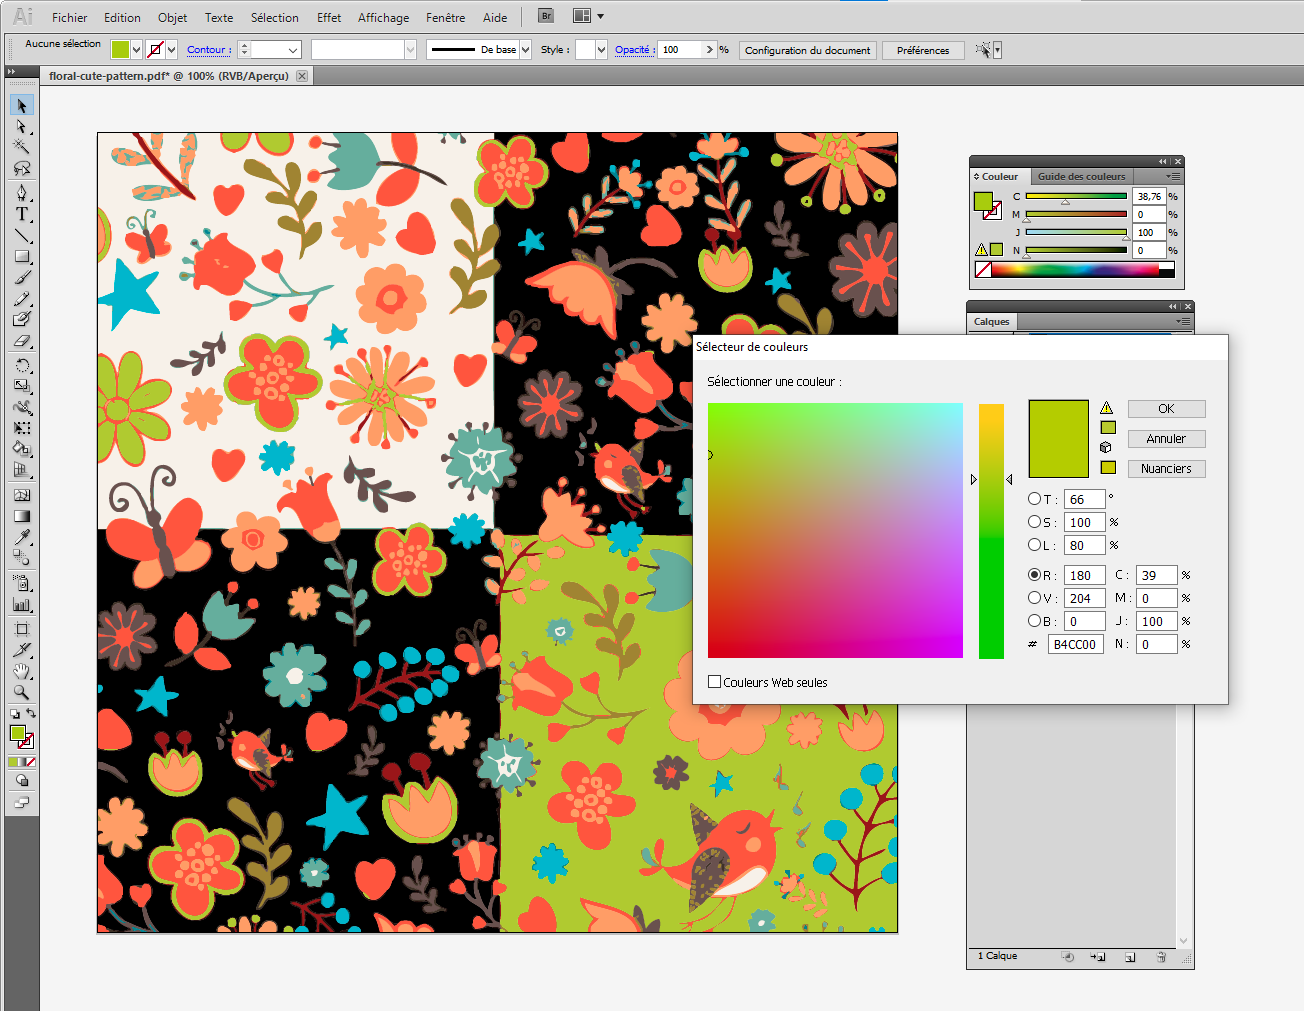
2) Creating an RGB color manually
To reproduce the colors in Illustrator or Photoshop, you just need to transfer the RGB values in the color picker.
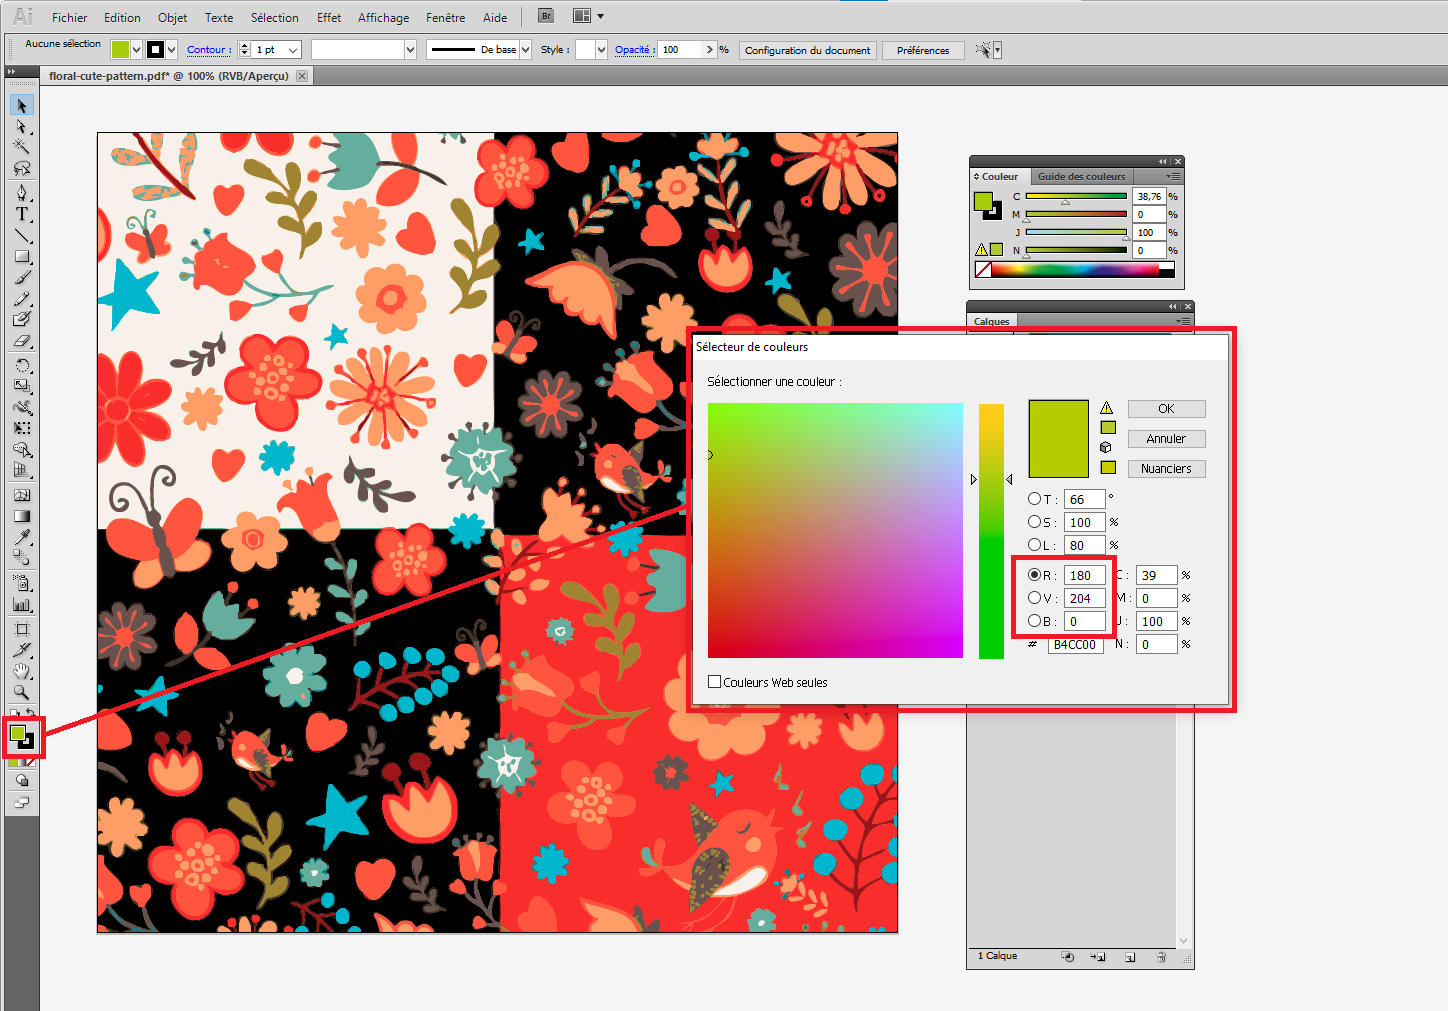
And then to apply the colors in your pattern.
When you go to import your design into the RIP, make sure that the reference profiles are set up correctly.

Create a swatch to use colors directly in Illustrator or Photoshop
Instead of dragging the RGB colors into the color picker, it can be useful to create a swatch in .ase format that you can use with Photoshop and Illustrator, to apply the swatches directly into your designs.
With this method, you will no longer have to worry about RGB values because when searching for a shade in coraye, you will get the name of the color (ex: Glossy Satin 0477) and you will just have to select this color from the color chart on Photoshop or Illustrator to reproduce the correct color when printing.
Coraye module required:
- Color Table
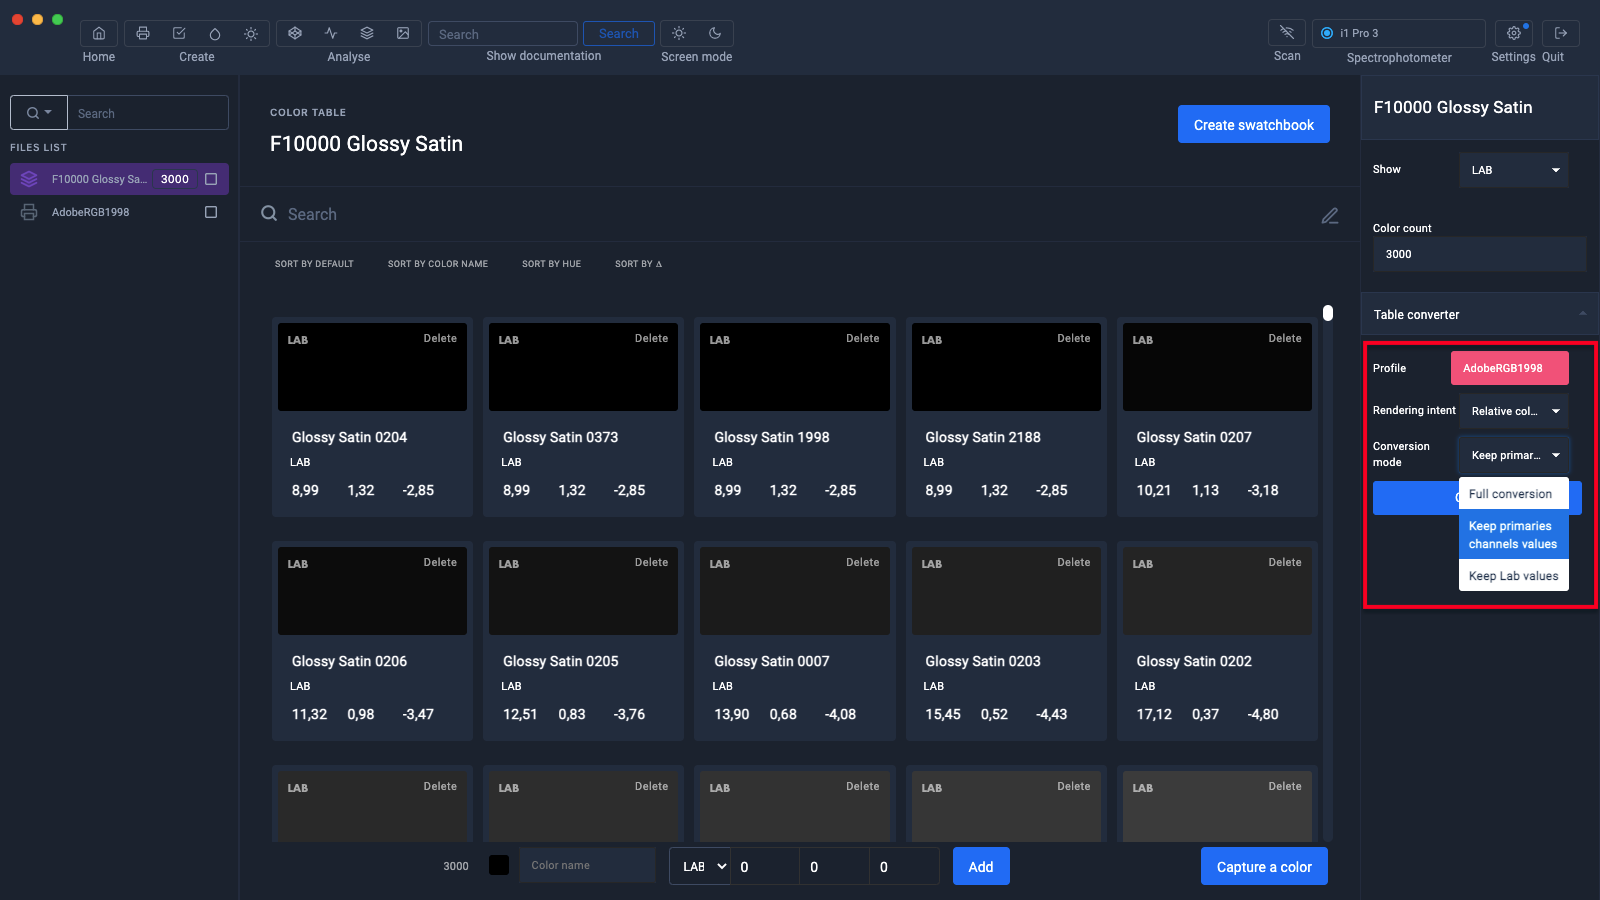
1) Conversion of the table with the AdobeRGB1998.icc profile
The first step consists of converting the measurement table (measurement of the 3000 patch pattern) with the reference profile (AdobeRGB1998.icc).
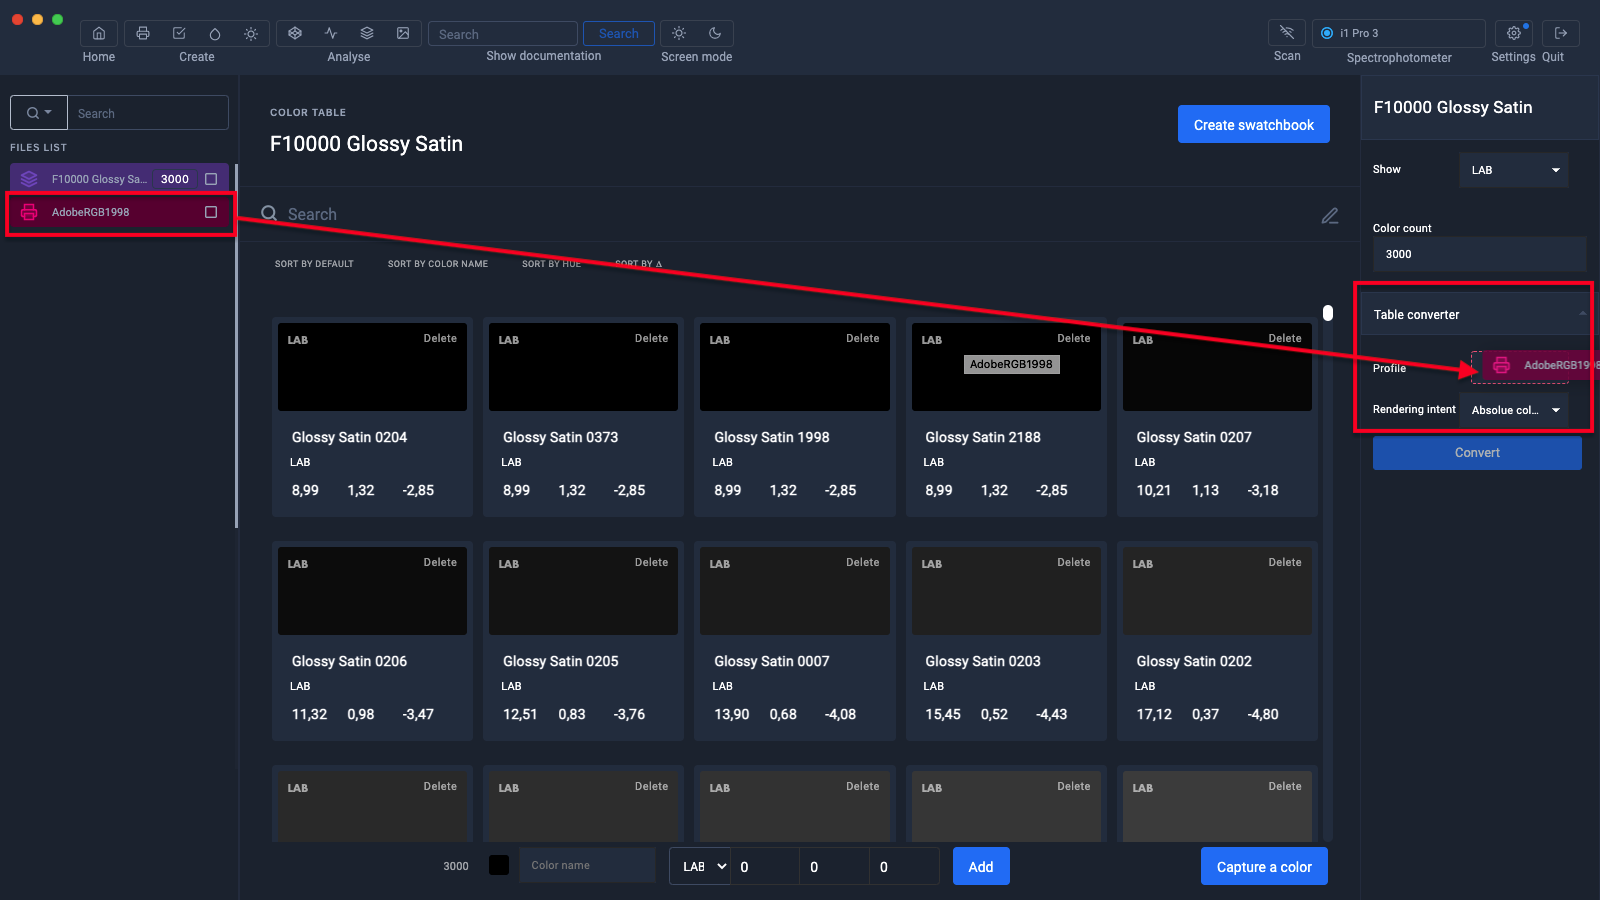
Perform the conversion respecting the rendering mode used during printing (Relative Mode without black point compensation) and keeping the reference RGB values.
You will get a new table: {Original Name (Conversion Profile - Render Mode)}
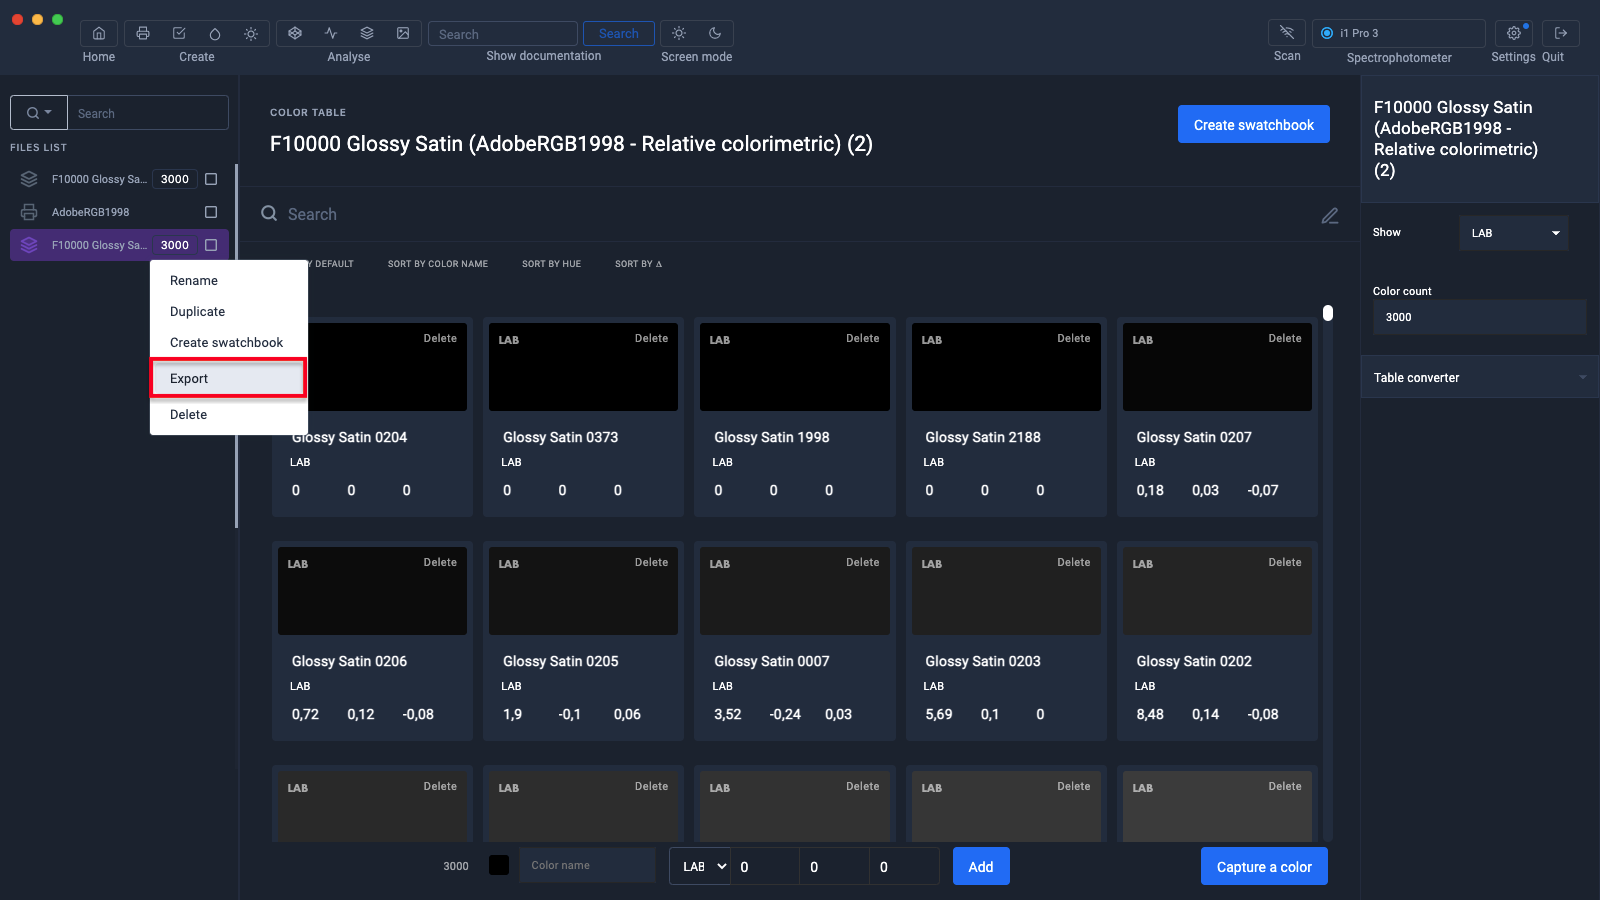
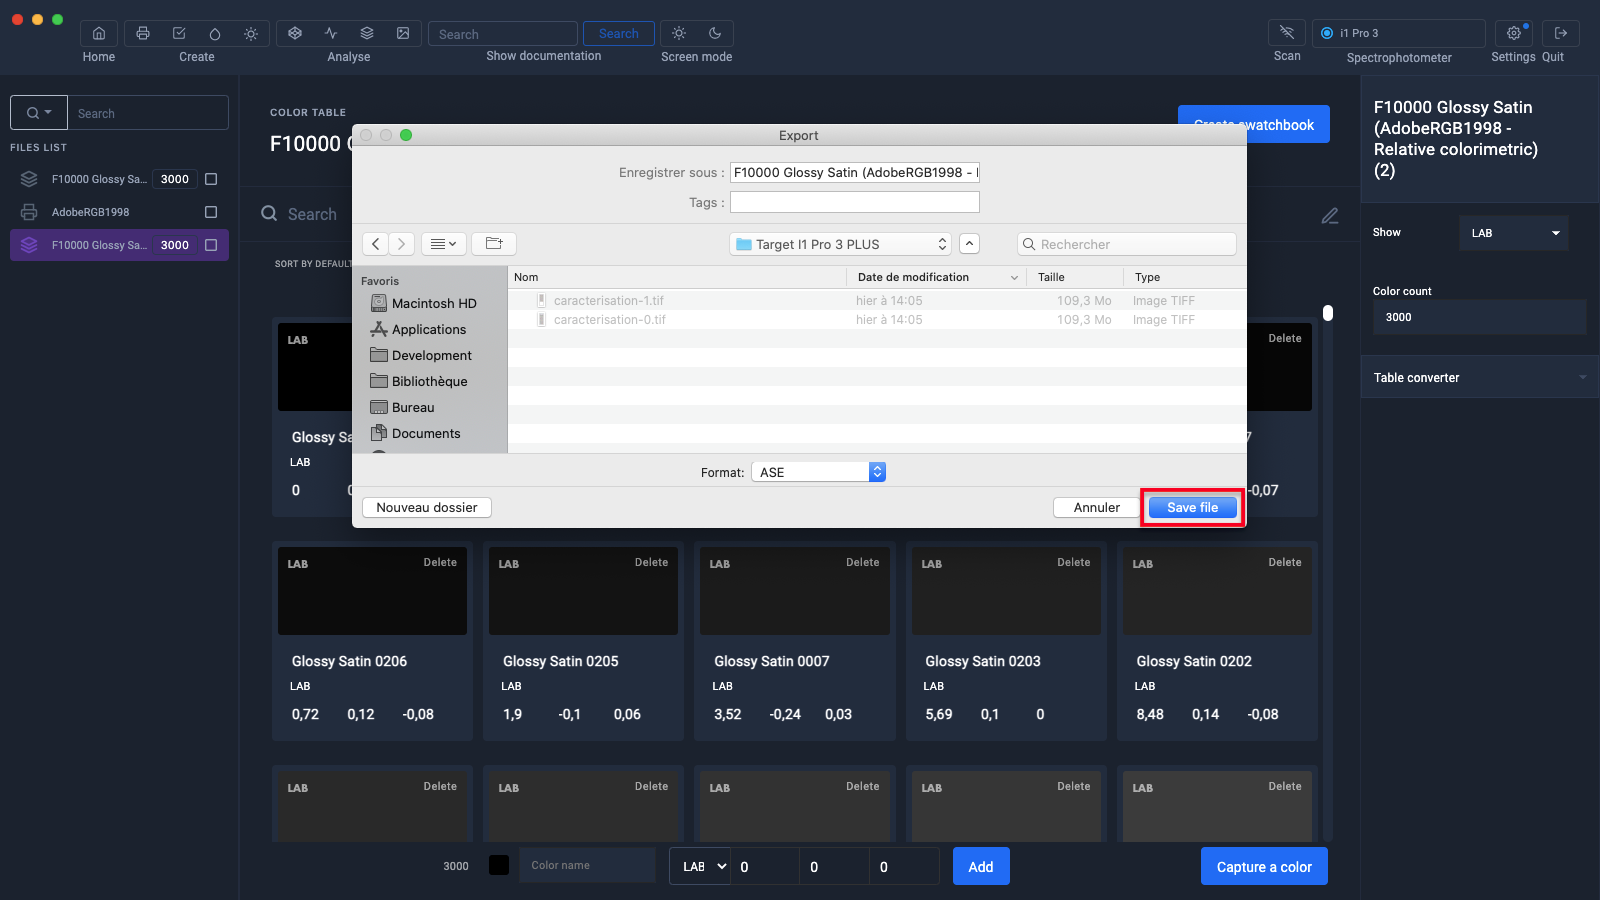
2) Export in .ase format (Illustrator and Photoshop compatible)
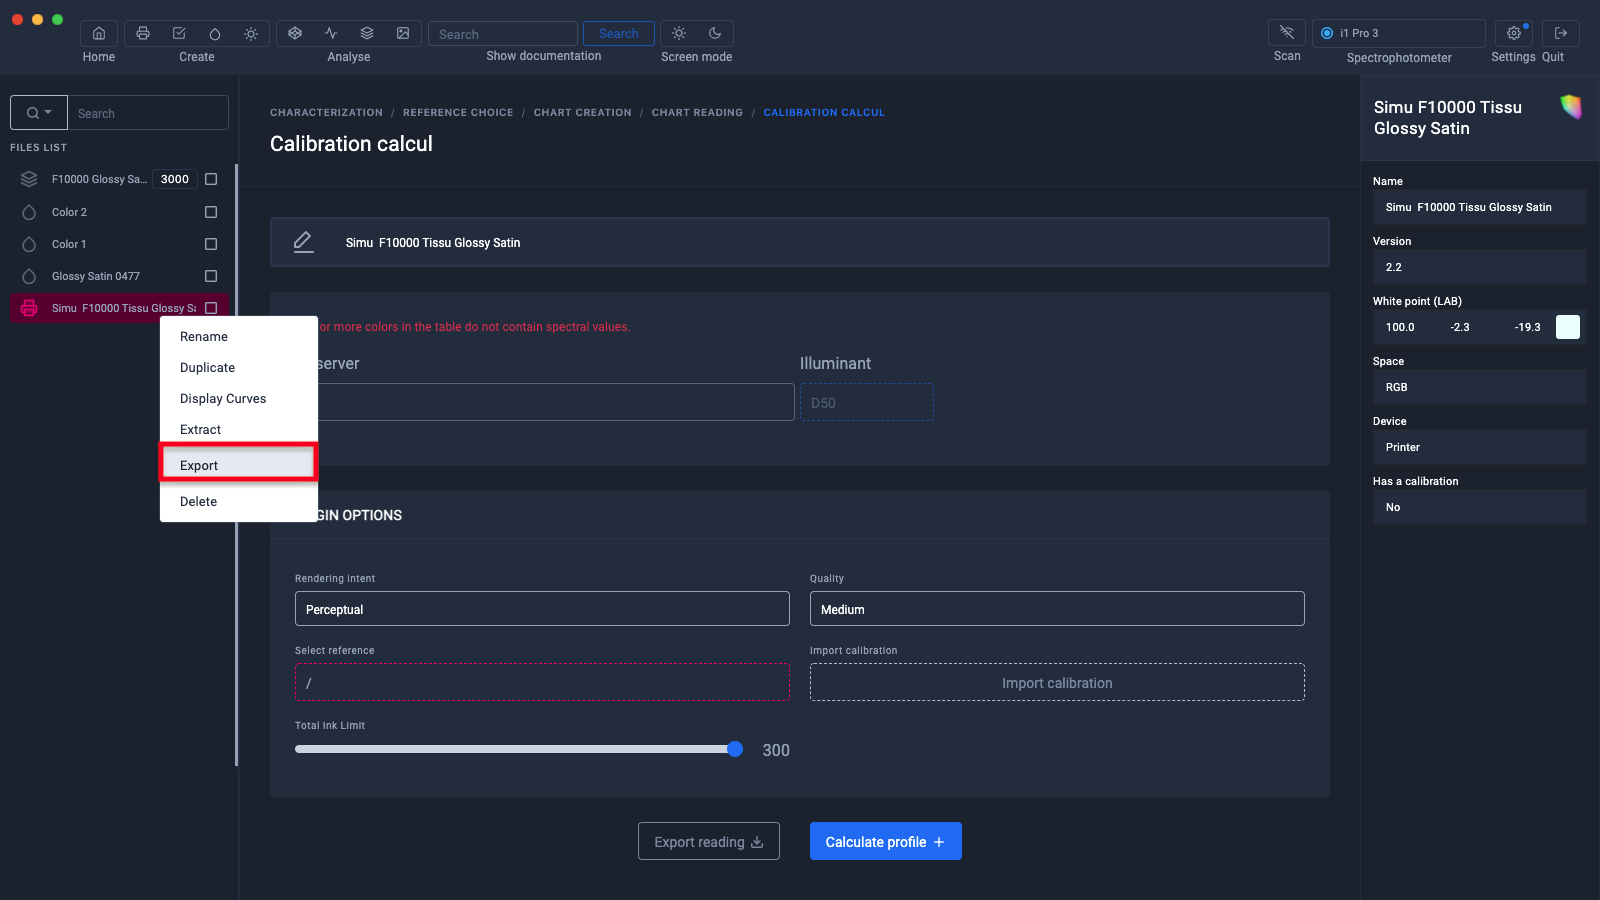
To export this new table in .ase format, right-click > Export...
... Select the icon corresponding to the .ase format
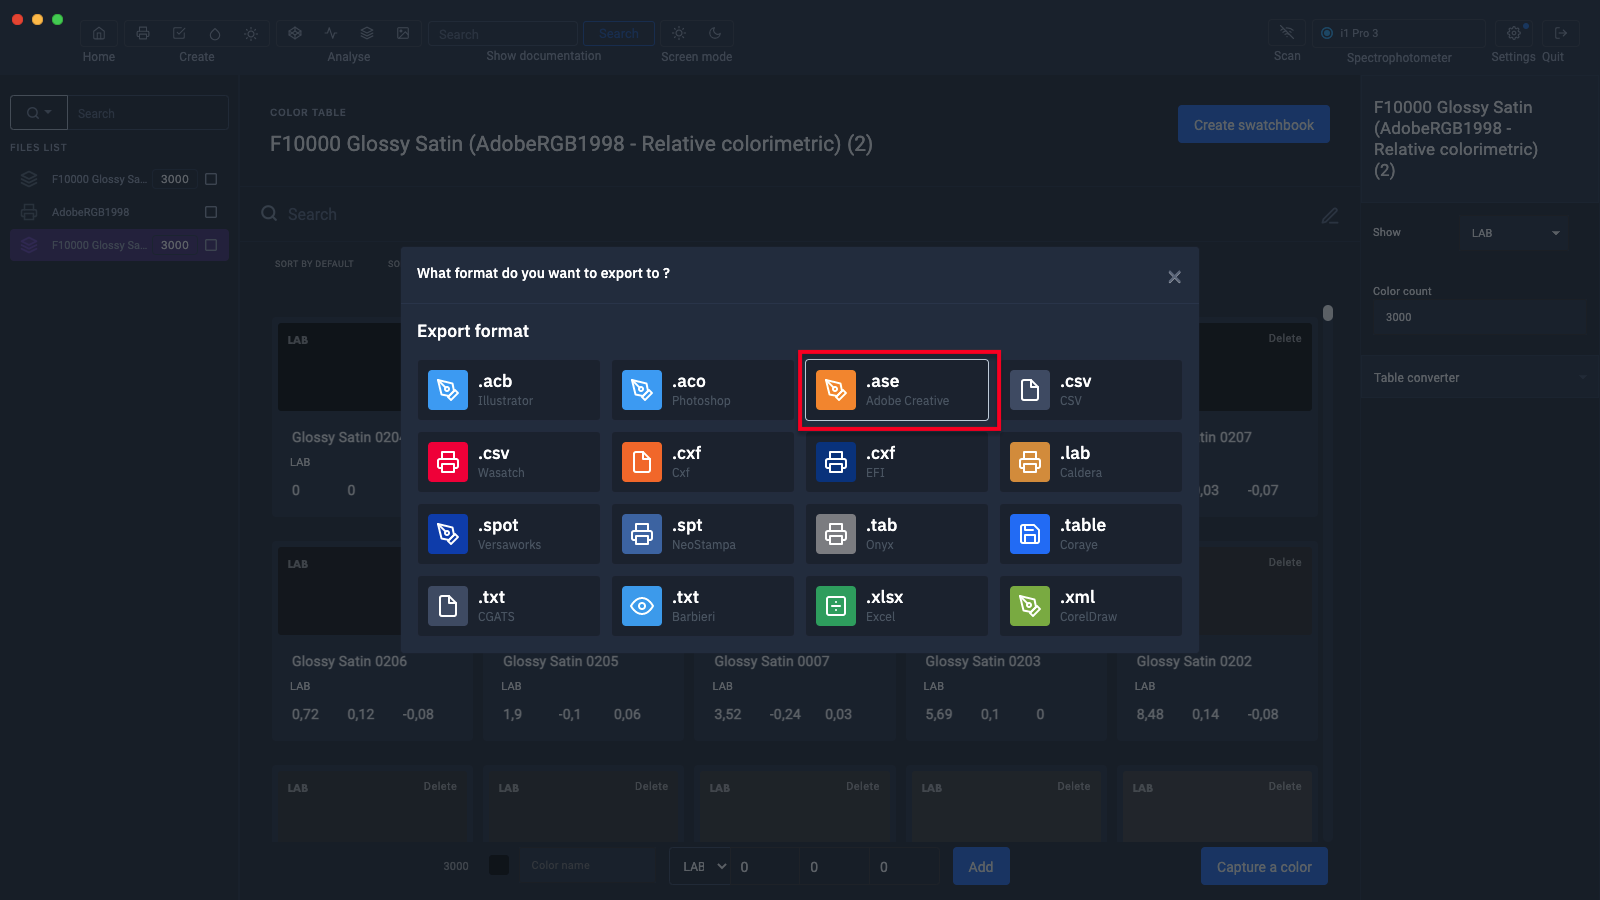
The data contained in the .ase file are only in Lab.
Click on the "Export" button.
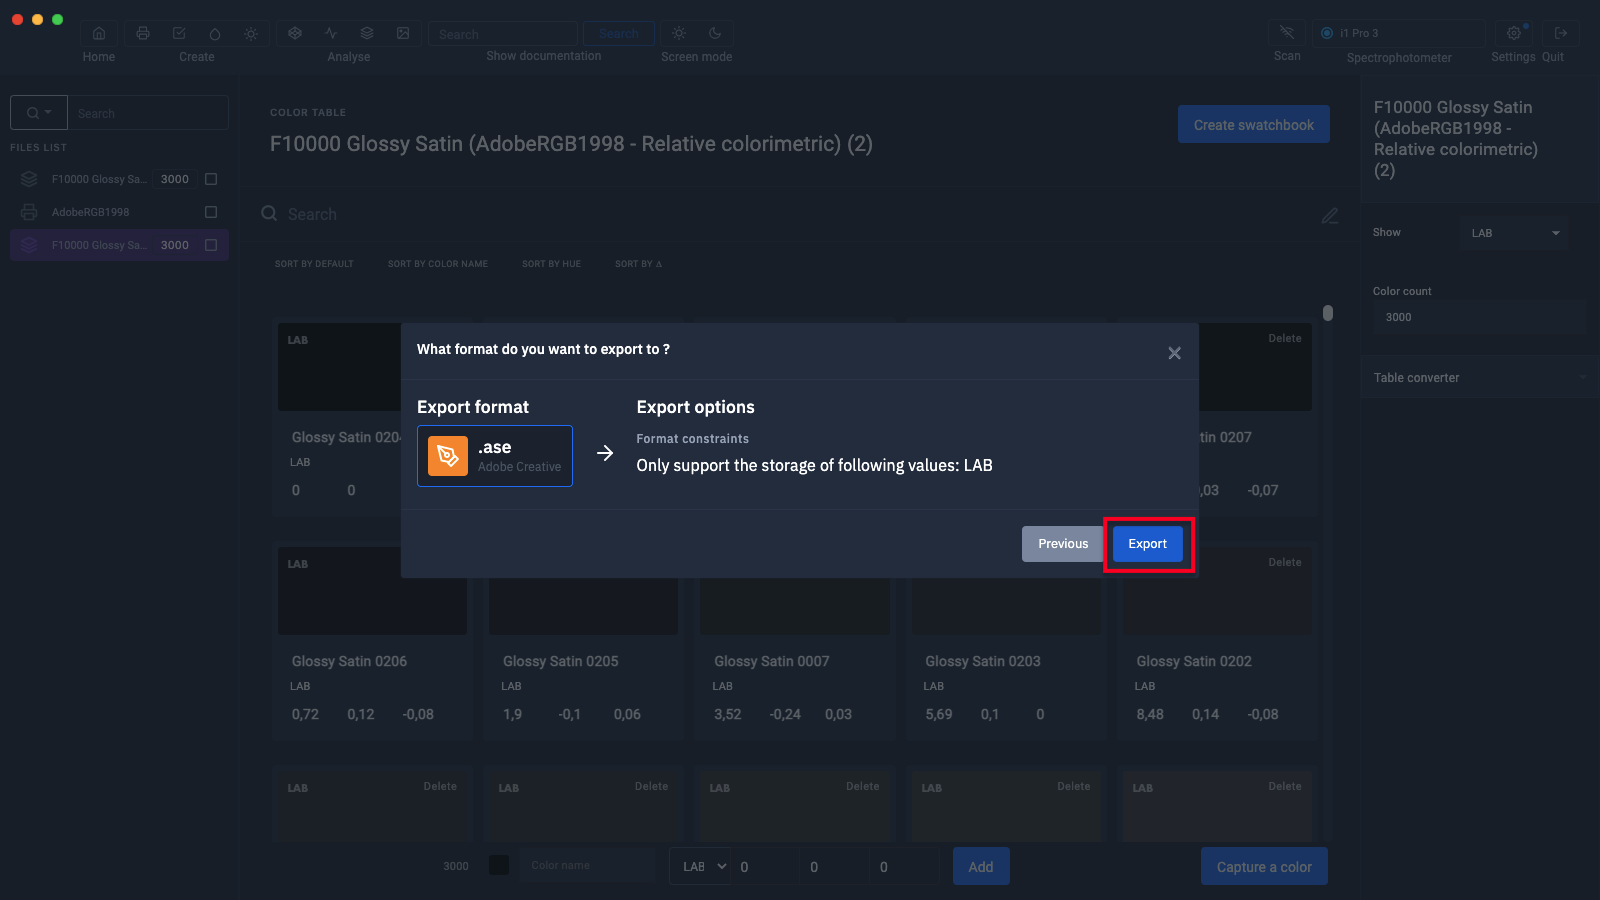
Choose a folder, then click "Save File"
3) Importing the color chart into Illustrator and Photoshop
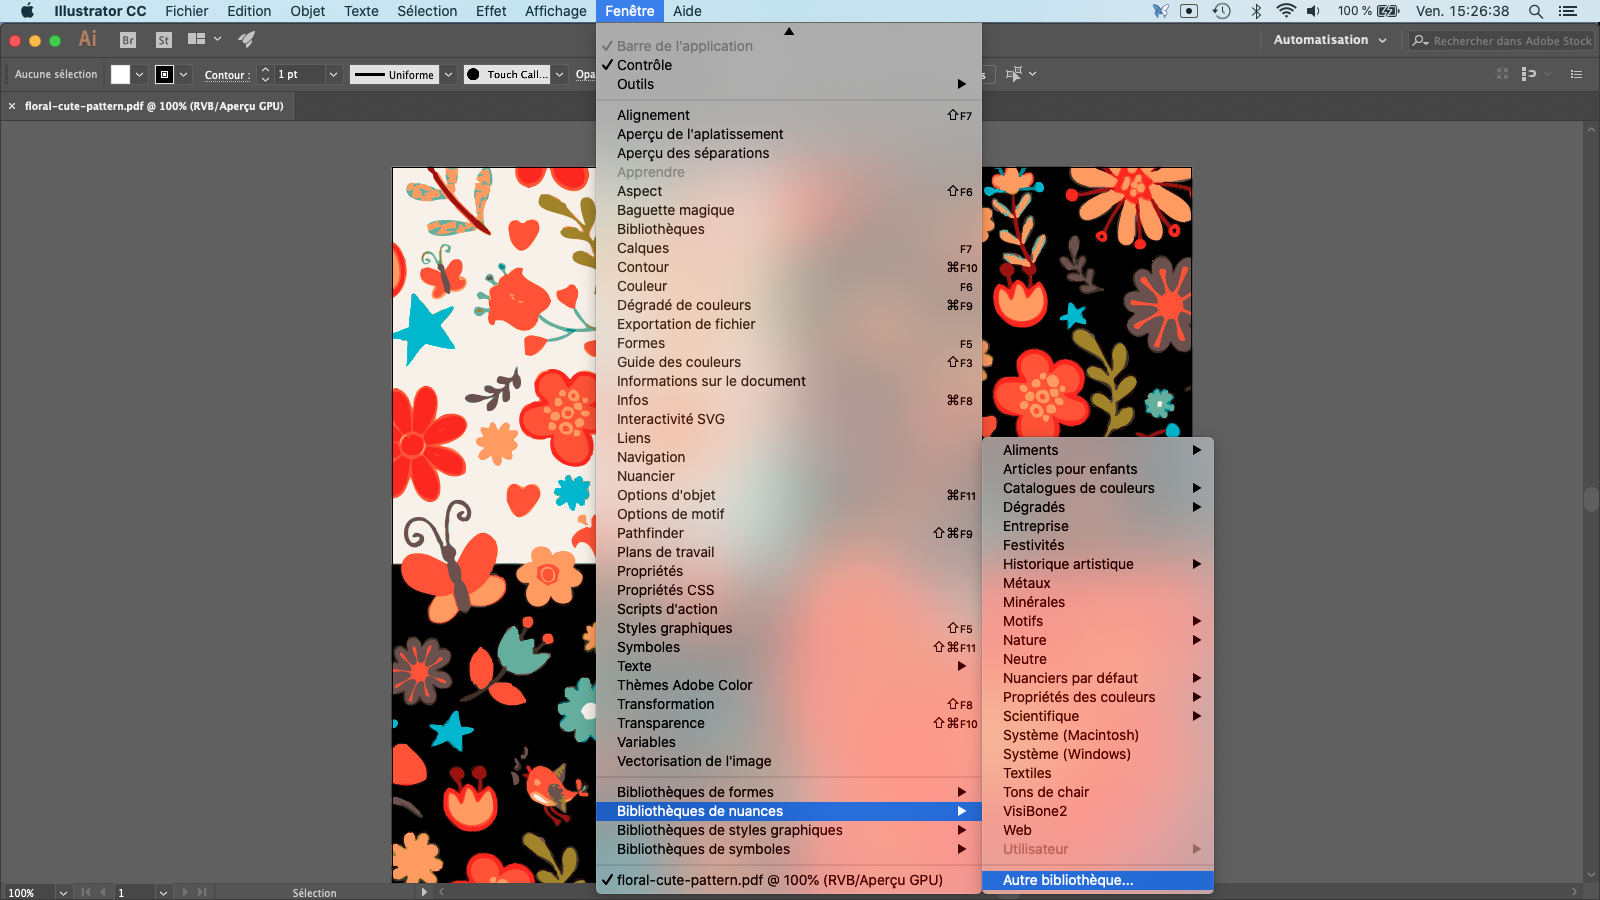
In Illustrator:
Window > Swatch Library > Other Library...
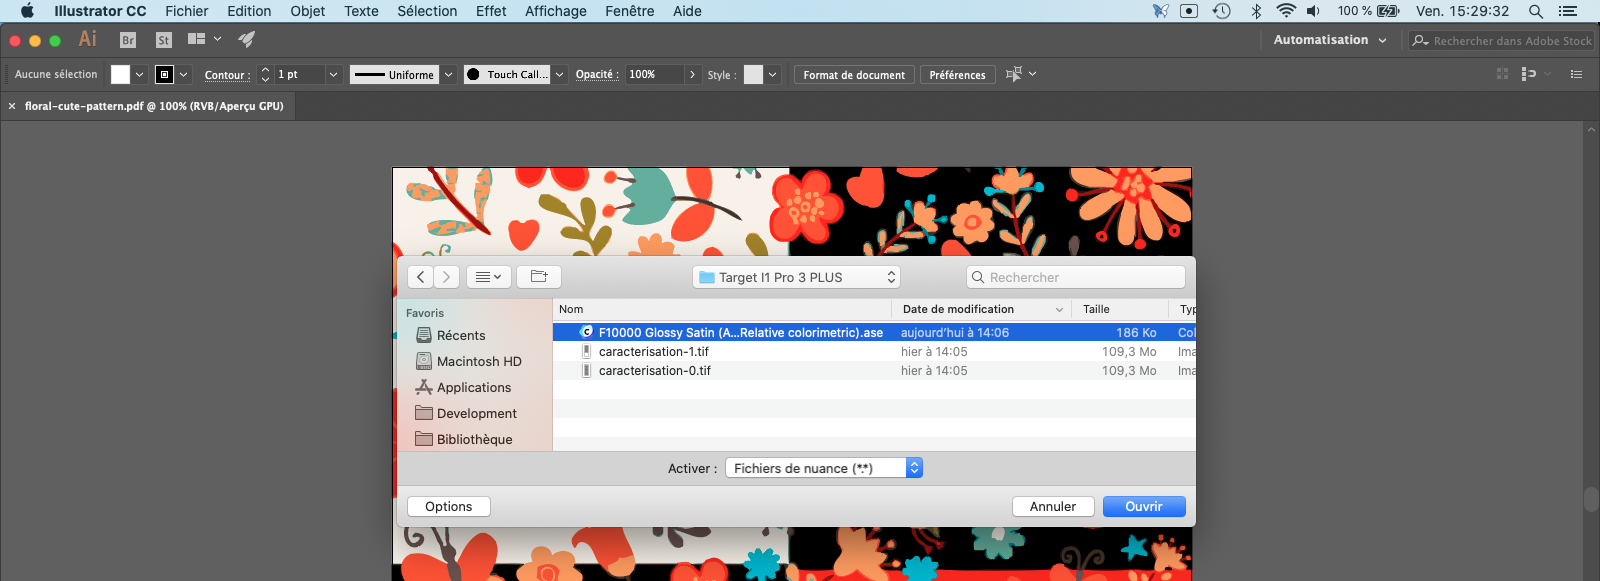
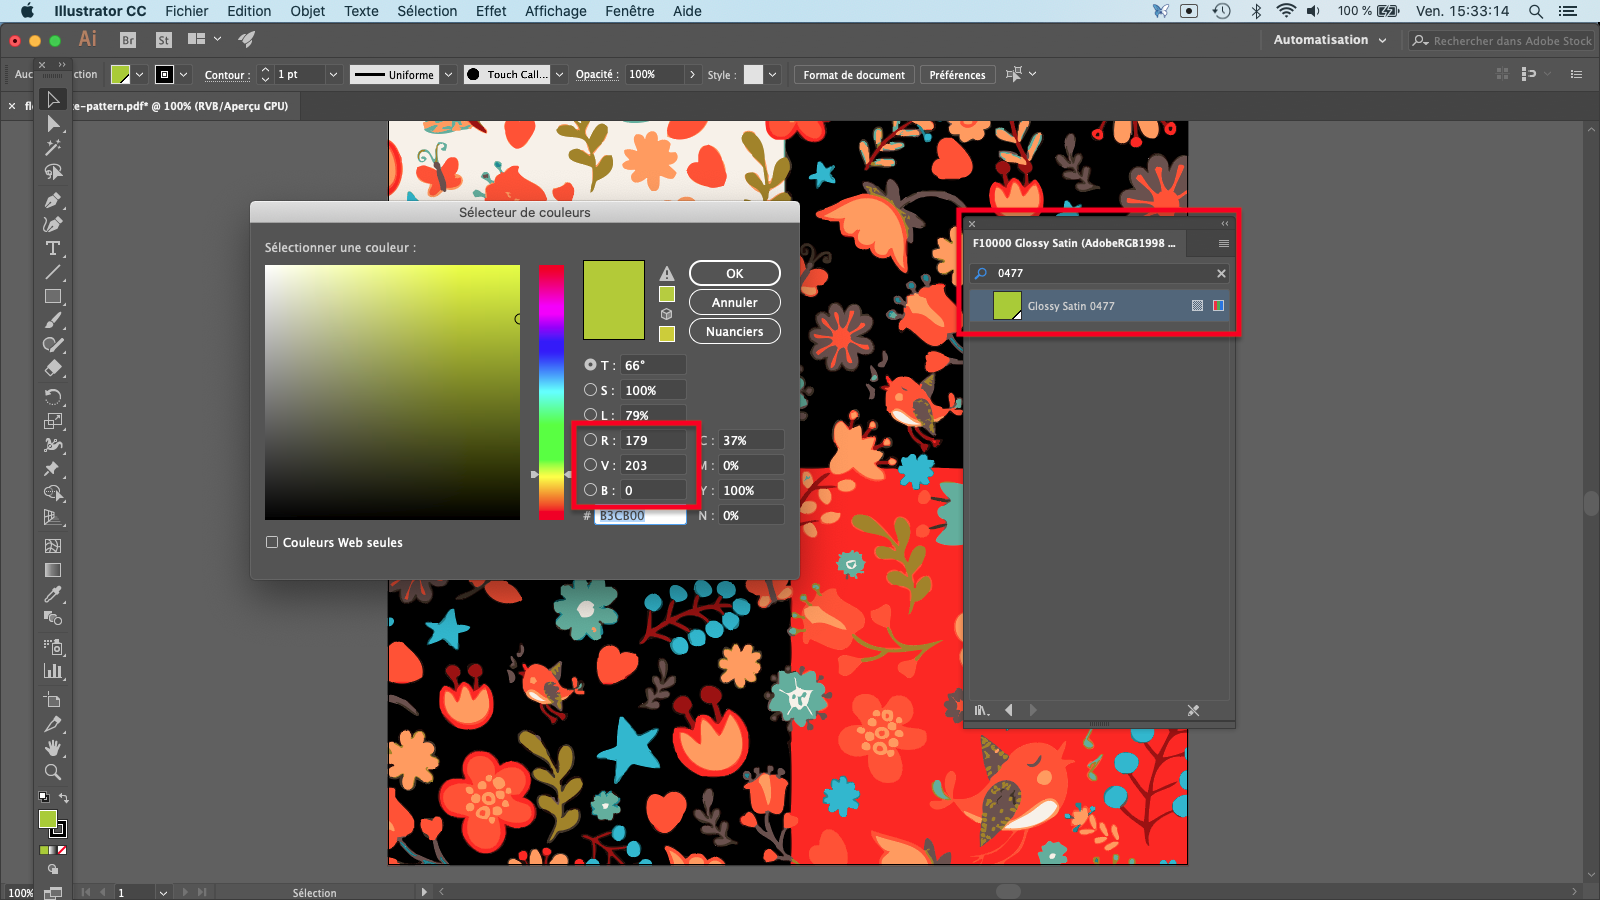
Select the .ase table (ex: F10000 Glossy Satin (AdobeRGB1998 - Relative).ase)
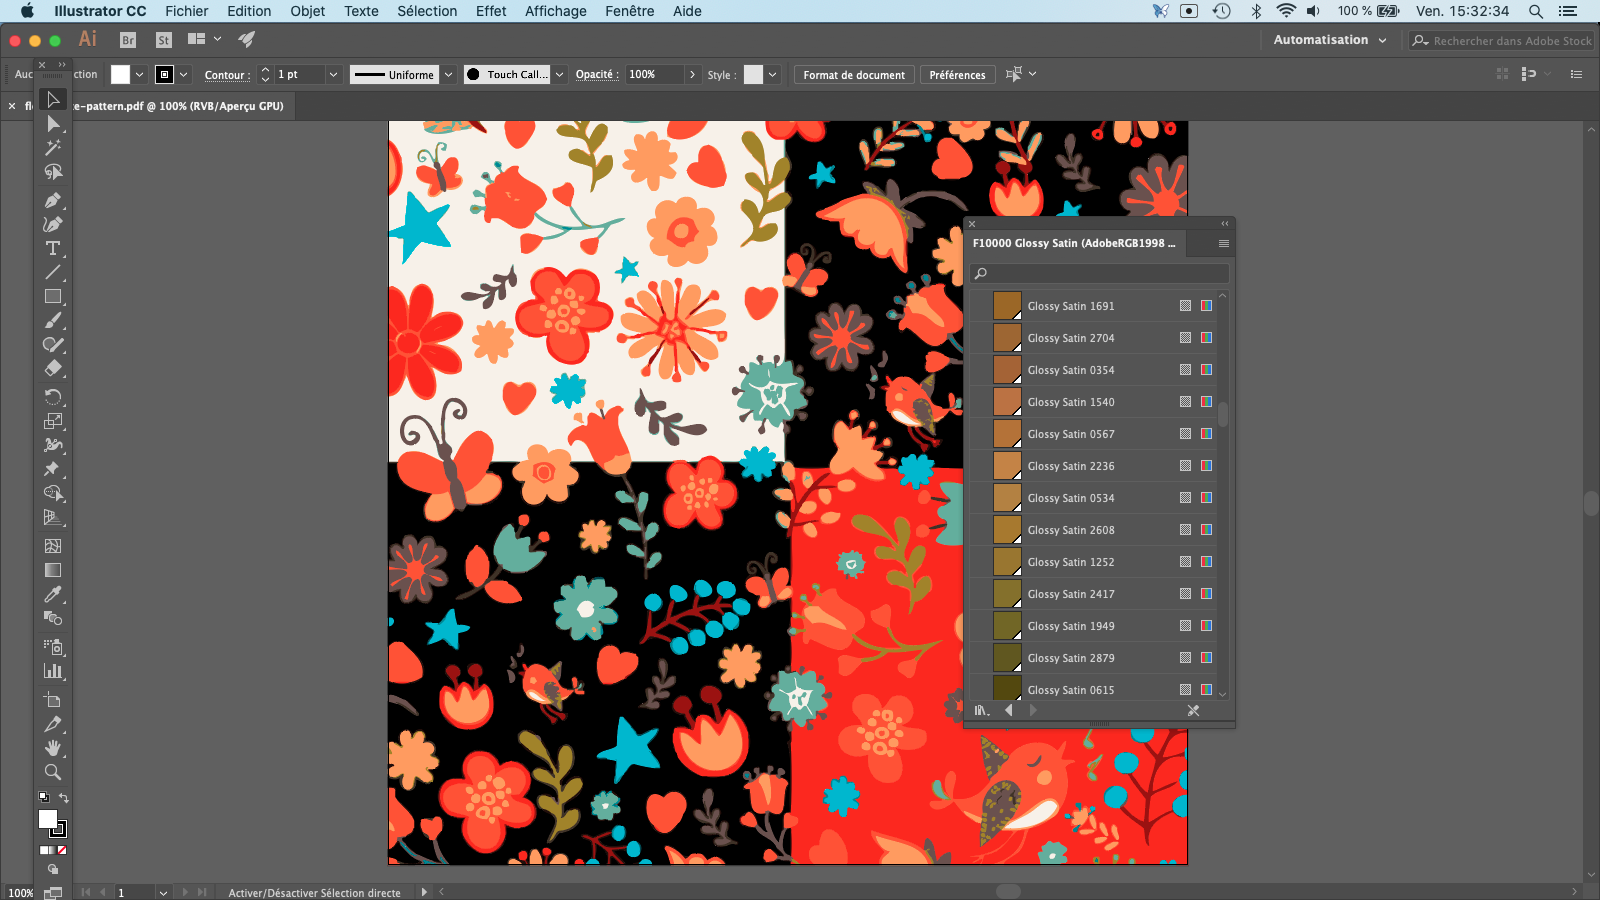
The table colors appear in the list.
4) Verification of the conformity between the color of the color chart and its RGB value in Illustrator...
Make sure that the RGB value of the color chart is consistent with the RGB value offered by Coraye.
To do this, display the RGB values of the color (Glossy Satin 0477) in the color picker and compare it with the values proposed by Coraye.
The small difference between the values proposed in Illustrator and Coraye are due to rounding during conversions with icc profiles. (Ex: Coraye R=180, G=204, B=0 & Illustrator R=179, G=203, B=0)
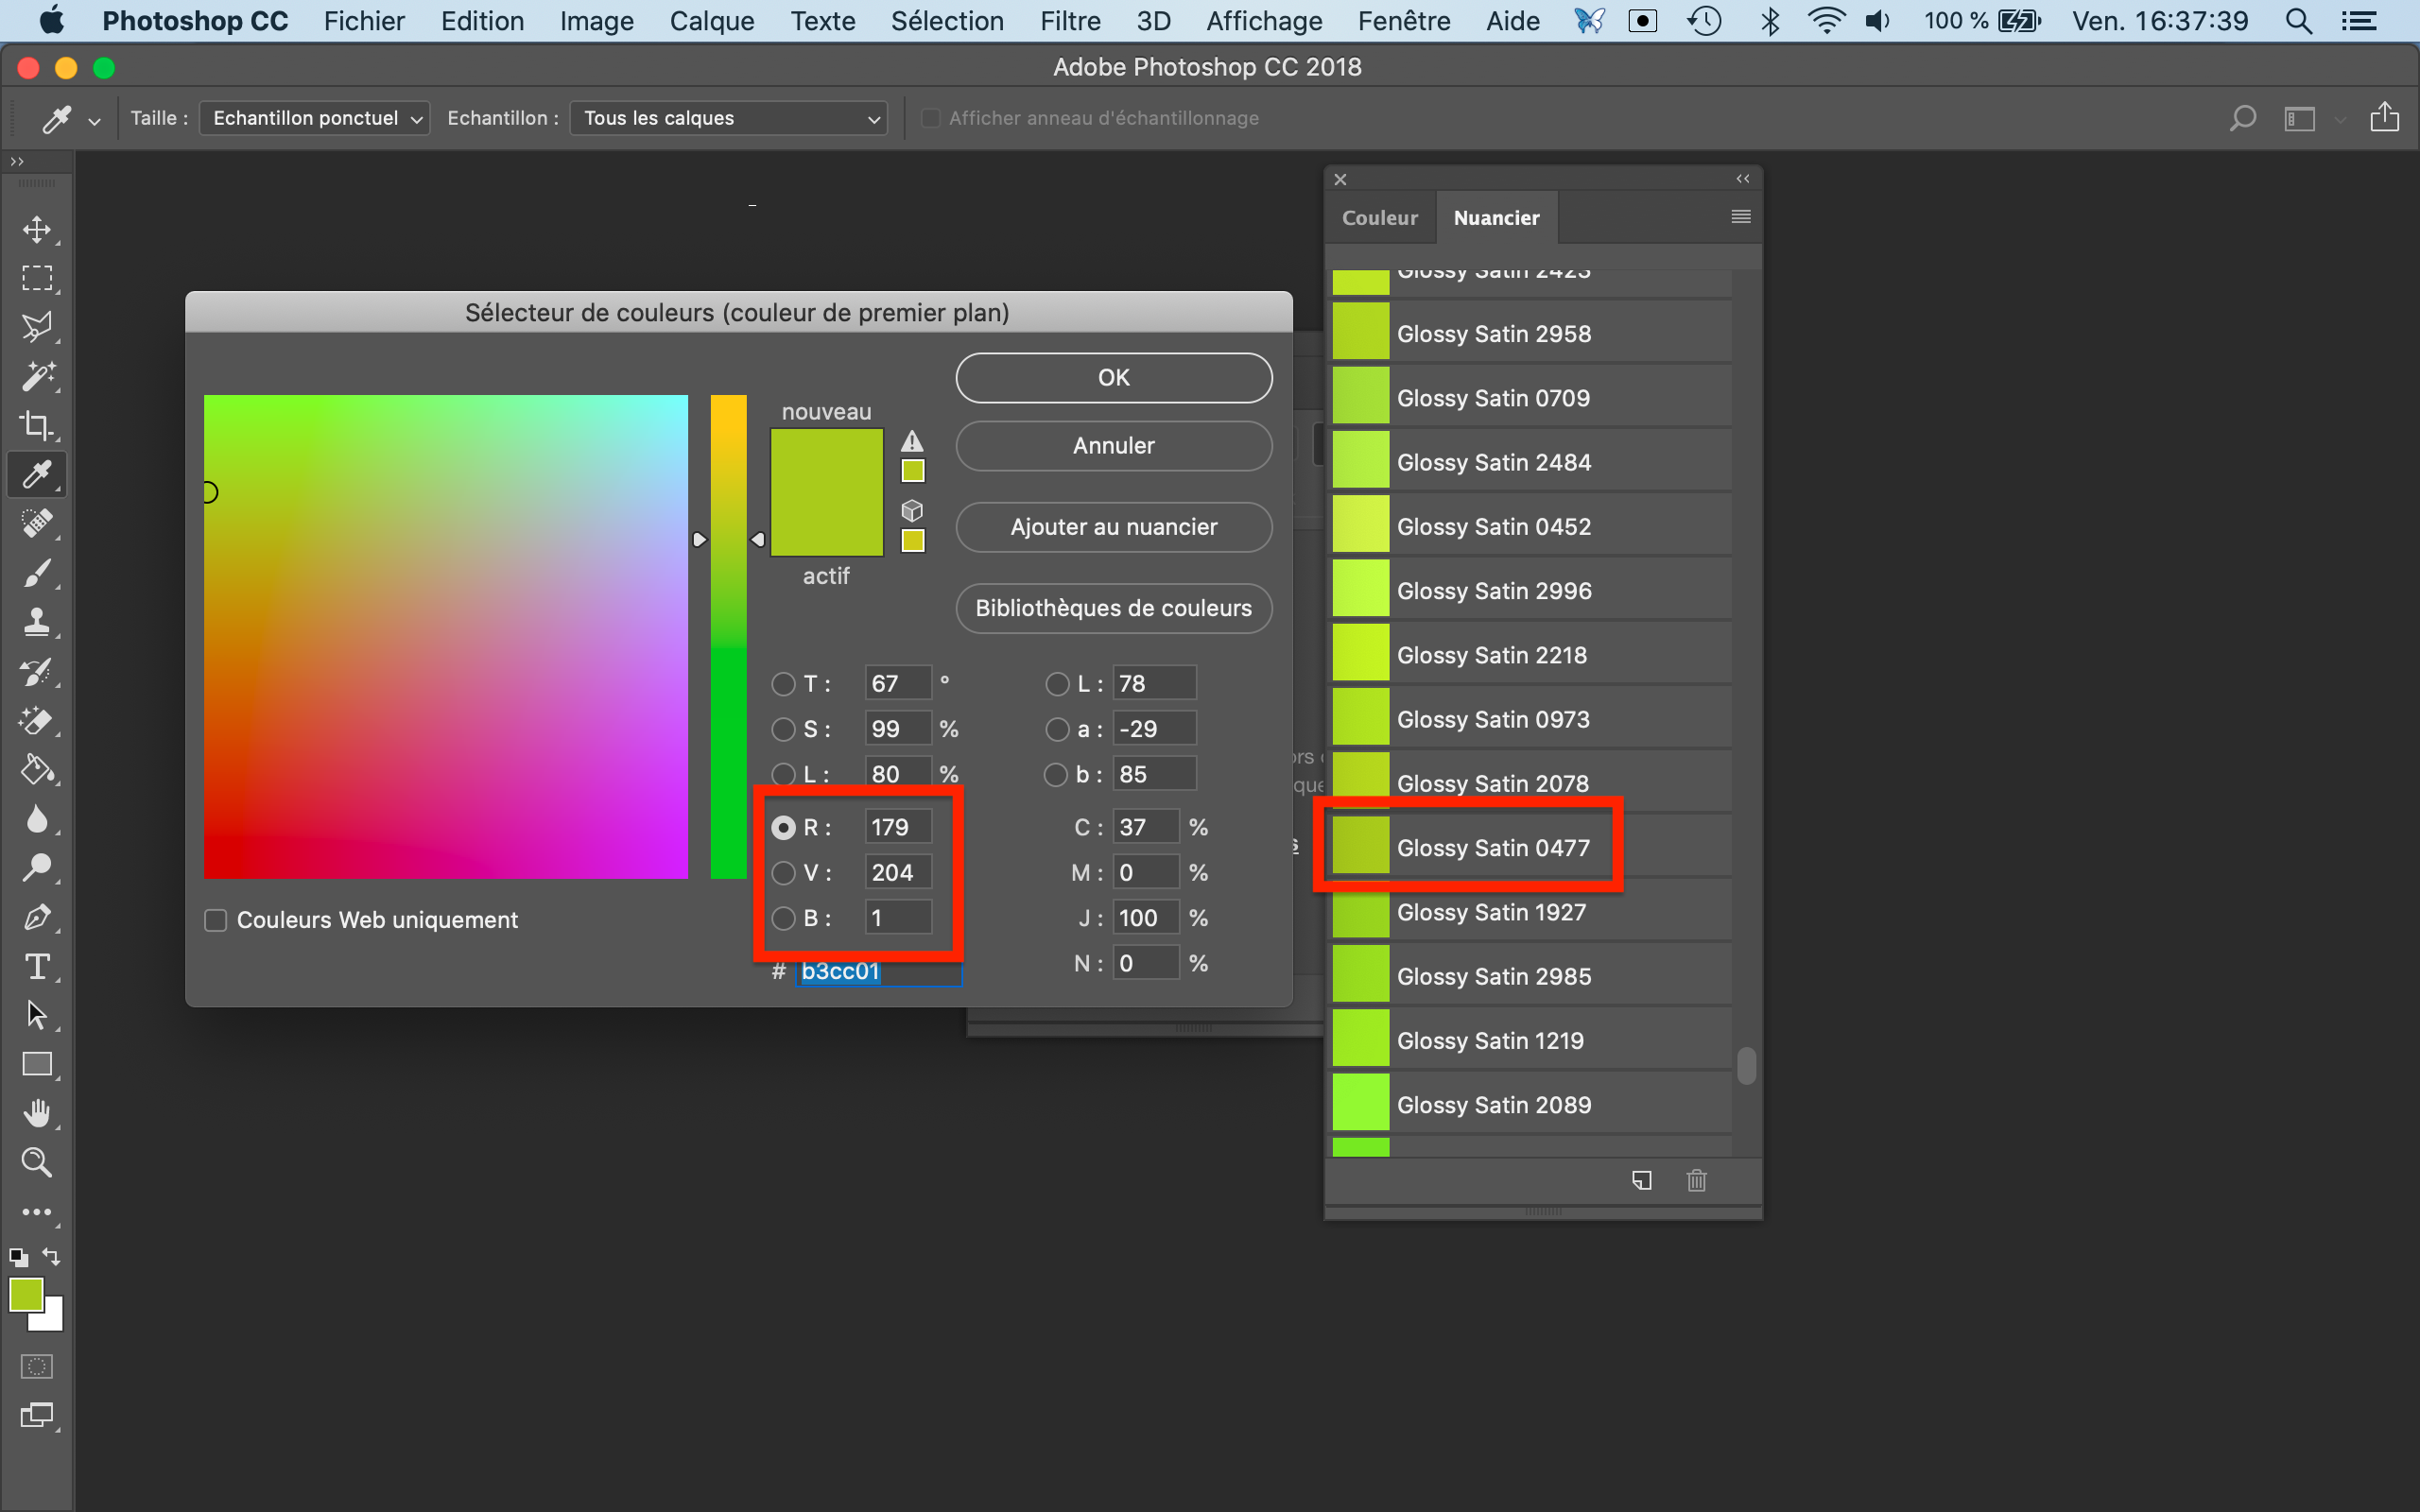
... and Photoshop
Same manipulations, same menus for Photoshop.
On-screen color simulation (Soft Proofing)
Photoshop and Illustrator offer a very interesting feature that can effectively simulate colors on the screen.
You will find this feature in the menu: View > Proof Format > Customize...
But for this to be effective, there are a few rules to follow:
- Use a graphic screen (Mac screen and office automation screen to be banned)
- Use a simulation profile (and not the media profile)
- Calibrate the screen with a probe or a spectrophotometer (Your I1 Pro or Myiro spectrophotometer will do just fine)
- Take inspiration from the ISO 12646 standard for viewing conditions...
1) Creation of the simulation profile
Necessary Coraye modules:
-RGB Profiler
This step begins after the rod measurement.
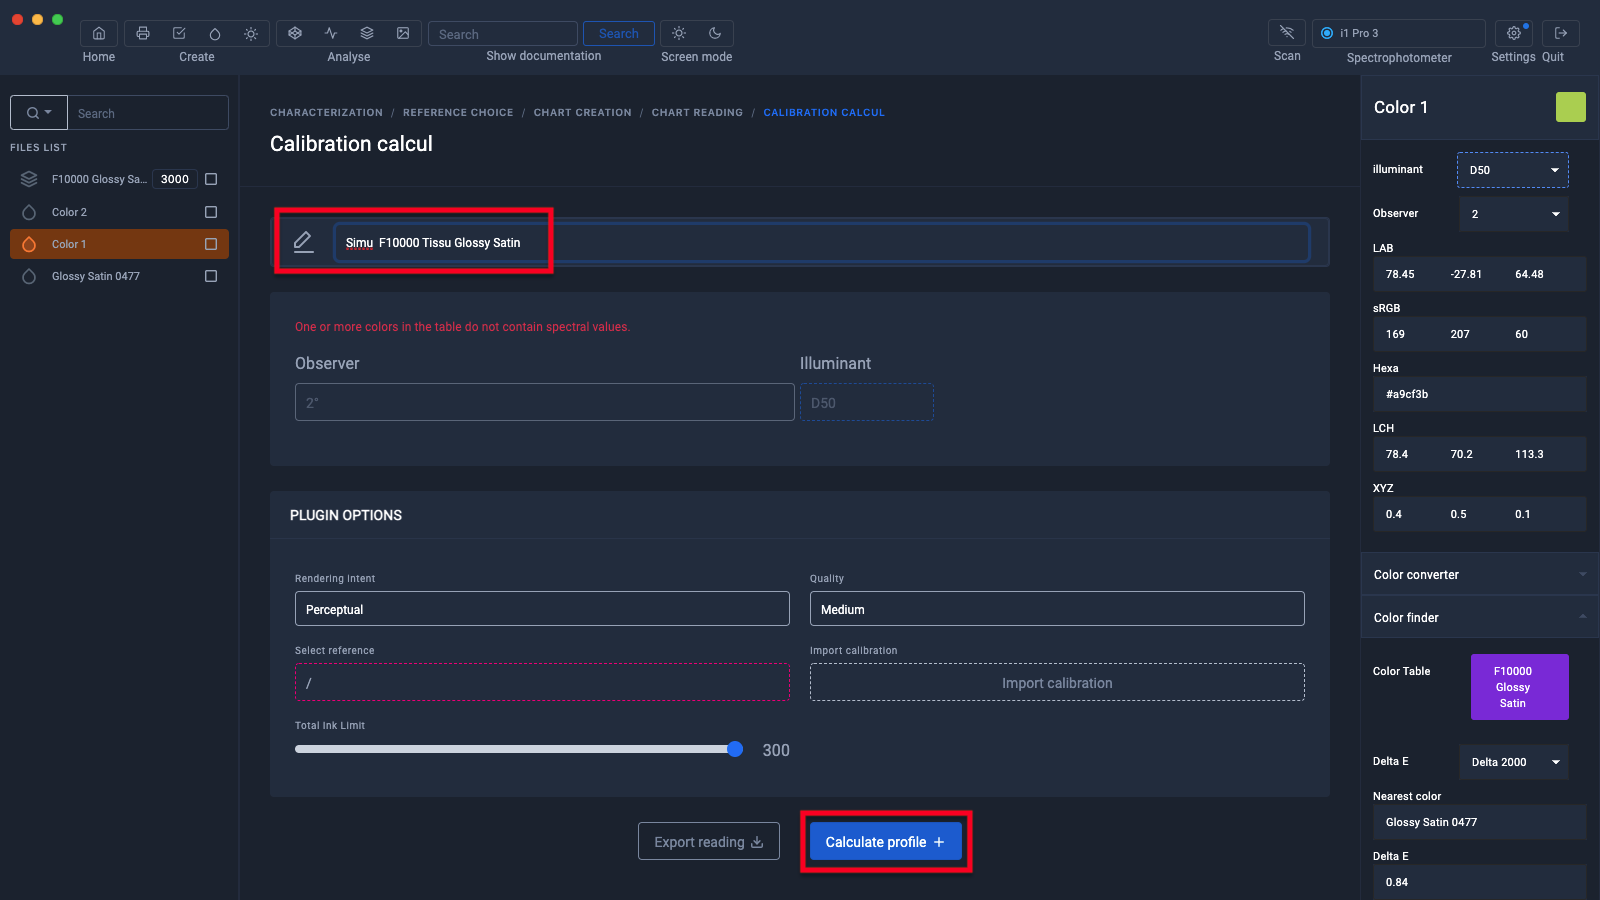
When you have saved the measurement results, you can continue the procedure to create the RGB profile by clicking on the "Reading done" button.
Since the pattern was printed under normal printing conditions, the icc profile that we are going to create will simulate the colors you will obtain if you print your patterns under the same conditions.
Give your profile a name (ex: Simu F10000 Glossy Satin Fabric), then click on the "Calculate profile" button to start creating the icc profile.
Display of the calculation in progress...
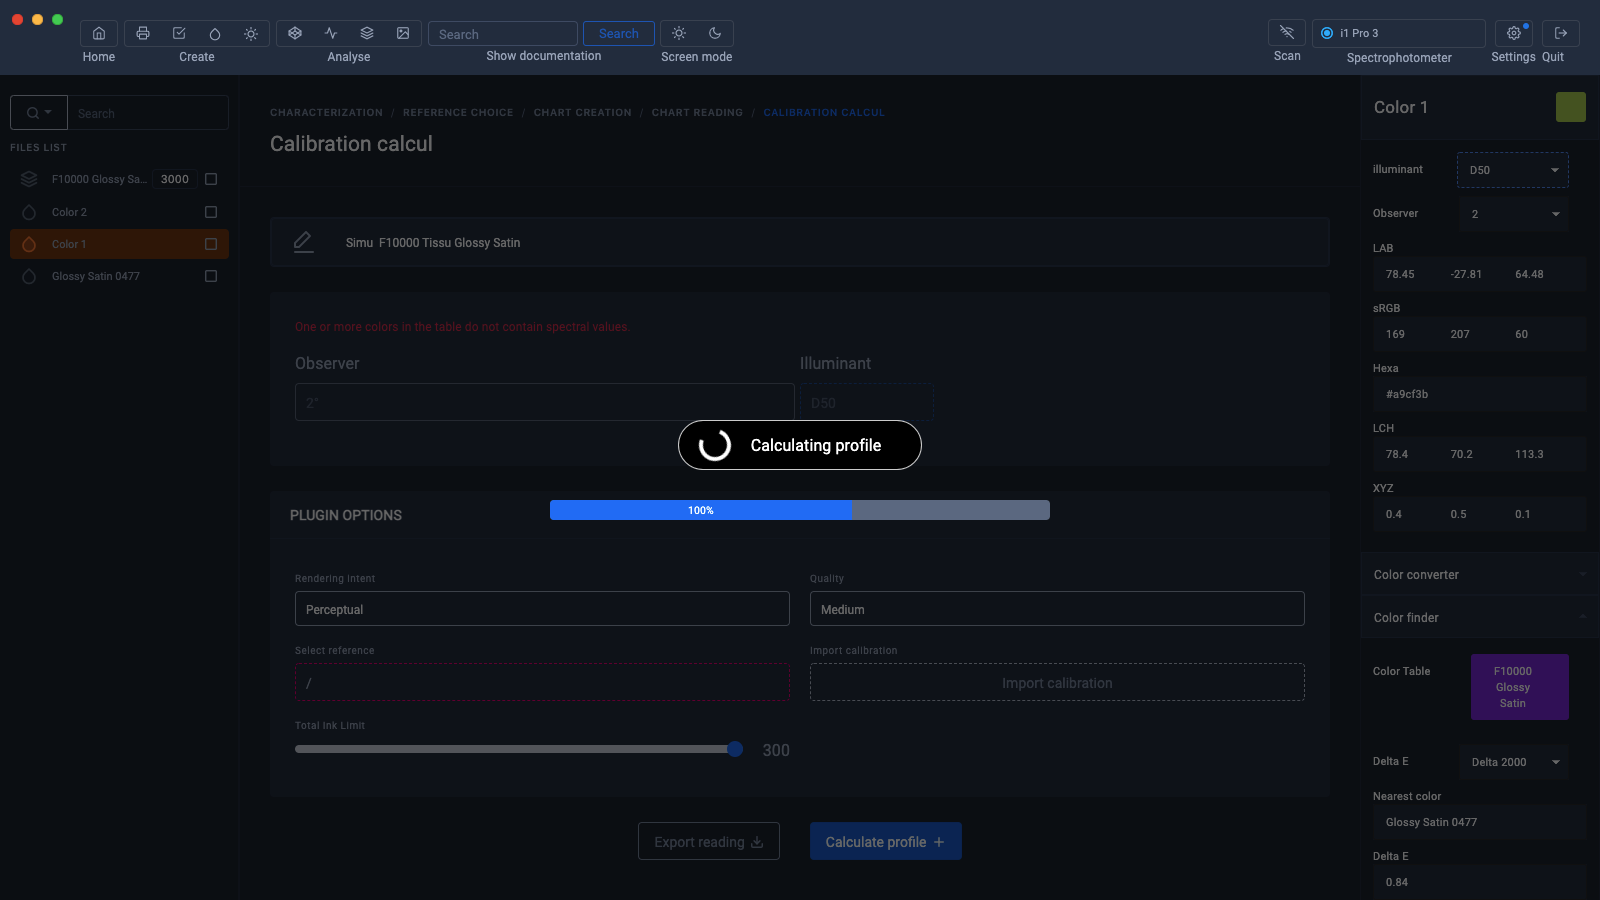
When the calculation is finished, the profile appears in the left column
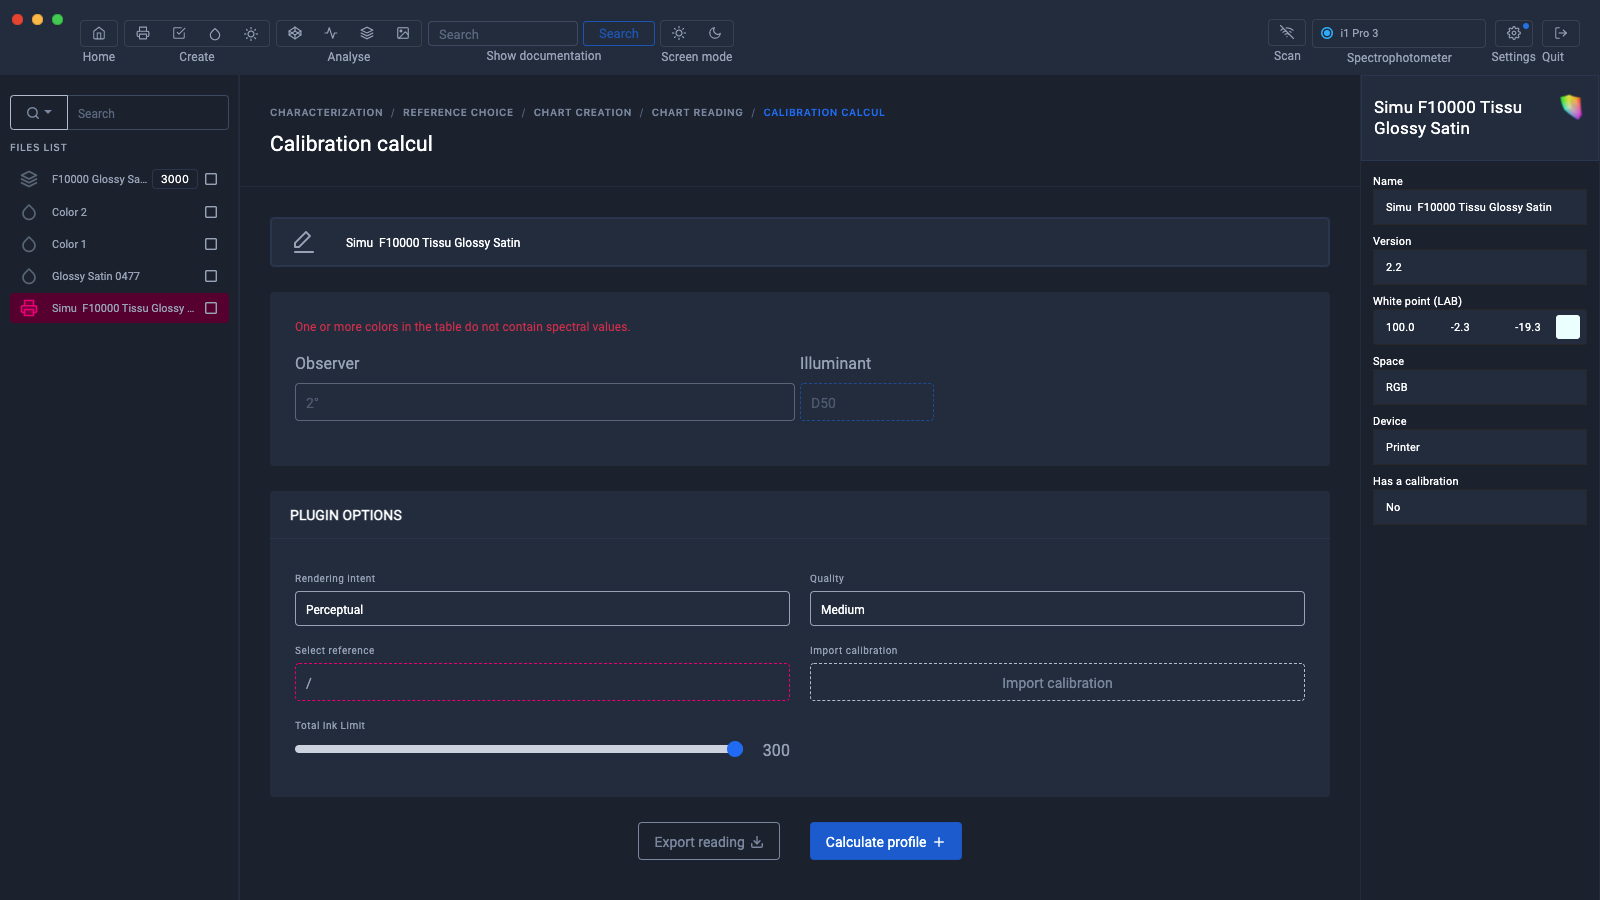
Export the icc profile to install it in your operating system.
2) Location of ICC profiles in your computers
Depending on the operating system, your simulation profile must be copied to the following directories:
Mac OS X
- Library > ColorSync > Profiles
- “User” > Library > ColorSync > Profiles
Windows
- Windows > System32 > Spool > Drivers > Color
3) Choice of screen
For the choice of screen, I recommend a graphic screen such as Eizo screens from the ColorEdge CS or CG range
These screens have the particularity of having a matte panel, of reproducing the colors of the AdobeRGB1998 space (except the CS2410 which is limited to sRGB) and many other qualities that I will let you discover on the Eizo site.

4) Management of color simulation in Illustrator on your graphics screen
Whether in Photoshop or Illustrator, the menu is the same:
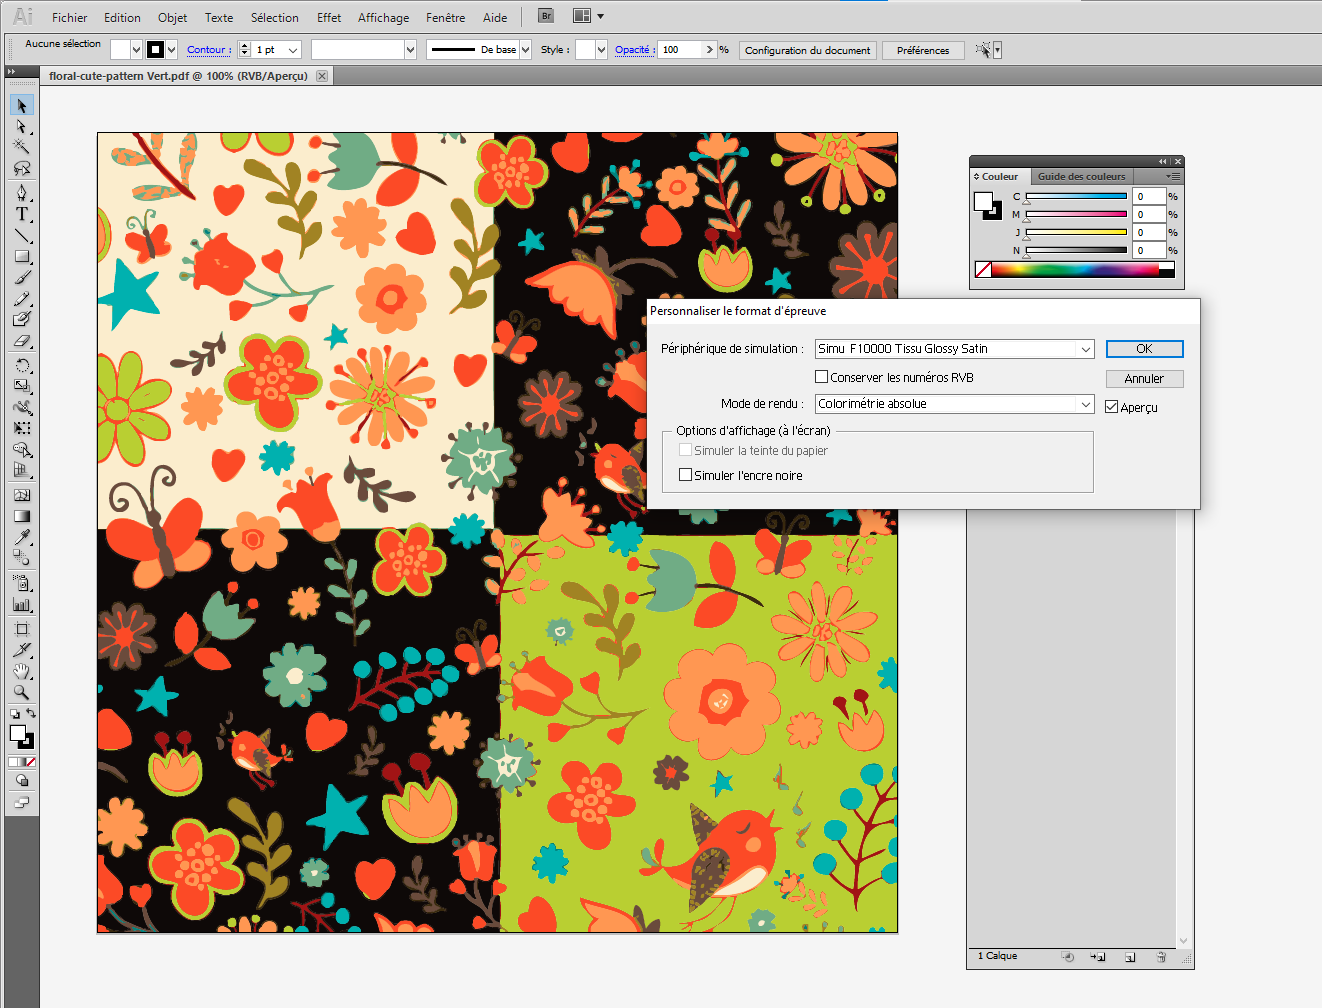
View > Proof Format > Customize...
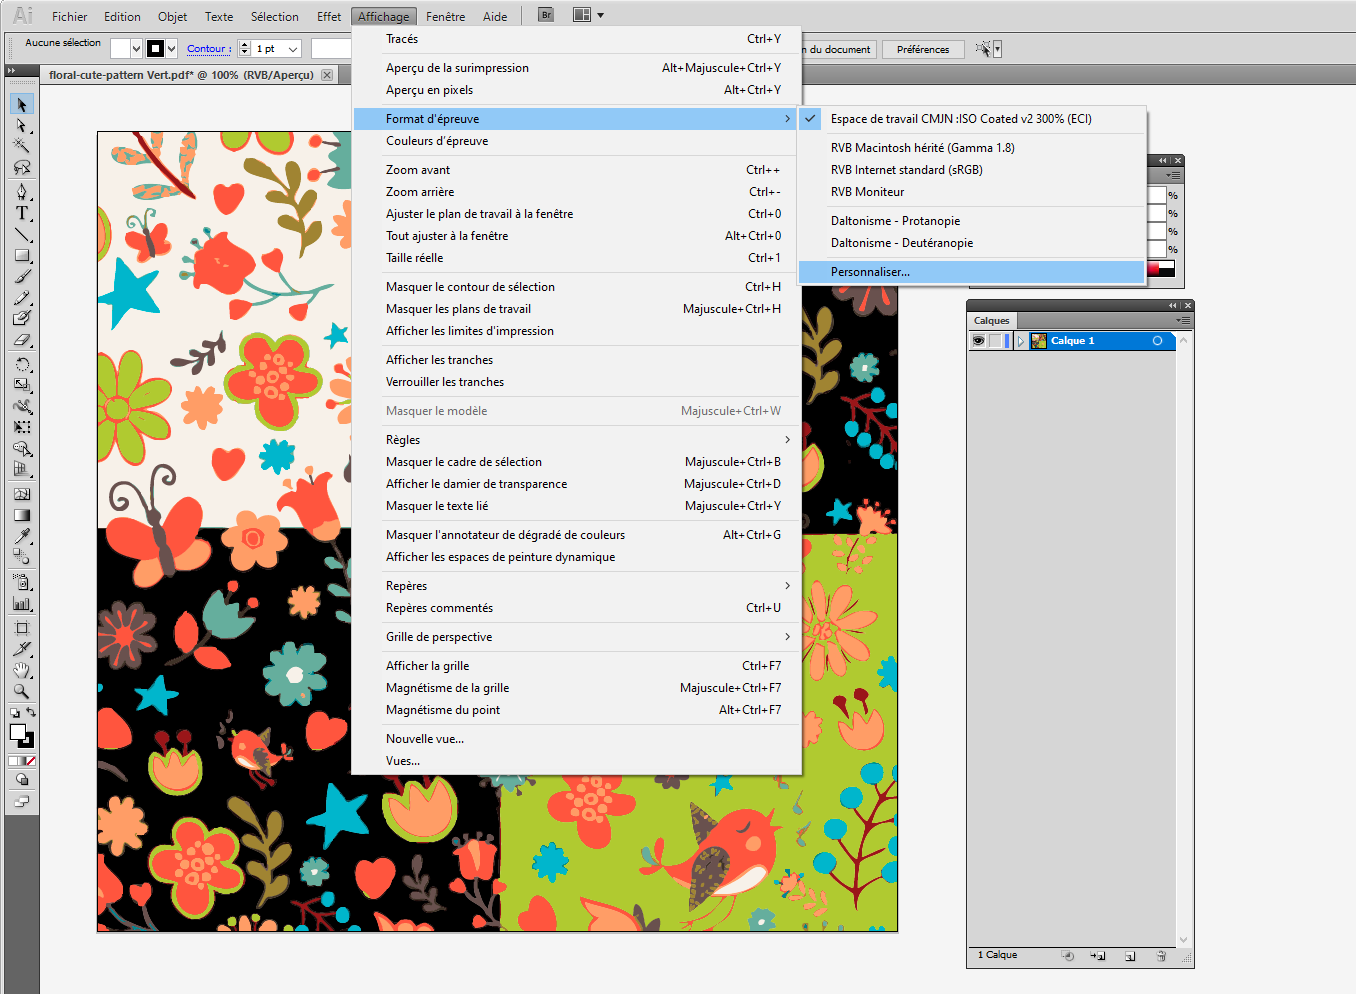
In the "Customize the proof format" window, select the profile you have just created (Simu F10000 Glossy Satin Fabric), use the rendering mode: Absolute colorimetry to simulate the color of the fabric.
In our example we can see that the fabric was "off white"
You can use "cmd + Y" or "Ctrl + Y" keyboard commands to turn the simulation on or off.
Create a printable color chart
Since a screen cannot simulate the rendering of the material, Coraye also allows you to create a printable color chart
The advantage of printing the color chart is to better appreciate the color rendering on the material directly.
The printed color chart is an excellent catalog of colors that you could offer to designers and your most loyal customers.

Coraye module required:
- Color Table
In this example we will use the original 3000 patch color table (F10000 Glossy Satin).
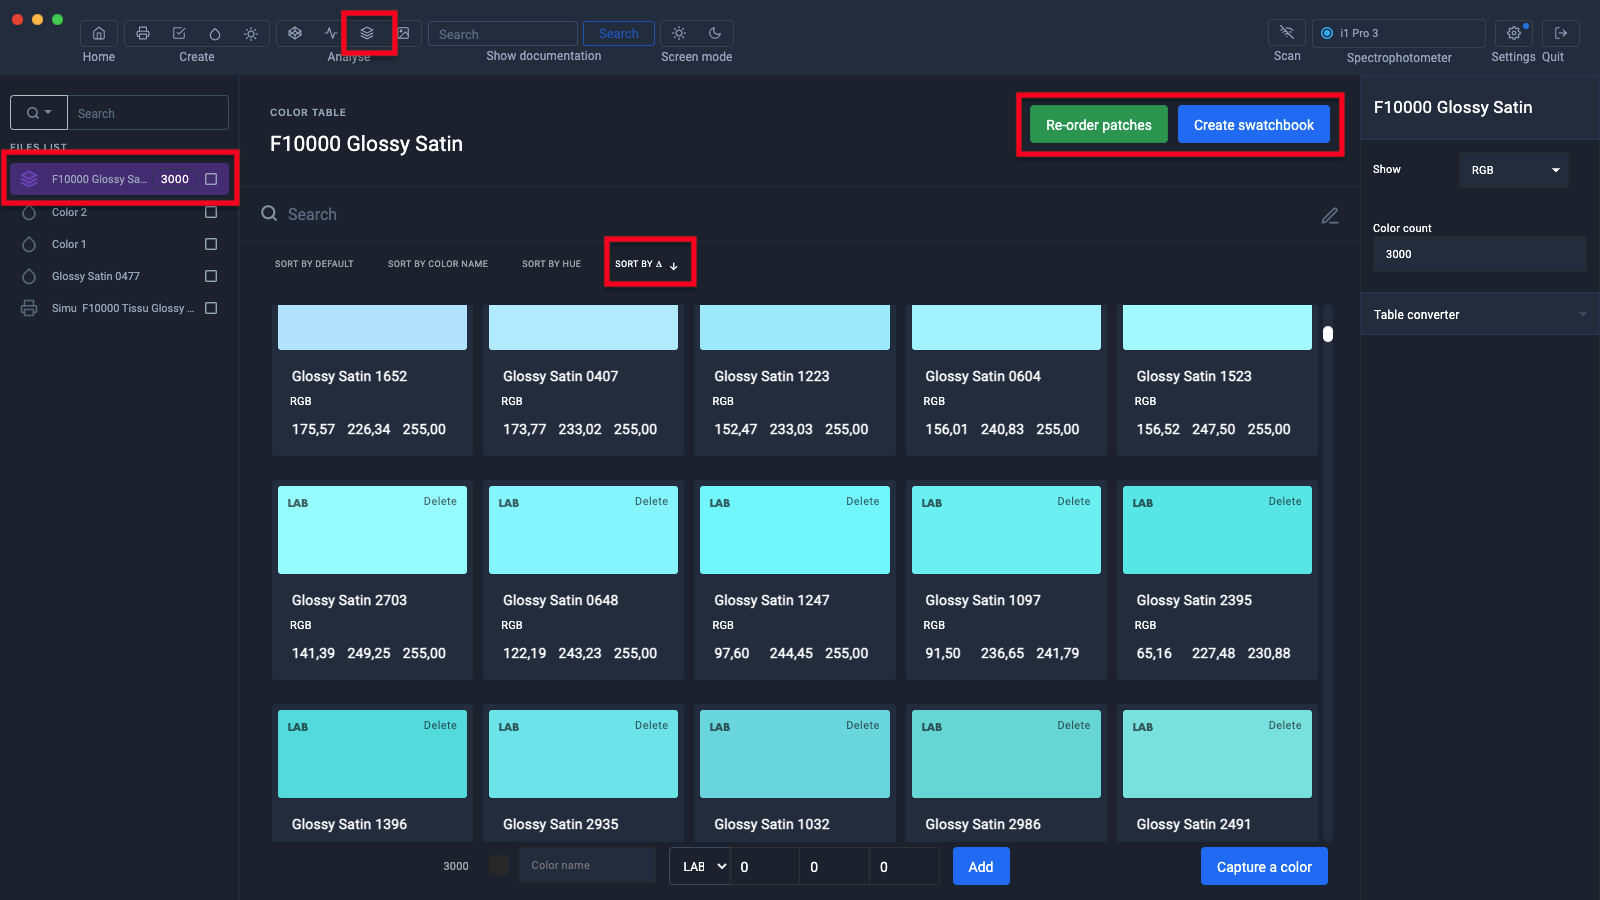
First step: We will sort the colors of the tables
To do this you must go to the "Color table" menu, select the table (F10000 Glossy Satin), then click on "Sort by ∆"
To validate the new patch organization, click on the "Re-order patches" button.
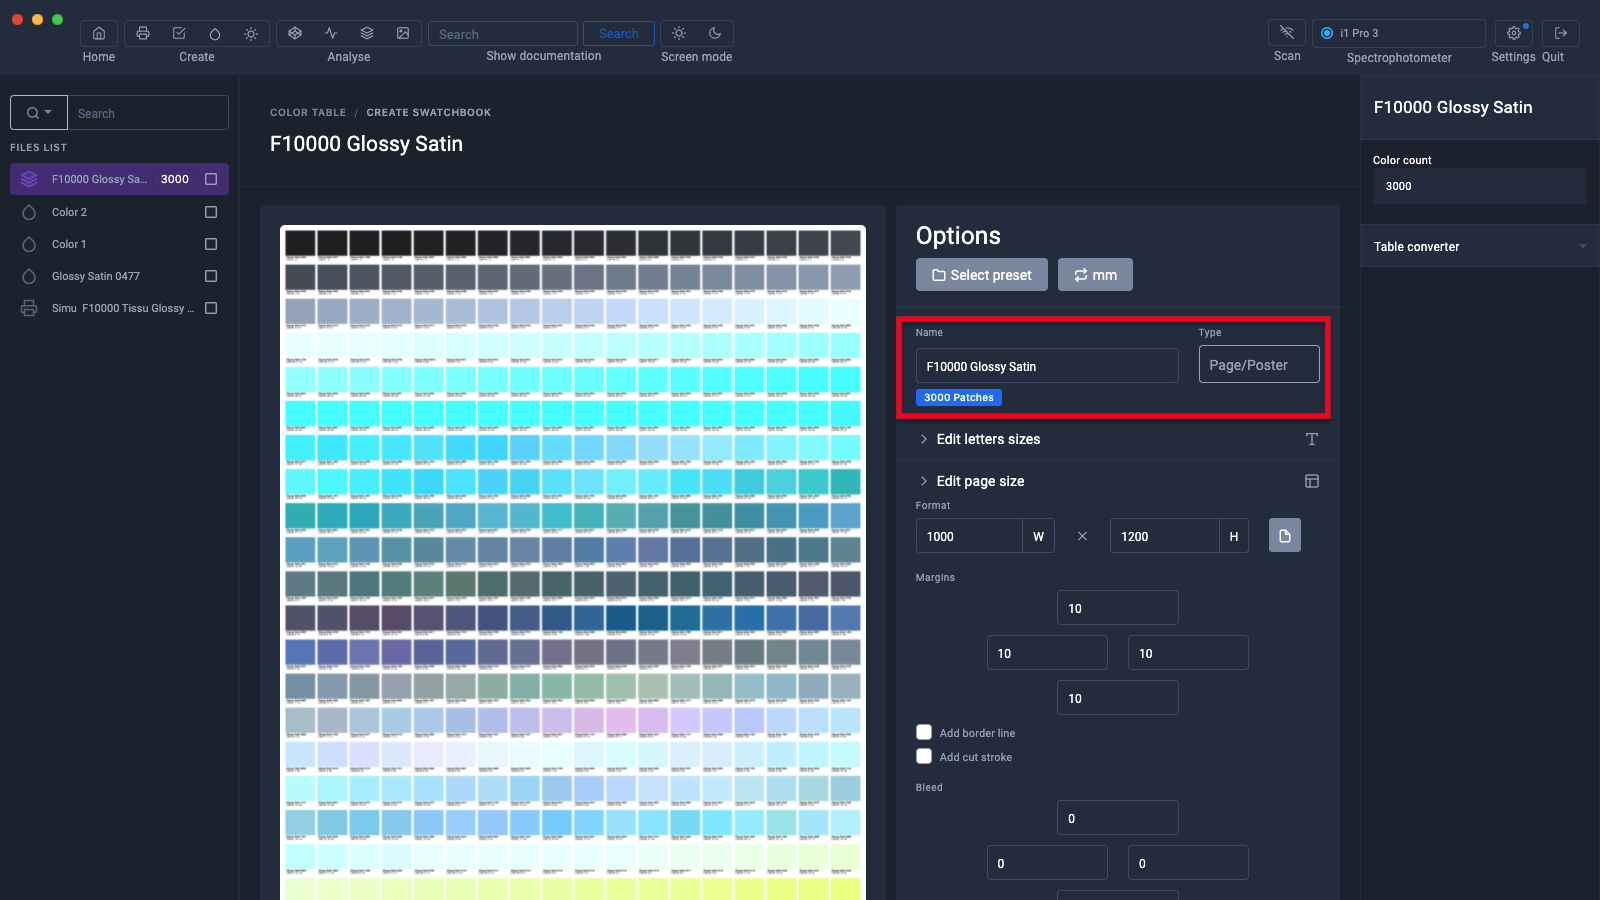
Second step: We will prepare the printable version of the color chart
Personalization:
To learn more, see our tutorials:
- Create a printable color chart
- Creation of a printable color chart in RGB mode
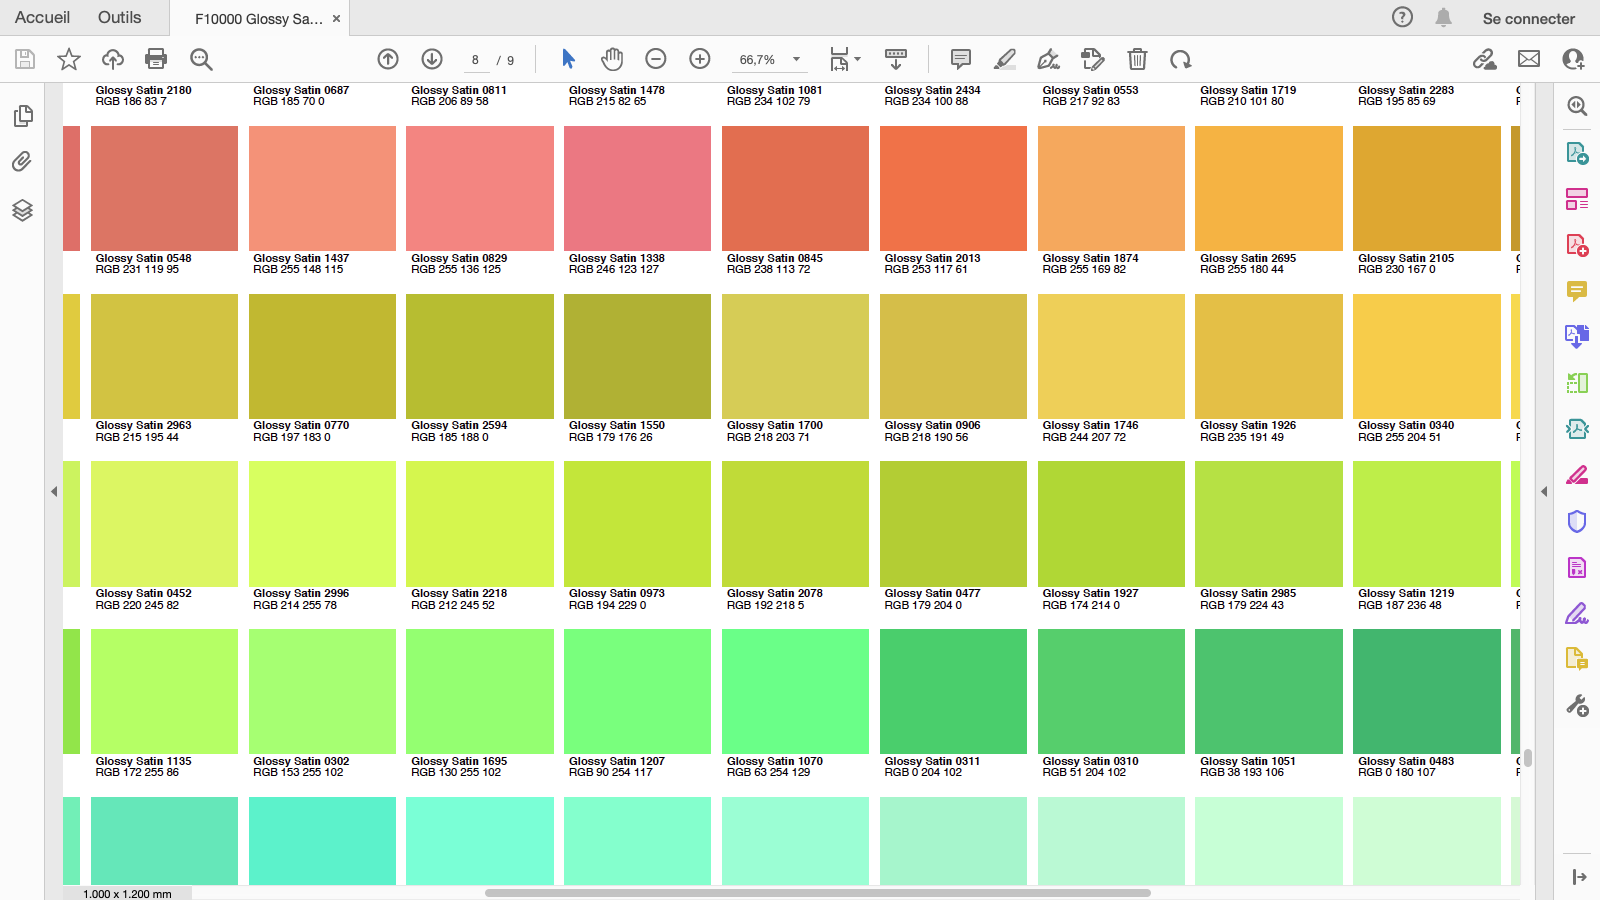
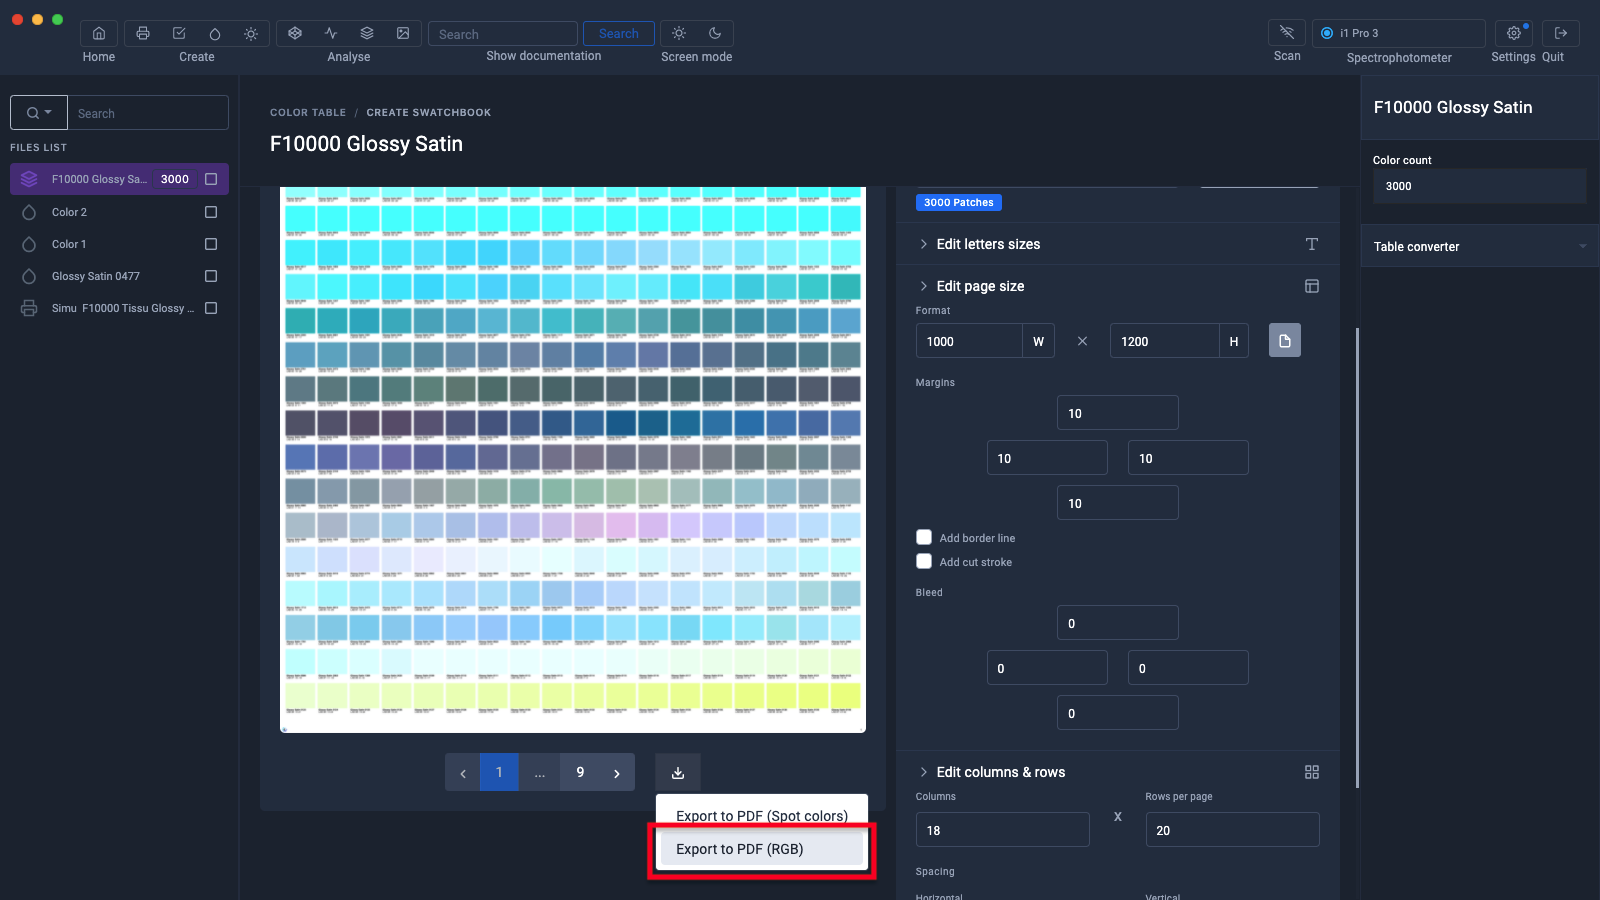
Export your color chart in pdf format
- If the color table contains RGB values you can export a pdf in RGB mode.
- If it contains CMYK values, you will be able to export a pdf in CMYK mode
- If you export the pdf in "Spot Color" mode, it will only contain spot colors which must be defined in your RIP to be printed correctly.
The pdf thus created will display the name of each of the colors as well as its RGB, CMYK or Lab value depending on the color space used.
All you have to do is print this pdf to get your color charts printed.