Capturing a color
Capturing a color with Coraye is very easy.
But what can we do next with our measured color samples?
How to capture the colors.
Start by connecting your spectrophotometer.
Spectrophotometer supported by Coraye's "Color Capture" module:
- XRite I1 Pro 3 & I1 Pro 3 PLUS
- XRite I1 Pro 2
- XRite I1 Pro & I1 Pro UV
- EFI ES1000
- EFI ES2000
- EFI ES3000
- Konica Minolta MYIRO
- Konica Minolta CM26d et CM25
- Barbieri LFP qb Sensing Unit
Then click on the “ Create Color ” icon located in the menu at the top left of the software.

A window is displayed allowing you to define the reading conditions.
These parameters are dependent on the reading instrument you are going to use.
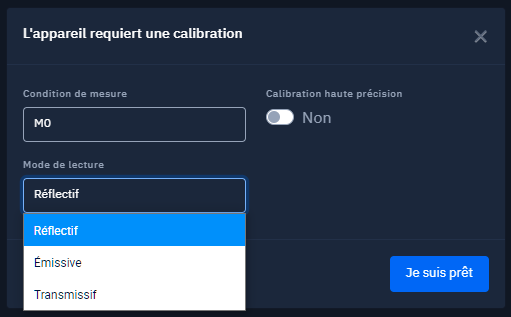
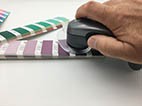
Use Reflective mode to measure on paper or material
Use Emissive mode to capture the spectral curve of a color on your screen or on backlit baklit
Use Transmissive mode to measure a color on your screen or backlit baklit.
If your spectrophotometer needs to be calibrated, Coraye will ask you to start the calibration procedure.
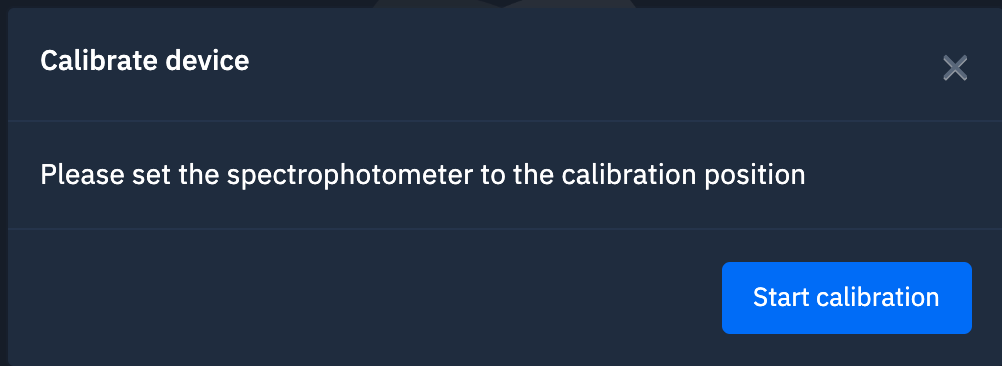
During calibration, you need to put your spectrophotometer in its calibration position.
|
Konica Minolta MYIRO |
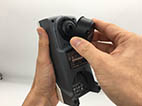 |
| XRite I1 Pro 3 |
|
| XRite I1 Pro 2 | 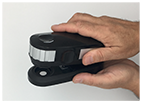
|
| XRite I1 Pro | 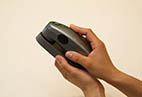 |
| Konica Minolta CM 26d | 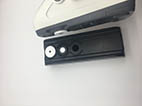 |
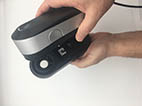
When the calibration is complete, you are ready to capture the colors.
| Konica Minolta MYIRO | 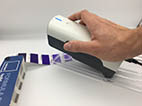 |
| XRite I1 Pro 3 | 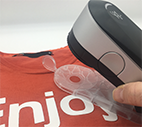 |
| XRite I1 Pro 2 | 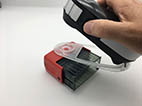
|
| XRite I1 Pro |
|
| Konica Minolta CM 26d | 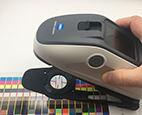 |
| Barbieri Sensing Unit LFP qb |
|
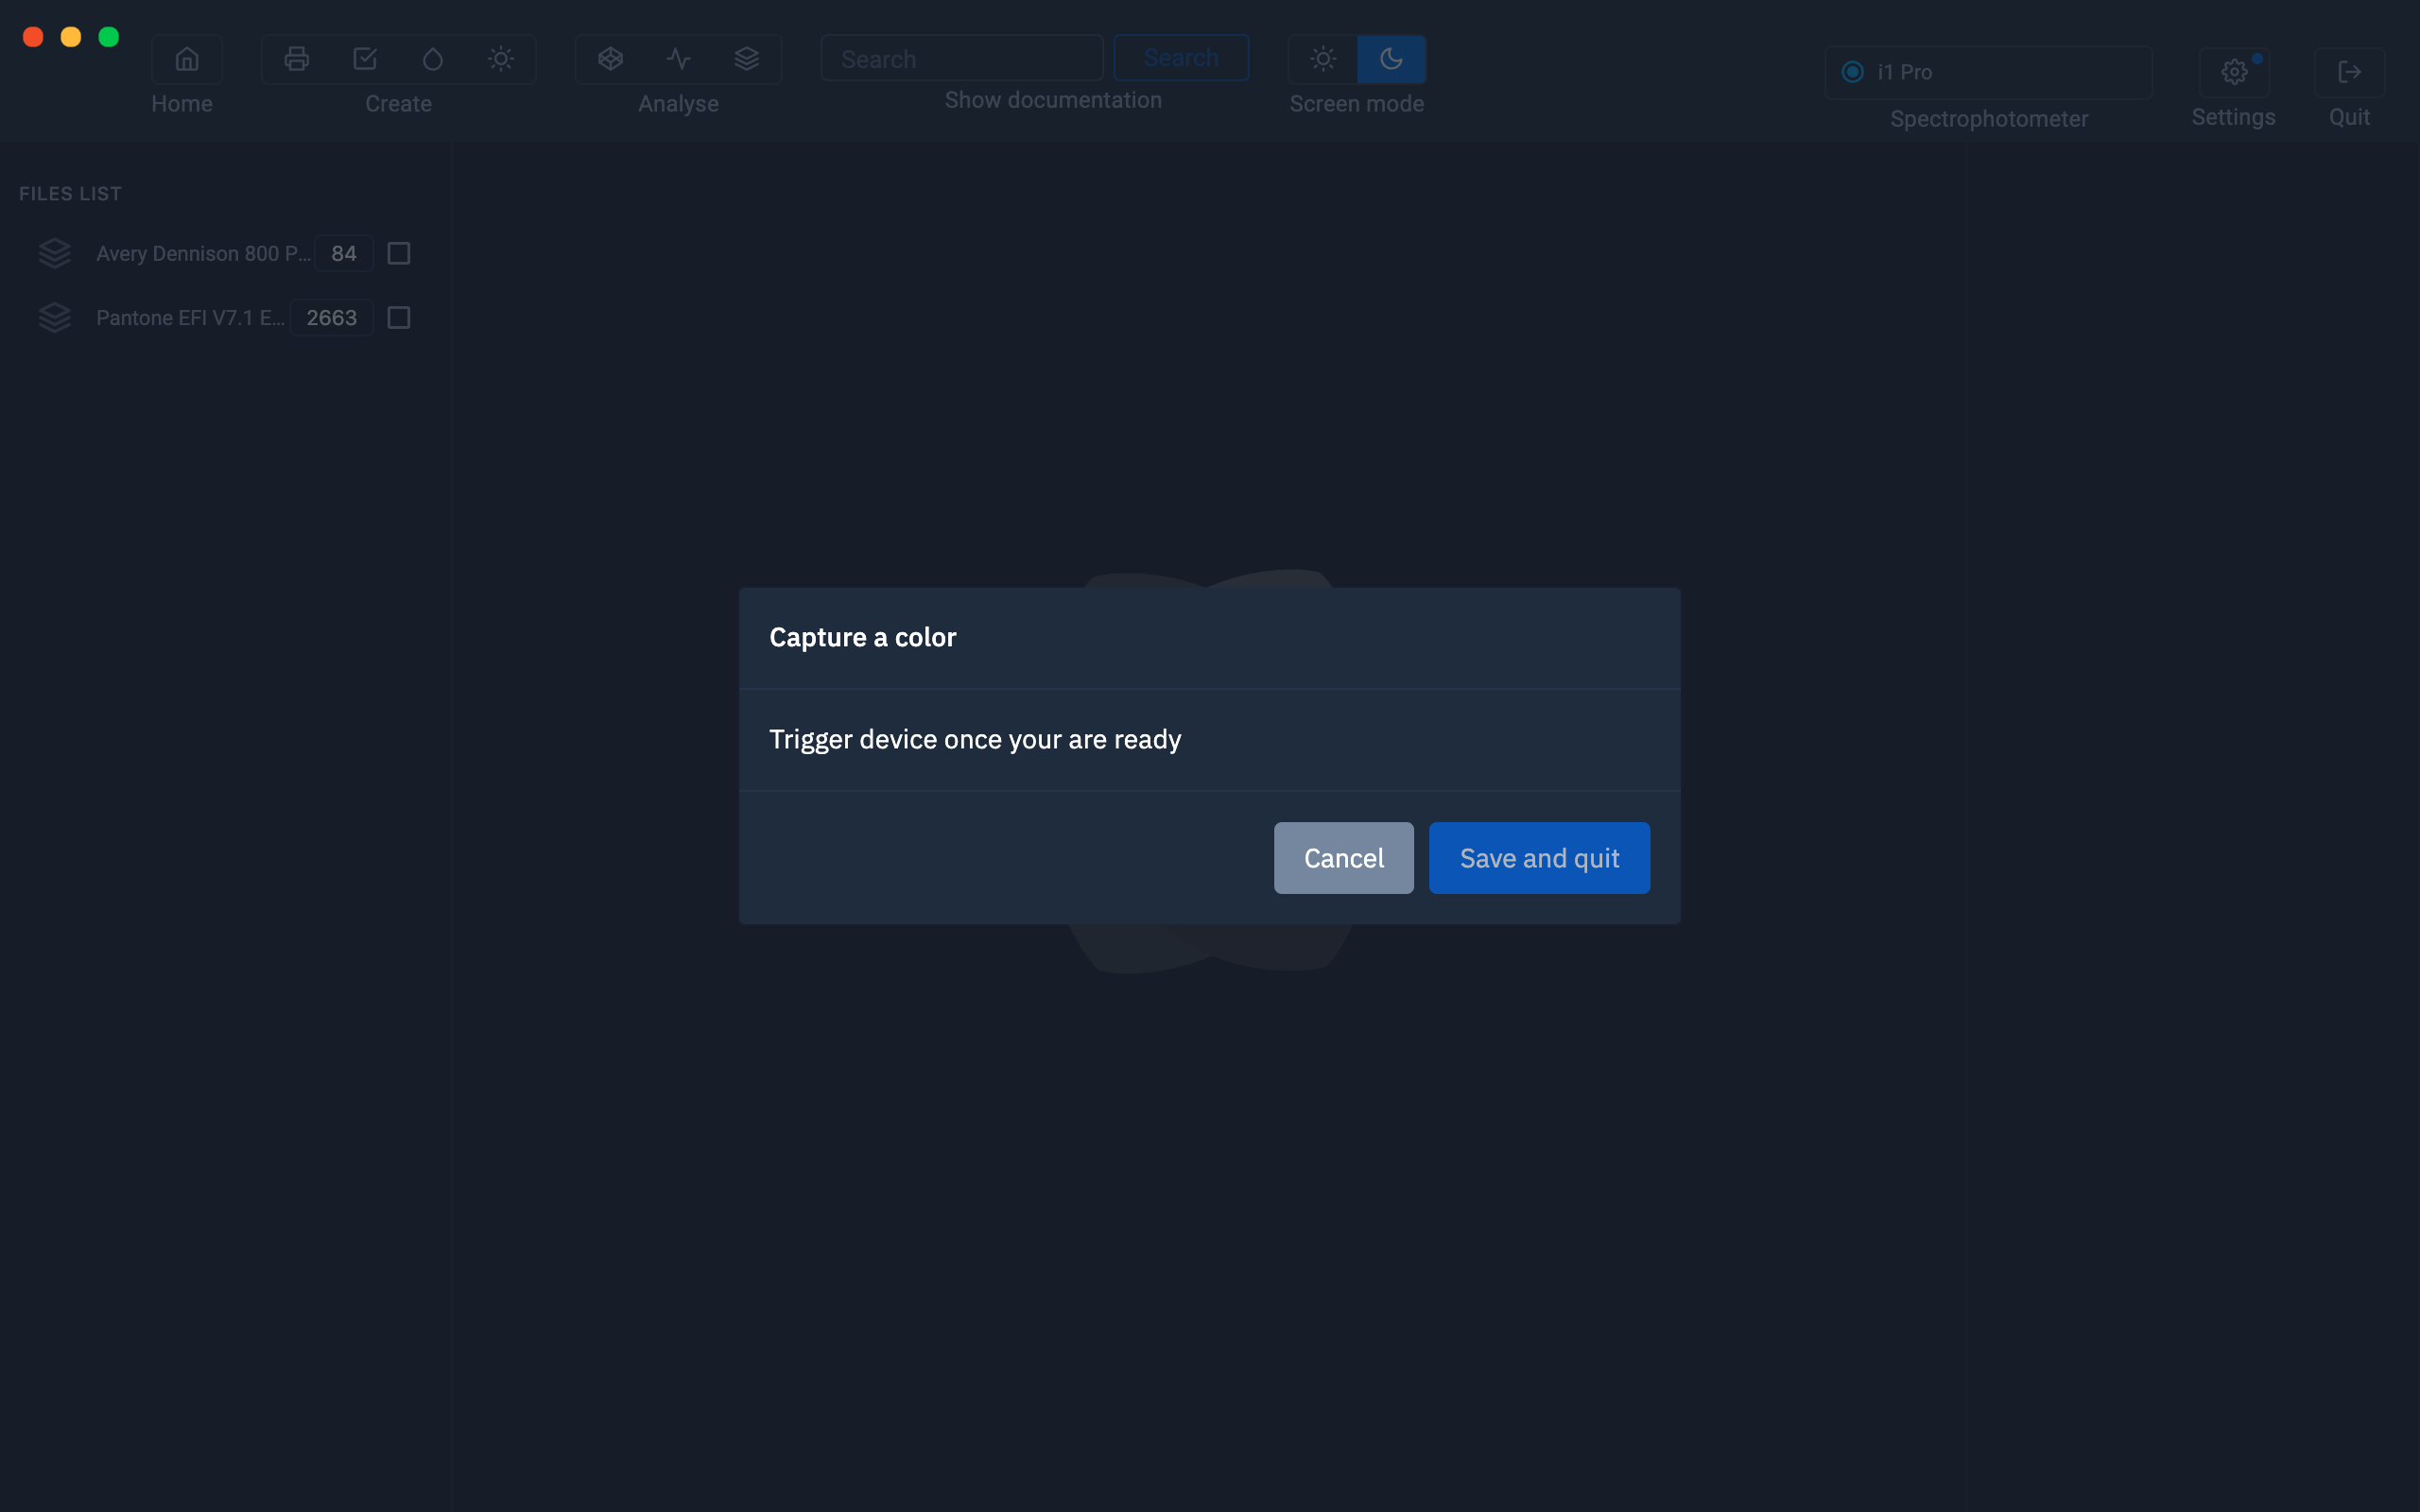
Successive measurements will be displayed one below the other.
The Lab values for each of the colors appear as they occur to help you make corrections between the actual colors of the objects (or materials) and the retouching of the images displayed on a graphic display.
At this step, you can rename the colors before saving them.

If you want to compare colors without needing to save them, you can select the reference color and you will get the values of ∆00, ∆94, ∆76, ∆H or ∆Ch
Remember that the ∆00, ∆94 and ∆76 define the distance between two colors, the ∆Ch only takes into account the saturation and the ∆H only takes into account the hue (Hue).
For more information see chapter: Delta E

When you have finished reading and renaming your colors, you can save them by clicking “ Save and Exit ”.

Now your colors are ready to be used. But what can I do after that?
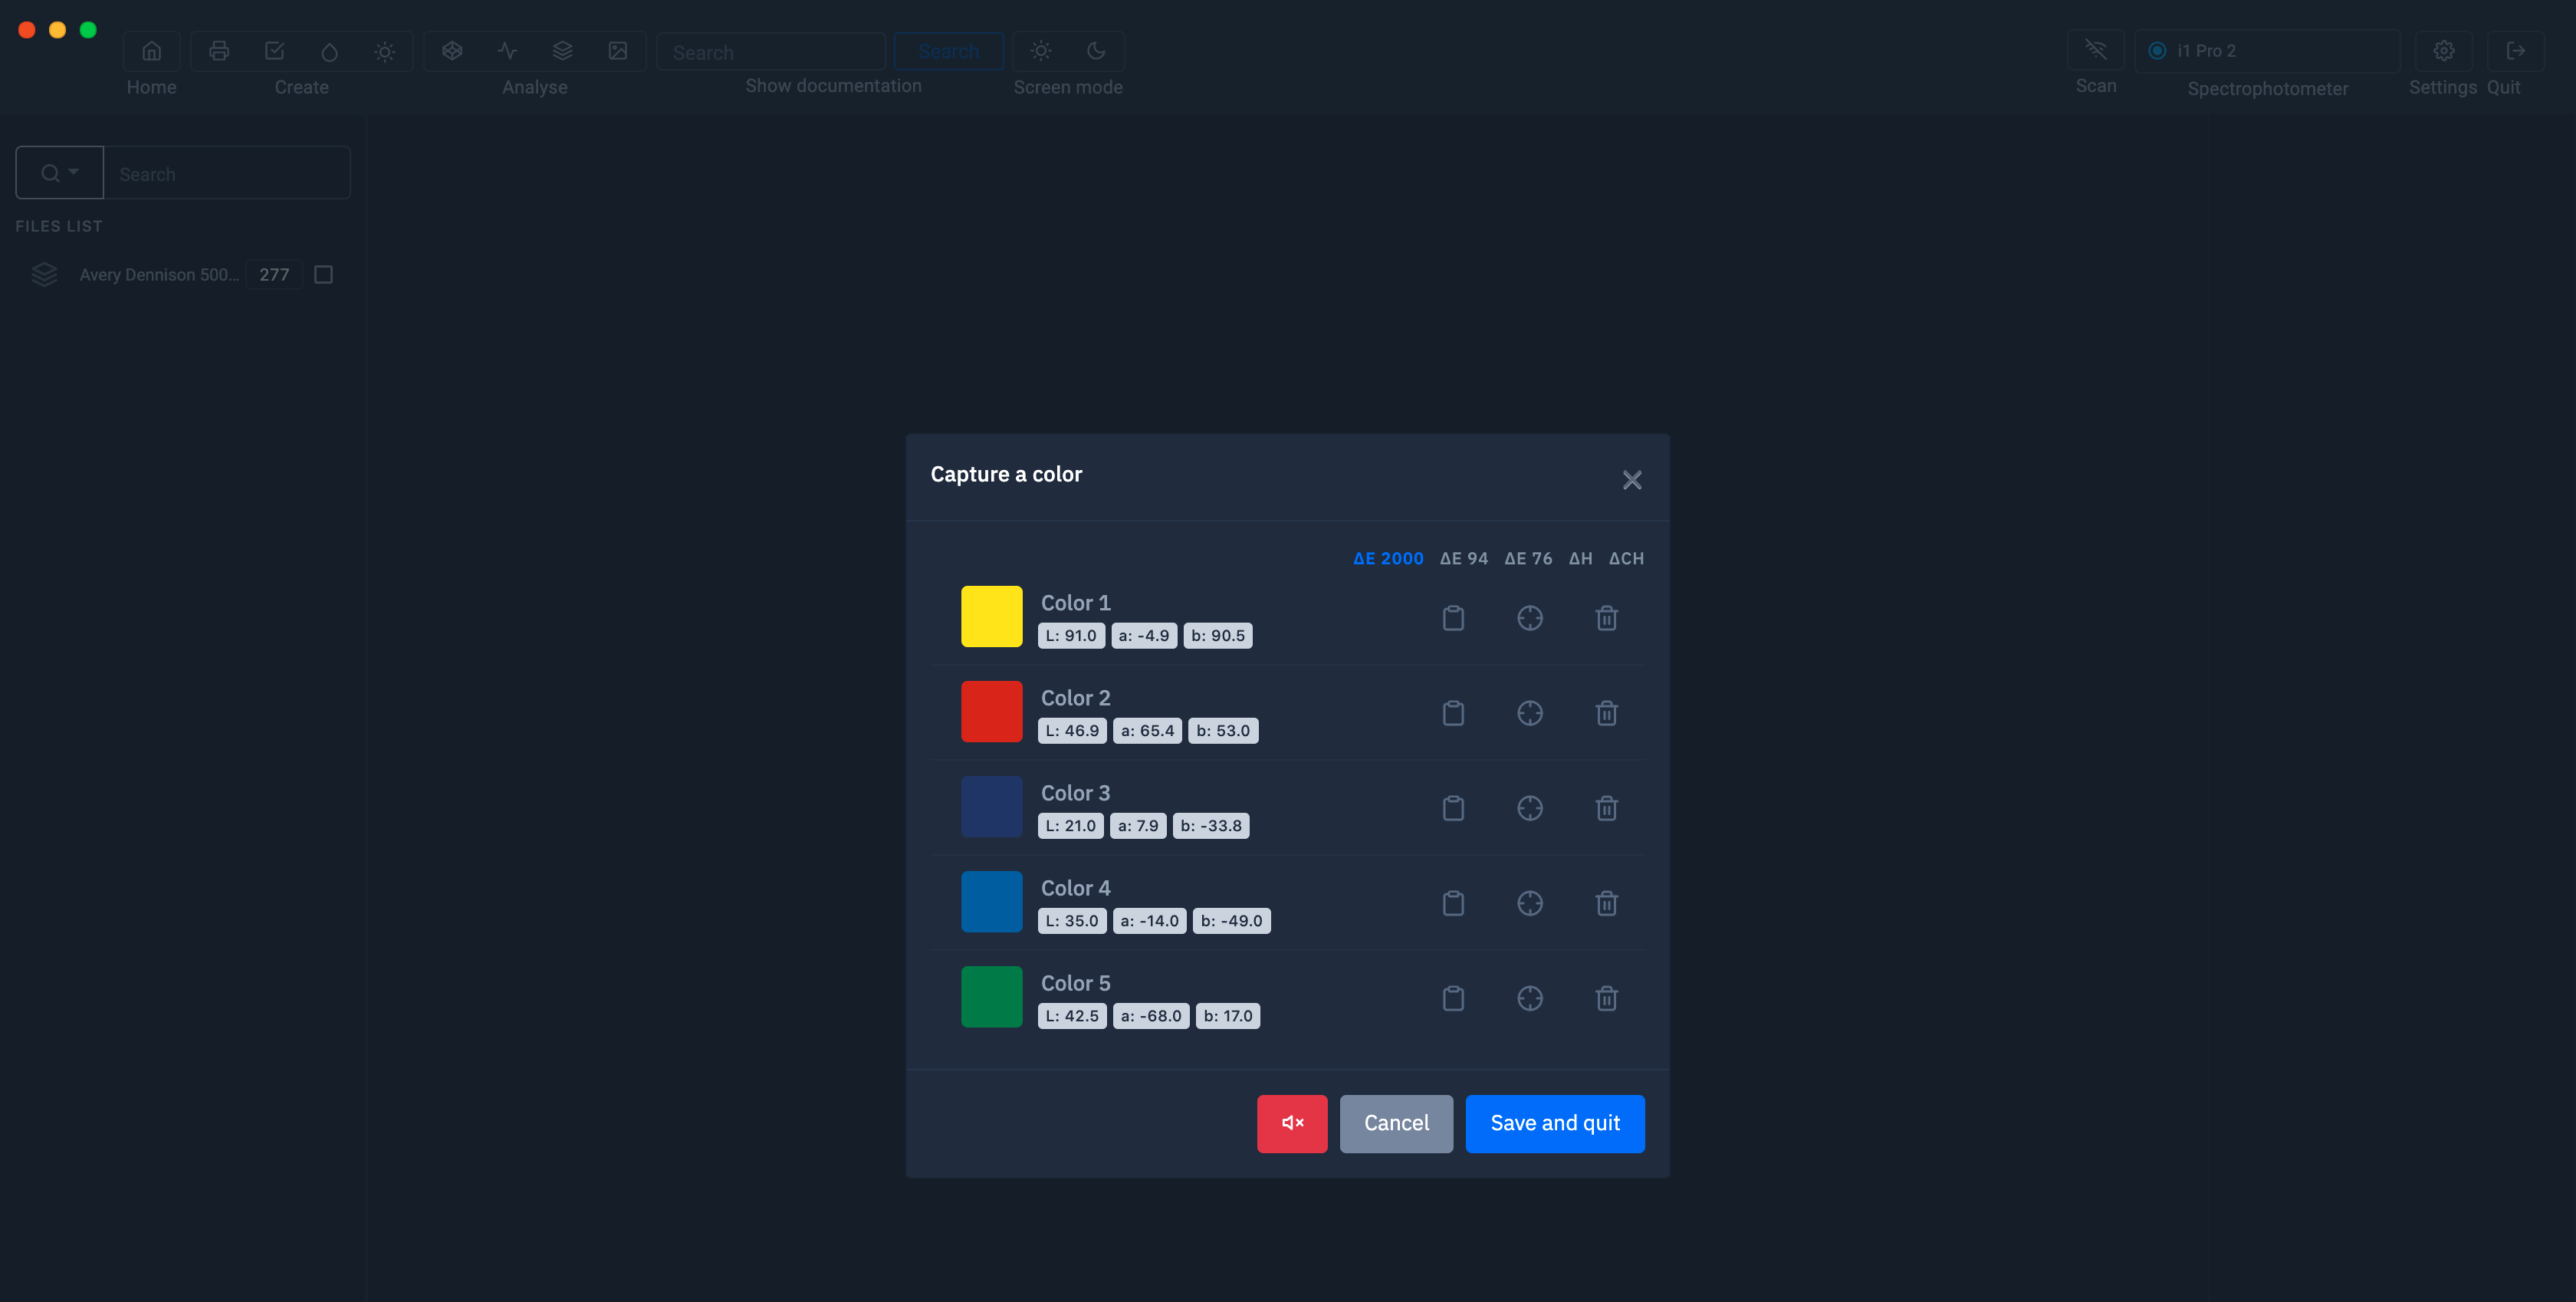
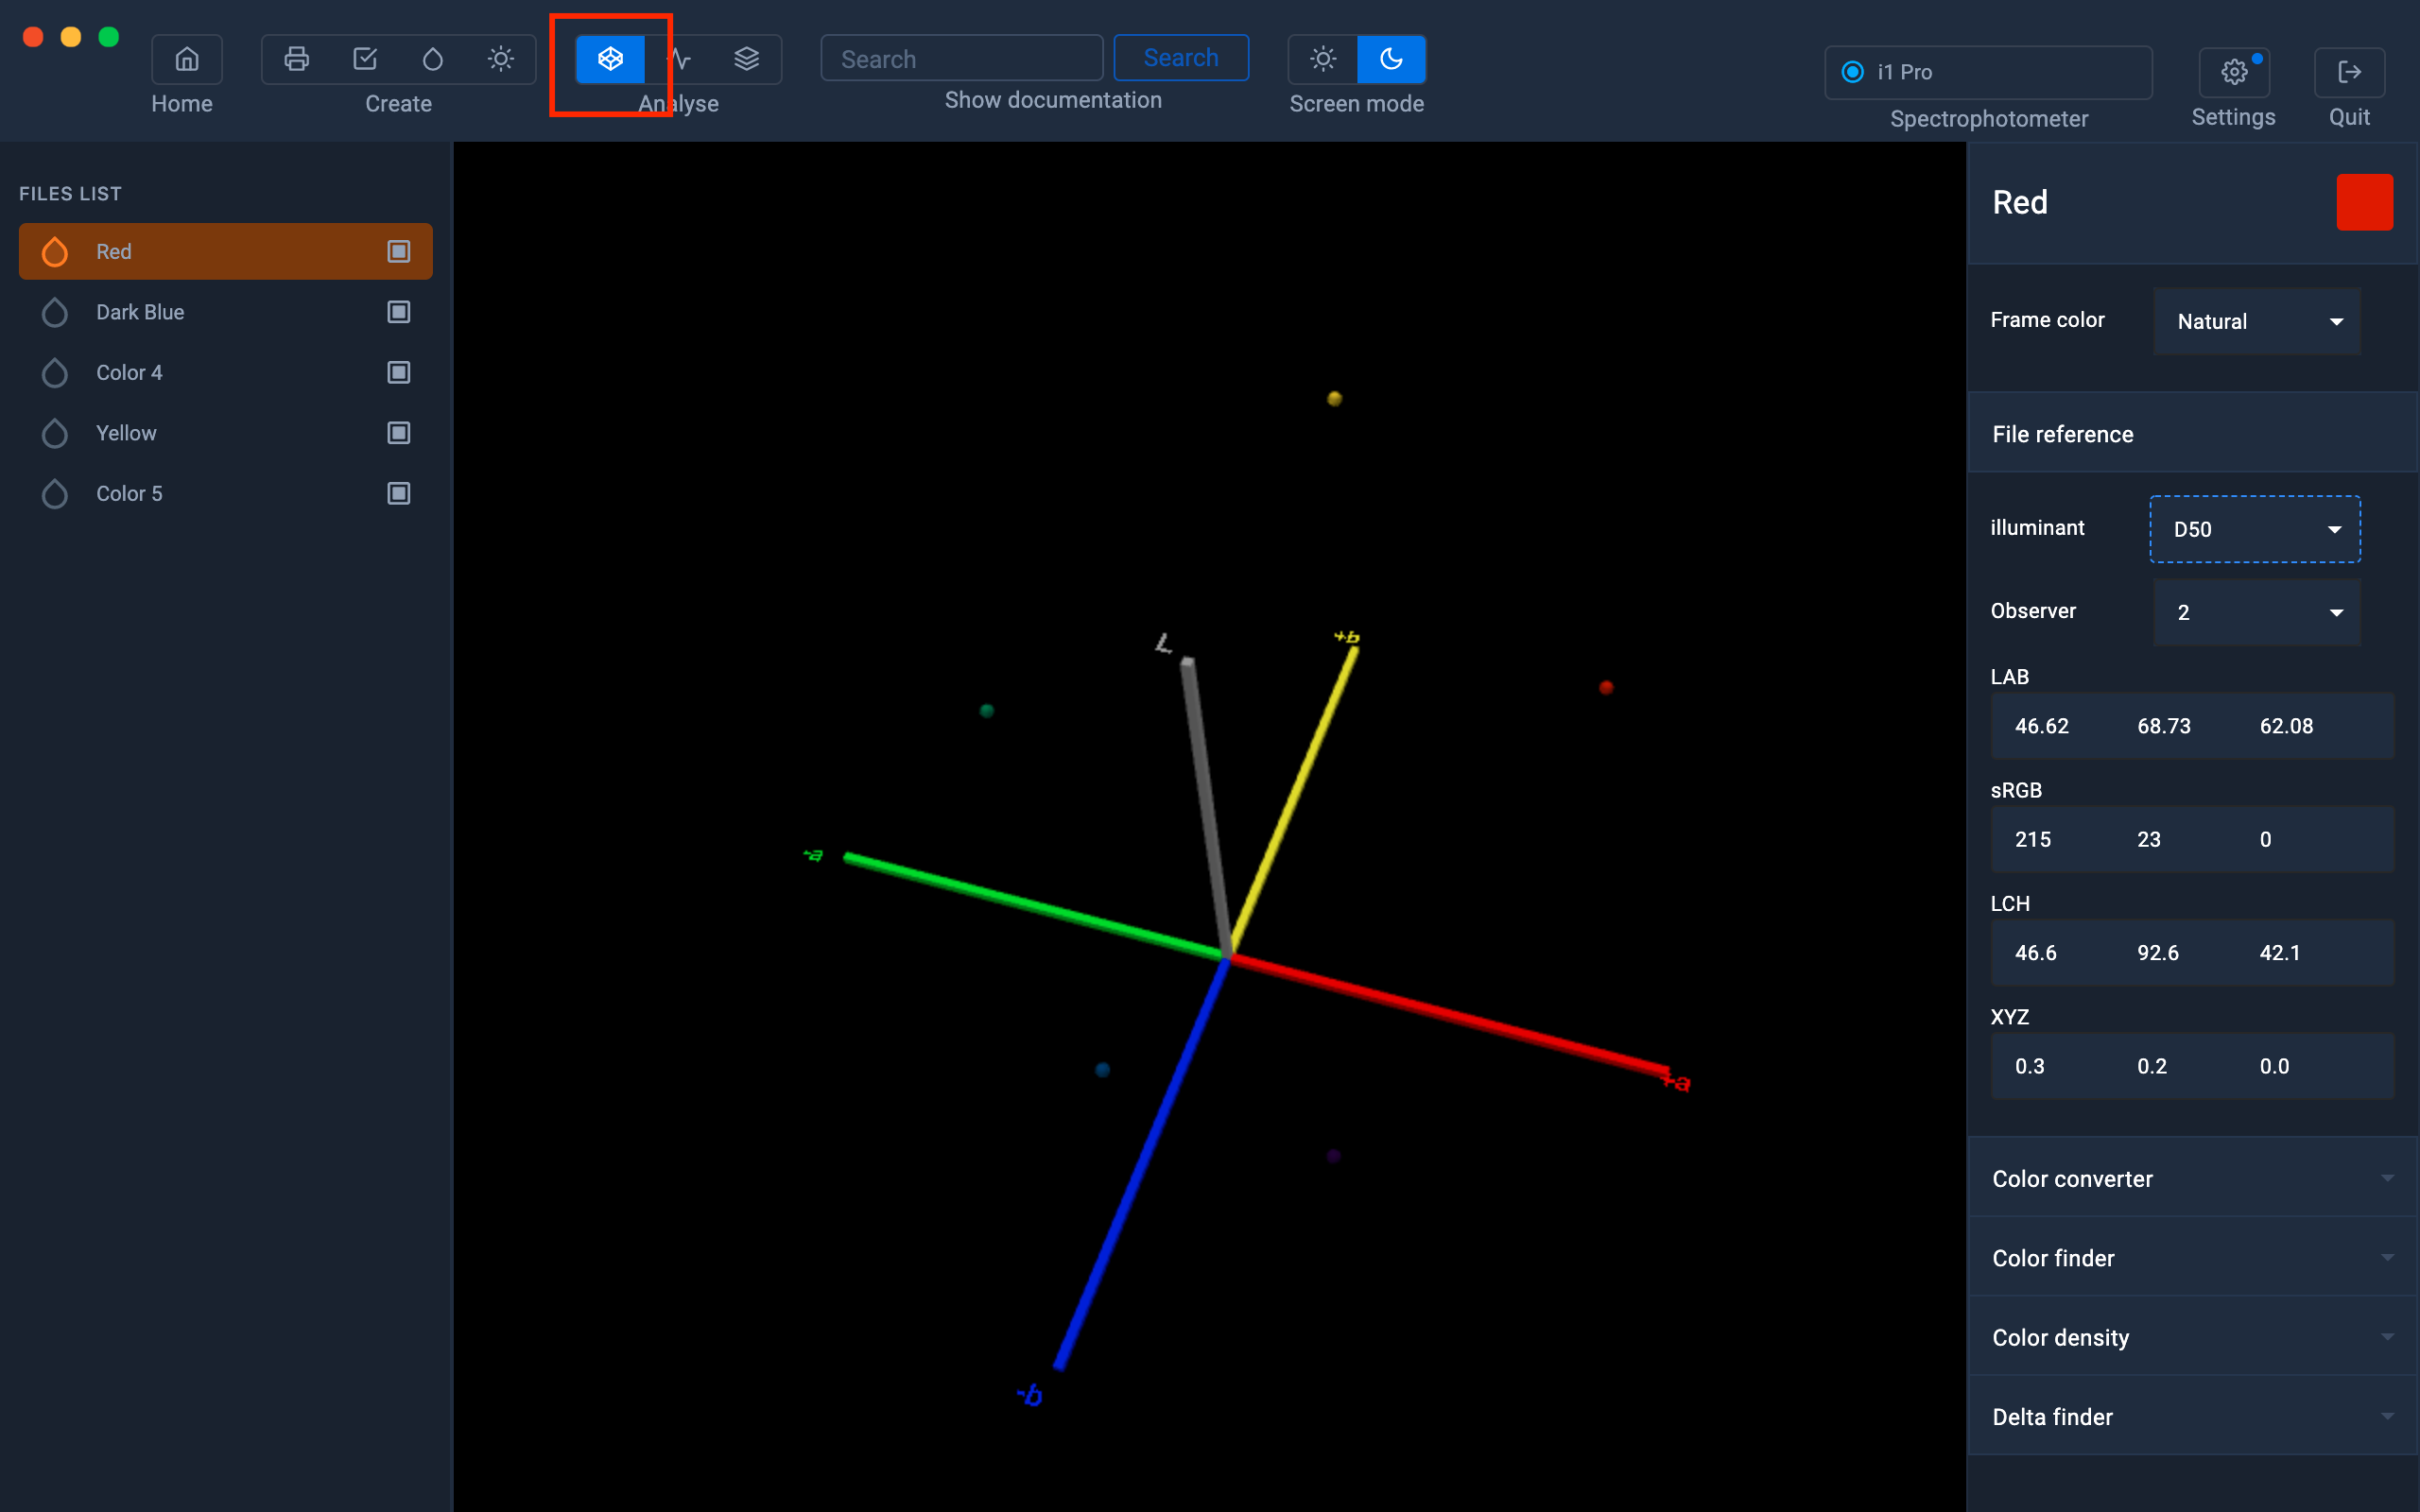
Show color information
All you need to do is select a color in the left column and information about that color is displayed in the right column.
- Color preview
- LAB values
- RGB values (sRGB)
- Hexadecimal values (sRGB web space)
- Lch
values - XYZ values
- CMYV density
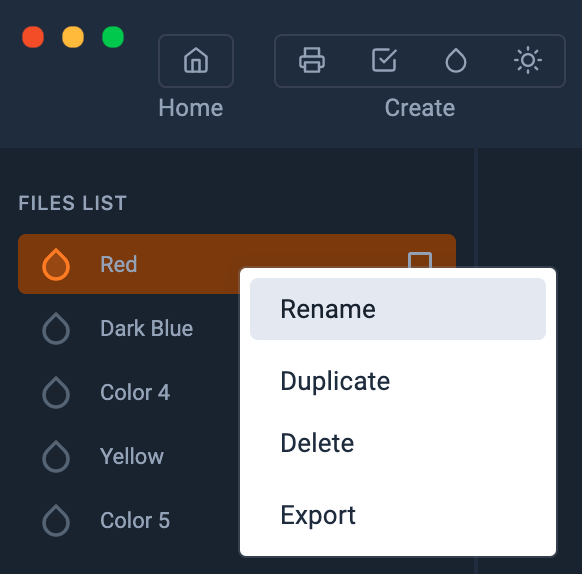
How to manage your colors
Right click on the color for Rename , Duplicate and Delete r.
The Export option allows you to save the color in a .spc file with its spectral data.
These .spc files are useful for sharing and saving your color samples.
Display colors in the Gamut Viewer
It can be useful to display colors in 3D to compare them with an image or an icc profile, such as a media profile.
For more information on the Gamut Viewer module:
For more information, see the chapter: Gamut Viewer
Add your colors in a color table
You can add your colors in a color table, by a simple drag and drop.
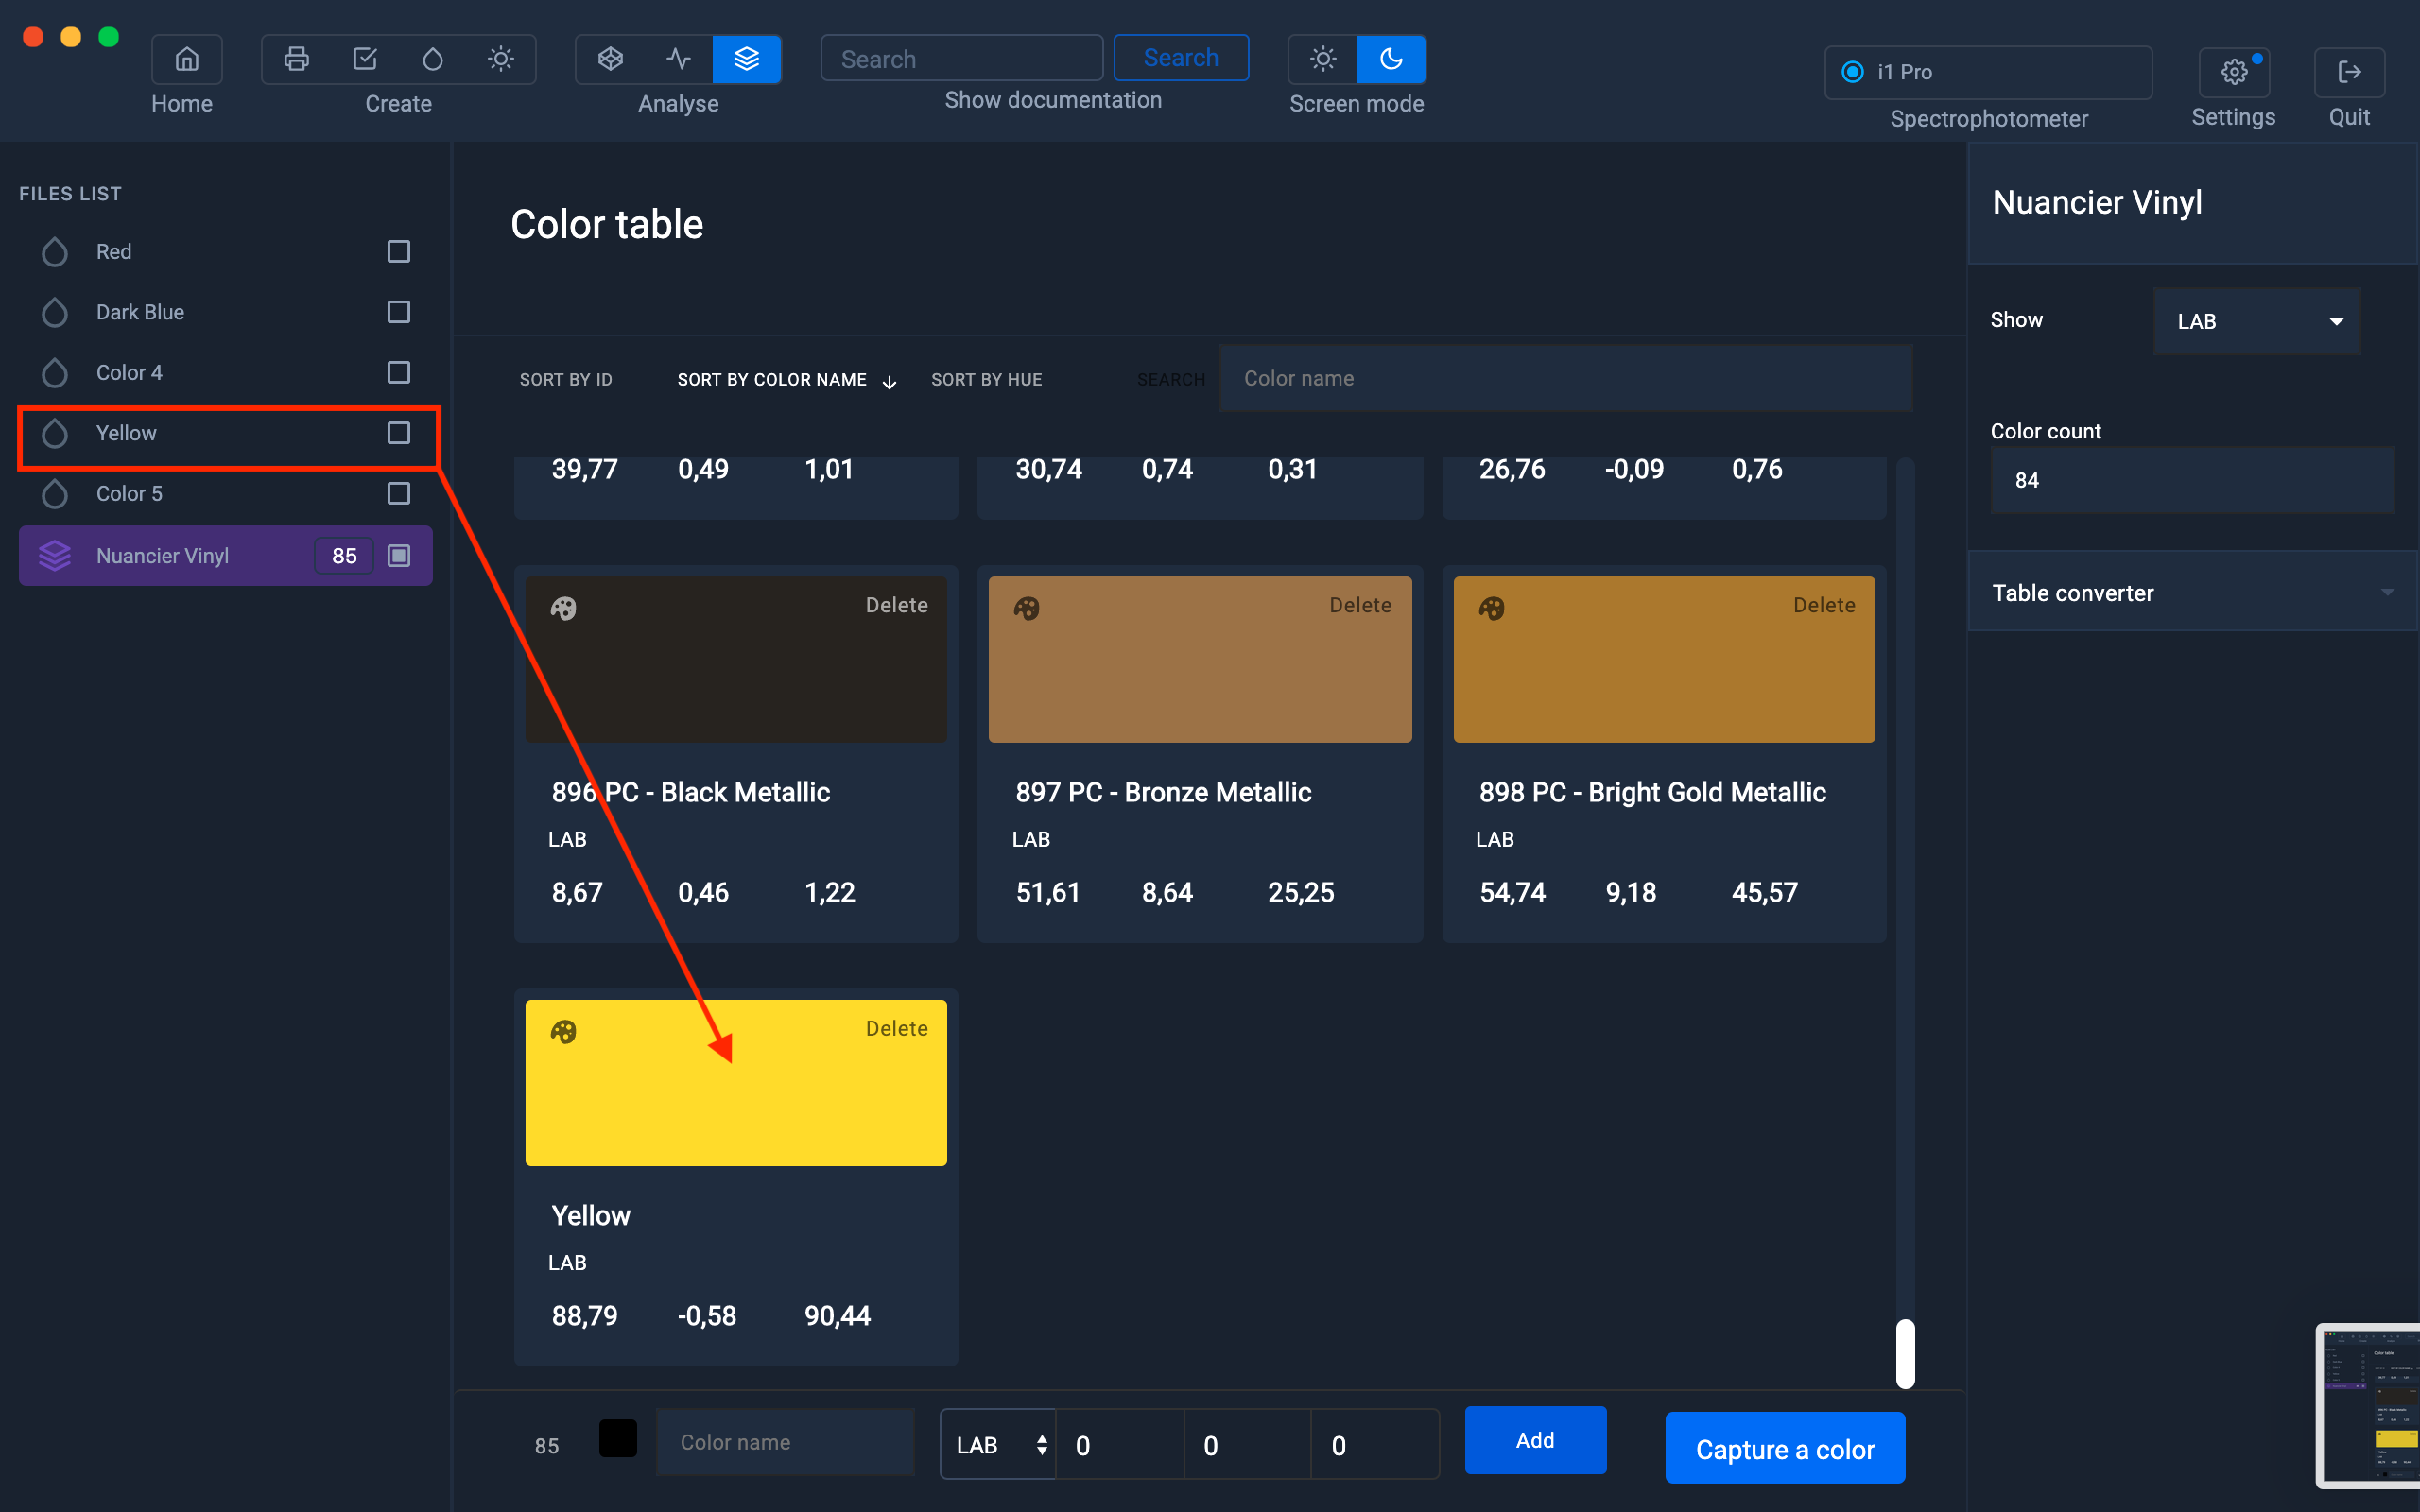
For more information on the color tables:
For more information, see chapter: Color table
Density values
To get the density values of a selected sample, go to the “Color Density” tab located at the bottom in the right column.

For more information on density values:
For more information, see the chapter: Displaying the density
View your reflectance curves in Spectral Viewer.
It might be helpful to compare the reflectance curves of your color sample with a spectral curve of a specific light to understand the effect of metamery.
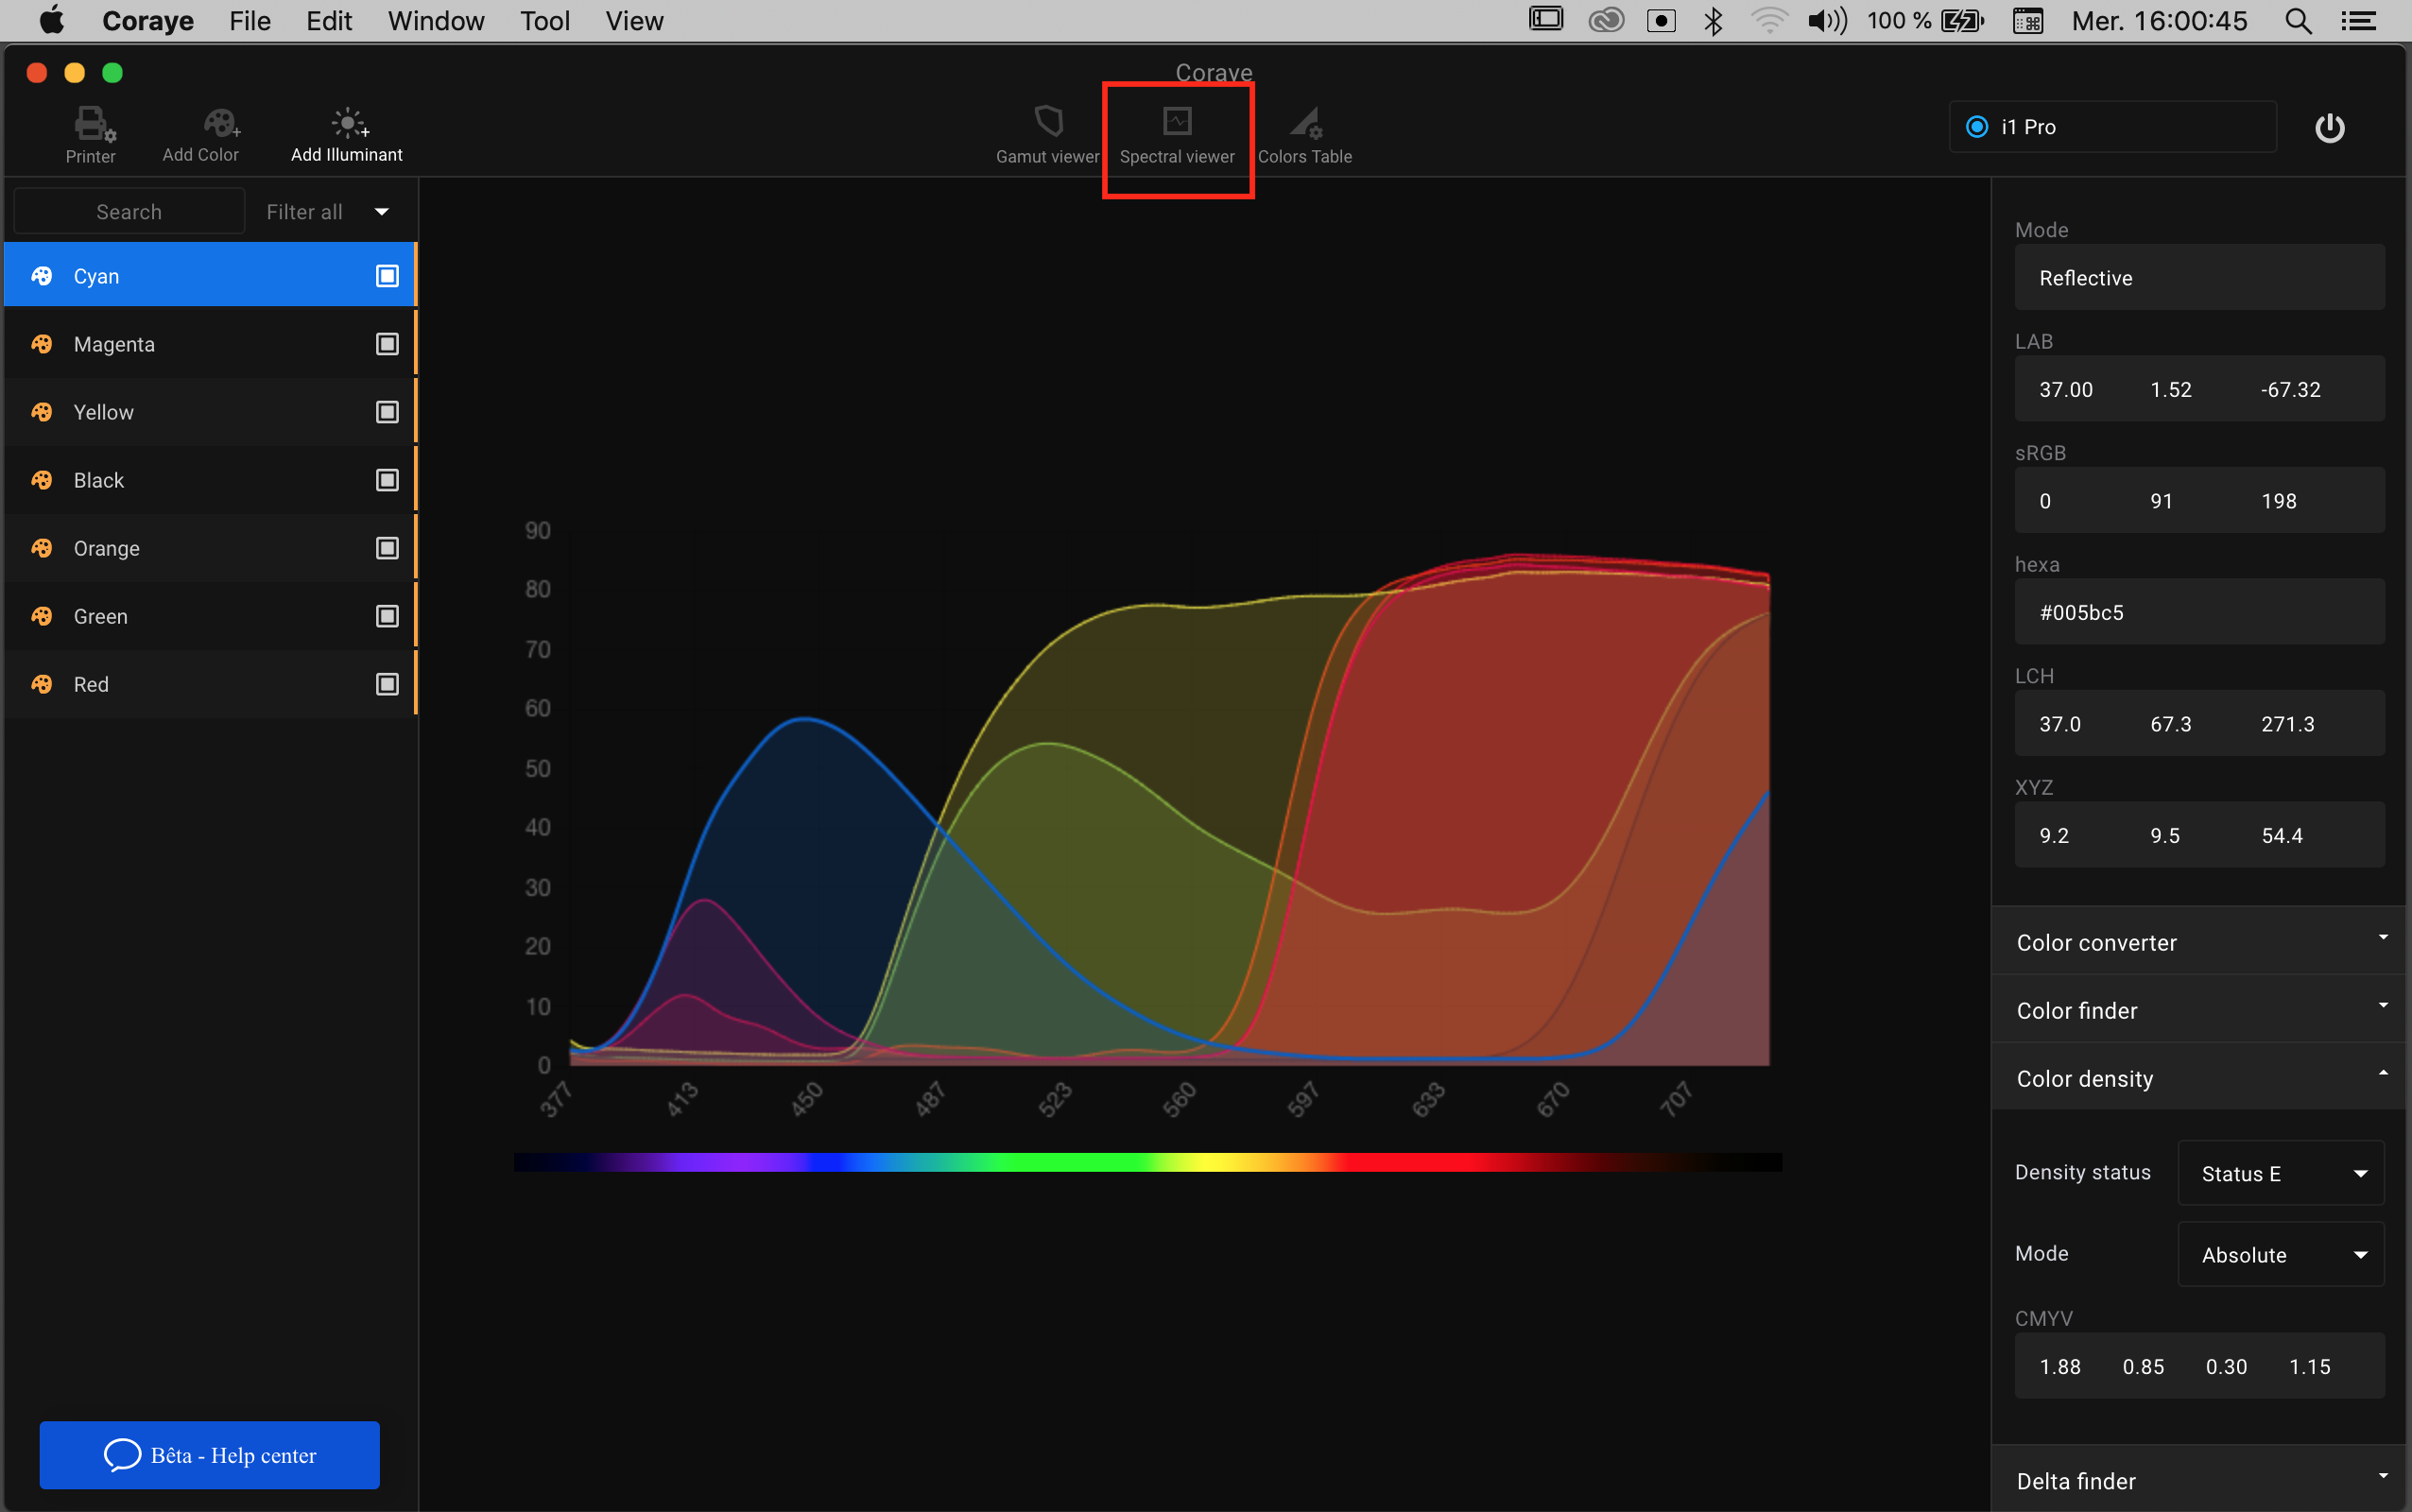
For more information on the Spectral Viewer module:
For more information, see chapter: Spectral Viewer
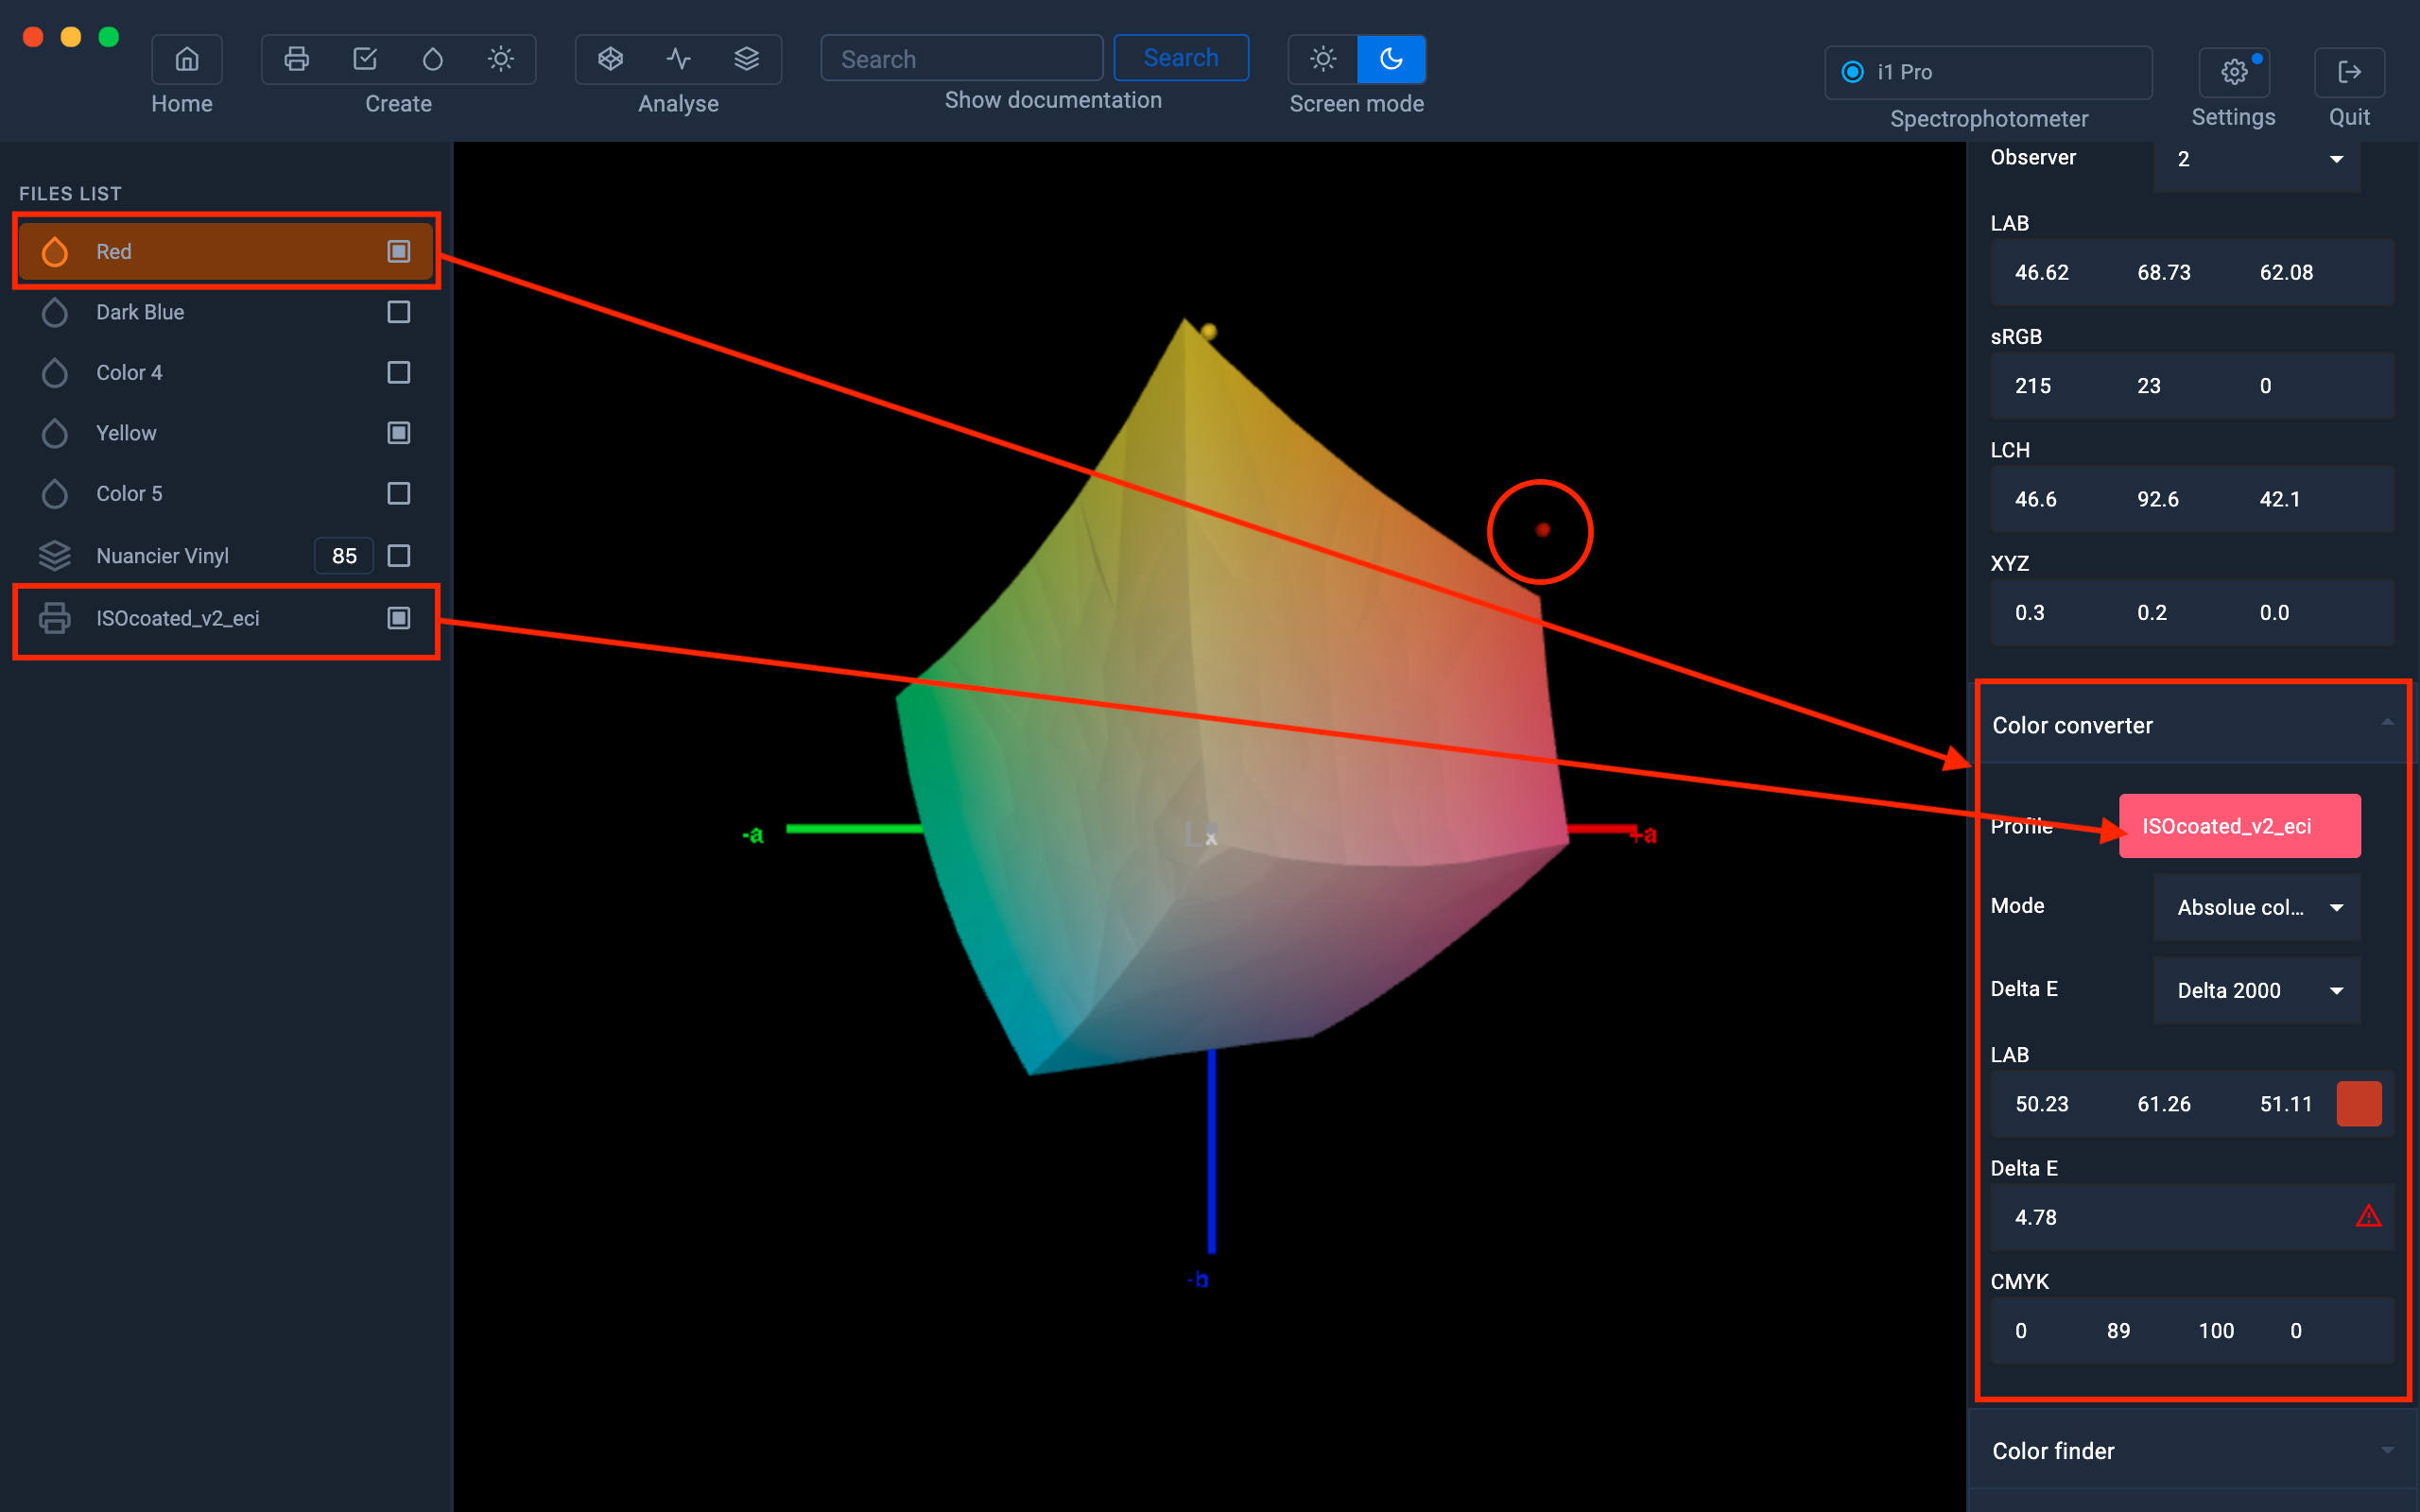
Convert your color swatches to CMYK or RGB with the color converter.
This option converts your color to CMYK or RGB values depending on the ICC profile of your media.
With the Delta E value, you can tell whether your color sample is reproducible or not.
In this example, we have a saturated red and we want to know if our offset printer will be able to reproduce it faithfully.
For that, we are going to drag the CMYK profile Isocoated_v2_eci.icc * into the profile area.
This will convert our "Red" to the closest CMYK values.
But we can see that this color is not reproducible in this color space because the Delta E = 5
We also see in the Gamut Viewer that this color is outside the Isocoated_v2_eci.icc color space.
* The Isocoated_v2_eci.icc profile is a standard used in Europe for processing CMYK files.
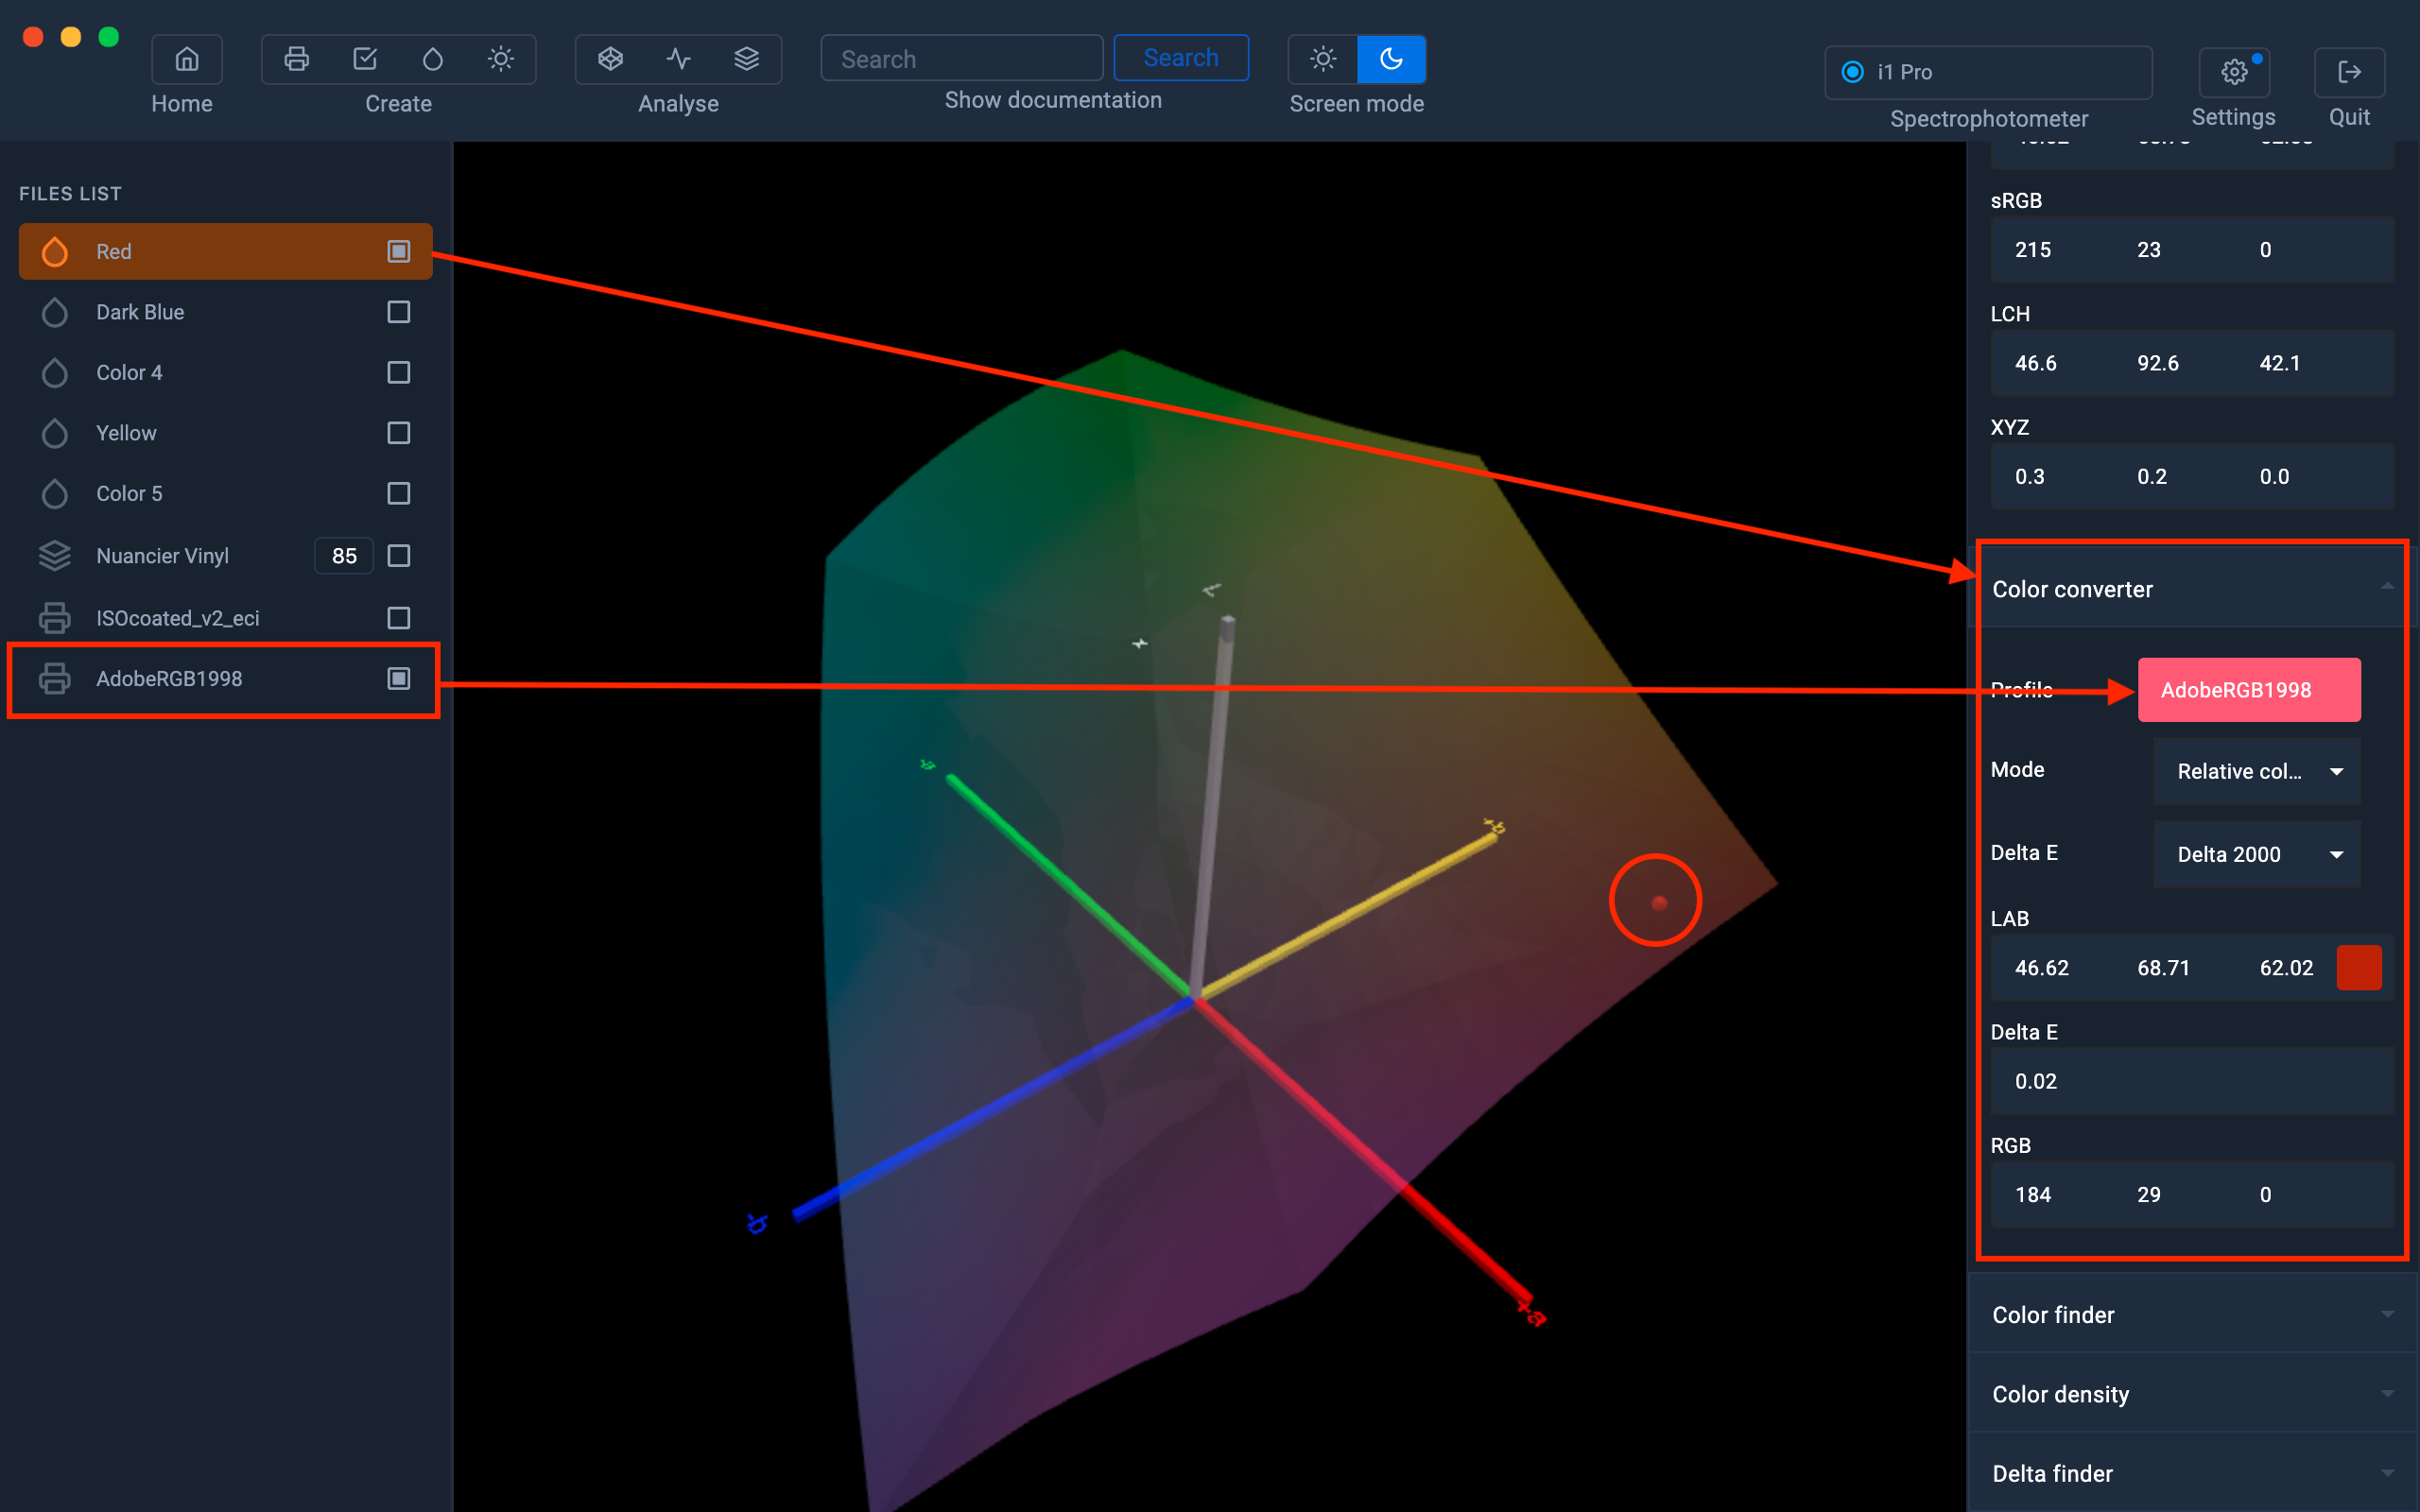
In this example, we have the same saturated red, but we're going to compare it with the Adobe RGB 1998 color space.
Drag and drop the Adobe RGB 1998.icc profile into the profile area.
We now get the closest RGB values.
Here we can see that this color is reproducible in this color space because the Delta E = 0 and we also see in the Gamut viewer, that this color is in the gamut of the AdobeRGB 1998.icc space.
For more information on the Color Converter module:
For more information, see chapter: Color Converter
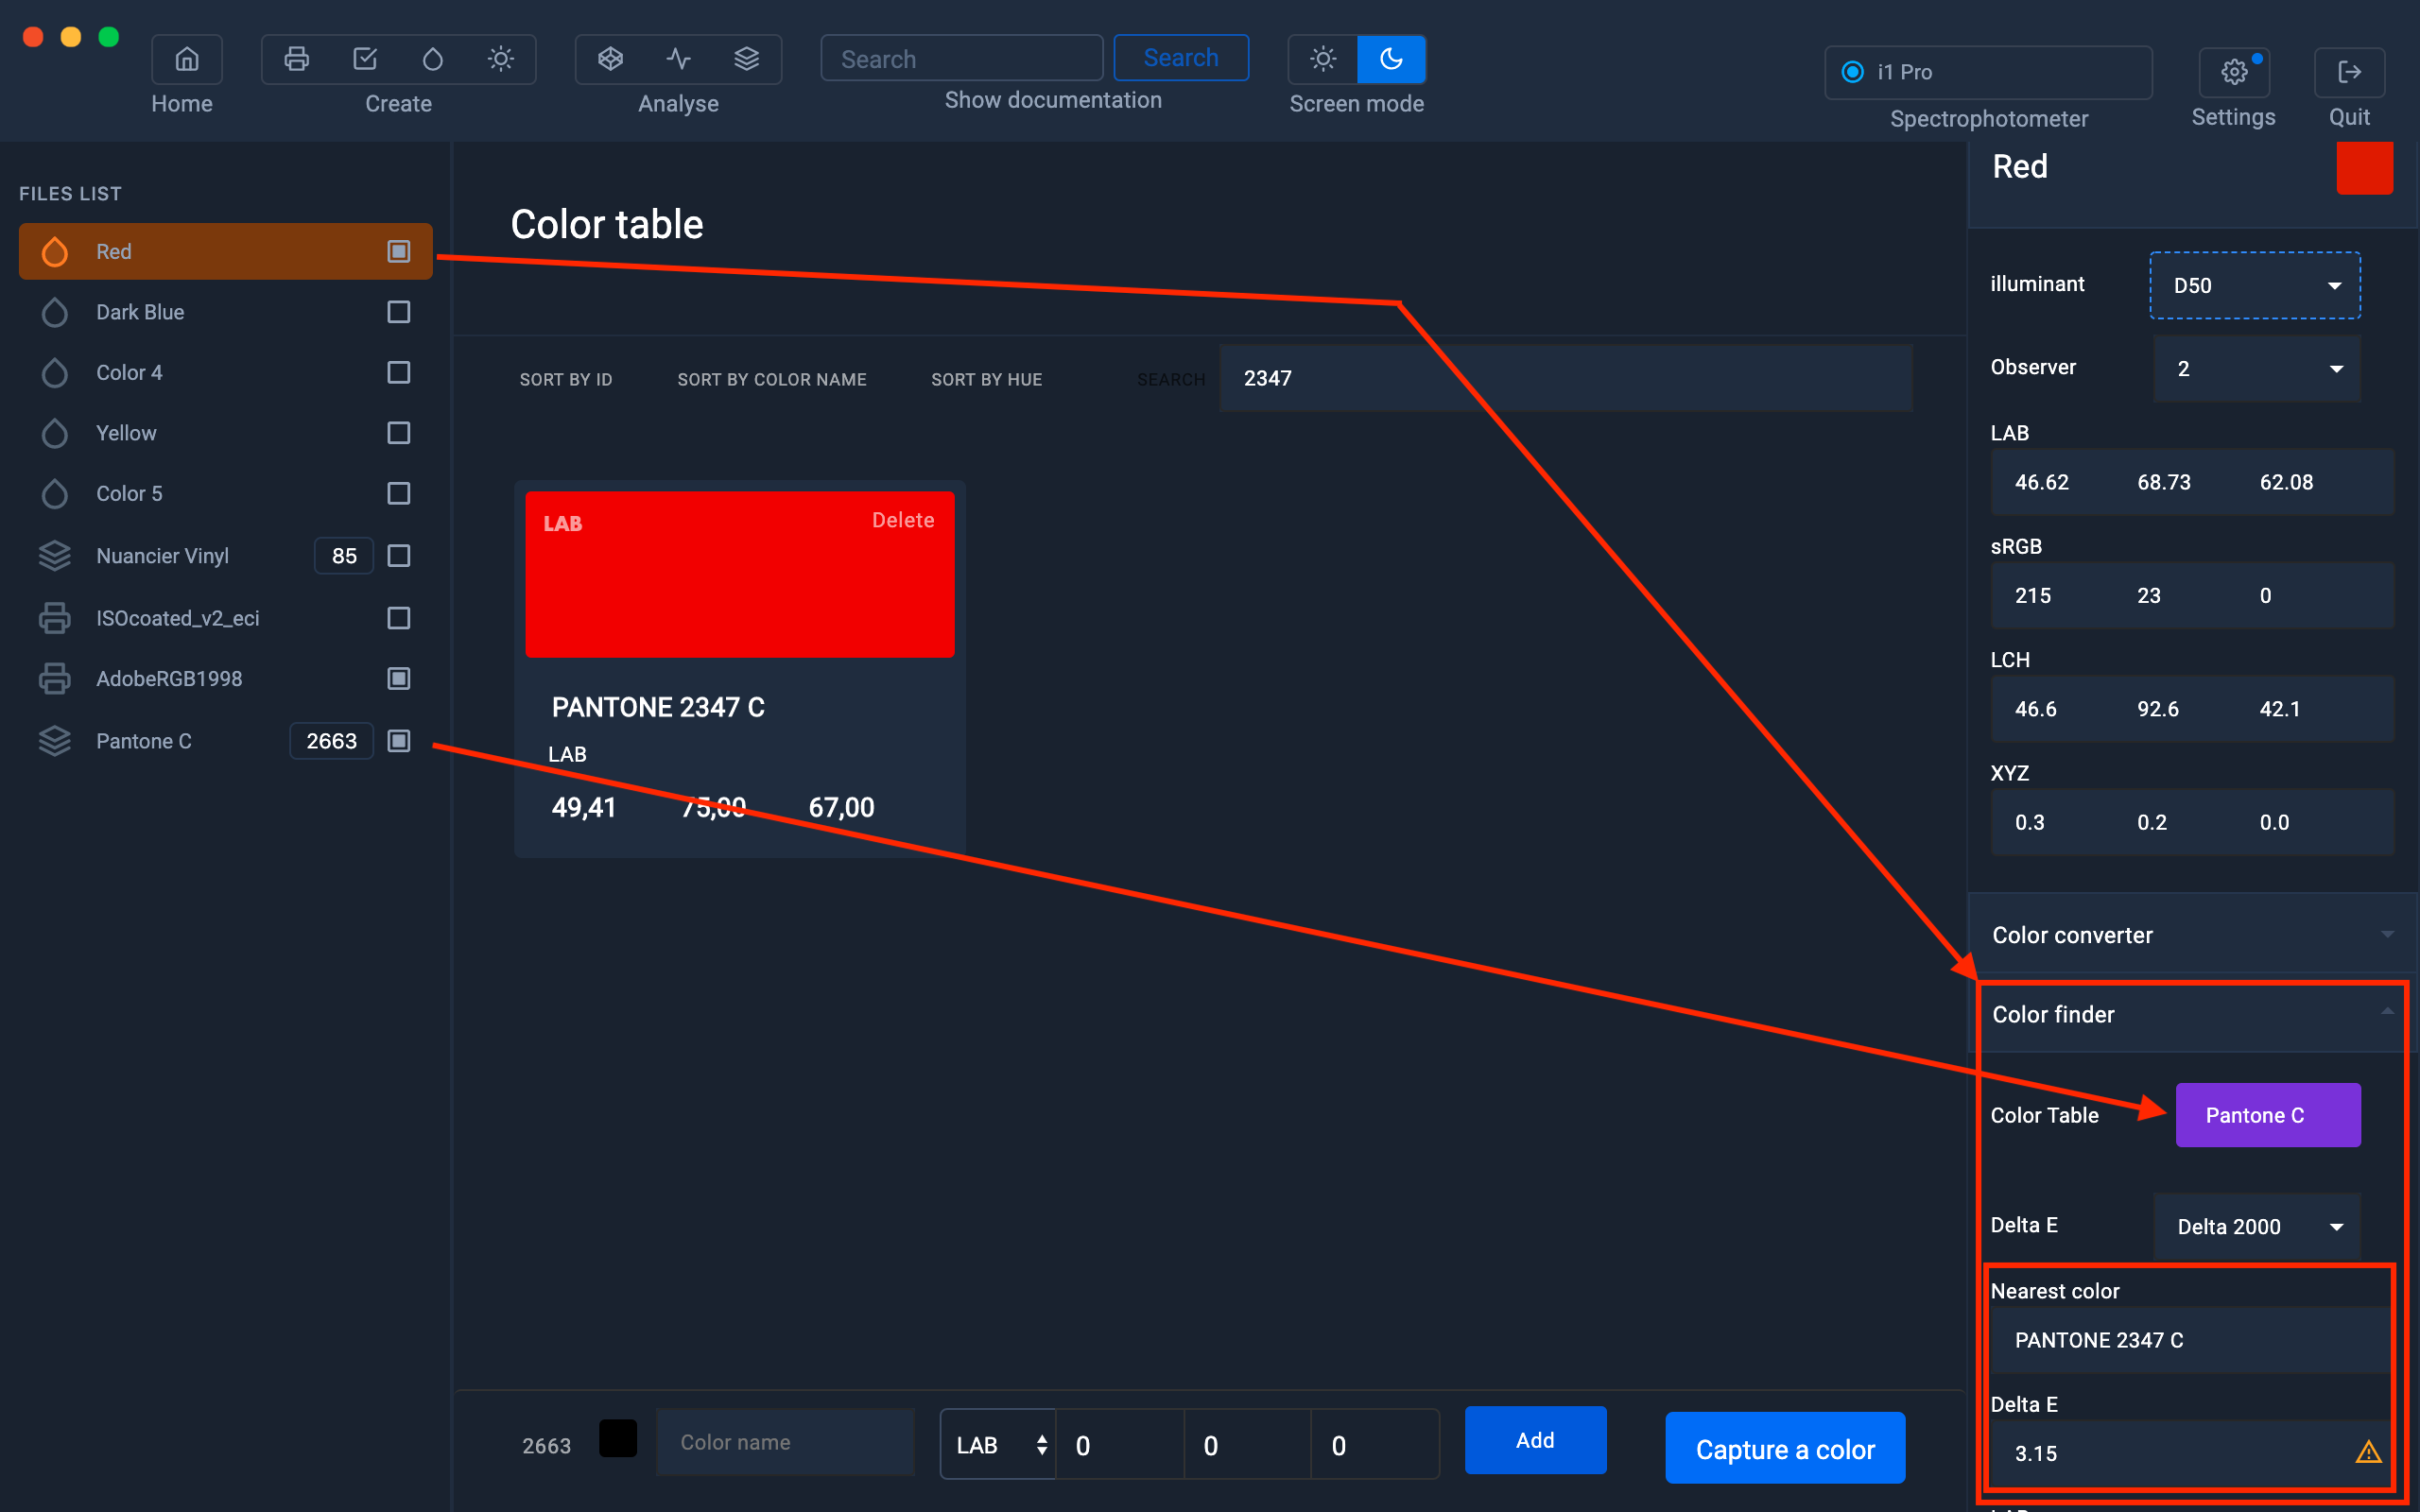
Find the closest color in a color chart with Color Finder.
You have captured a color swatch and you need to know which is the closest Pantone® value.
To find out, simply select your color, go to the Color Finder tab, then drag and drop a color table (ex-PANTONE® C) into the Color Table area.
You will then get the color closest to the color chart with the Delta E value to give you color accuracy.
This function can also be useful for performing quality control from a color chart containing color samples to be checked.
For more information on the Color Finder module:
For more information, see chapter: Color Finder
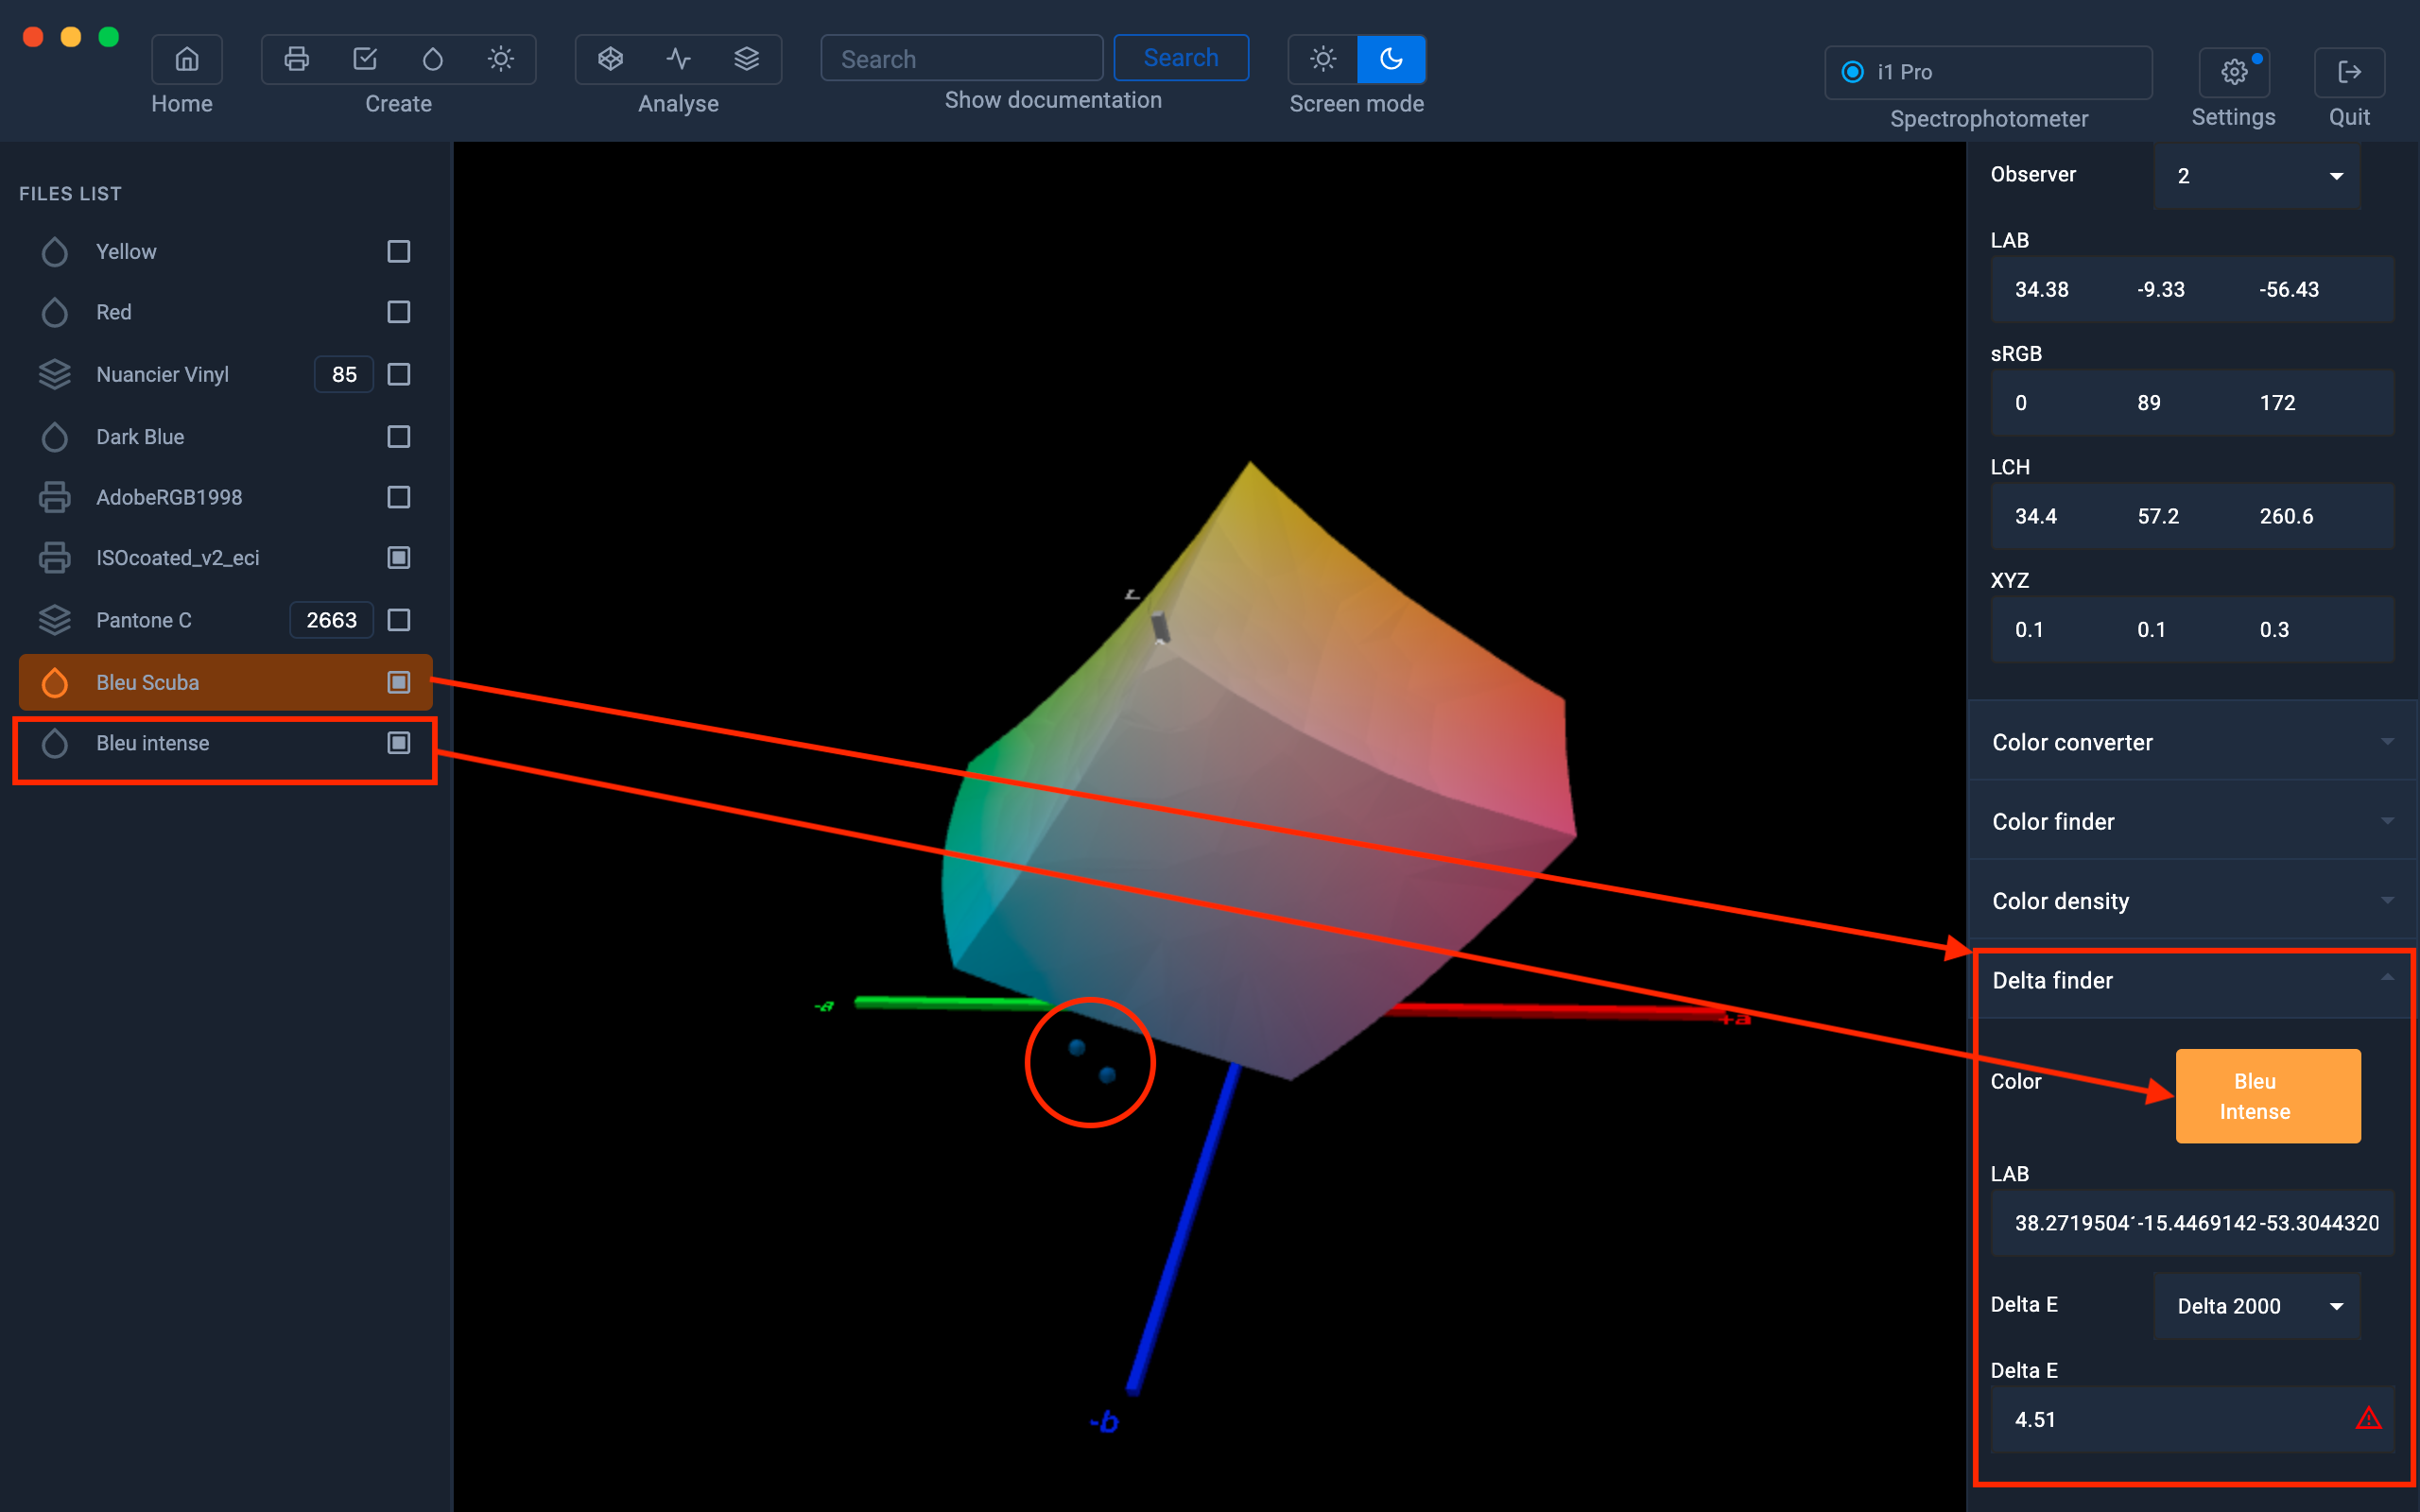
Compare two colors with the Delta Finder
If you need to compare two color samples to know the accuracy between those colors, you can use the Delta Finder feature.
To use it, you just need to select your first color in the left column, go to the Delta Finder tab, and then drag the second color to the Color area.
You will get the Delta E value.
For more information on the Delta Finder module:
For more information, see chapter: Delta E Finder
Compare the white point of an icc profile with the white measurement of a paper
You are looking for a paper with a specific white color, no need to get samples.
Simply download the media profiles from the paper manufacturers' sites, then view or compare the white point of the icc profile with the white measurement of the reference paper.
- First step: Download the media profile from the manufacturer's website
- Second step: Import the profile into Coraye
- Third step: Select the profile then in the right column, drag and drop the white point preview to the left column.
The white point will appear as a color swatch.

- Fourth step: Measure the white of your reference paper or if you know the Lab values of your paper, create a color by right-clicking in the left column.
- Fifth step: Compare the two samples in the "Delta Finder"
