Spectral values
As we saw in the first chapter on light + eye = color,
The eye collects information about electromagnetic frequencies, and the translation of these radiations by the brain is the sensation of color.
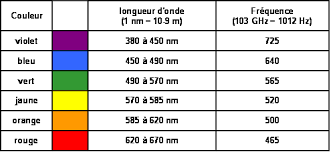
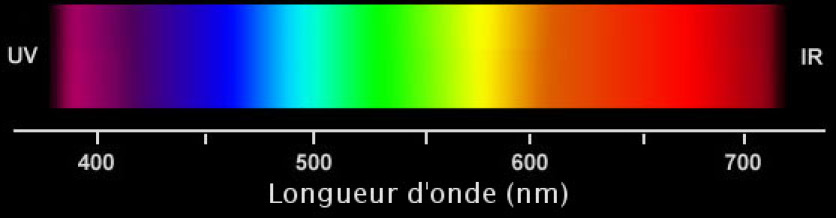
Let's take a closer look at the visible spectrum.
Monochromatic color
One qualifies as monochromatic (from the Greek mono- , one and chromos , color ) a light whose color is formed only of a frequency or, of a very narrow band of frequency at the level of its spectrum.
A source monochromatic emits electromagnetic radiation at a length of wave accurately. For example, laser radiation has only one component (one wavelength), so it has monochromatic light emission. The visible spectrum allows only a certain number of monochromatic colors
Polychromatic Color
Why does the color pink not appear in the visible light spectrum?
Because a color is by definition associated with a wavelength of electromagnetic radiation (or a very restricted range).
Pink is not associated with a wavelength, so it is not a color. (Just like brown, black, white). It is associated with several wavelengths (it has a wide spectral range).
If we perceive “pink” well, it is because our eyes are endowed with three types of receptors sensitive to blue, red and green.
With the correct mixture (in certain proportions) of spectral components, you simultaneously stimulate the three types of receptors, and our brain carries out an additive synthesis of these three simultaneous stimuli. This results in a “well defined” sensation which is that of pink!
Just like white which is the sum of the wavelengths of the visible spectrum.
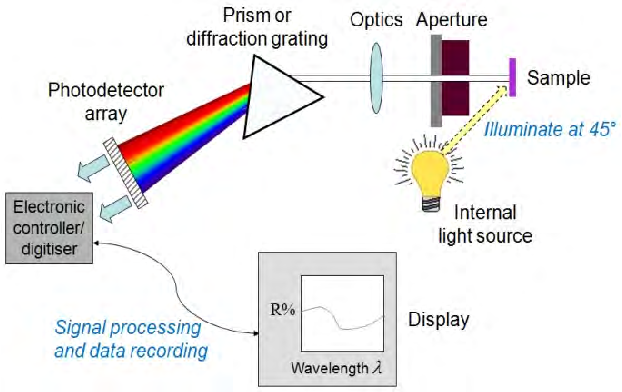
The spectrophotometer
As we saw in the chapter on spectrophotometers, the measured sample sends back waves that it has not absorbed back to the spectrophotometer.
The prism system will break down these waves to redirect them to a photosensitive sensor.
The received signal, once amplified, will display the reflectance curve (spectral curve) corresponding to the measured "color".
Result of the measurement of a "Pink" sample and a "White" sample
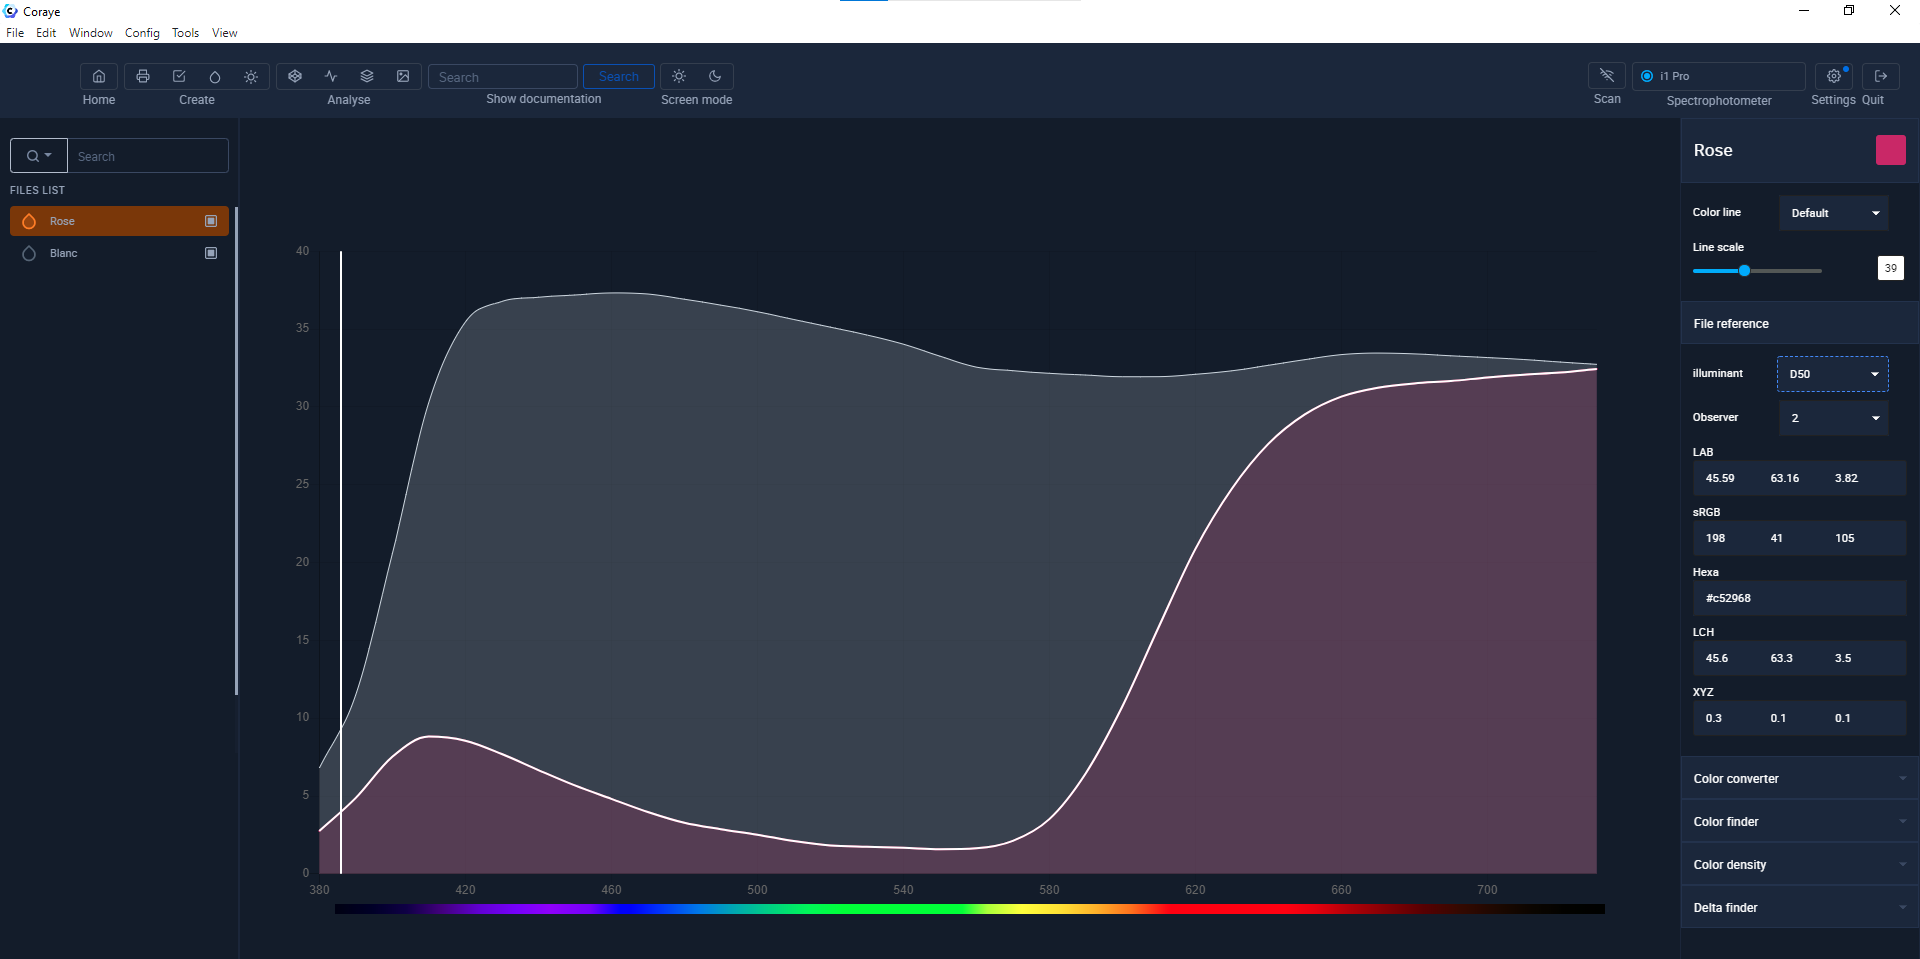 Result of the measurement of a "Pink" sample and a "White" sample
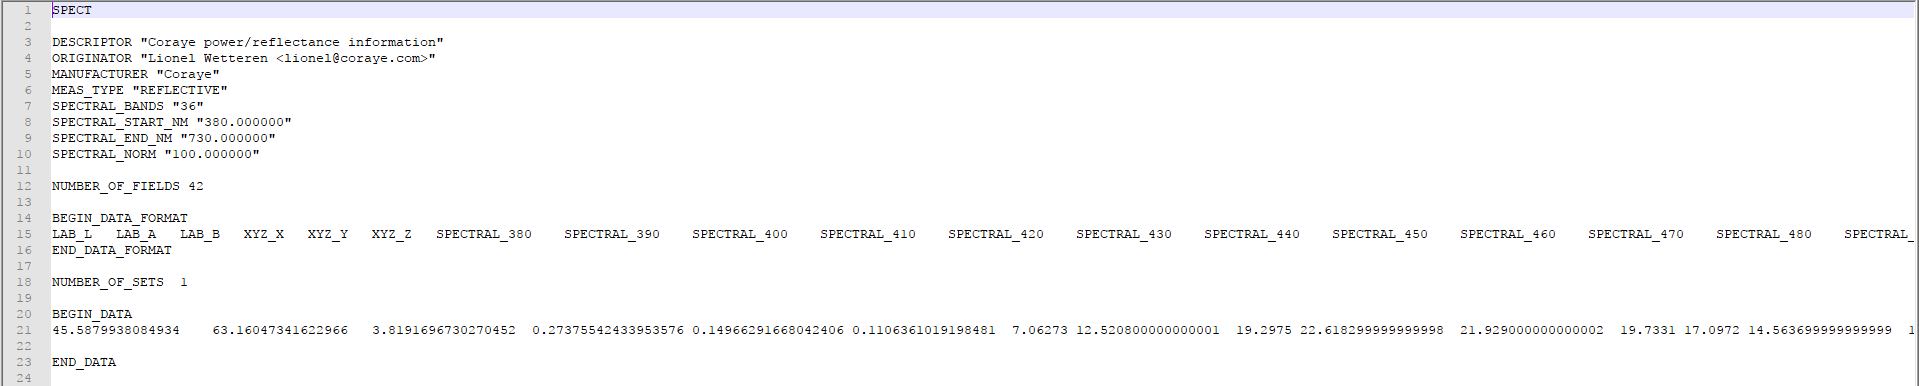
The color is saved as a file containing the values of the spectral curve.
The XYZ and Lab values were calculated by an algorithm which converts the spectral curve into a color seen by the human eye.
For more information see the Wikipedia article: Polychromatic light