Spectrophotometers (En)
Spectral values
As we saw in the first chapter on light + eye = color,
The eye collects information about electromagnetic frequencies, and the translation of these radiations by the brain is the sensation of color.
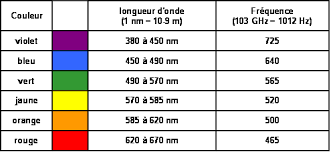
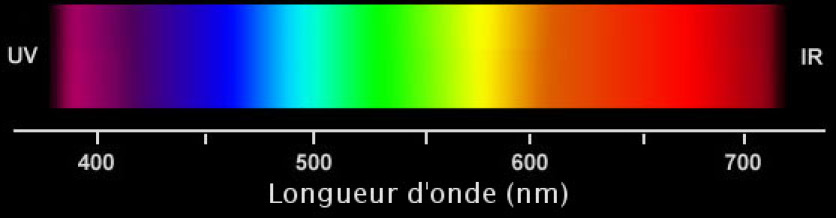
Let's take a closer look at the visible spectrum.
Monochromatic color
One qualifies as monochromatic (from the Greek mono- , one and chromos , color ) a light whose color is formed only of a frequency or, of a very narrow band of frequency at the level of its spectrum.
A source monochromatic emits electromagnetic radiation at a length of wave accurately. For example, laser radiation has only one component (one wavelength), so it has monochromatic light emission. The visible spectrum allows only a certain number of monochromatic colors
Polychromatic Color
Why does the color pink not appear in the visible light spectrum?
Because a color is by definition associated with a wavelength of electromagnetic radiation (or a very restricted range).
Pink is not associated with a wavelength, so it is not a color. (Just like brown, black, white). It is associated with several wavelengths (it has a wide spectral range).
If we perceive “pink” well, it is because our eyes are endowed with three types of receptors sensitive to blue, red and green.
With the correct mixture (in certain proportions) of spectral components, you simultaneously stimulate the three types of receptors, and our brain carries out an additive synthesis of these three simultaneous stimuli. This results in a “well defined” sensation which is that of pink!
Just like white which is the sum of the wavelengths of the visible spectrum.
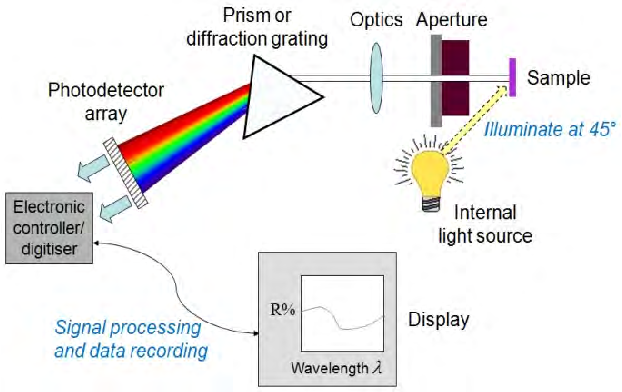
The spectrophotometer
As we saw in the chapter on spectrophotometers, the measured sample sends back waves that it has not absorbed back to the spectrophotometer.
The prism system will break down these waves to redirect them to a photosensitive sensor.
The received signal, once amplified, will display the reflectance curve (spectral curve) corresponding to the measured "color".
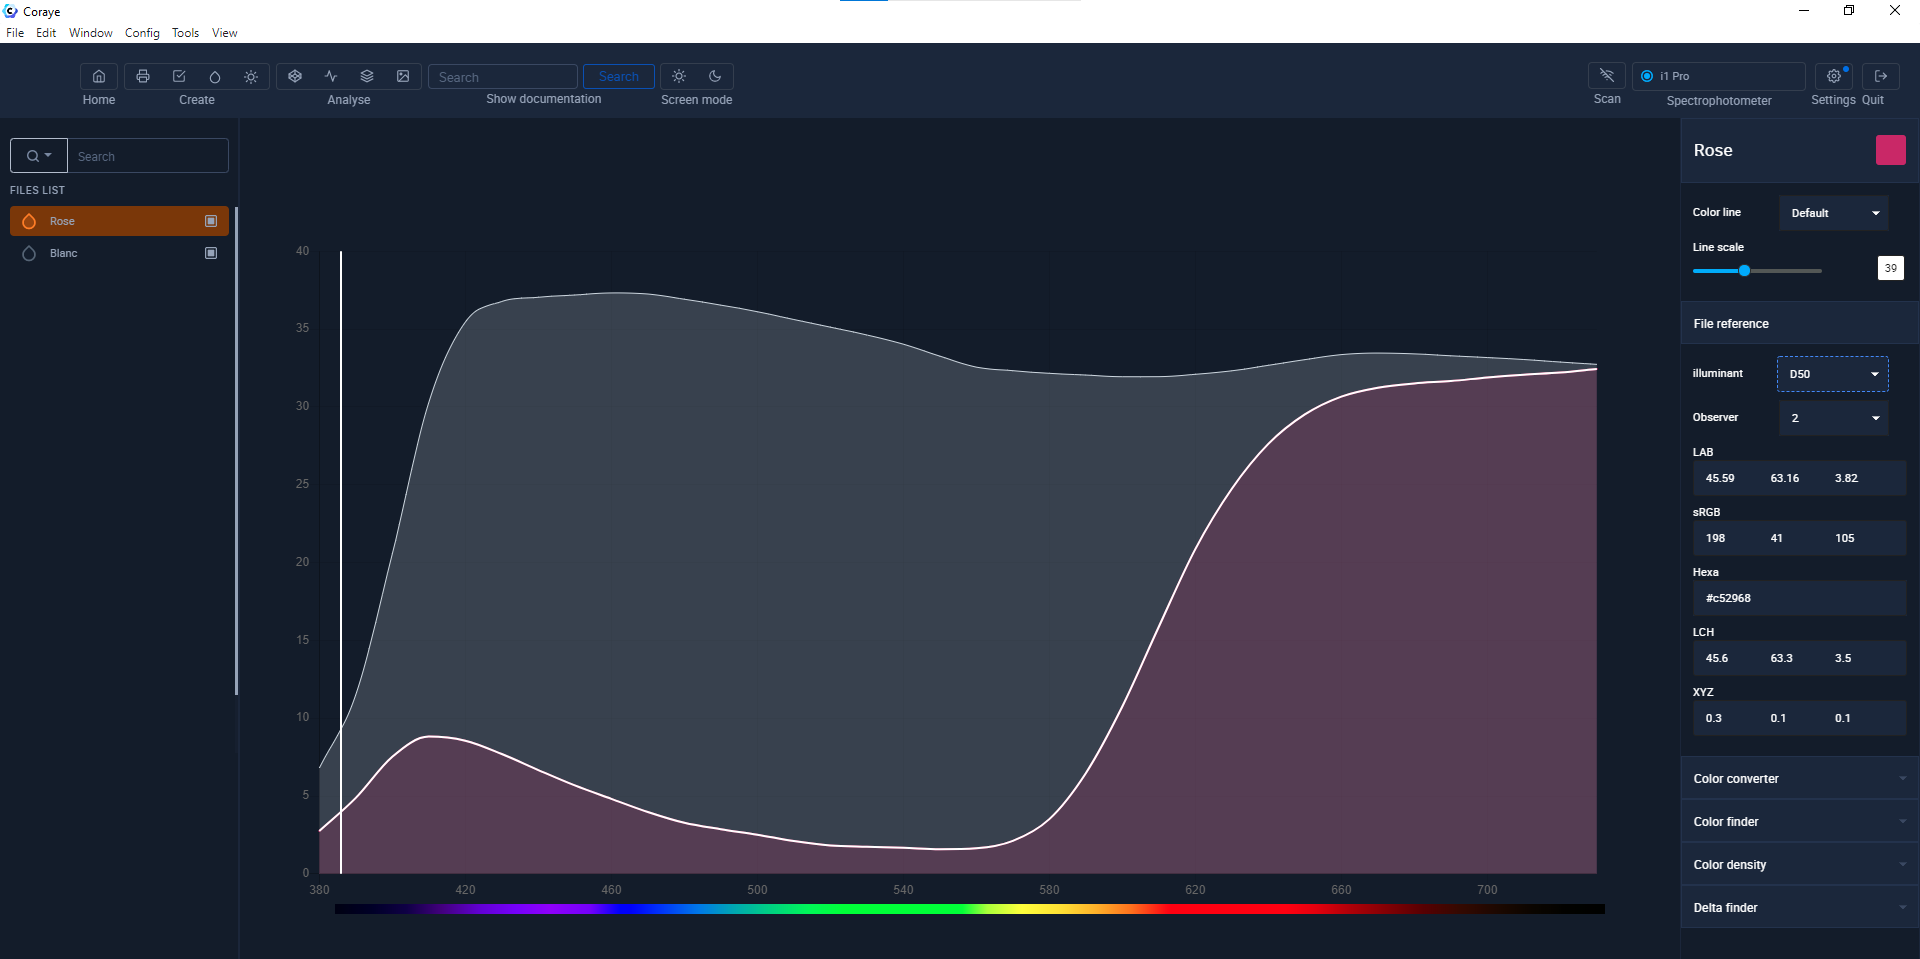
Result of the measurement of a "Pink" sample and a "White" sample
 Result of the measurement of a "Pink" sample and a "White" sample
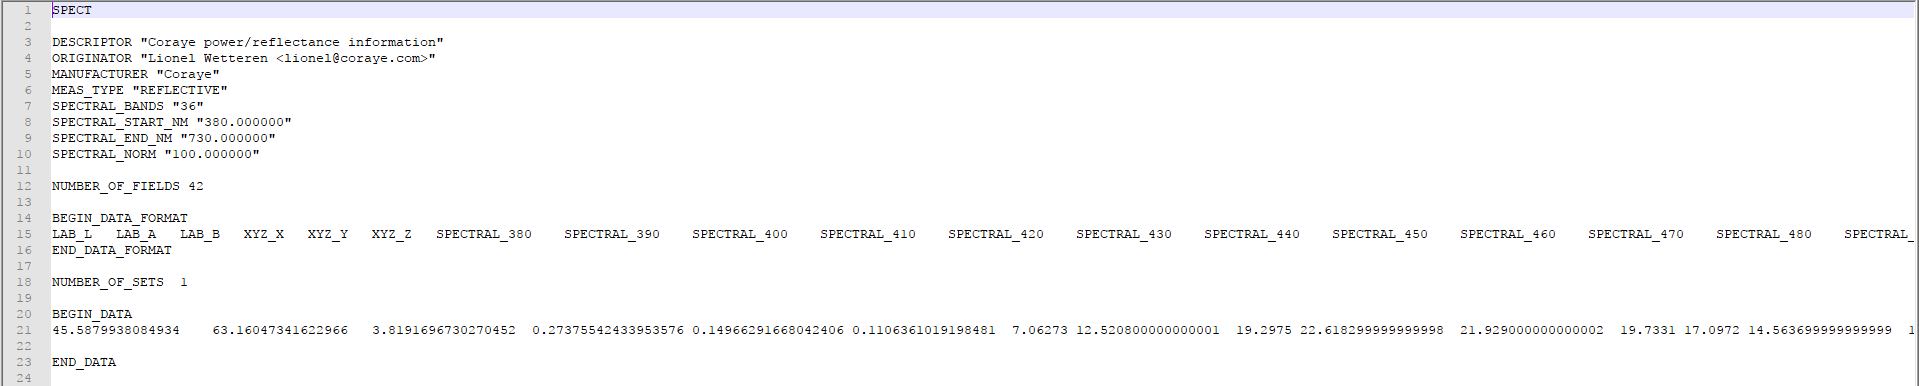
The color is saved as a file containing the values of the spectral curve.
The XYZ and Lab values were calculated by an algorithm which converts the spectral curve into a color seen by the human eye.
For more information see the Wikipedia article: Polychromatic light
Measuring instruments
Each of these measuring instruments have a specific role, in order to differentiate them, we will give you a brief description.
| Spectrophotometer | Colorimeter |
 |
 |
| Spectrodensitometer | Densitometer |
 |
 |
| Automatic spectrophotometer | Sphere spectrophotometer |
 |
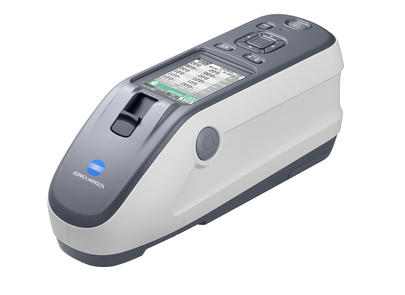 |
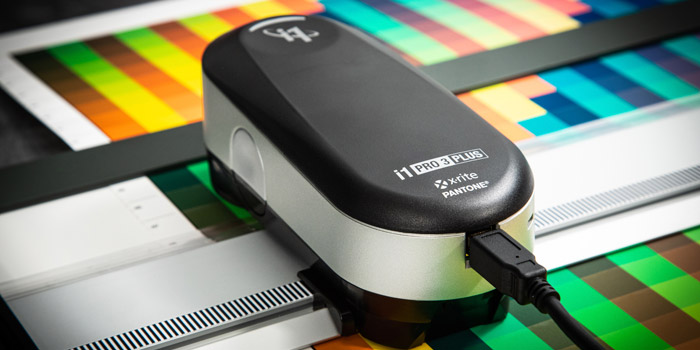
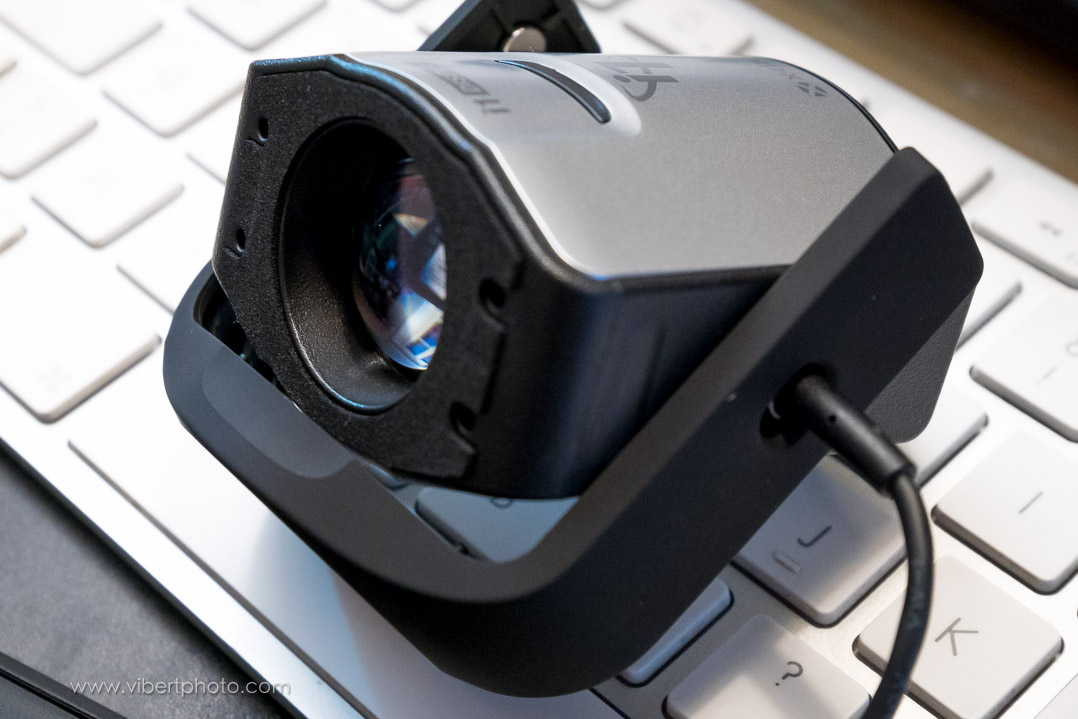
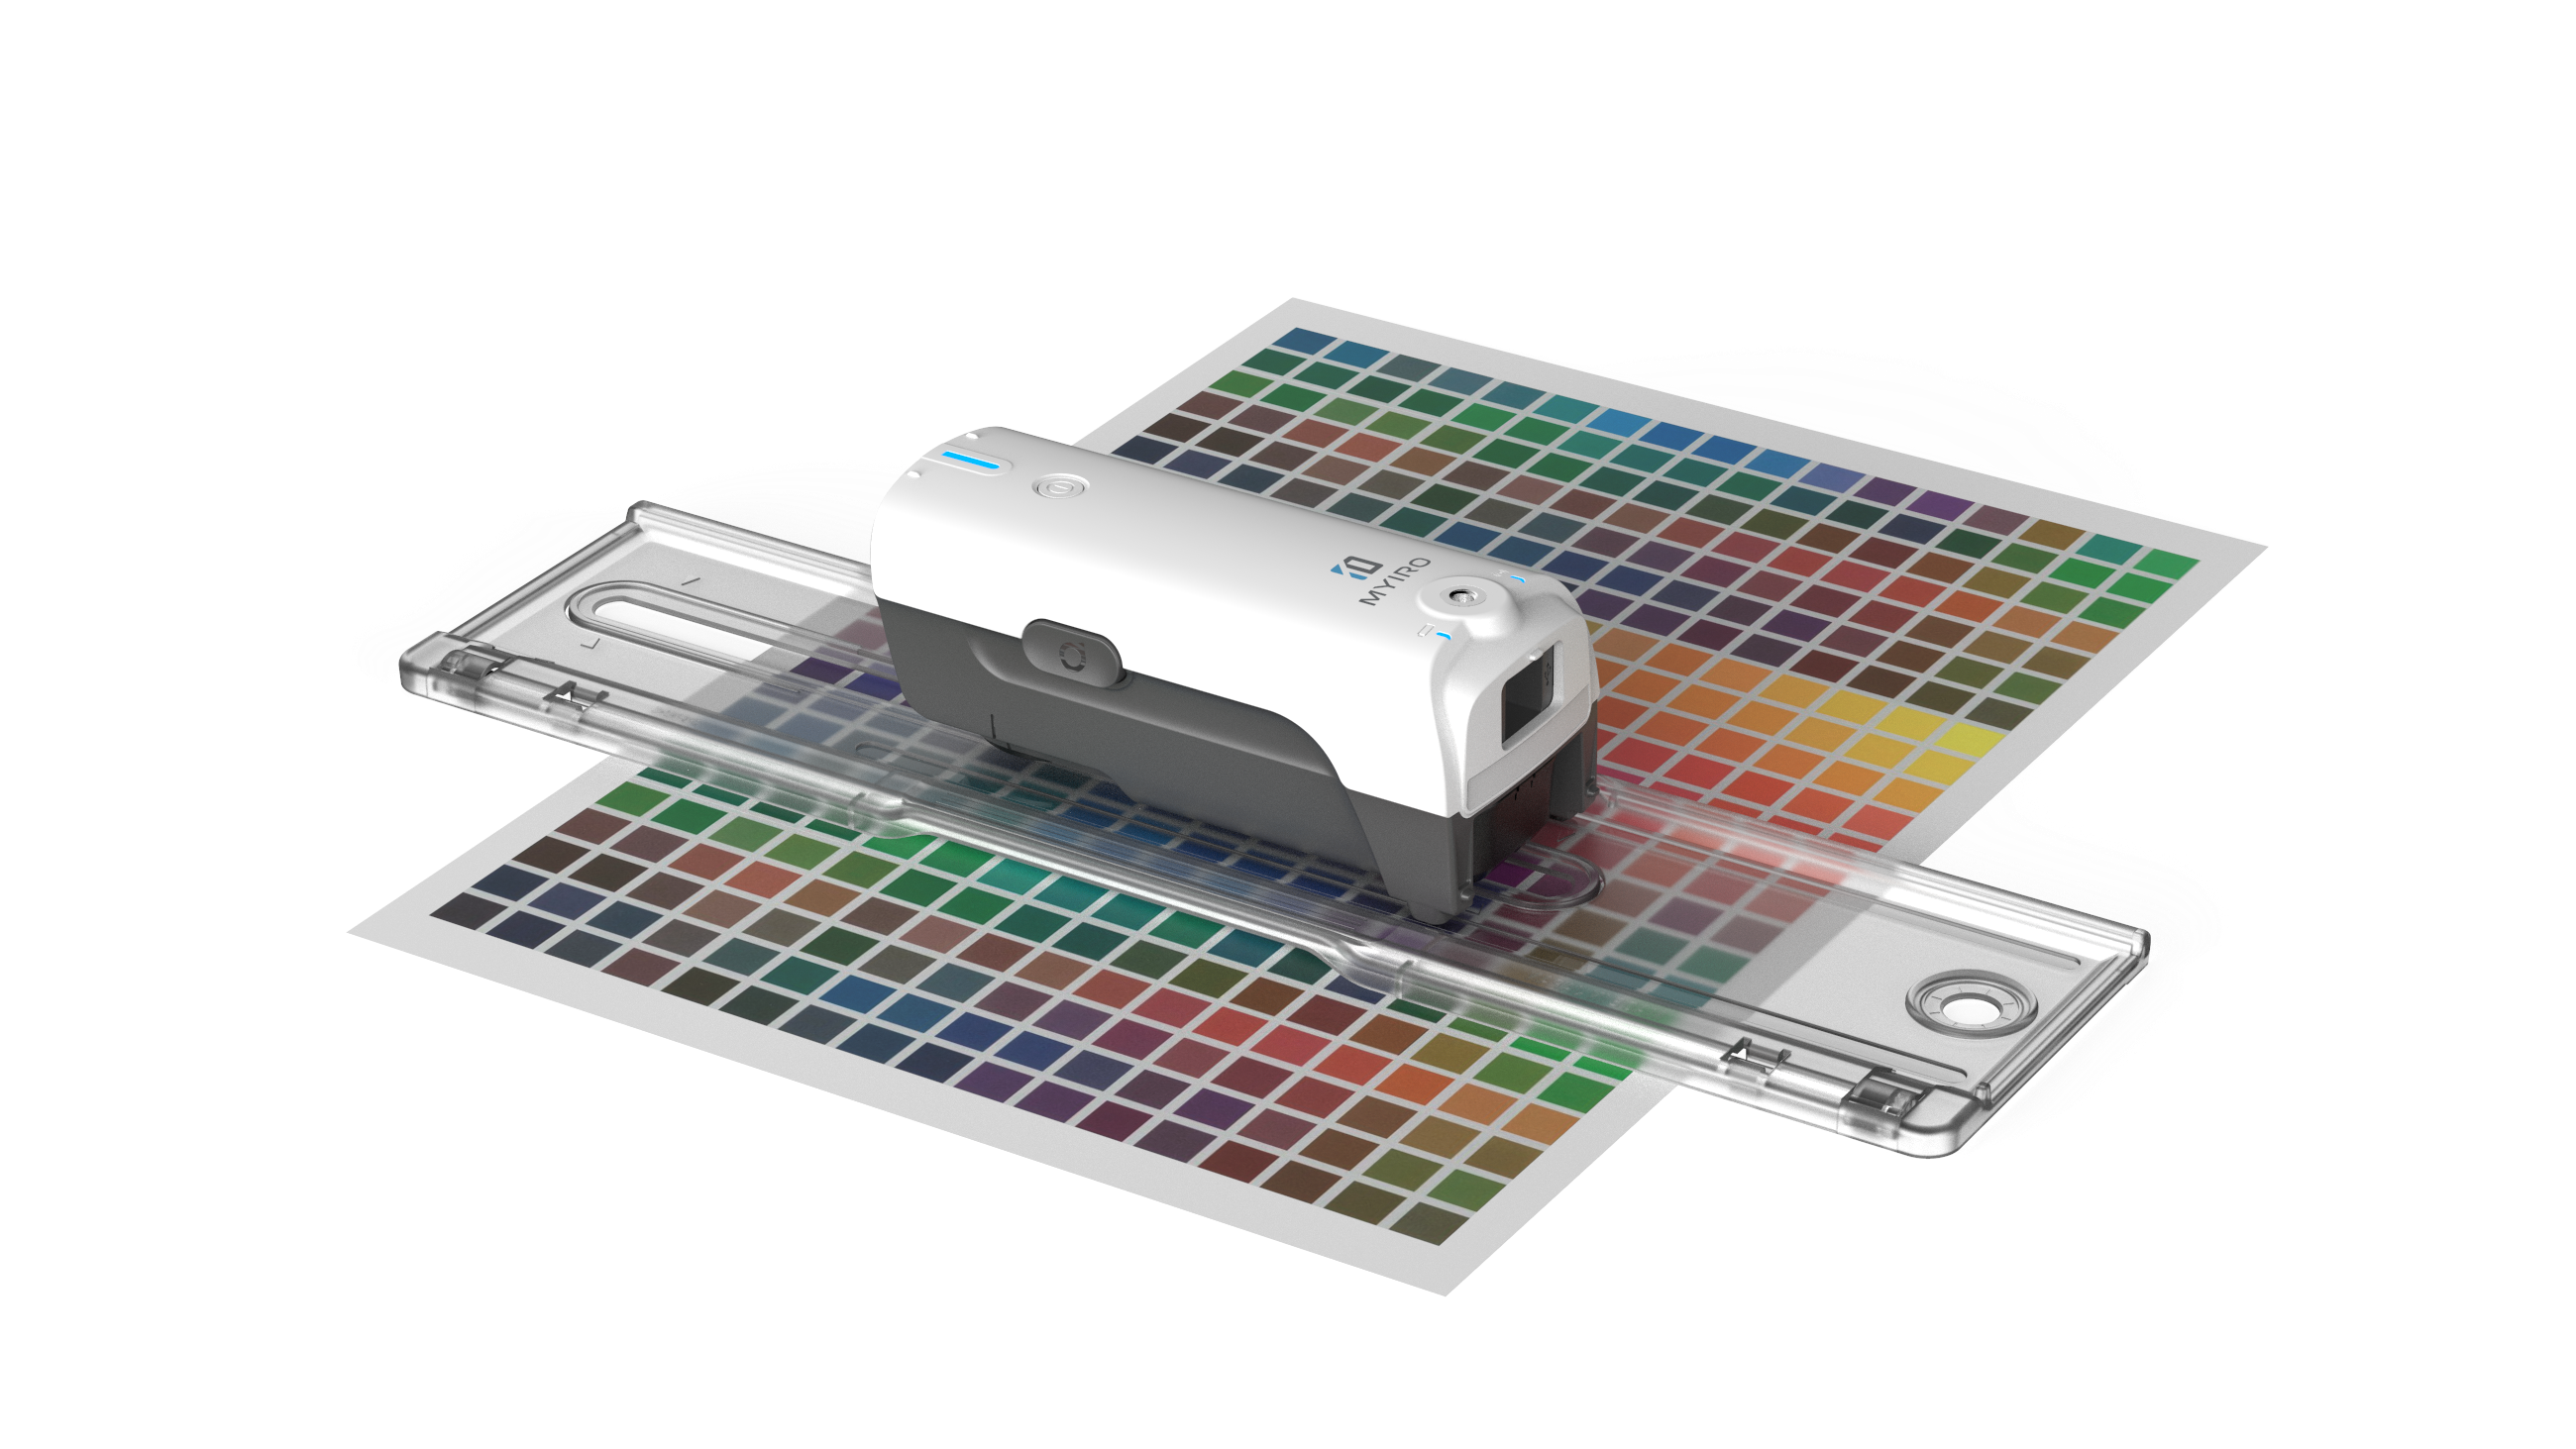
The XRite I1 Pro type spectrophotometer and Konica Minolta Myro
| XRite I1 Pro | Konica Minolta Myiro |
|
|
|
Functions:
- Target measurement to calibrate and characterize printers
- Spot measurement of flat and opaque color samples (spectral measurement)
- Illuminant measurement (spectral measurement)
- Screen and video projector calibration
- Density measurement - Color
search
- Compare colors (Delta E)
- etc ...
These spectrophotometers do not have a screen and need to be connected to a computer equipped with software (Coraye for example).
The spectrophotometer in itself is only a measuring device and the functions depend on the software which controls it.
Find out more about the different spectrophotometers and how they work
How a spectrophotometer works
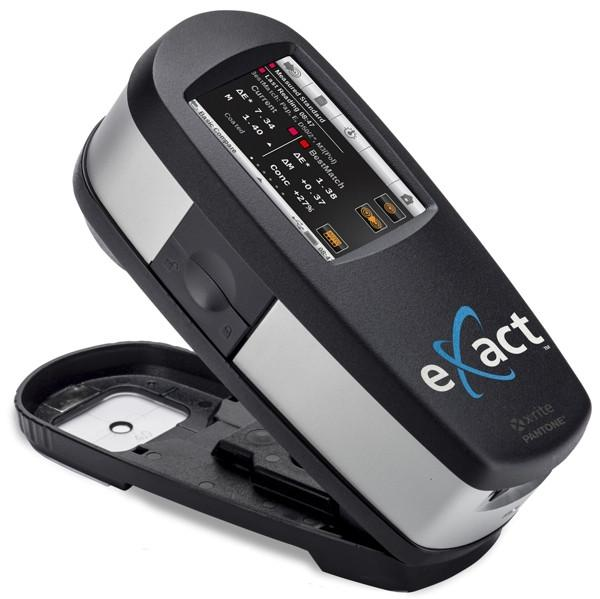
XRite eXact type spectrodensitometers
This instrument is generally used in offset printing, flexography, gravure printing workshops, etc.
It is used to:
- Measure densities, fattening.
- Measure color samples
- Carry out color research - Check
the whiteness of a paper
- Compare colors, densities
- etc ...
It is an autonomous spectrophotometer with a screen and on-board software.
This spectrophotometer can also be connected to software to extend its possibilities.
Automatic spectrophotometers
These spectrophotometers are generally used to calibrate printers.
They require software to drive them.
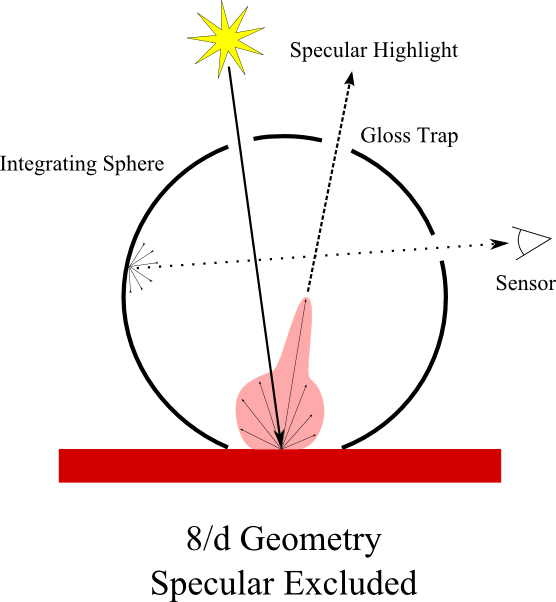
Sphere spectrophotometer
These spectrophotometers make it possible to measure complicated materials such as the sheet metal of cars, fabrics or reflective materials.
It makes it possible to dissociate the specular relection (shiny surface) and the diffuse reflection (rough surface)
It is an autonomous spectrophotometer with a screen and an on-board software.
This spectrophotometer can also be connected to software to extend its possibilities.
Colorimeter or calibration probe
This colorimeter is used to calibrate screens and video projectors only.
Densitometer
Densitometers are workshop instruments that only measure densities, in other words, the opacity of an ink or a medium.
It does not provide a color value like spectrophotometers or spectrodensitometers do.
Densitometers have been replaced by manufacturers by spectrodensitometers.
For more information, see the chapter: Displaying the density
M0, M1, M2, M3 modes
Fluorescent effect of optical brighteners
Optical brighteners (or OBA for Optical Brightening Agent) are components added to the print medium to make them appear “whiter than white”. The principle is quite similar to that of bluing additives in detergents. OBAs capture ultra violet (UV), these electromagnetic waves invisible to the human eye because of wavelengths less than 400 nanometers (nm), and transform them into electromagnetic waves barely visible to our eye (of lengths of wave between 400 and 450 nm). This is the principle of fluorescence. These OBAs thus reinforce the shine of the paper, even and above all, when it is not coated.
Optical brighteners also have the effect of modifying the perception of colors printed on the supports which contain them. And since these agents react to UV, the printed colors will not be seen identically when observed, under lights containing or not containing UV, and this even if the two light sources have the same white temperature. This phenomenon is reinforced by the fact that the components of colored pigments used in offset or digital printing can also be subject to the phenomenon of fluorescence.
The image below shows the three combined spectral curves M0, M1 and M2 of the measured color of a support devoid of optical brightener.

The following image shows the three distinct spectral curves M0, M1 and M2, of the measured color of a support containing optical brighteners.

- the spectral curve M0, in blue, is that of a measurement according to an illuminant containing non-normalized UV;
- curve M1 in red that of a measurement according to an illuminant D50 containing UV under control;
- the M2 curve in green excludes the fluorescent effects of UV.
ISO 3664 (which sets the visual examination conditions for graphic arts and photography) has, in its 2009 revision (ISO 3664: 2009), strengthened the UV content of the illuminants used and very precisely targeted the tolerances required. regarding. The standard D50 neon light tubes, delivered today on the market (which equip, for example, illuminated desks at the press outlet) therefore contain enough UV to excite the OBAs possibly contained in the printing supports. From the fluorescence point of view, the appearance at press output of the colors printed on this type of support is therefore now closer to what it will be in natural daylight. (The sun naturally emits UV rays, sunscreen suppliers know this well!)
A series of standard color measurement condition
ISO 13655: 2009, devoted to spectral measurements and colorimetric calculations relating to images in the graphic arts, has therefore defined four standard conditions for measuring color called M. They run from M0 to M3, knowing that condition M1 is declines according to two measurement methods.
M0 is the standard condition used by most measuring instruments today. This condition is intended to be and to remain compatible with these existing instruments and, as such, is imprecise both in its definition of the measurement conditions and in the UV content of the illuminant used. The many color measuring instruments that use an illuminant close to the CIE A standard (2856 ± 100 K incandescent lamp) therefore target the M0 mode (or vice versa).
M0 thus makes it possible to measure color charts in a “traditional” way without taking into account the action of OBAs or the fluorescence of the inks or pigments used. This is the mode that should be used for any measurement of compliance with ISO 12647-2: 2004.
Since M0 does not define the UV content of the illuminant used, two M0 compatible instruments can however read different values on the same color patch.
It is these sources of measurement inaccuracy that the other “M” modes aim to compensate for.
The M1 standard aims to ensure that the color measurement conditions (in terms of illuminant) correspond to the visual examination conditions in force (defined by ISO 3664: 2009). The illuminant D50 adopted by ISO 3664: 2009 has a UV component which will excite any OBA of the support as well as the fluorescence of inks and toner. The resulting color is thus the combination of the reflection spectrum (reflectance, independent of UV) and that of fluorescence (caused by UV). It is this combined color that needs to be measured.
M1 method 1 . The simplest method (in theory) is to equip the measuring instrument with a D50 light source, targeting the tolerances of ISO 3664: 2009. In practice, this method is difficult to implement mainly because of the necessary miniaturization of the light source. You can't equip a mobile spectrophotometer with a neon tube like you equip a light booth!
M1 method 2. To overcome the difficulties in implementing method 1, ISO 13655: 2009 proposes a second method which aims to differentiate the fluorescence effect of the OBAs present in the support from the reflectance effect. For this, the support is successively illuminated by an energy source containing only UV, then by a light source containing none. We can thus use these values to extrapolate quite precisely the color of the measured object as if it were illuminated according to the prescriptions of ISO 3664: 2009. This second method has the drawback of not taking into account the fluorescence due to the pigments of inks or toners. And its implementation is itself complicated by the fact that it is difficult to build UV energy sources which do not emit any waves falling within the visible spectrum.
The M2 standard is the so-called “UV-Cut” mode. It is designed to measure the color emitted in a UV-free environment or to exchange colorimetric information excluding the action of fluorescence factors. Apart from a few very restrictive applications (such as providing color rendering in a museum for example), this mode is of little use in the press room. M2 compatible spectrophotometers are simply equipped with an anti UV filter to perform their measurements.
Finally, the M3 standard is a suitable mode for predicting the printed color in dry ink. In offset, the inks, once dried, exhibit a reduced gloss vis-à-vis the wet ink. M3 compatible spectrophotometers are equipped with polarizing filters which suppress both fluorescent effects and the gloss effects of wet inks.
Undoubtedly of all these modes, the most promising, and which moreover has been retained by ISO 12647-2: 3013, is the M1 mode. However, without even talking about the necessary renewal of the existing machine park, its operation is not a simple snap of the fingers. A phase of testing, evaluation and definition of operational protocols is therefore underway and will still take some time. This also explains why ISO 12647-2: 2013 is not yet used in standardized production.