Color management
Do you need to measure the color of a sample, monitor the light conditions to evaluate your colors, convert a color to RGB or CMYK, or perform shade searches against a PANTONE, RAL or other color chart? You are then in the right place.
- Capturing a color
- Control of an illuminant
- Color Finder
- Color Converter
- Delta Finder
- Show density
- Color measurement on a backlit screen or media
Capturing a color
Capturing a color with Coraye is very easy.
But what can we do next with our measured color samples?
How to capture the colors.
Start by connecting your spectrophotometer.
Spectrophotometer supported by Coraye's "Color Capture" module:
- XRite I1 Pro 3 & I1 Pro 3 PLUS
- XRite I1 Pro 2
- XRite I1 Pro & I1 Pro UV
- EFI ES1000
- EFI ES2000
- EFI ES3000
- Konica Minolta MYIRO
- Konica Minolta CM26d et CM25
- Barbieri LFP qb Sensing Unit
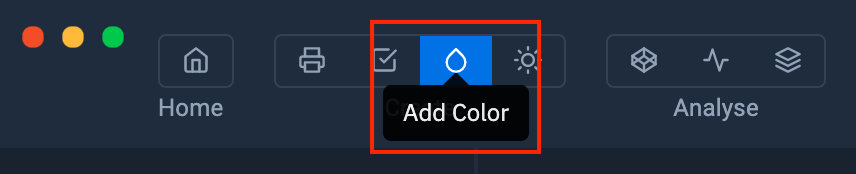
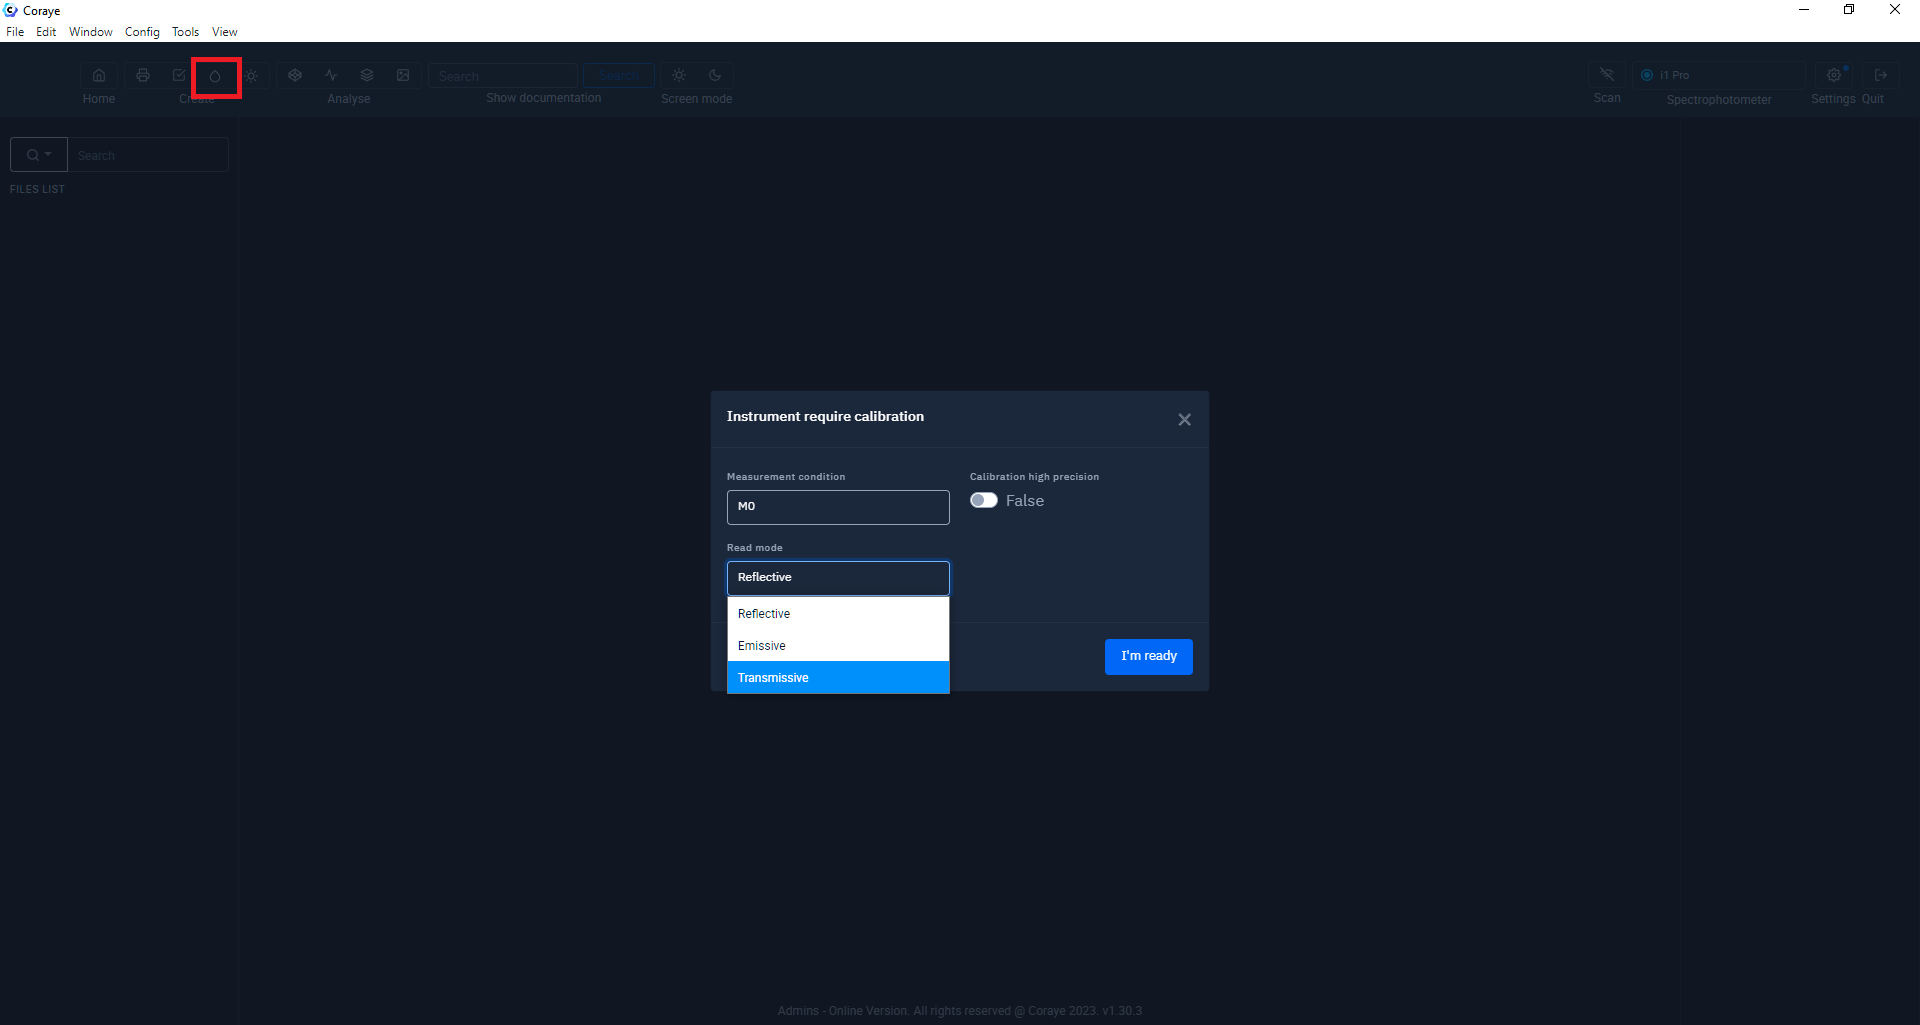
Then click on the “ Create Color ” icon located in the menu at the top left of the software.
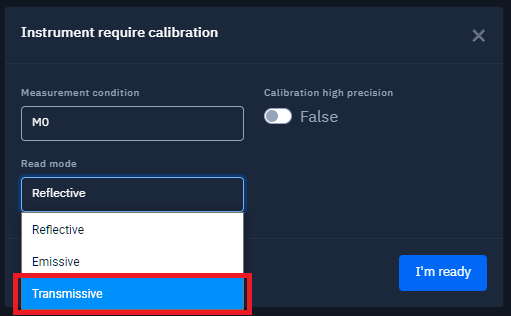
A window is displayed allowing you to define the reading conditions.
These parameters are dependent on the reading instrument you are going to use.
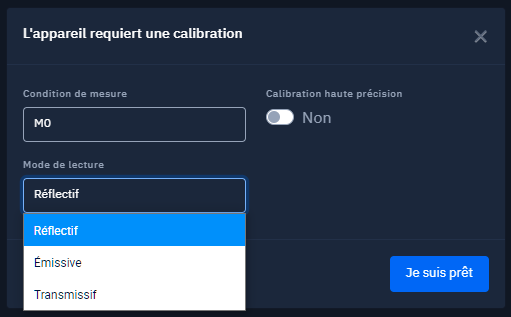
Use Reflective mode to measure on paper or material
Use Emissive mode to capture the spectral curve of a color on your screen or on backlit baklit
Use Transmissive mode to measure a color on your screen or backlit baklit.
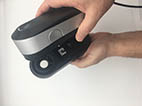
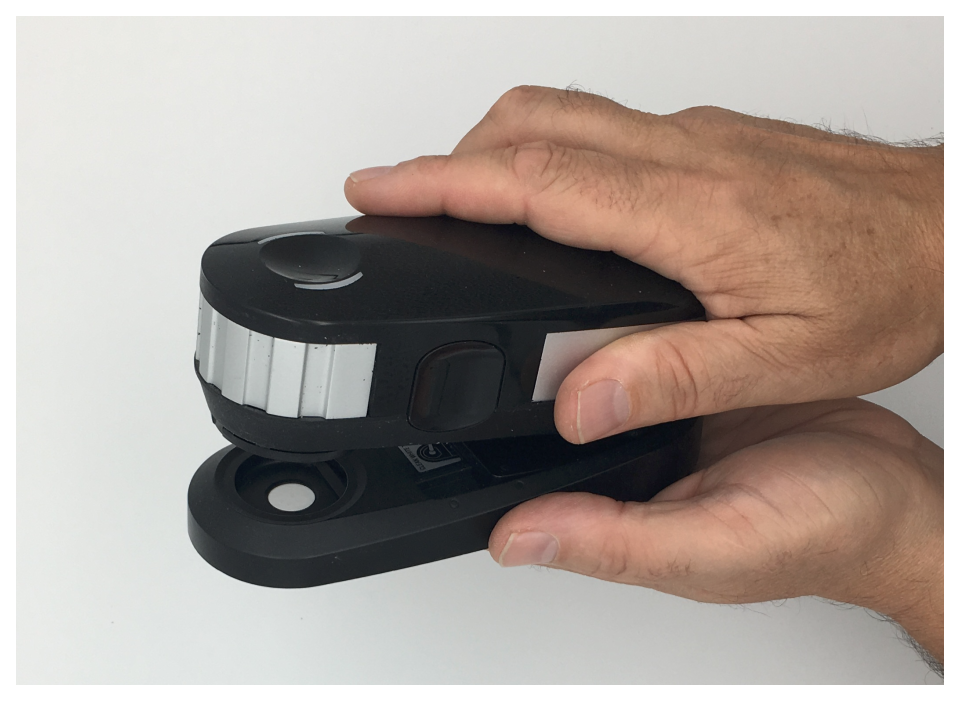
If your spectrophotometer needs to be calibrated, Coraye will ask you to start the calibration procedure.
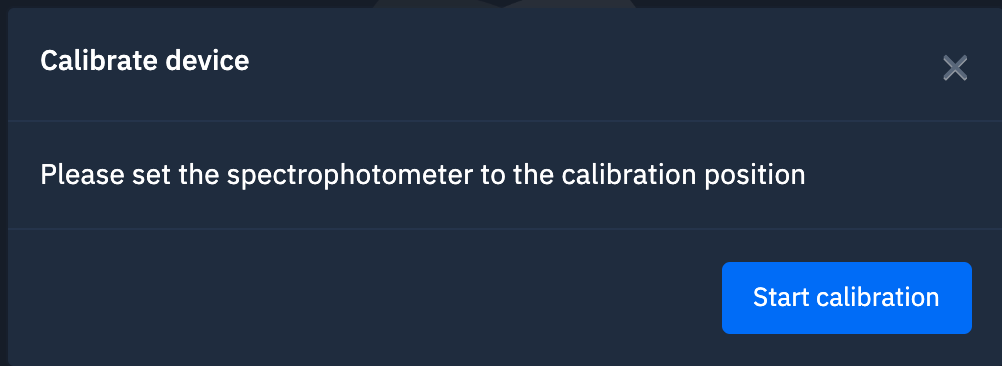
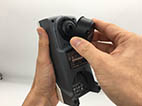
During calibration, you need to put your spectrophotometer in its calibration position.
|
Konica Minolta MYIRO |
 |
| XRite I1 Pro 3 |
|
| XRite I1 Pro 2 | 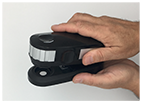
|
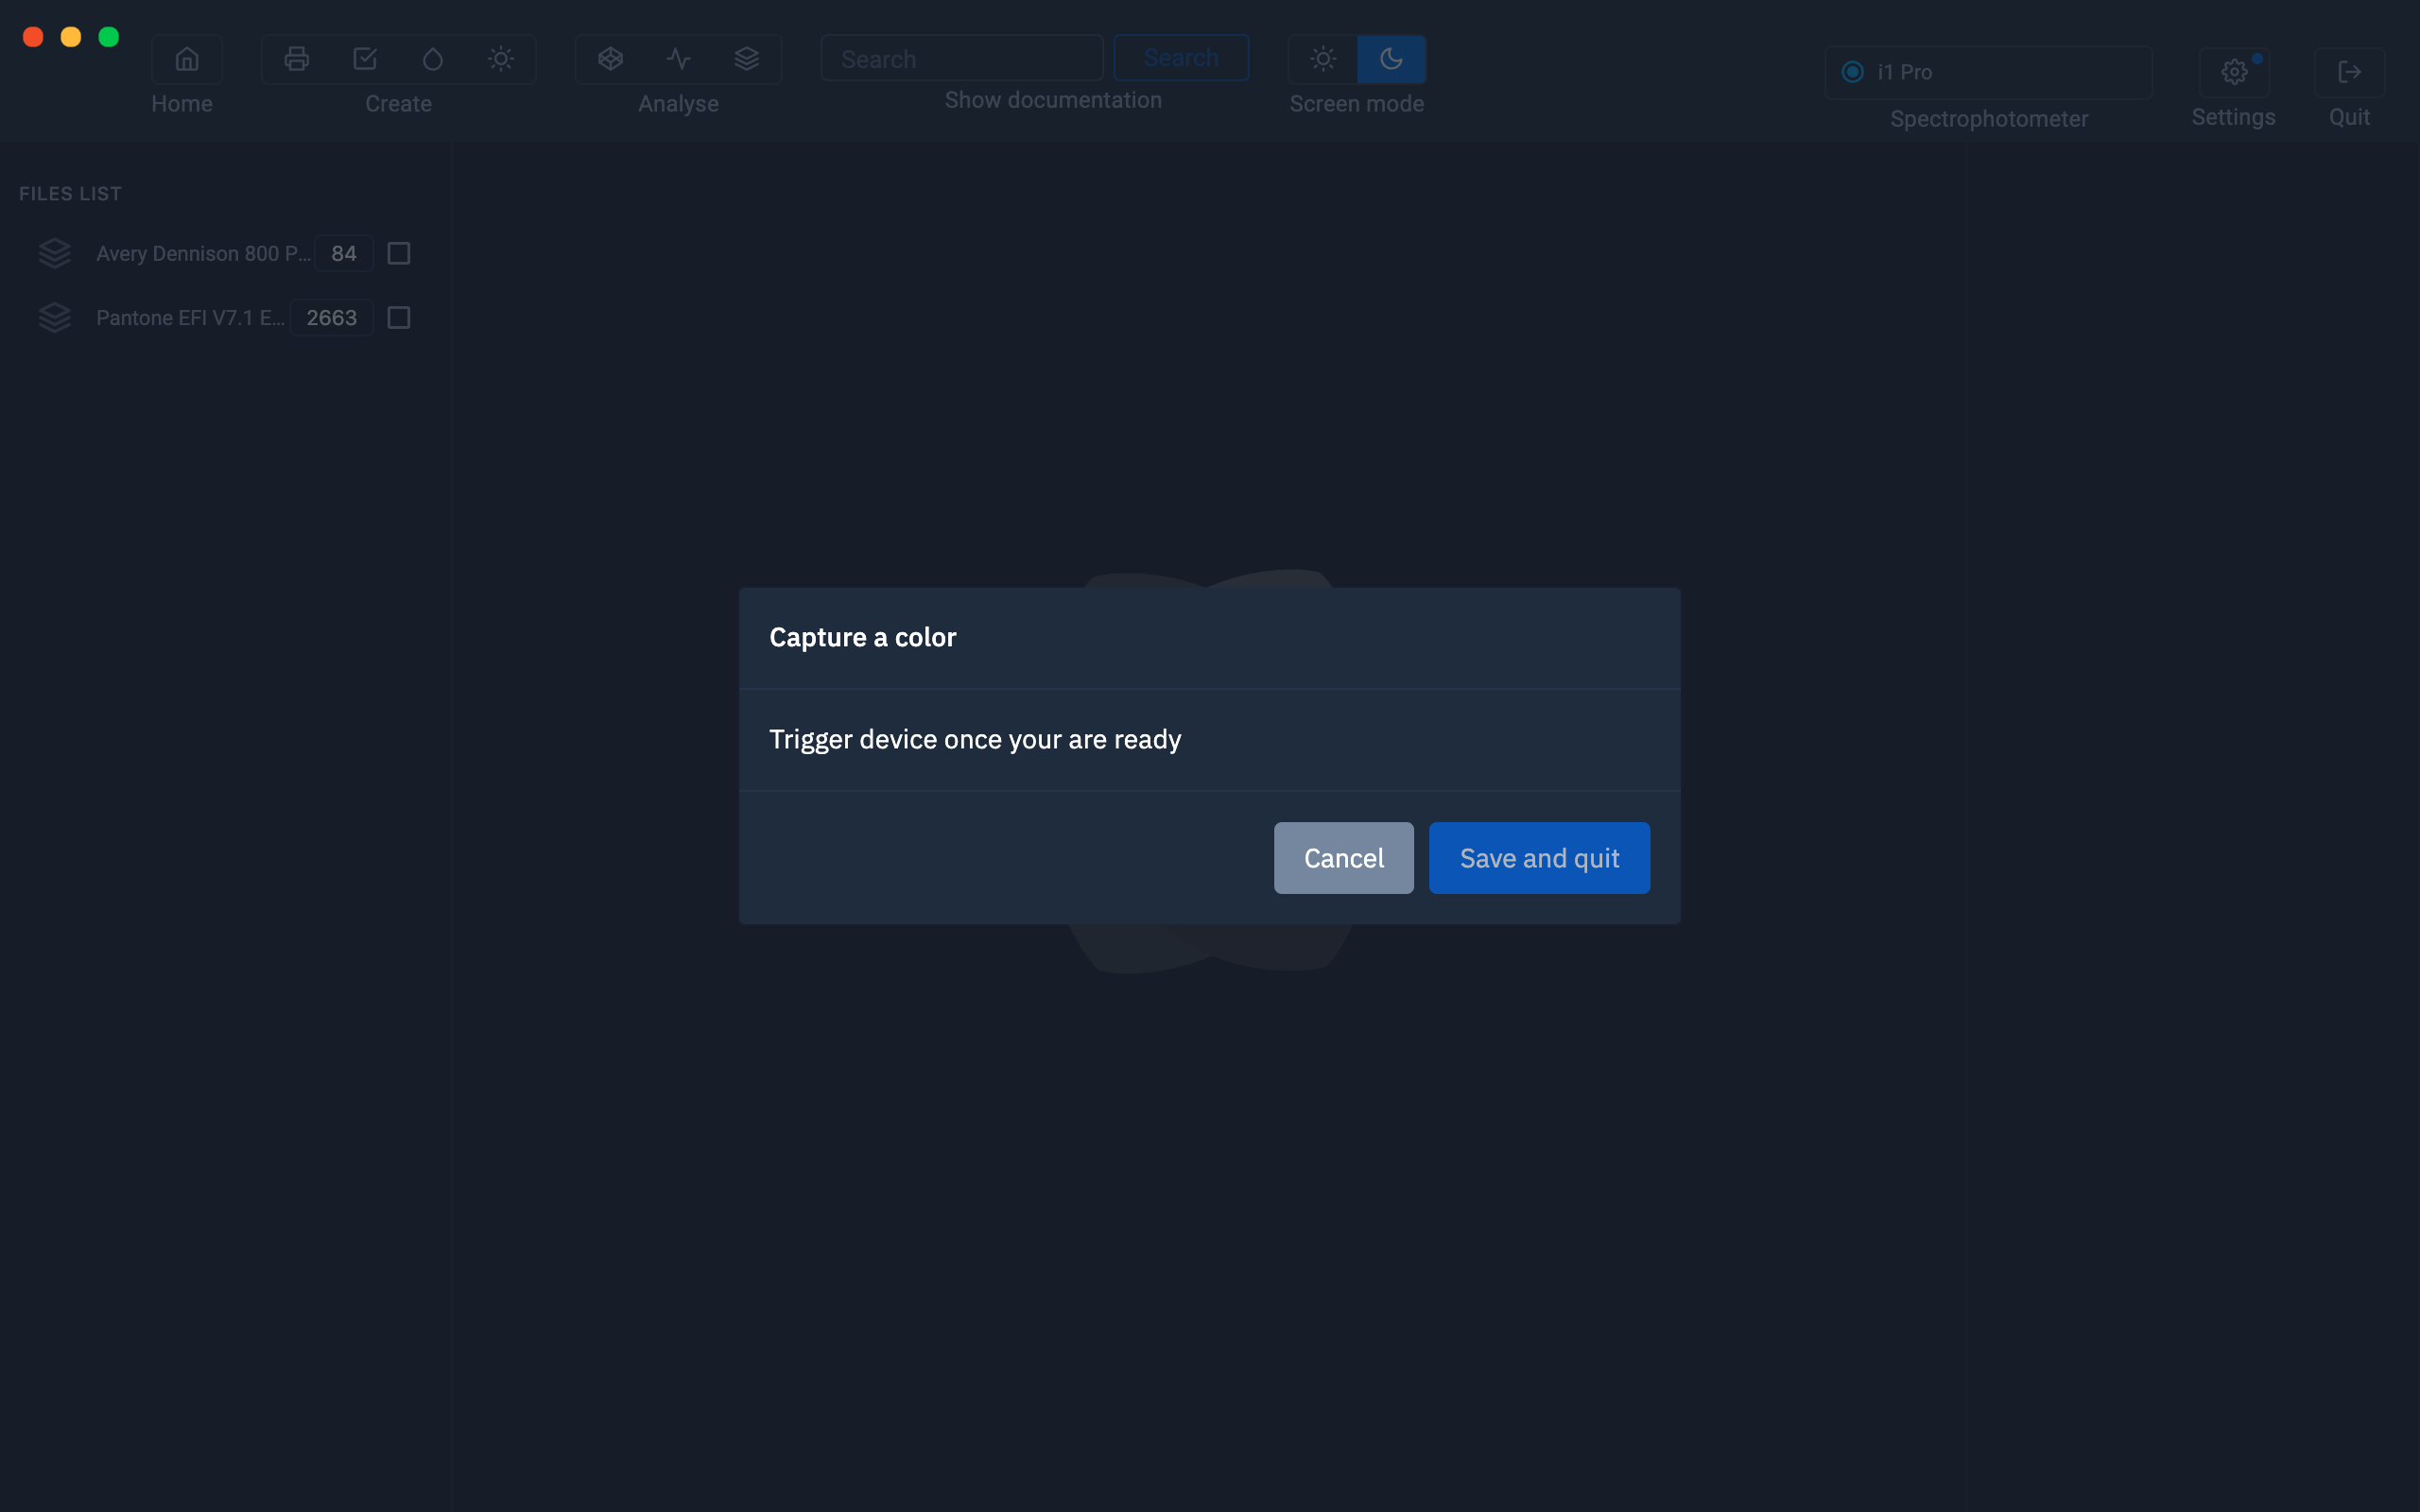
| XRite I1 Pro | 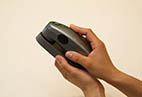 |
| Konica Minolta CM 26d | 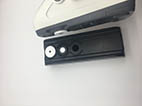 |
When the calibration is complete, you are ready to capture the colors.
| Konica Minolta MYIRO | 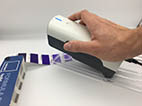 |
| XRite I1 Pro 3 | 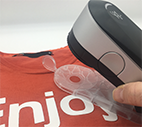 |
| XRite I1 Pro 2 | 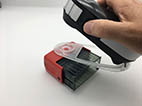
|
| XRite I1 Pro |
|
| Konica Minolta CM 26d | 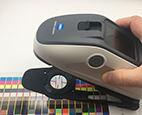 |
| Barbieri Sensing Unit LFP qb |
|

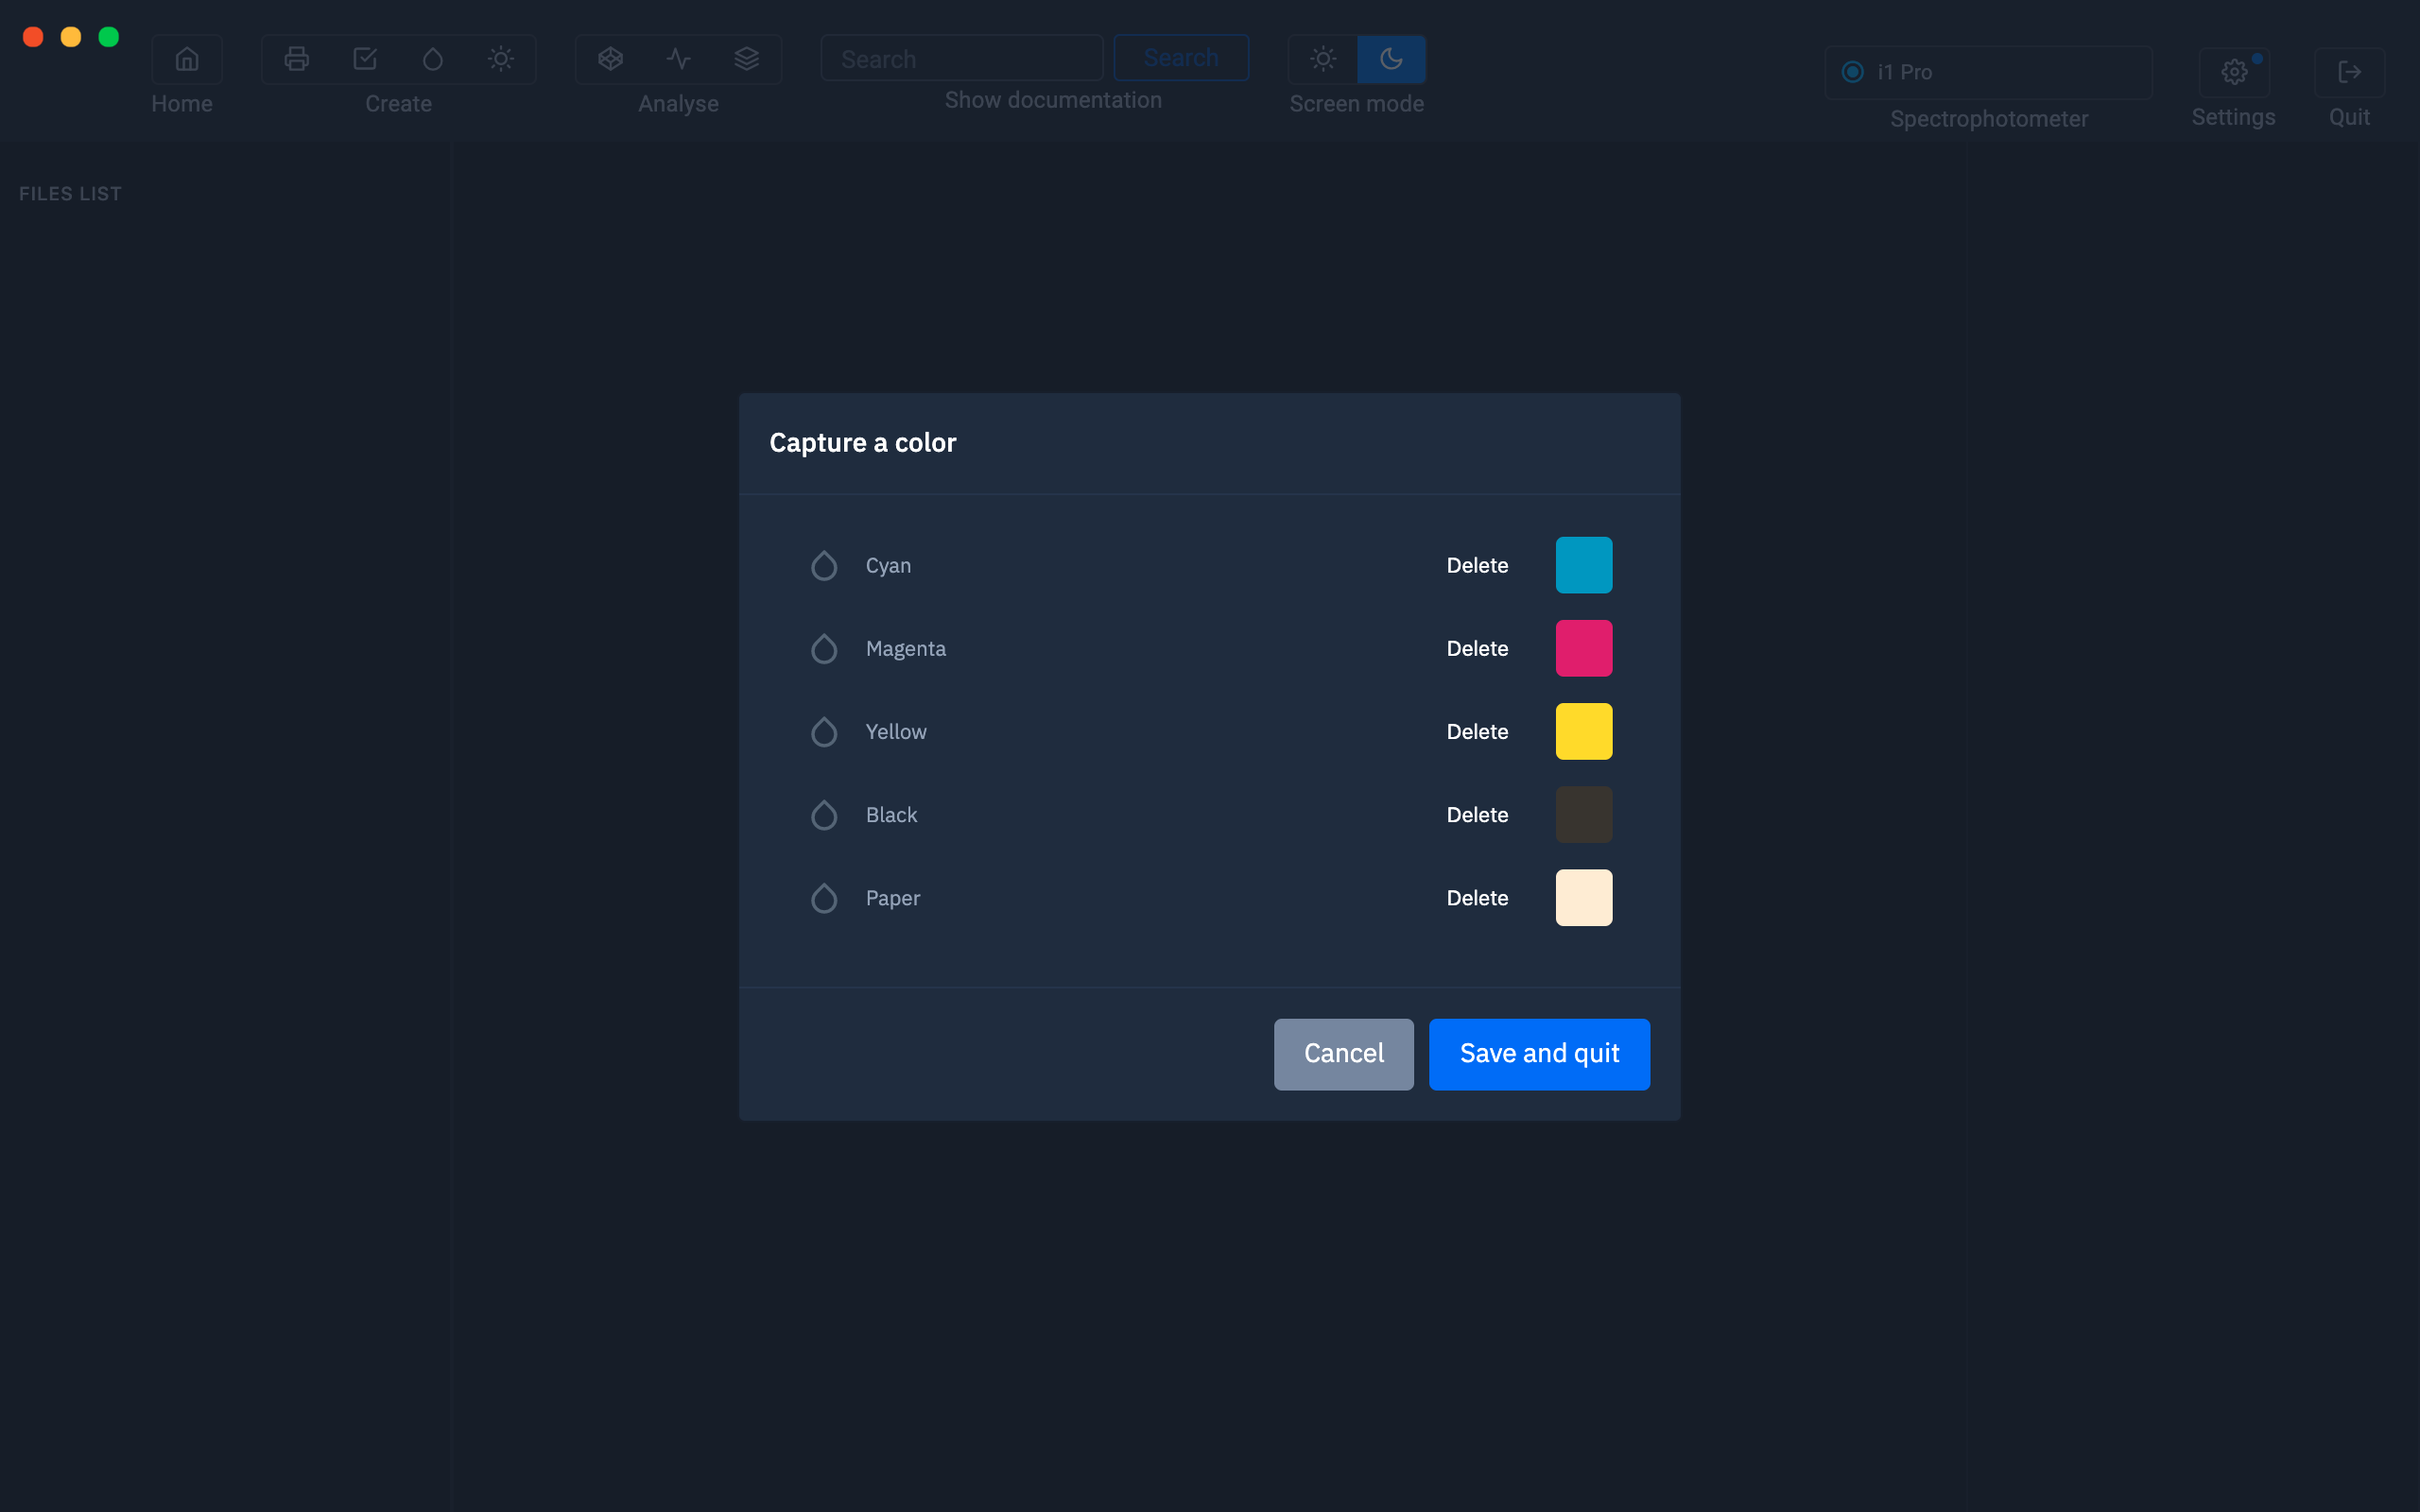
Successive measurements will be displayed one below the other.
The Lab values for each of the colors appear as they occur to help you make corrections between the actual colors of the objects (or materials) and the retouching of the images displayed on a graphic display.
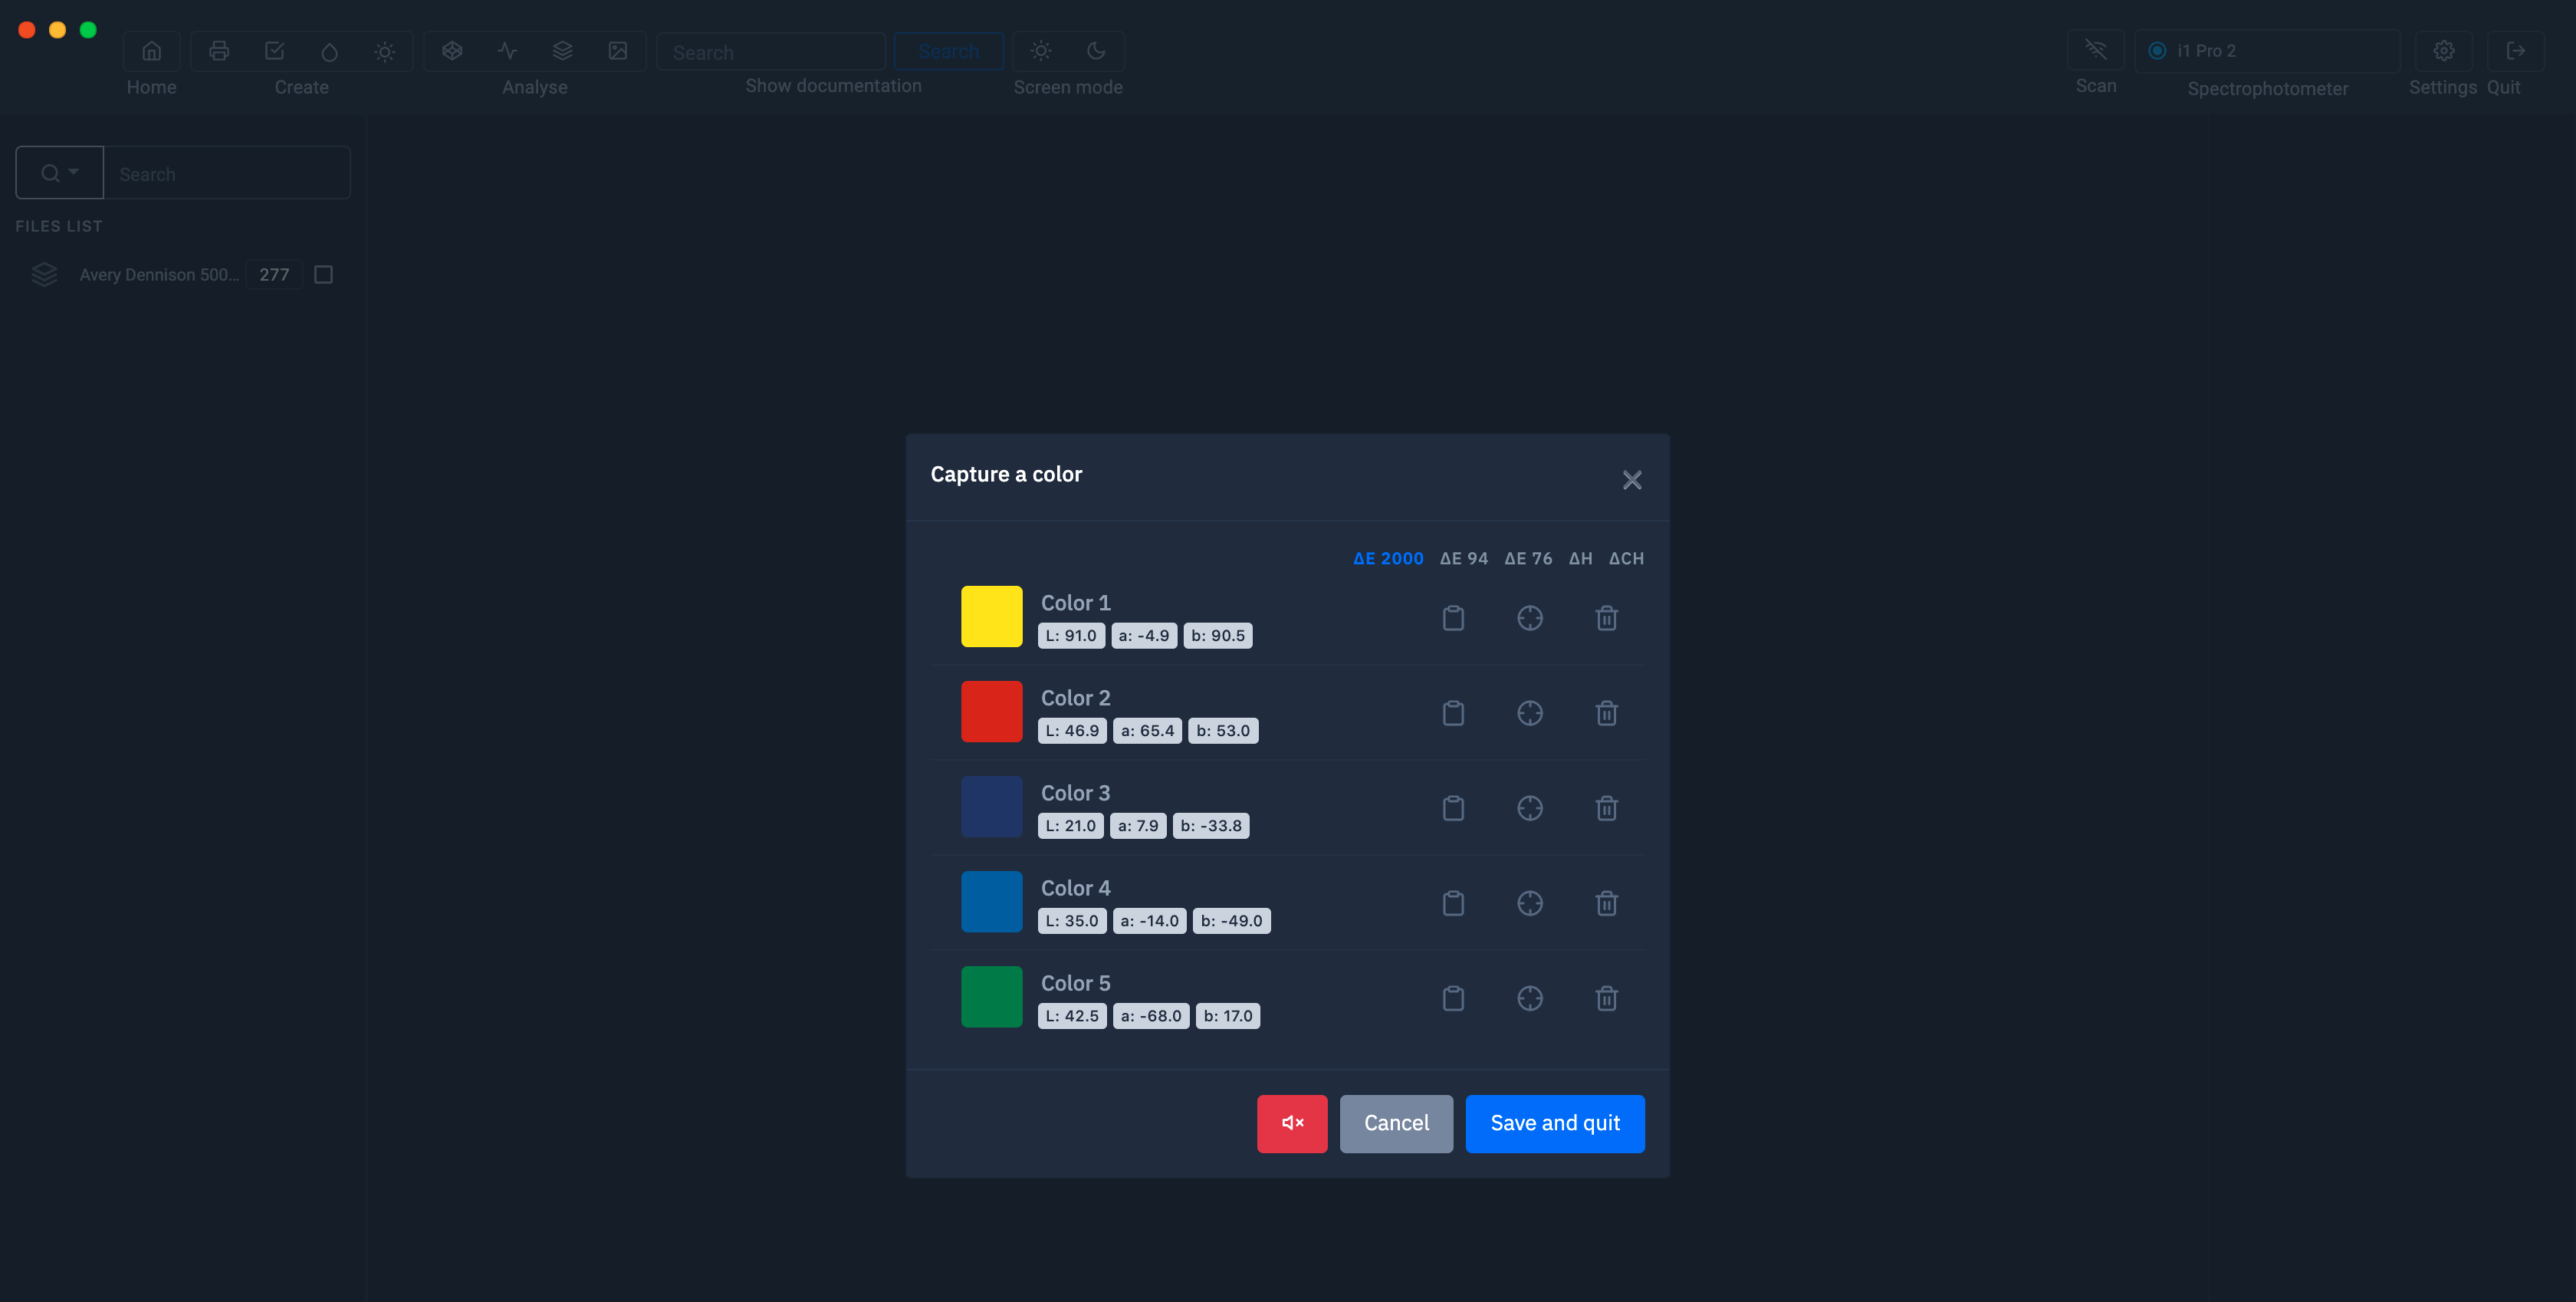
At this step, you can rename the colors before saving them.

If you want to compare colors without needing to save them, you can select the reference color and you will get the values of ∆00, ∆94, ∆76, ∆H or ∆Ch
Remember that the ∆00, ∆94 and ∆76 define the distance between two colors, the ∆Ch only takes into account the saturation and the ∆H only takes into account the hue (Hue).
For more information see chapter: Delta E

When you have finished reading and renaming your colors, you can save them by clicking “ Save and Exit ”.

Now your colors are ready to be used. But what can I do after that?
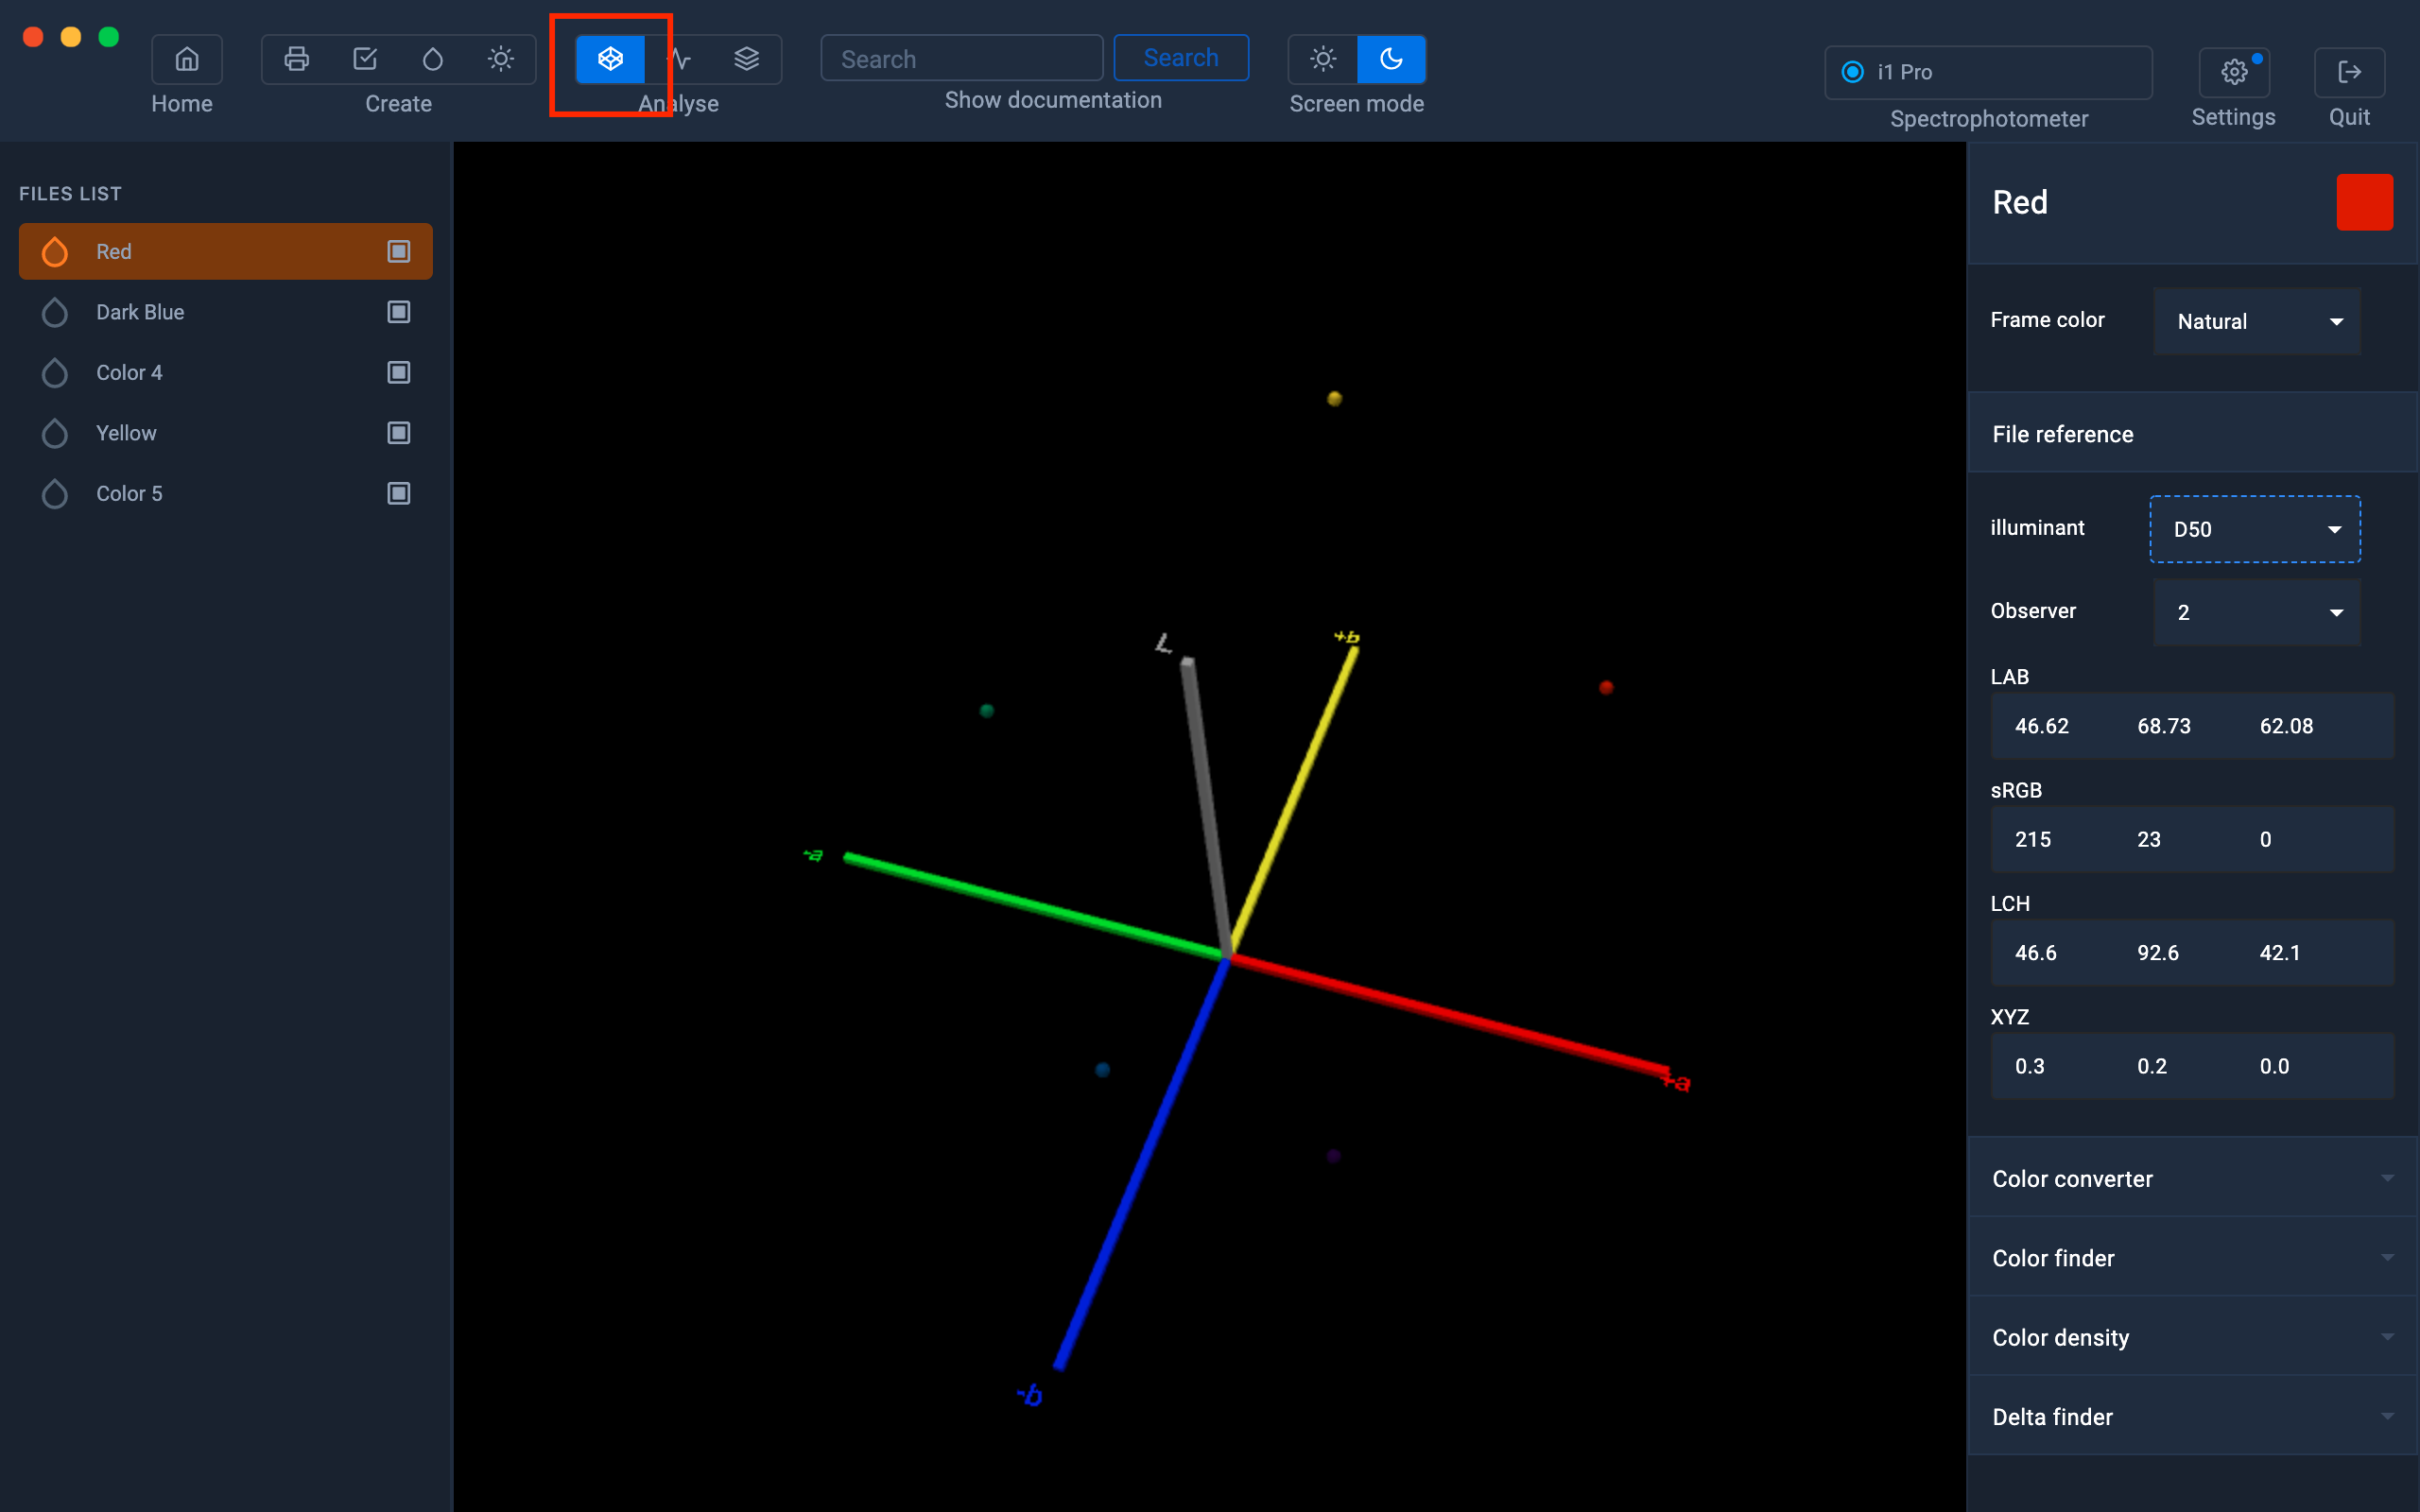
Show color information
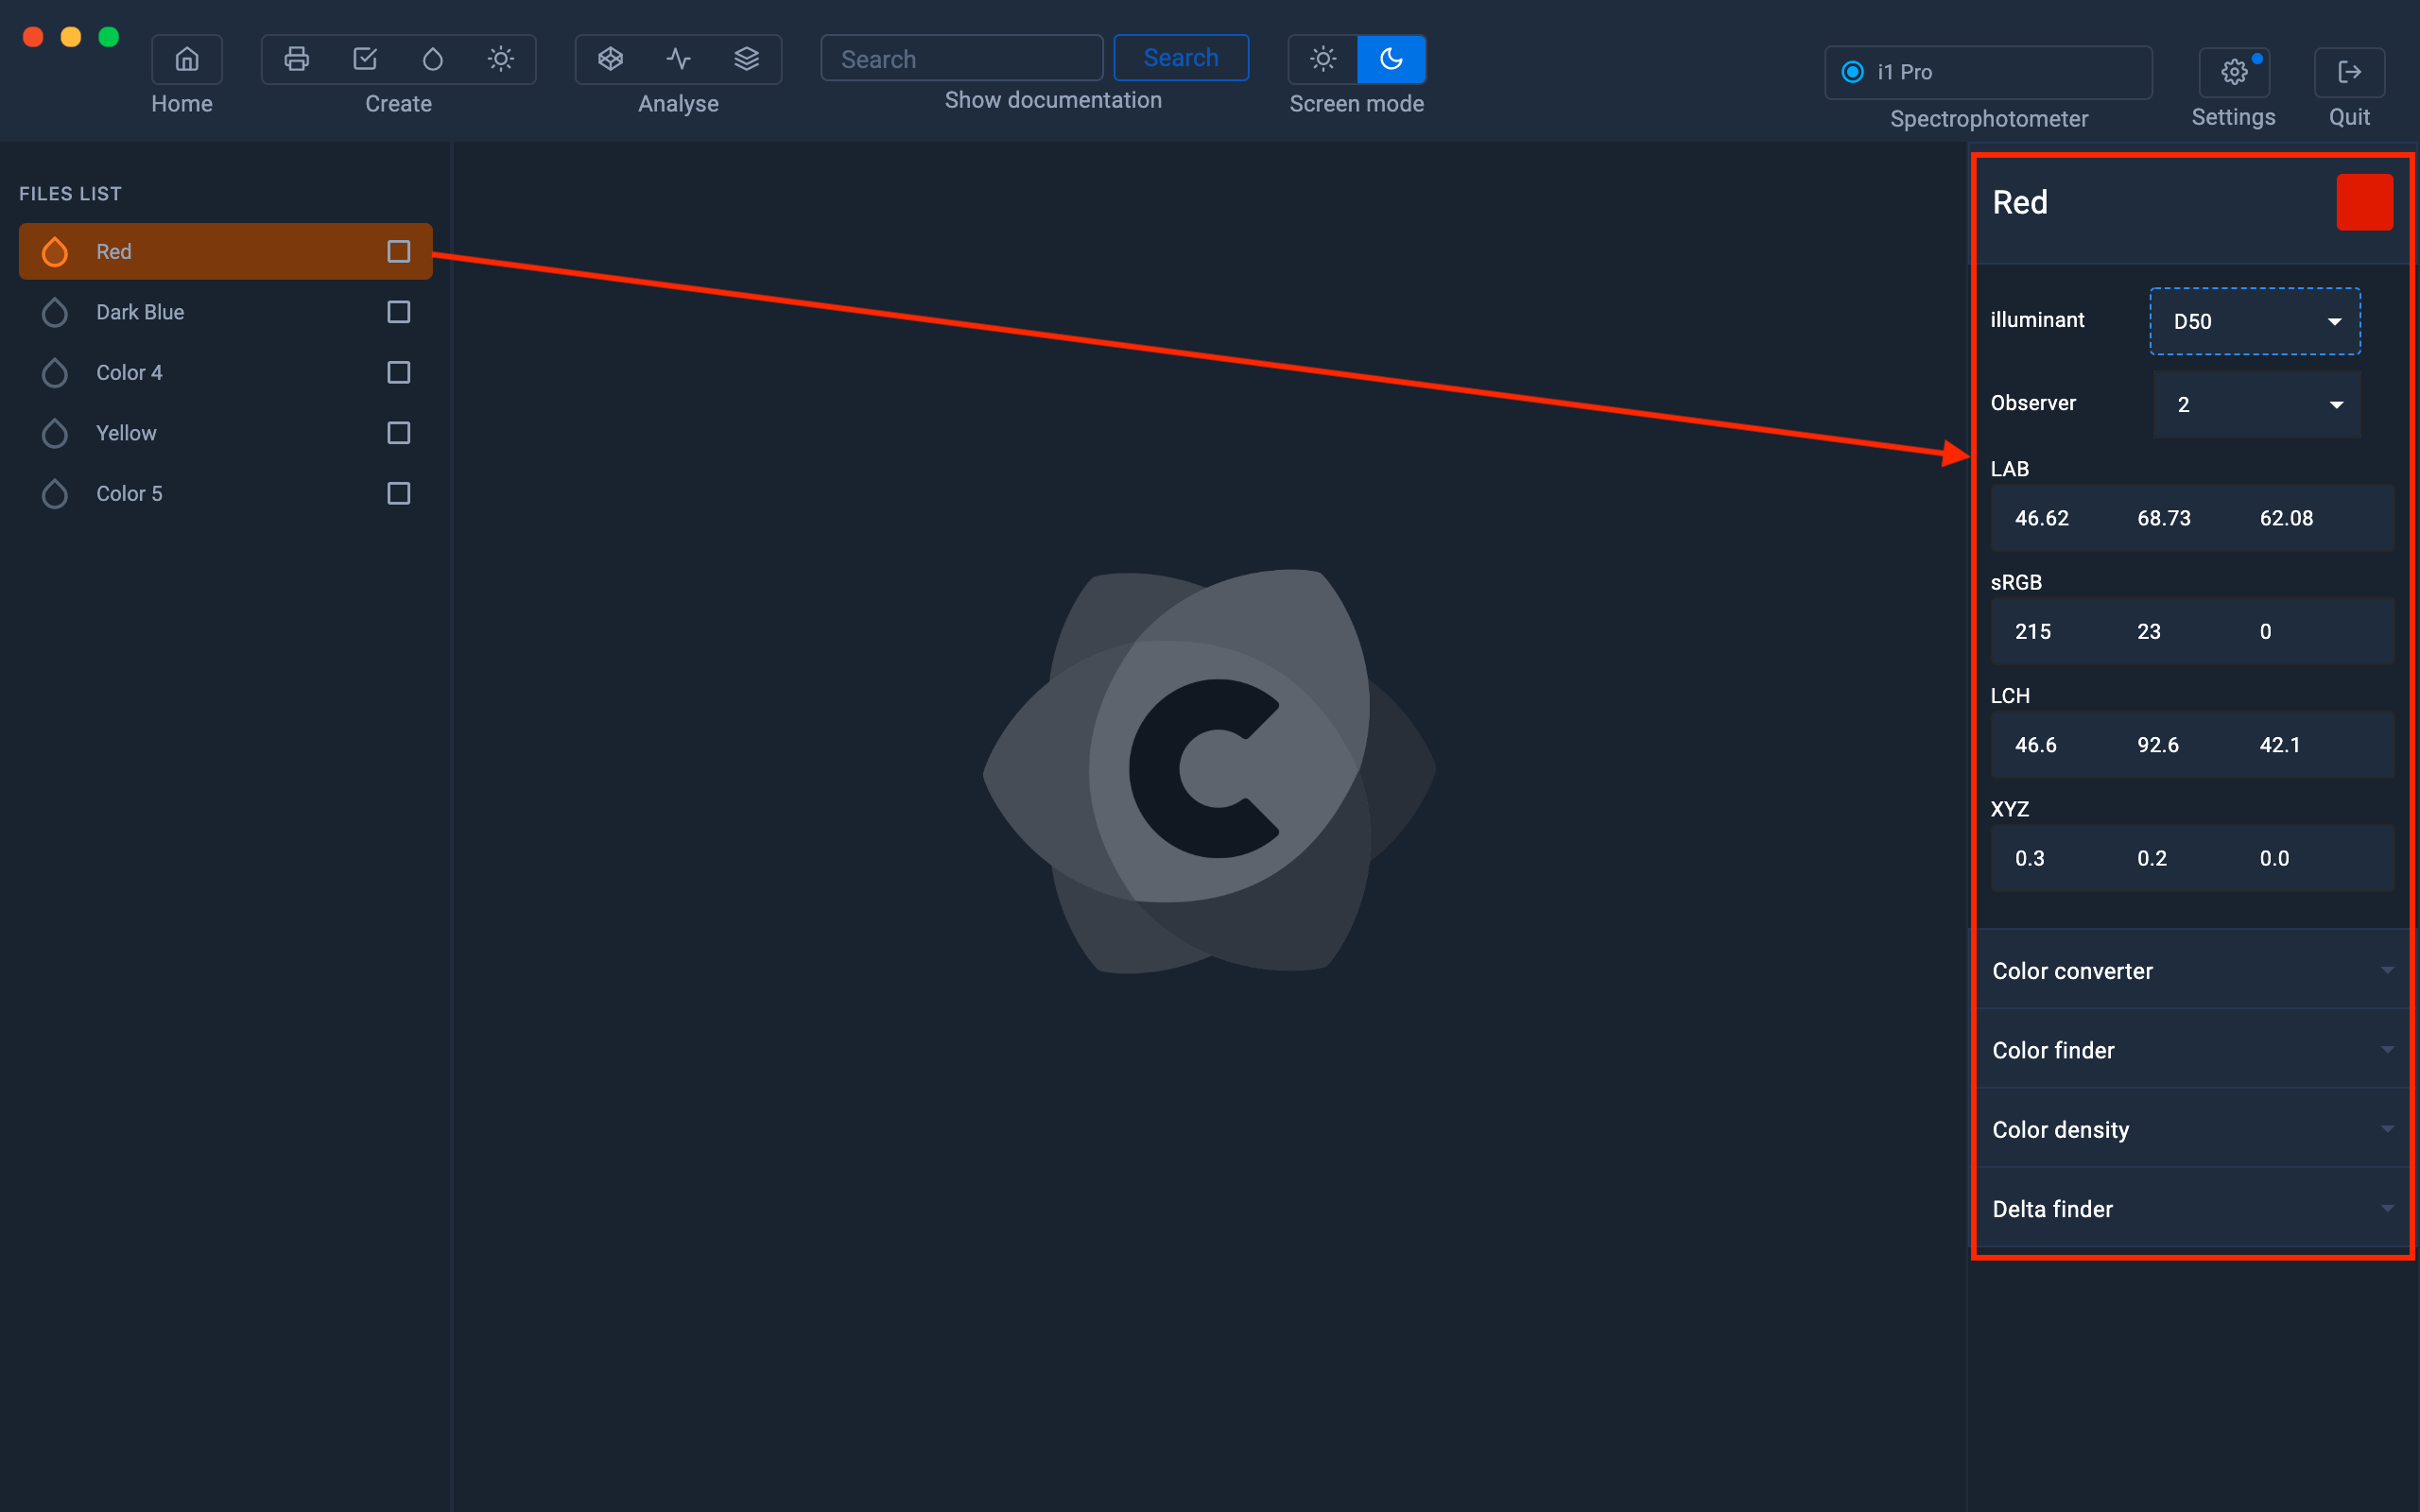
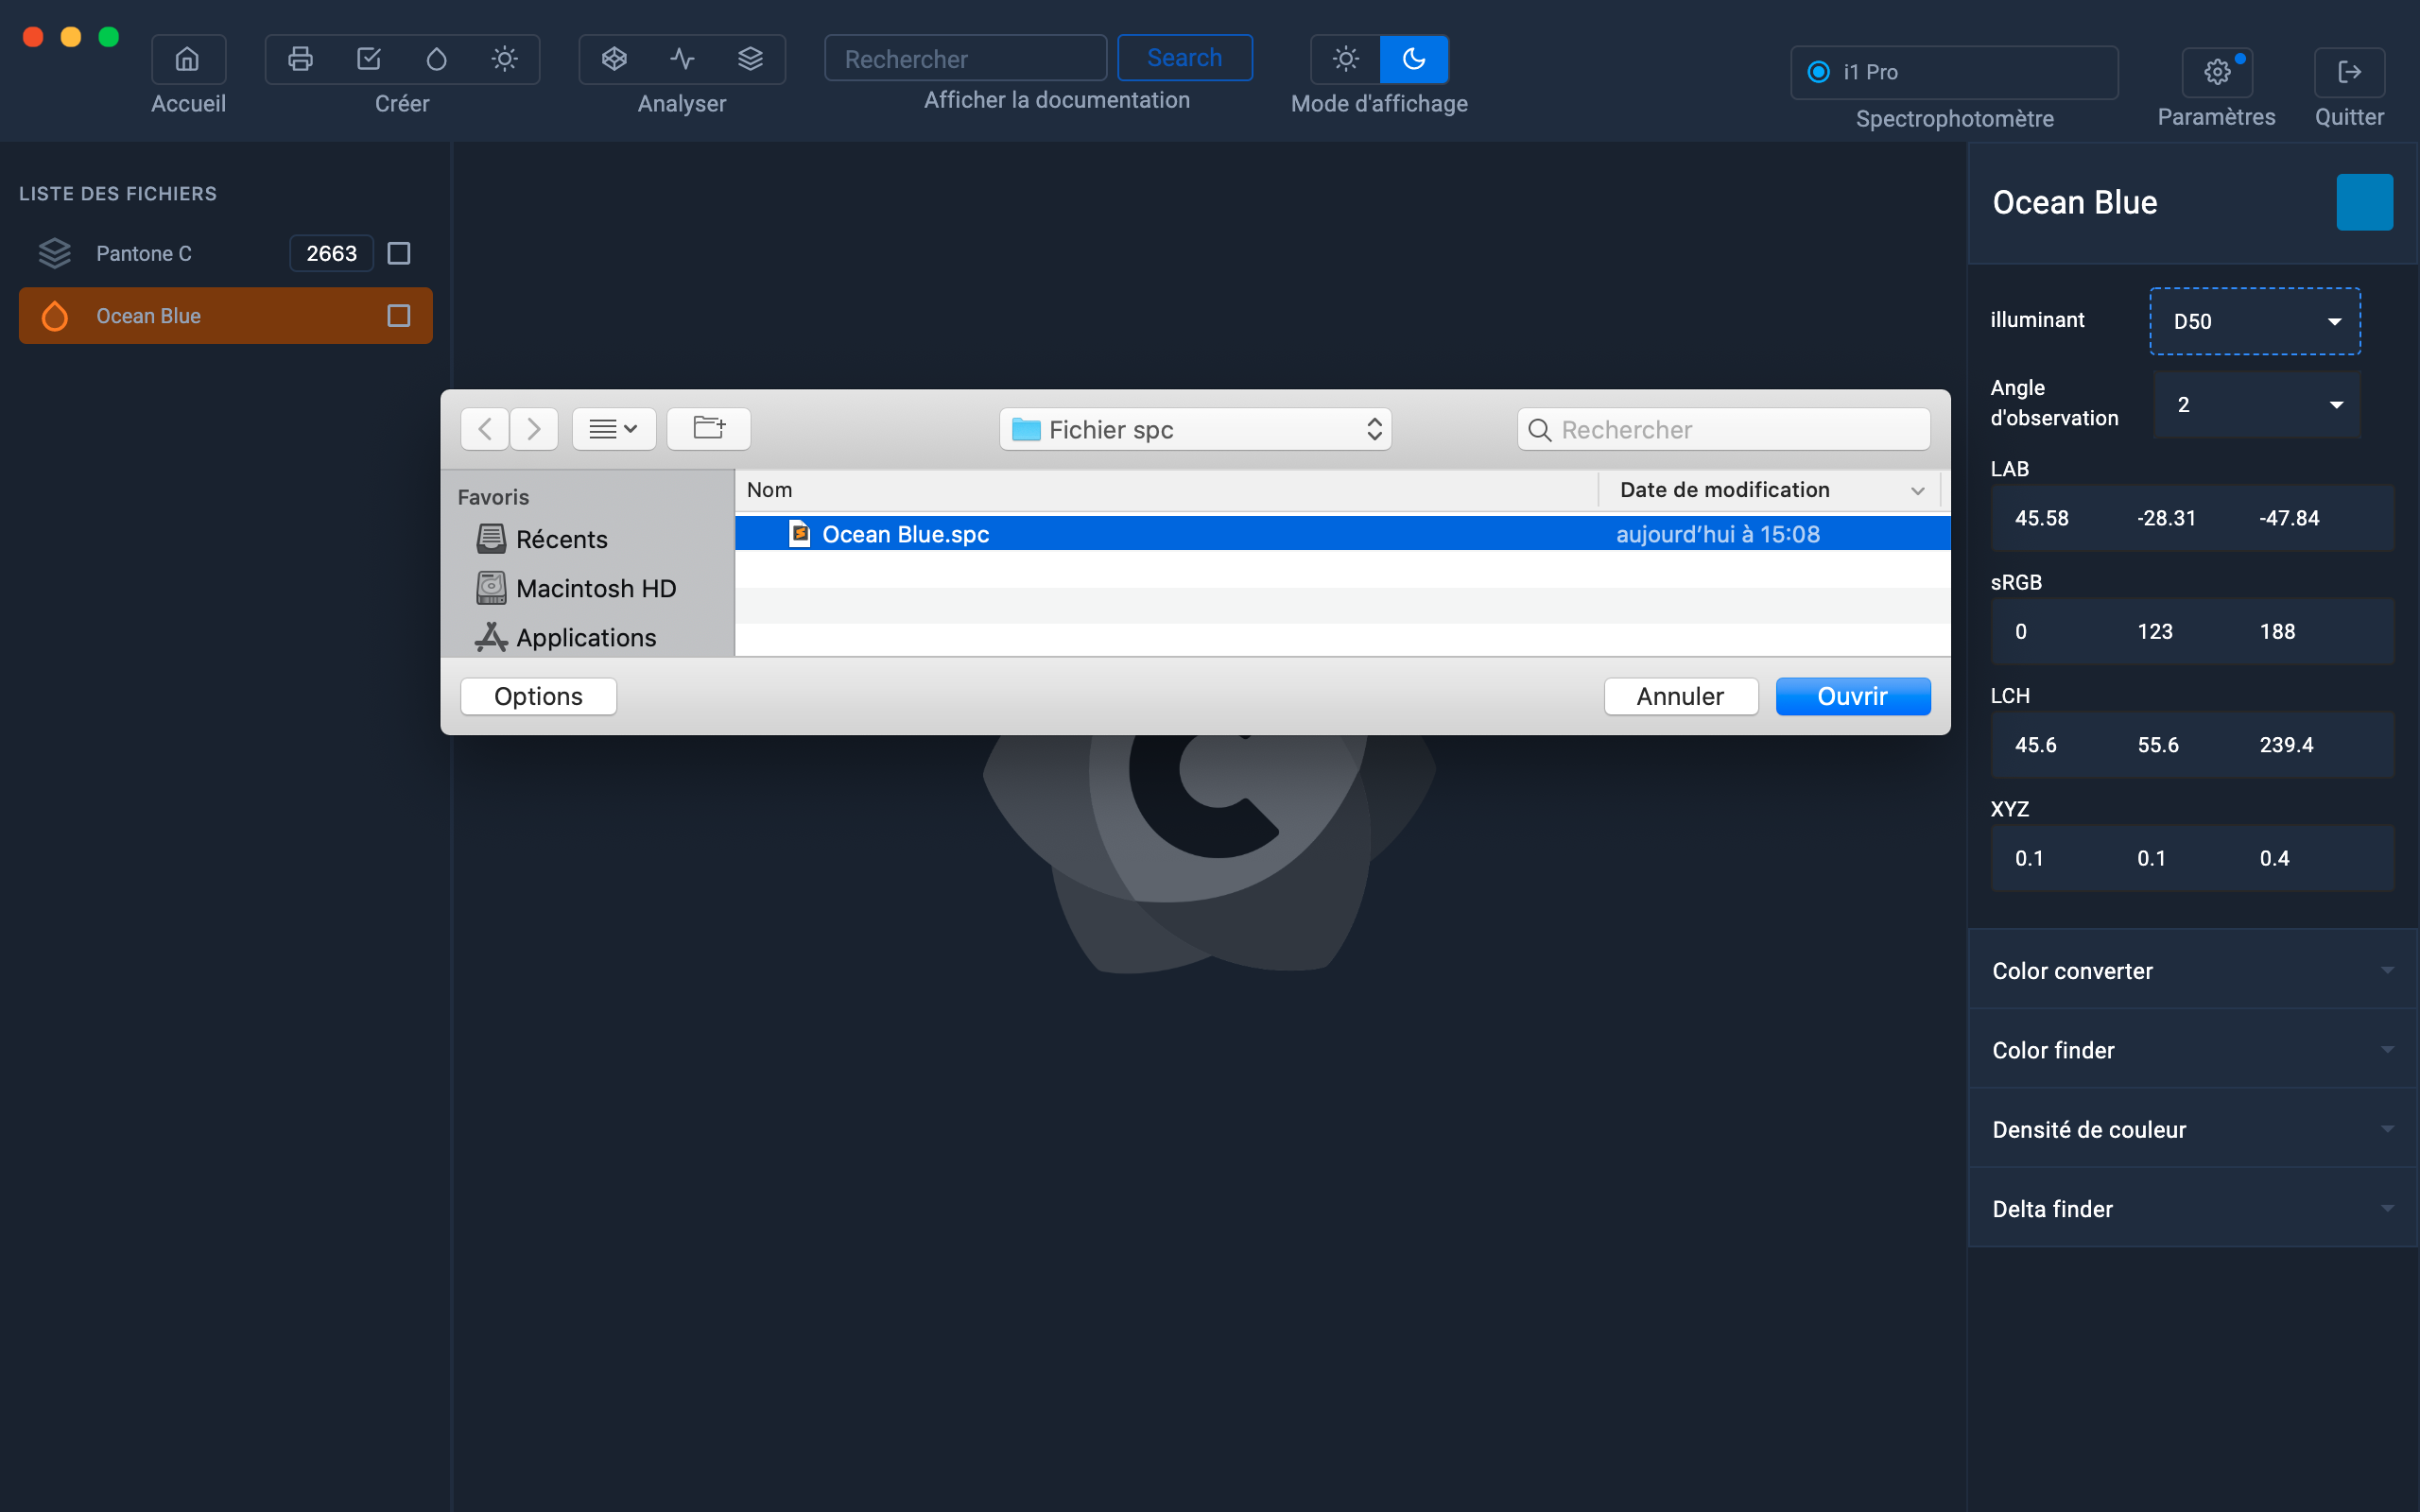
All you need to do is select a color in the left column and information about that color is displayed in the right column.
- Color preview
- LAB values
- RGB values (sRGB)
- Hexadecimal values (sRGB web space)
- Lch
values - XYZ values
- CMYV density
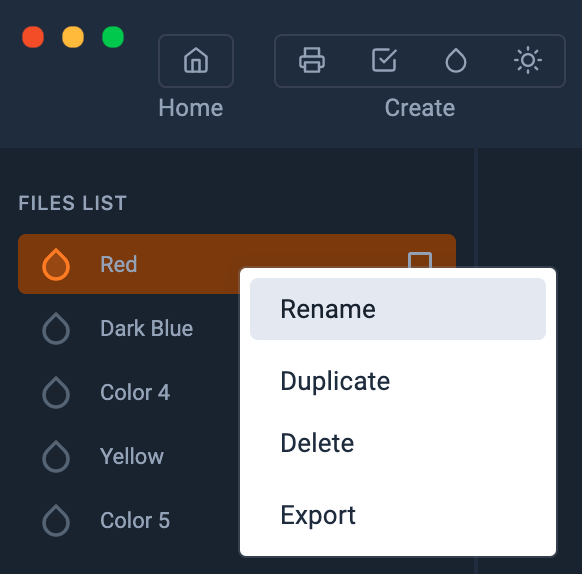
How to manage your colors
Right click on the color for Rename , Duplicate and Delete r.
The Export option allows you to save the color in a .spc file with its spectral data.
These .spc files are useful for sharing and saving your color samples.
Display colors in the Gamut Viewer
It can be useful to display colors in 3D to compare them with an image or an icc profile, such as a media profile.
For more information on the Gamut Viewer module:
For more information, see the chapter: Gamut Viewer
Add your colors in a color table
You can add your colors in a color table, by a simple drag and drop.
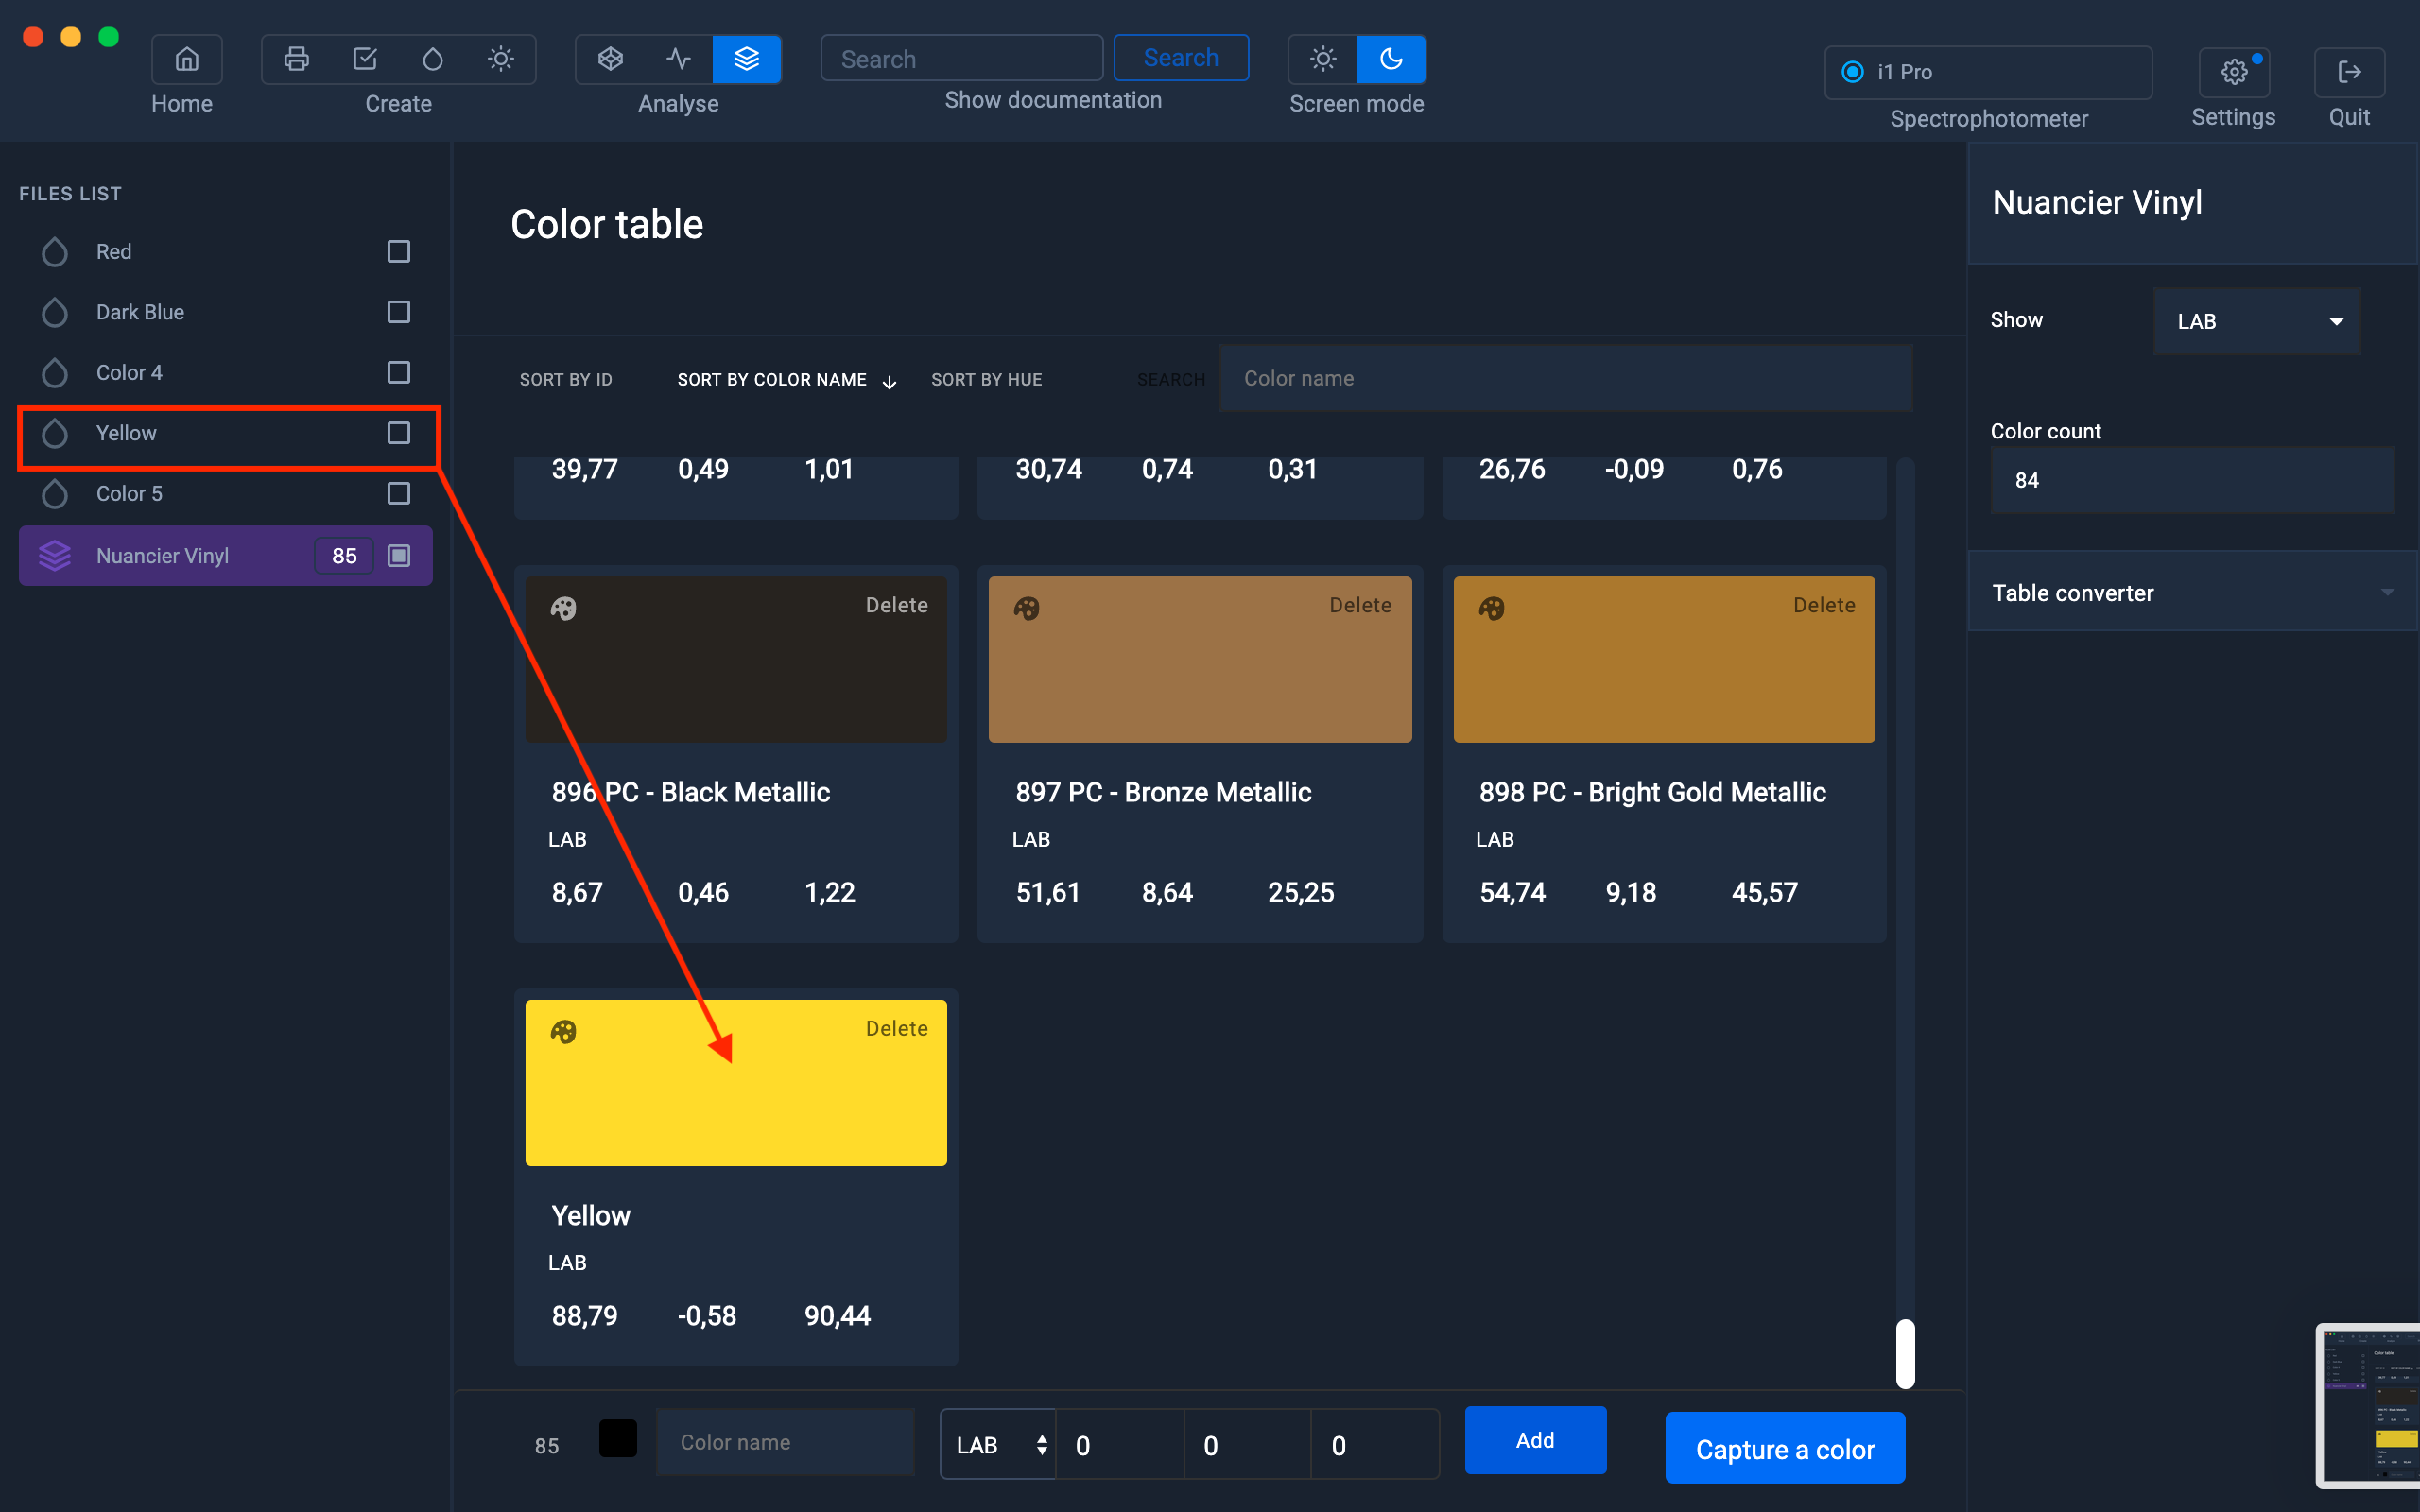
For more information on the color tables:
For more information, see chapter: Color table
Density values
To get the density values of a selected sample, go to the “Color Density” tab located at the bottom in the right column.

For more information on density values:
For more information, see the chapter: Displaying the density
View your reflectance curves in Spectral Viewer.
It might be helpful to compare the reflectance curves of your color sample with a spectral curve of a specific light to understand the effect of metamery.
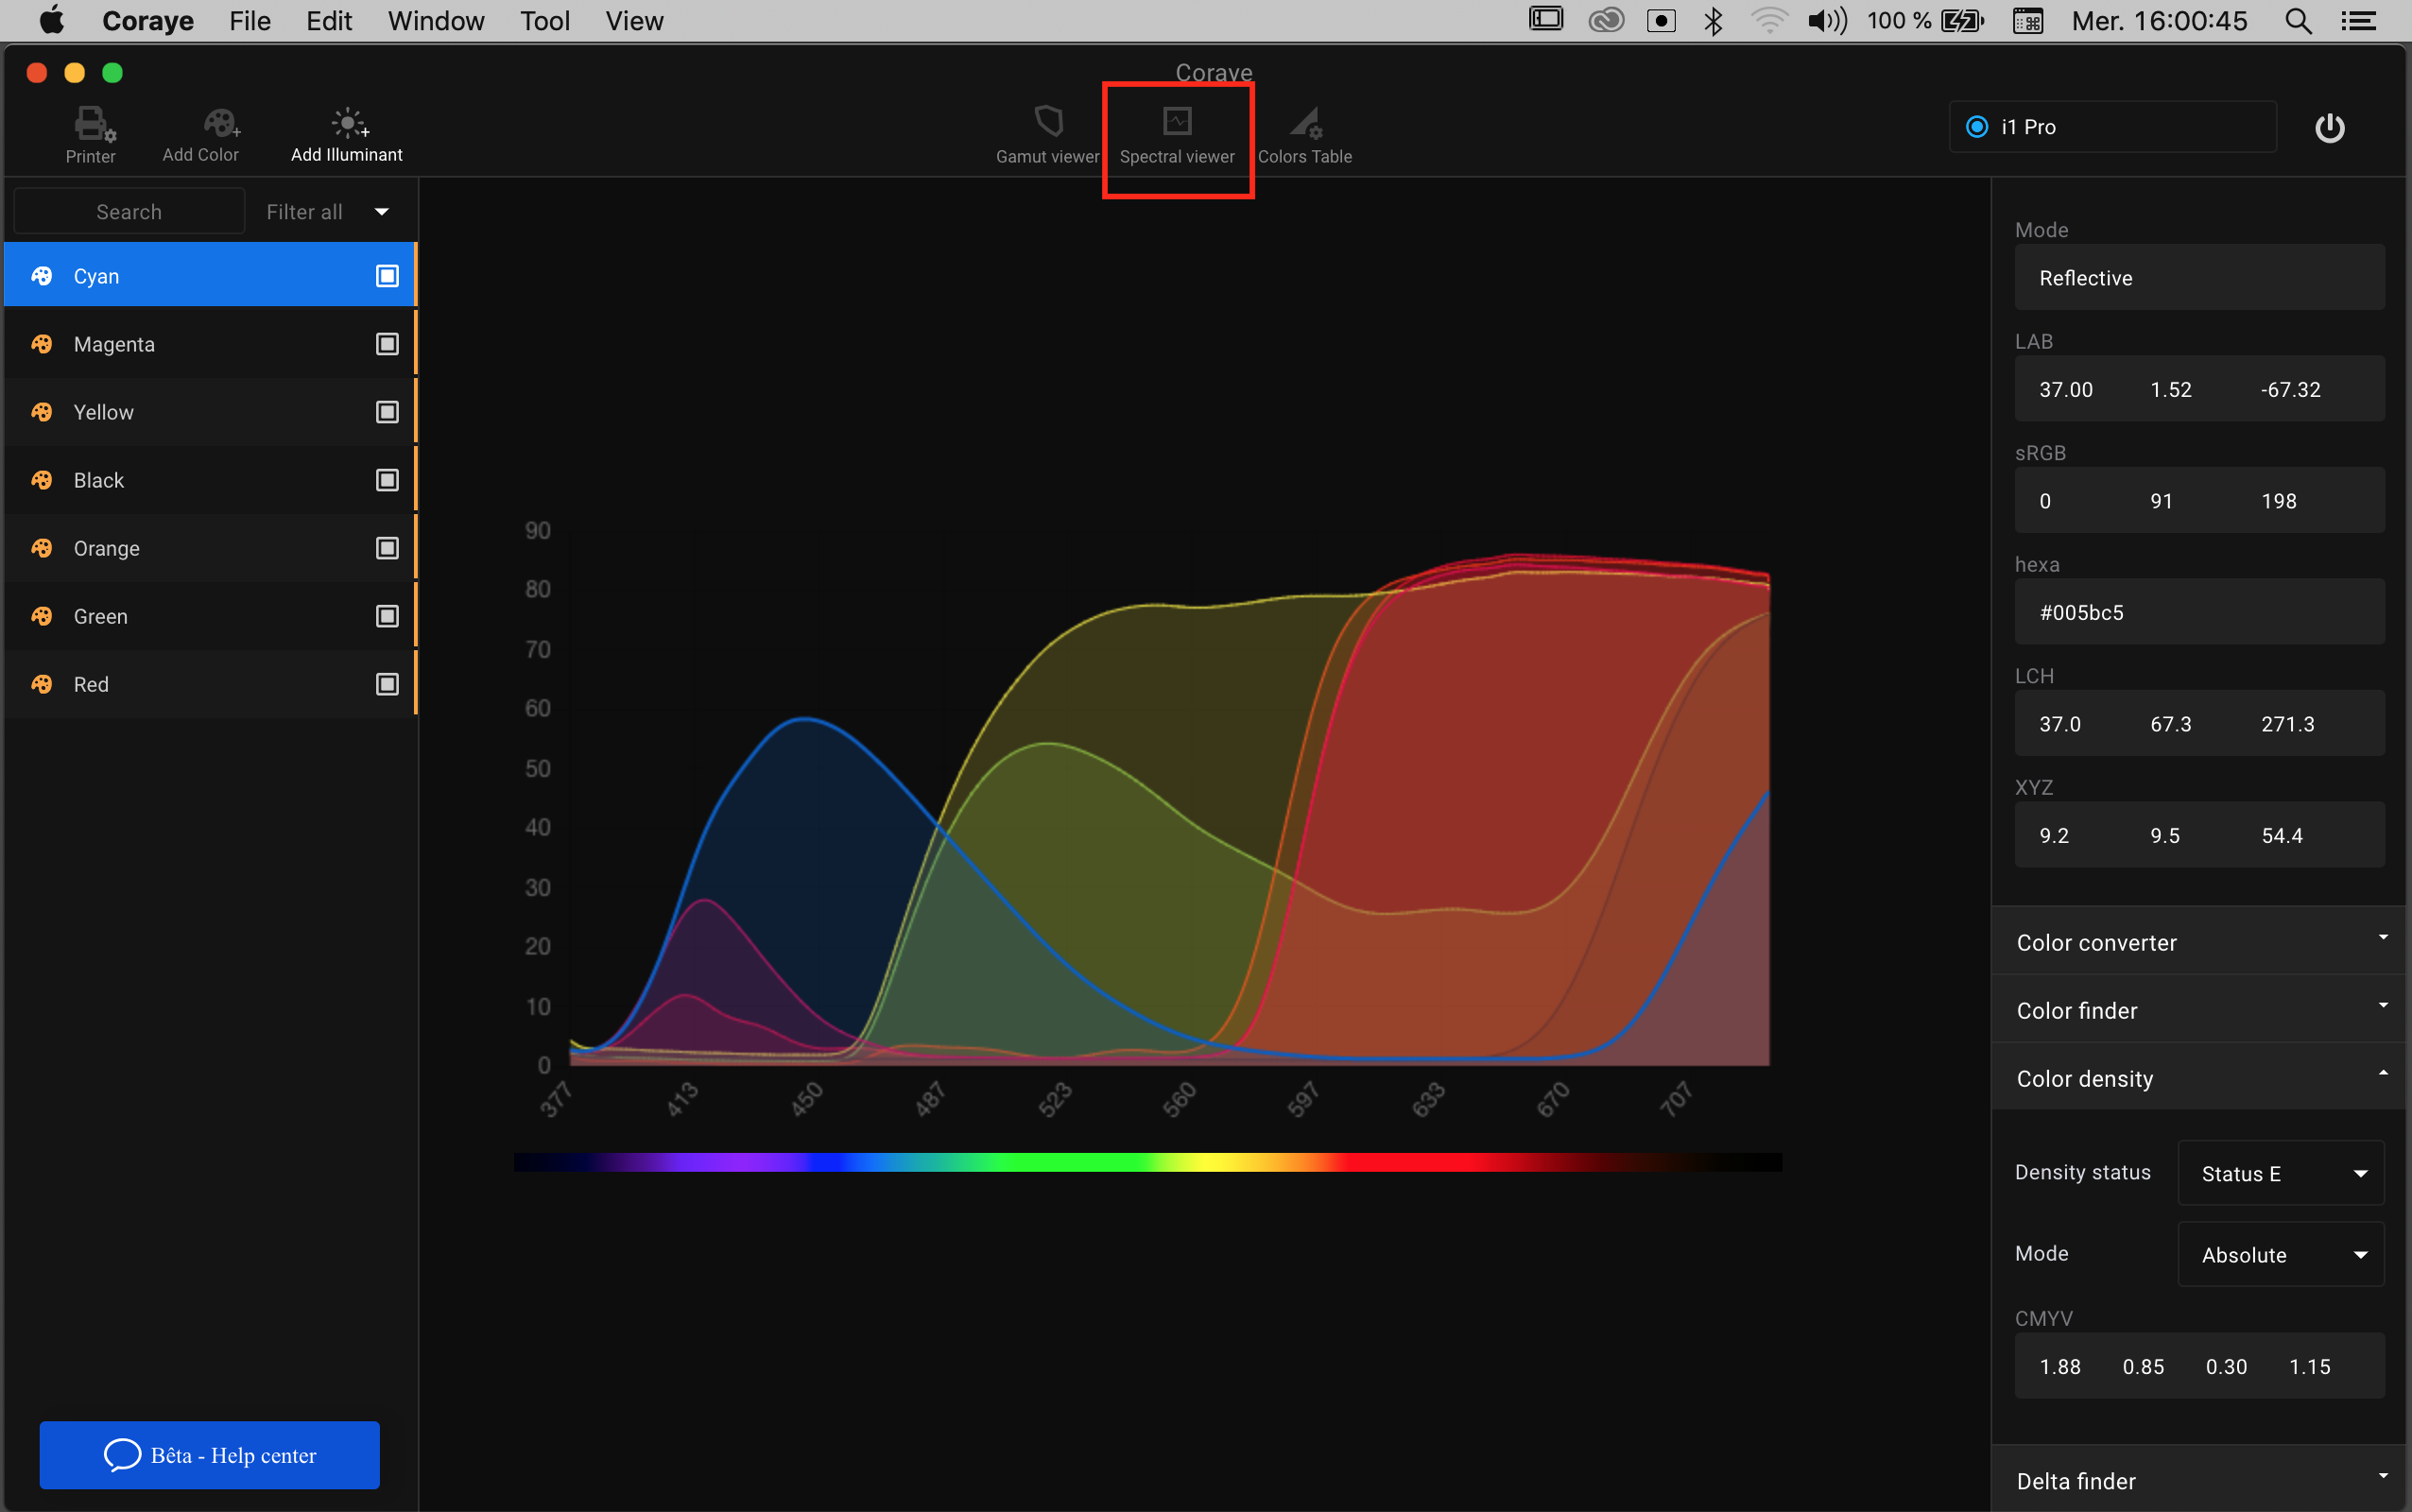
For more information on the Spectral Viewer module:
For more information, see chapter: Spectral Viewer
Convert your color swatches to CMYK or RGB with the color converter.
This option converts your color to CMYK or RGB values depending on the ICC profile of your media.
With the Delta E value, you can tell whether your color sample is reproducible or not.
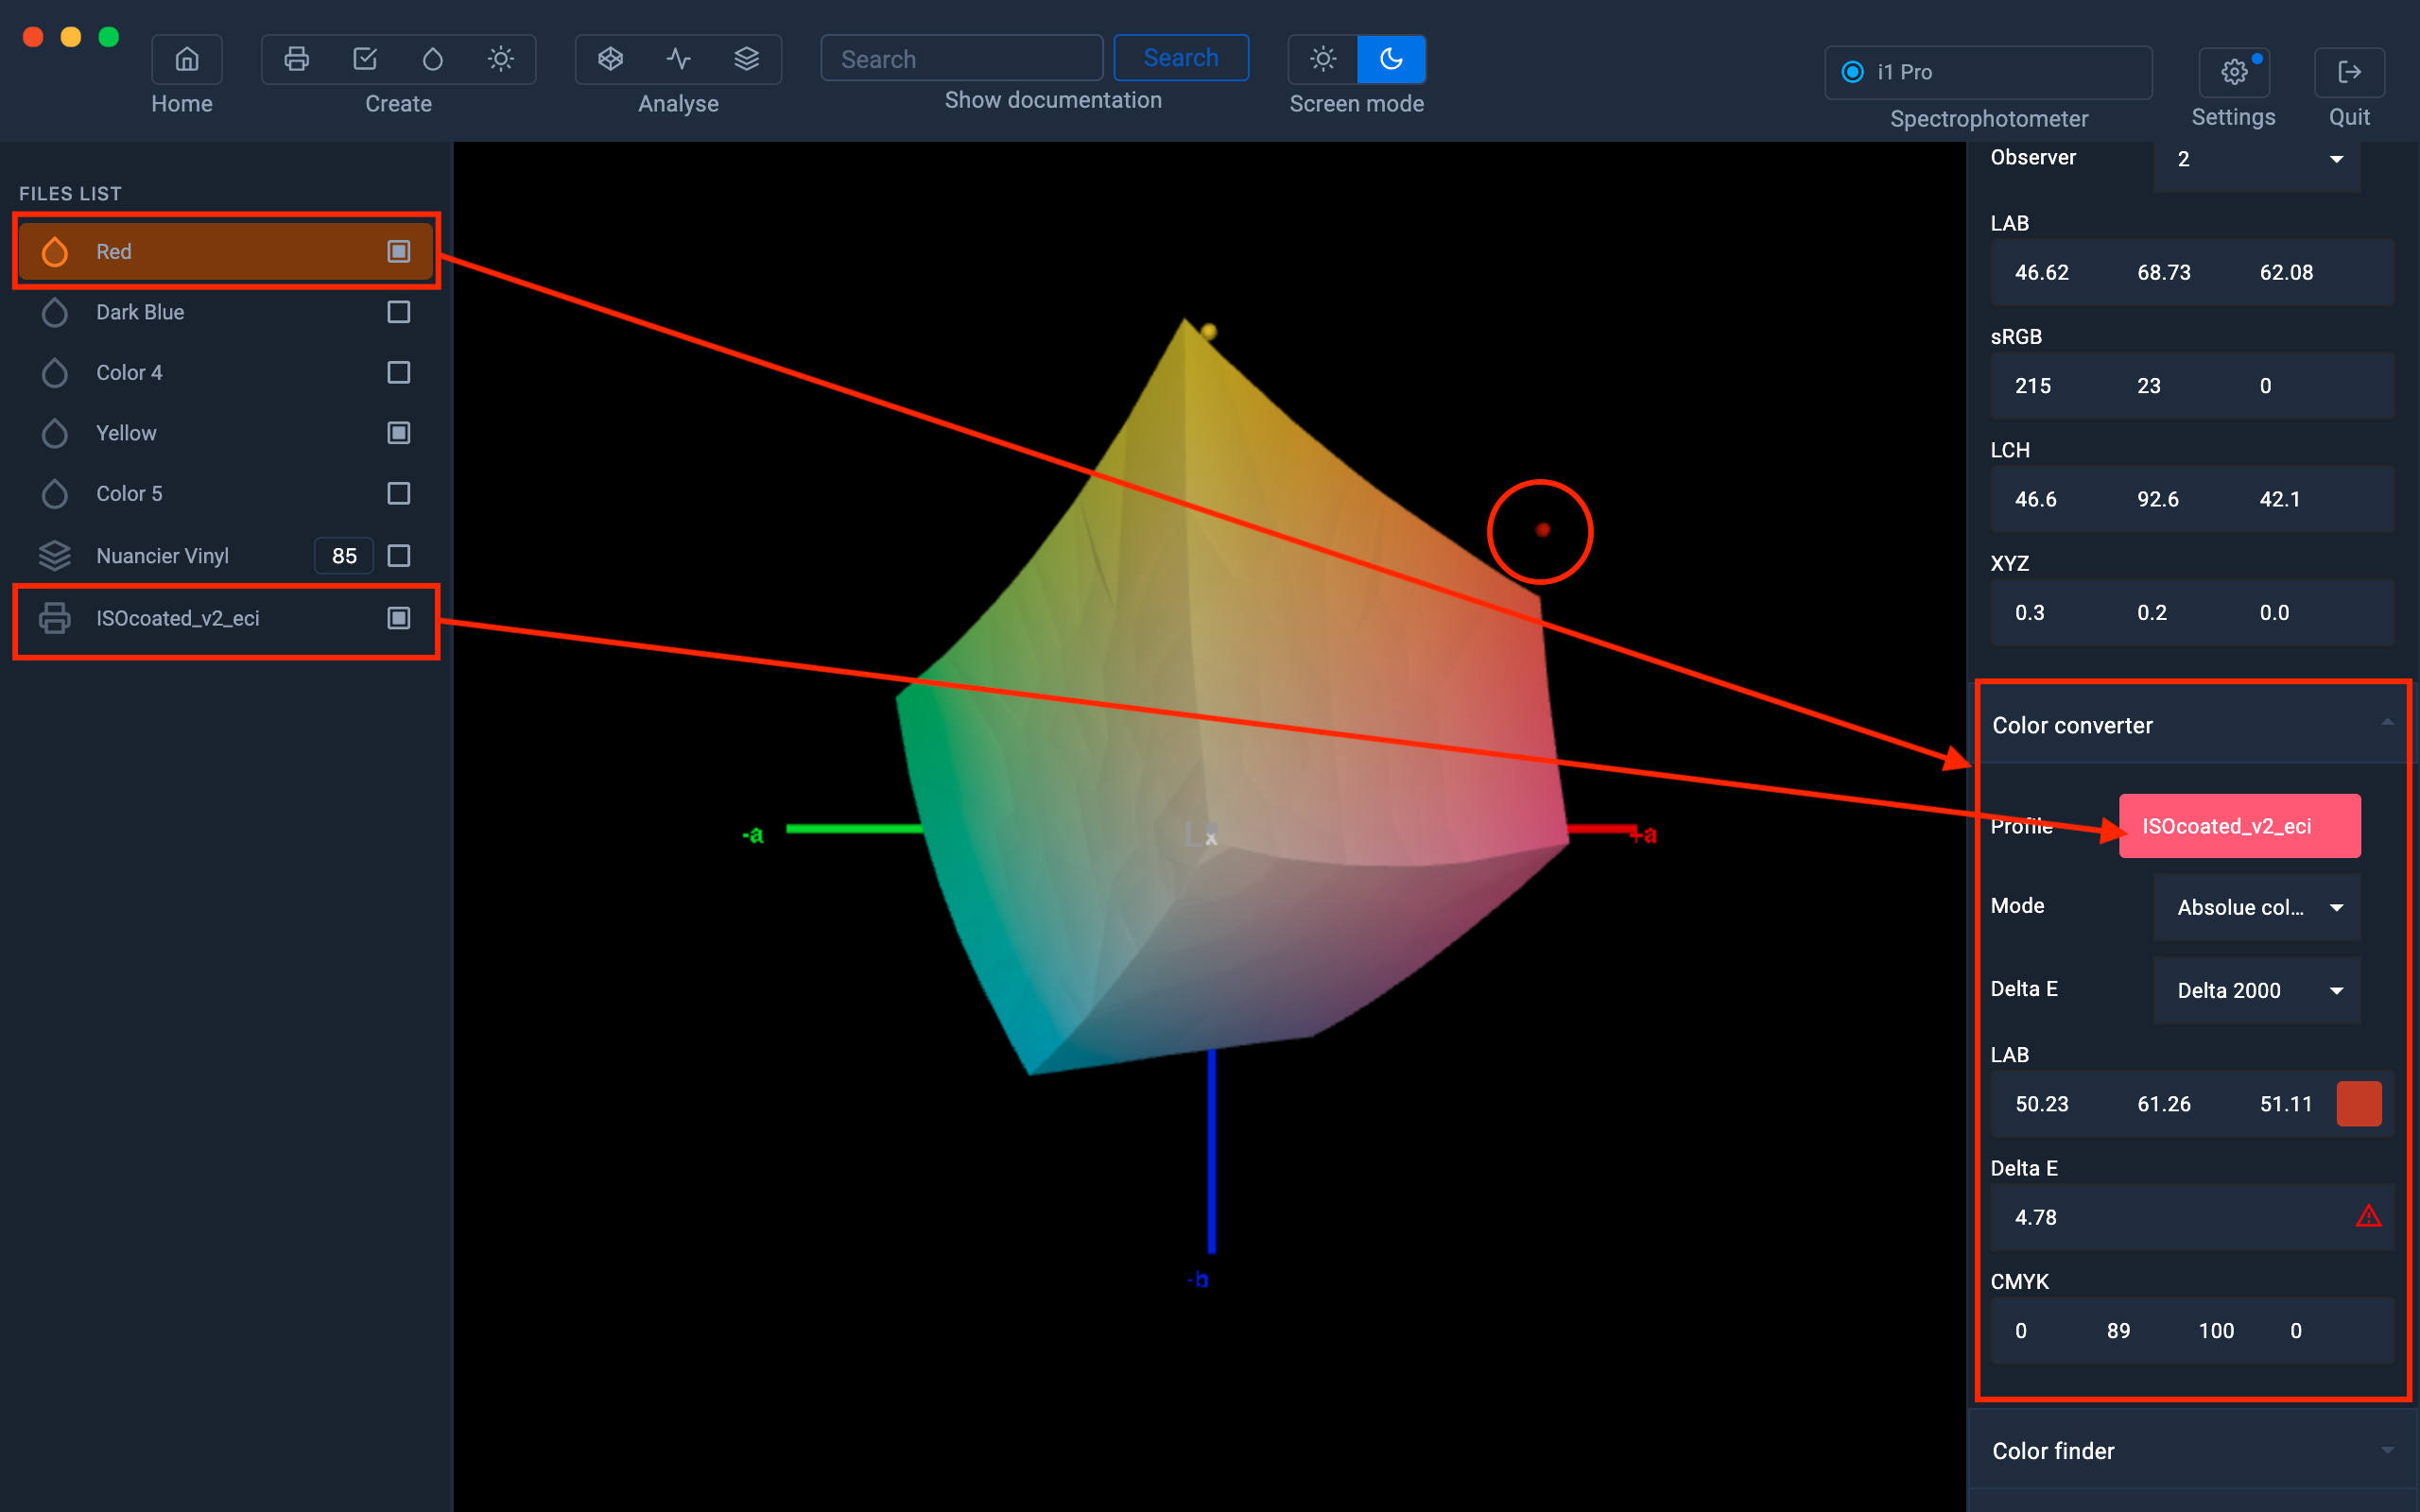
In this example, we have a saturated red and we want to know if our offset printer will be able to reproduce it faithfully.
For that, we are going to drag the CMYK profile Isocoated_v2_eci.icc * into the profile area.
This will convert our "Red" to the closest CMYK values.
But we can see that this color is not reproducible in this color space because the Delta E = 5
We also see in the Gamut Viewer that this color is outside the Isocoated_v2_eci.icc color space.
* The Isocoated_v2_eci.icc profile is a standard used in Europe for processing CMYK files.
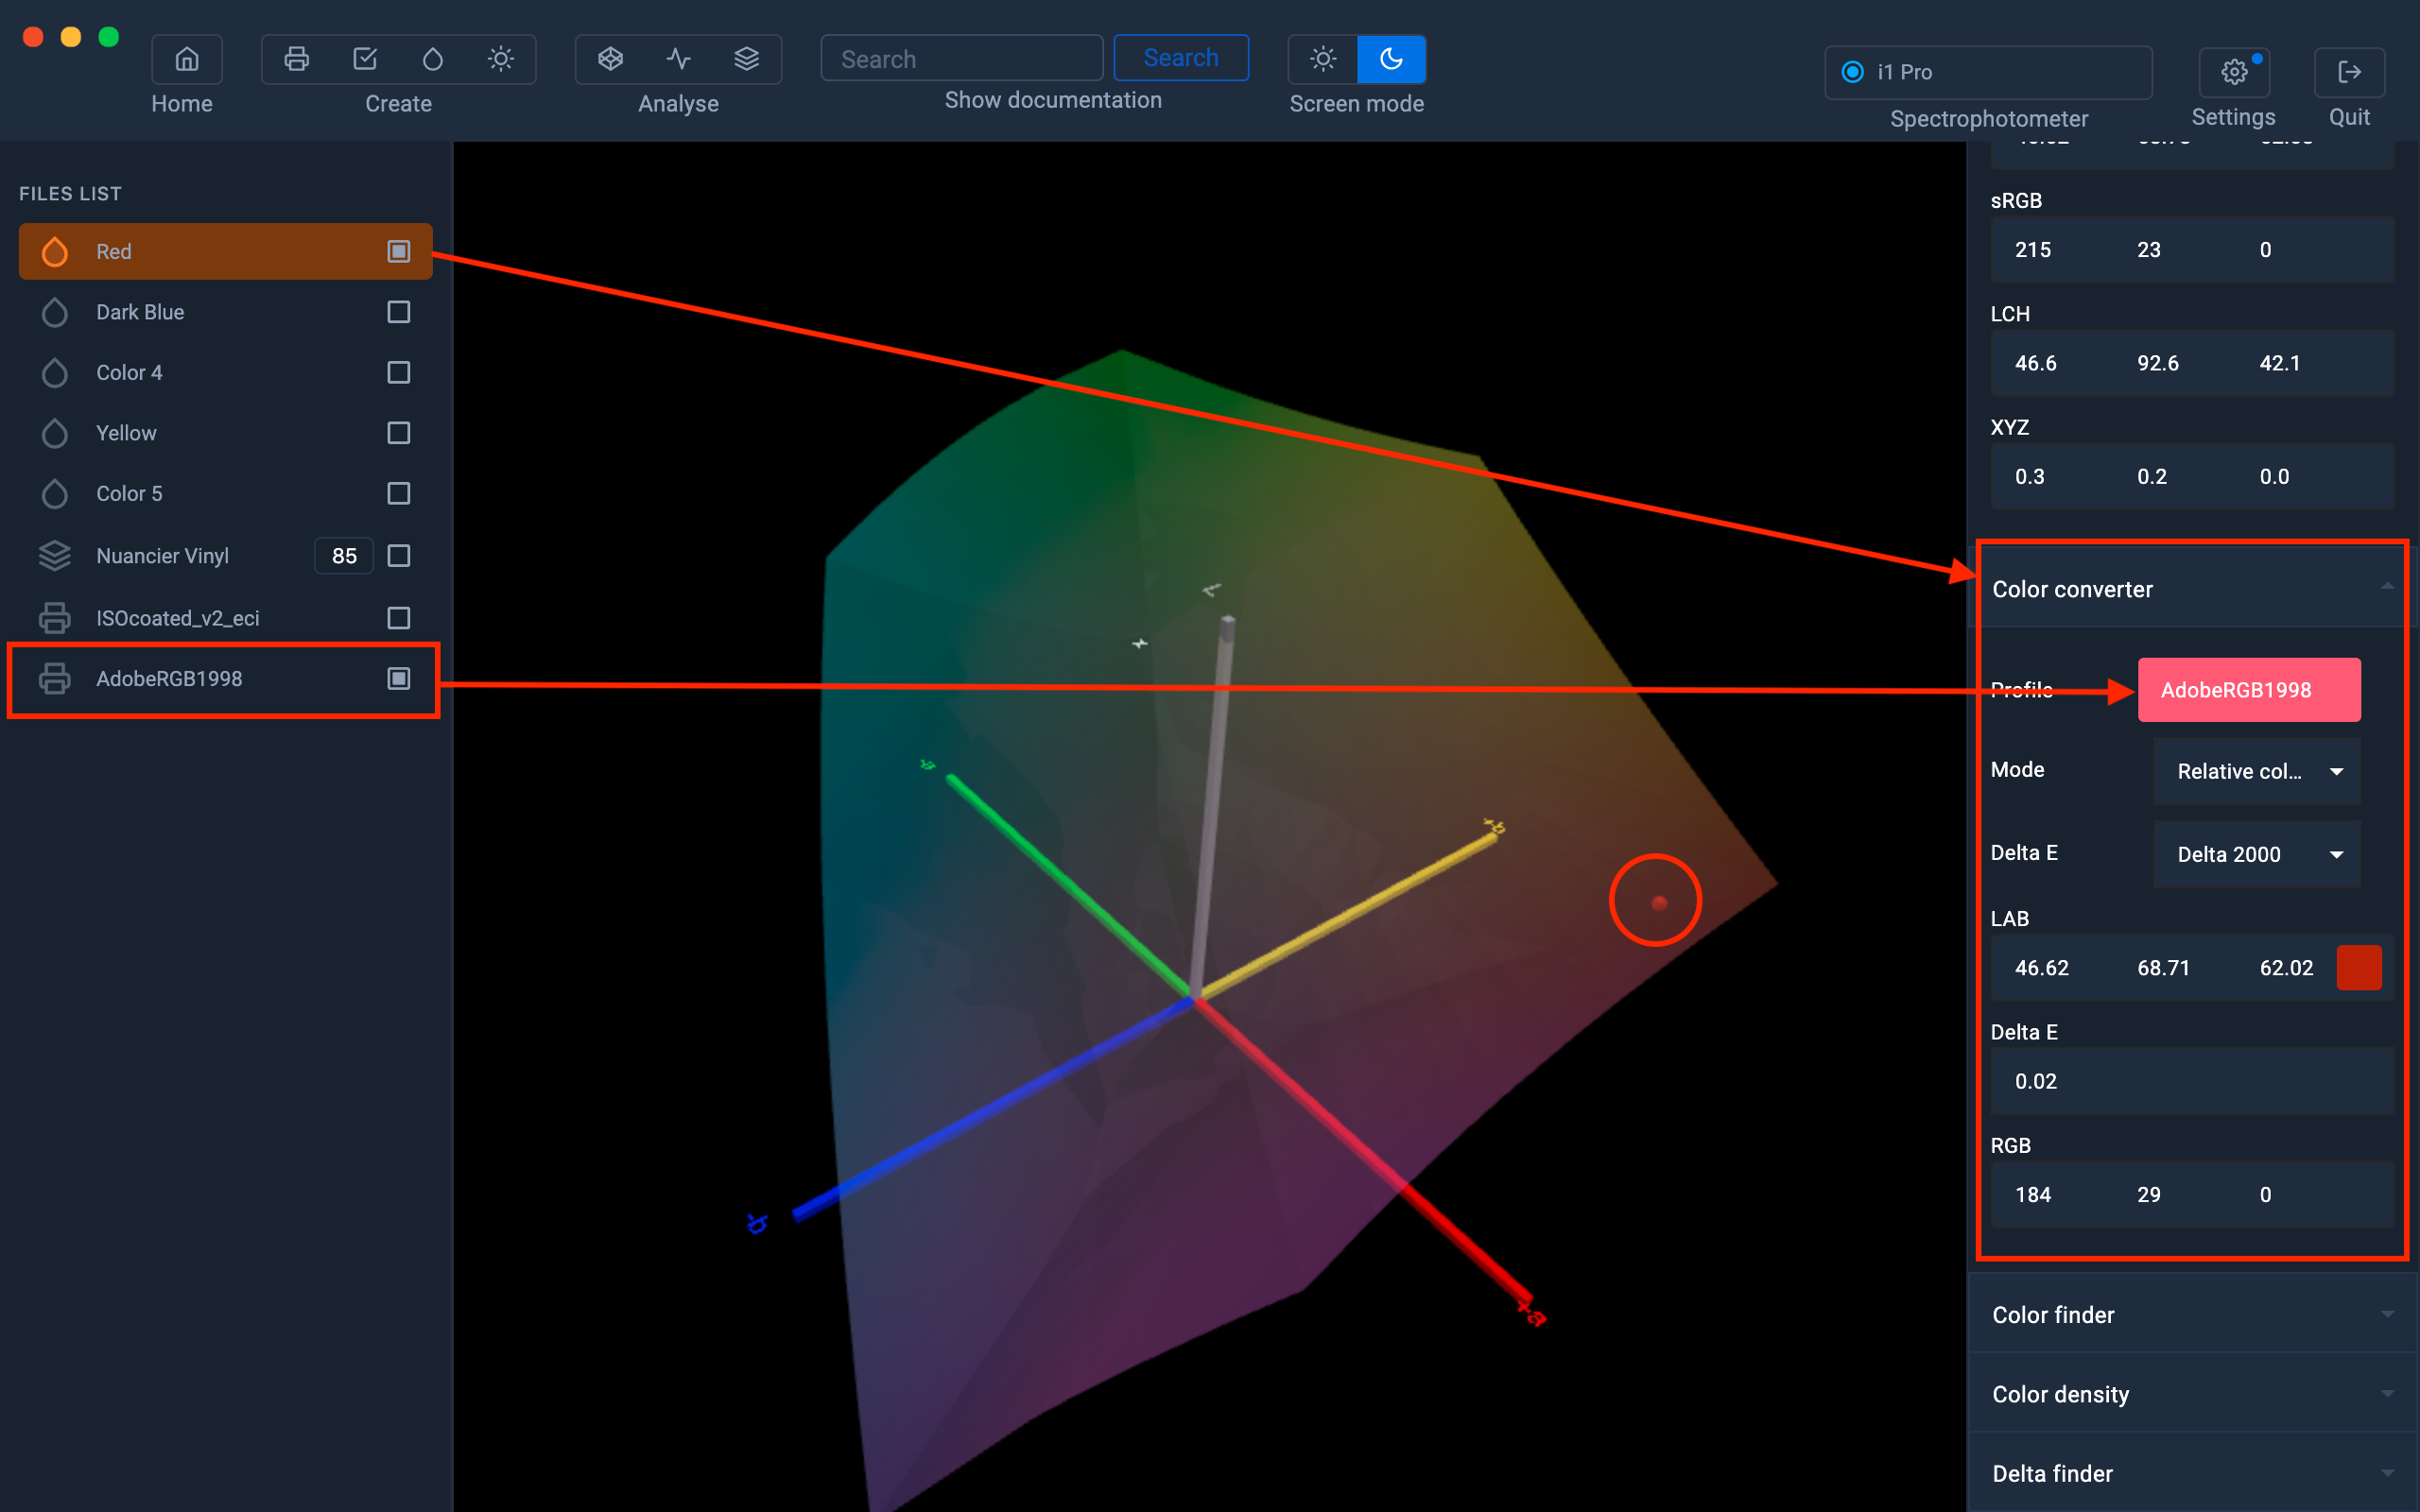
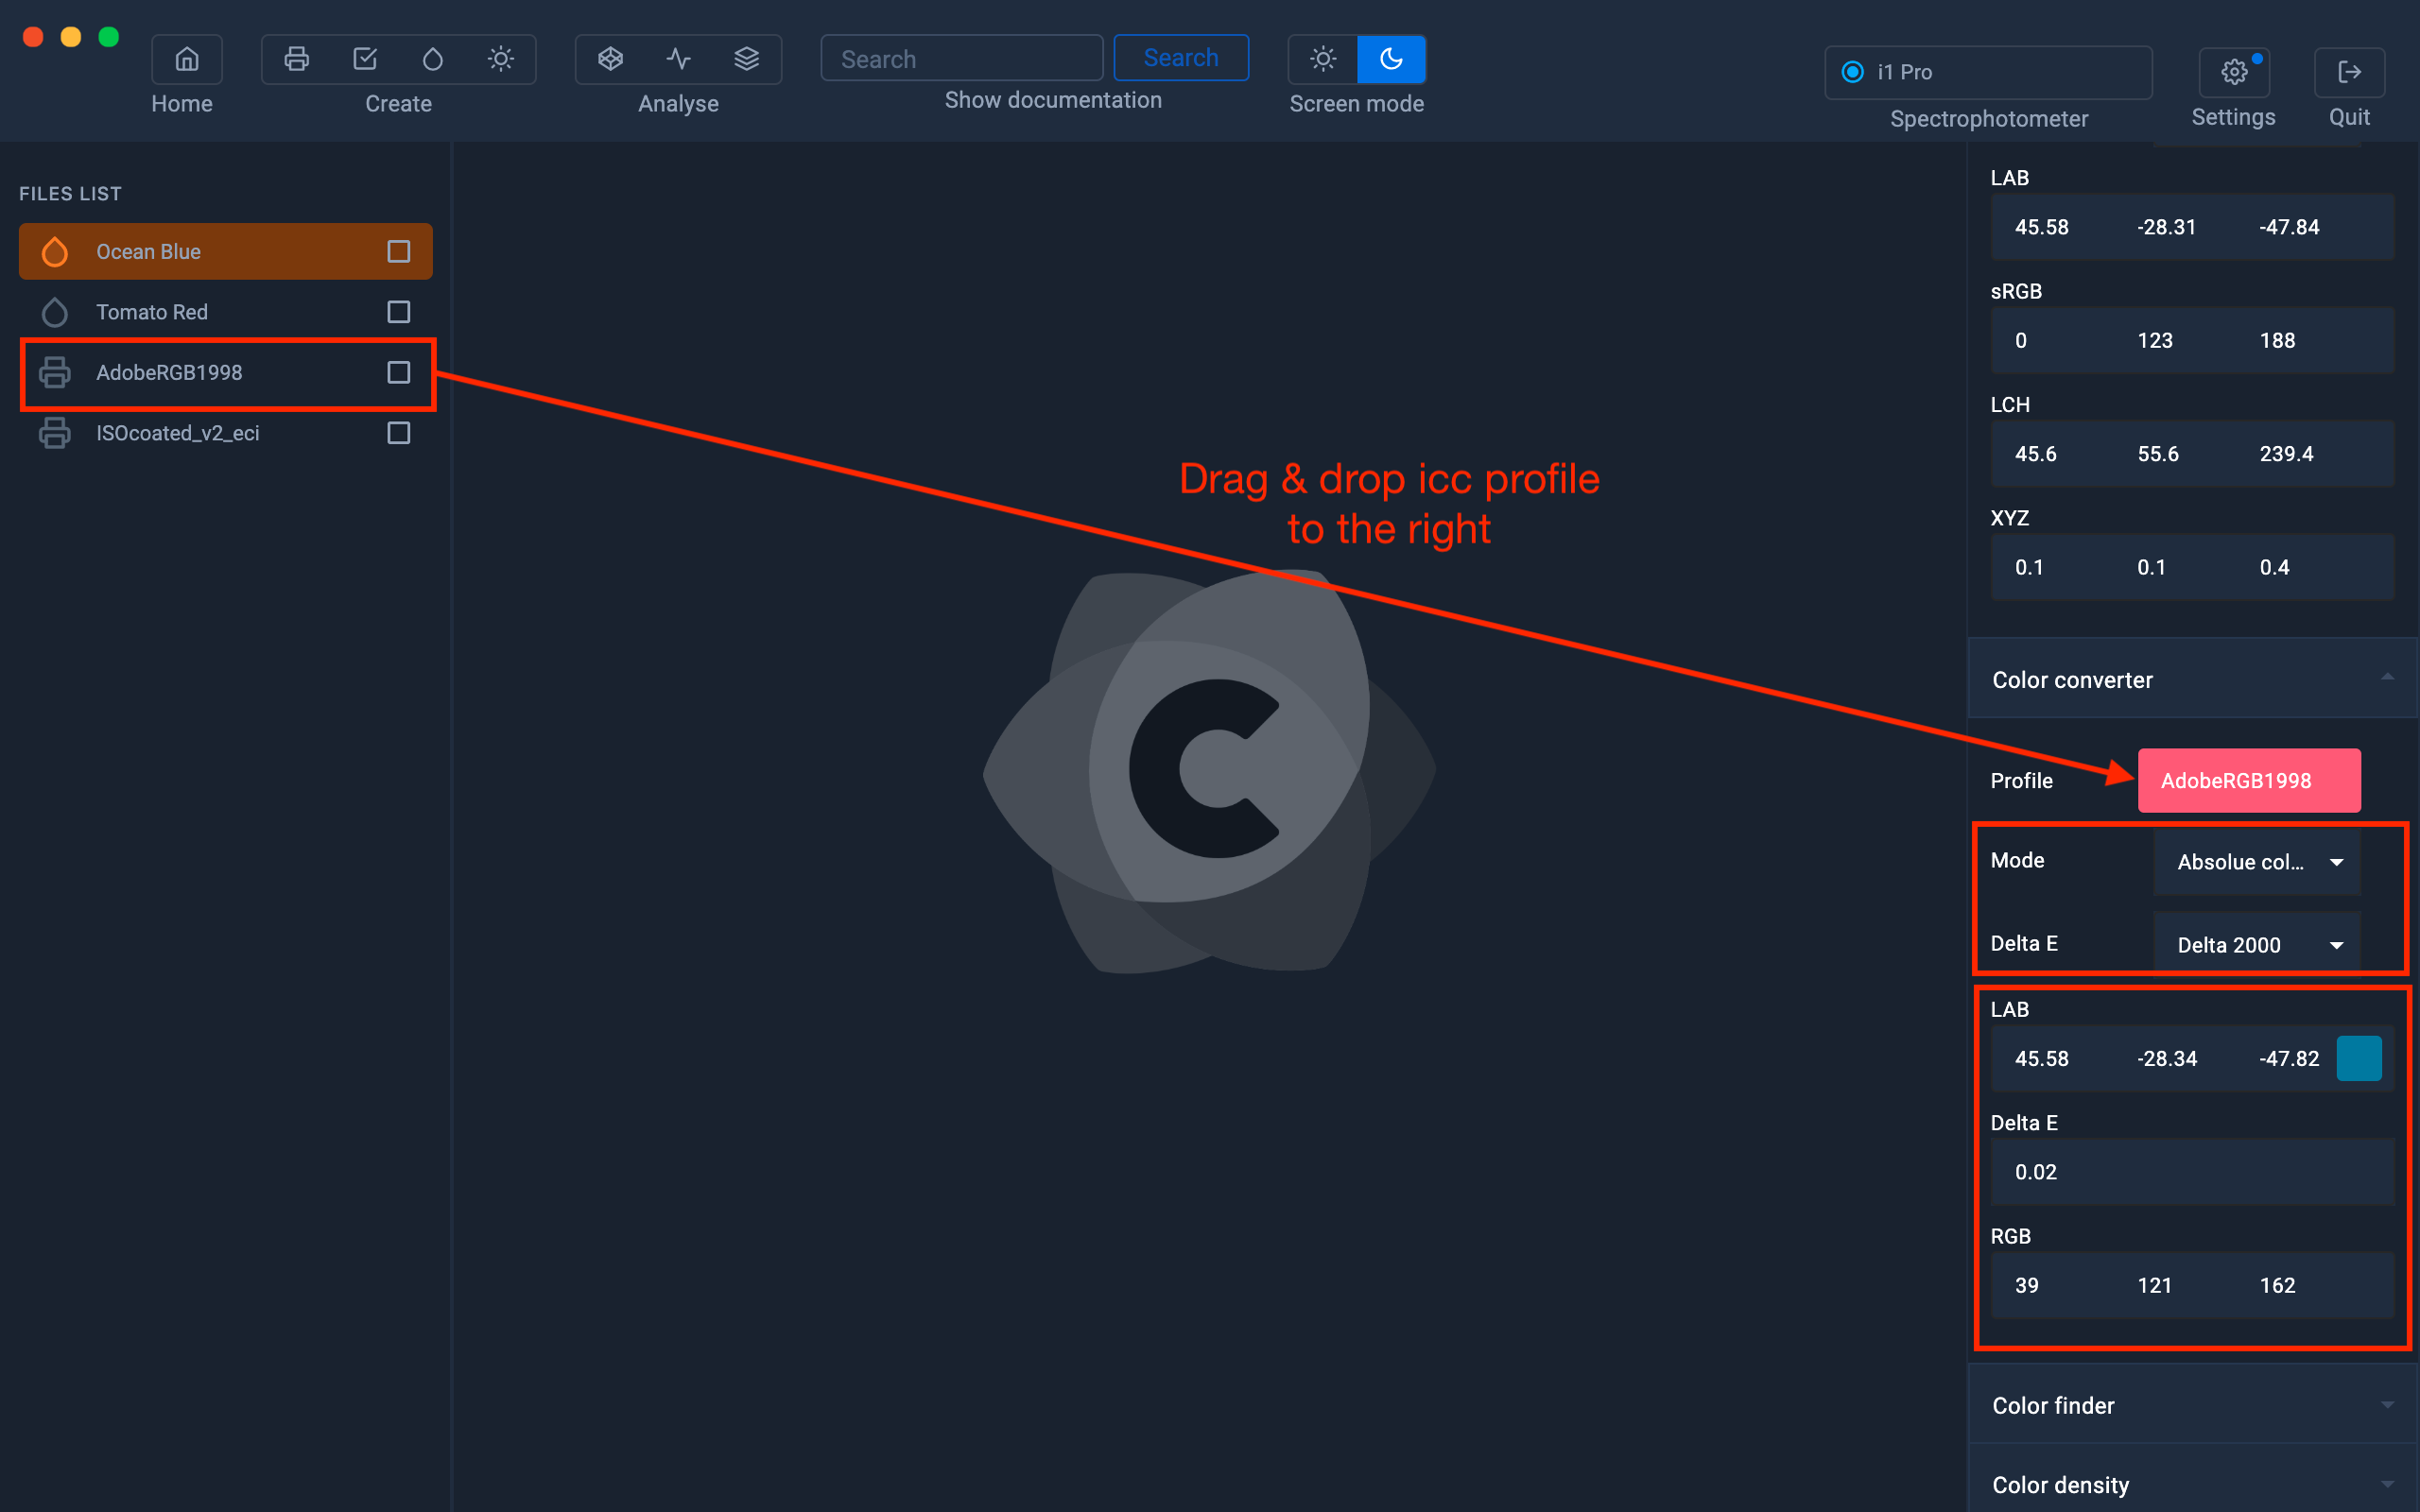
In this example, we have the same saturated red, but we're going to compare it with the Adobe RGB 1998 color space.
Drag and drop the Adobe RGB 1998.icc profile into the profile area.
We now get the closest RGB values.
Here we can see that this color is reproducible in this color space because the Delta E = 0 and we also see in the Gamut viewer, that this color is in the gamut of the AdobeRGB 1998.icc space.
For more information on the Color Converter module:
For more information, see chapter: Color Converter
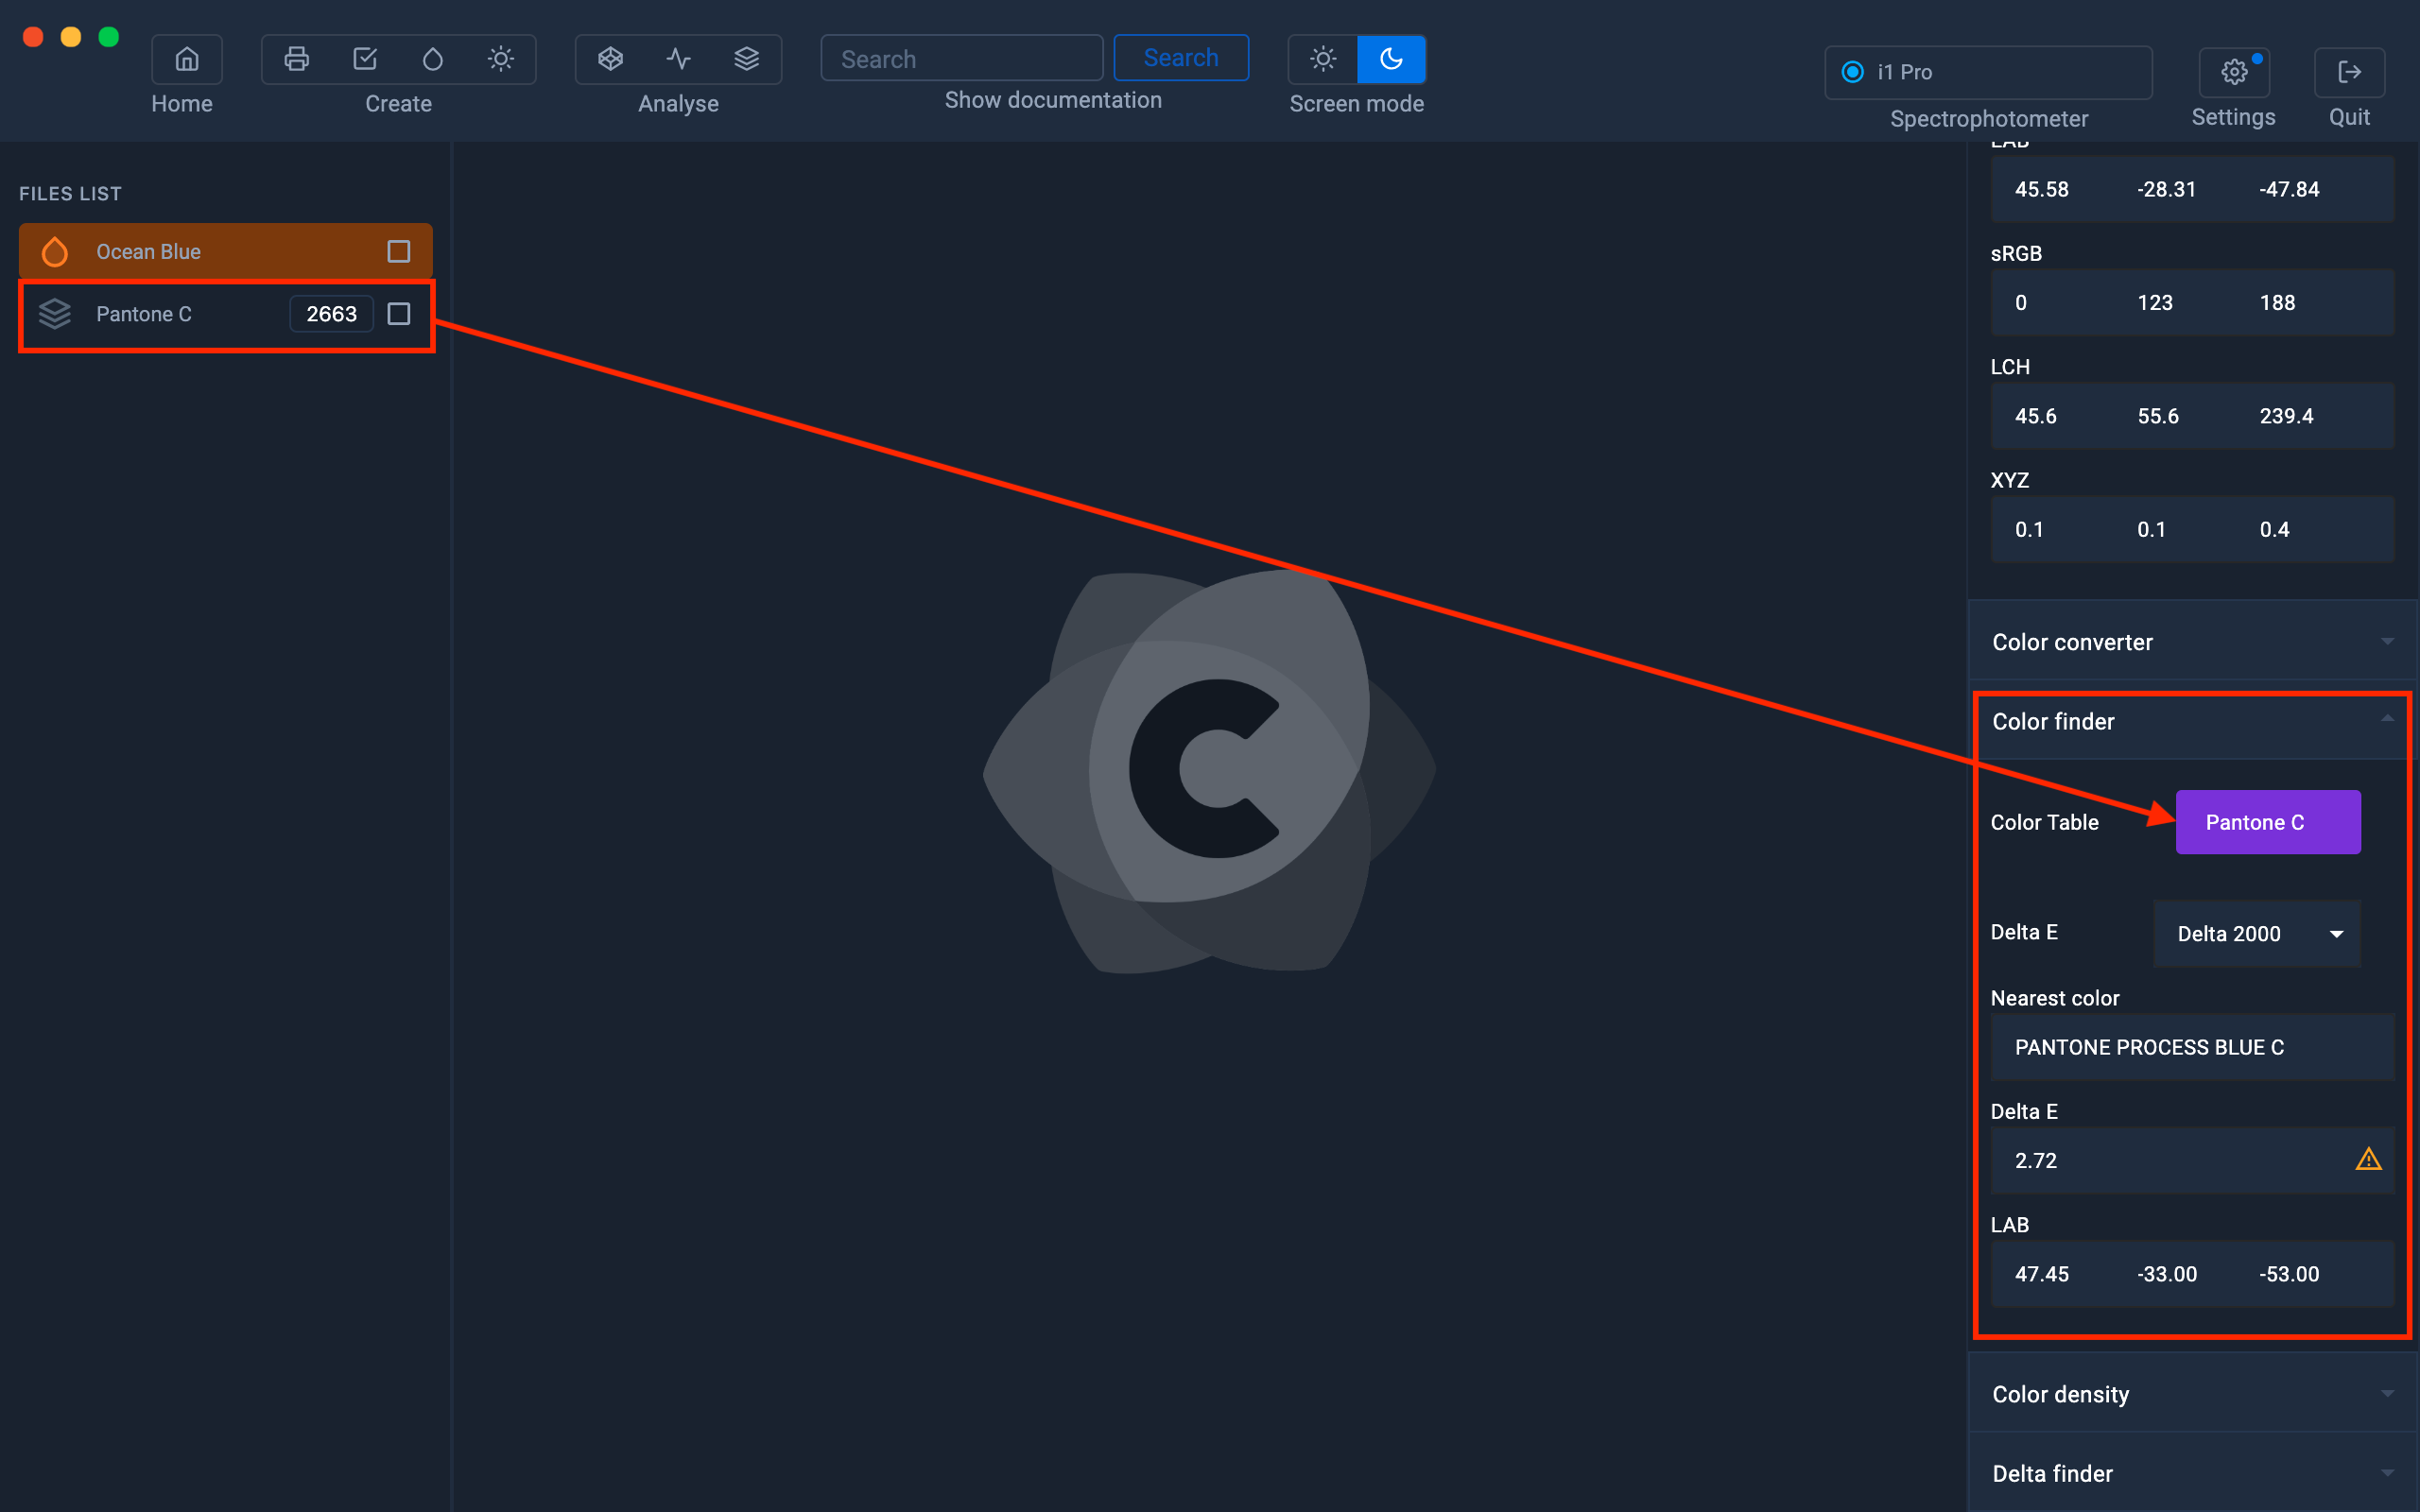
Find the closest color in a color chart with Color Finder.
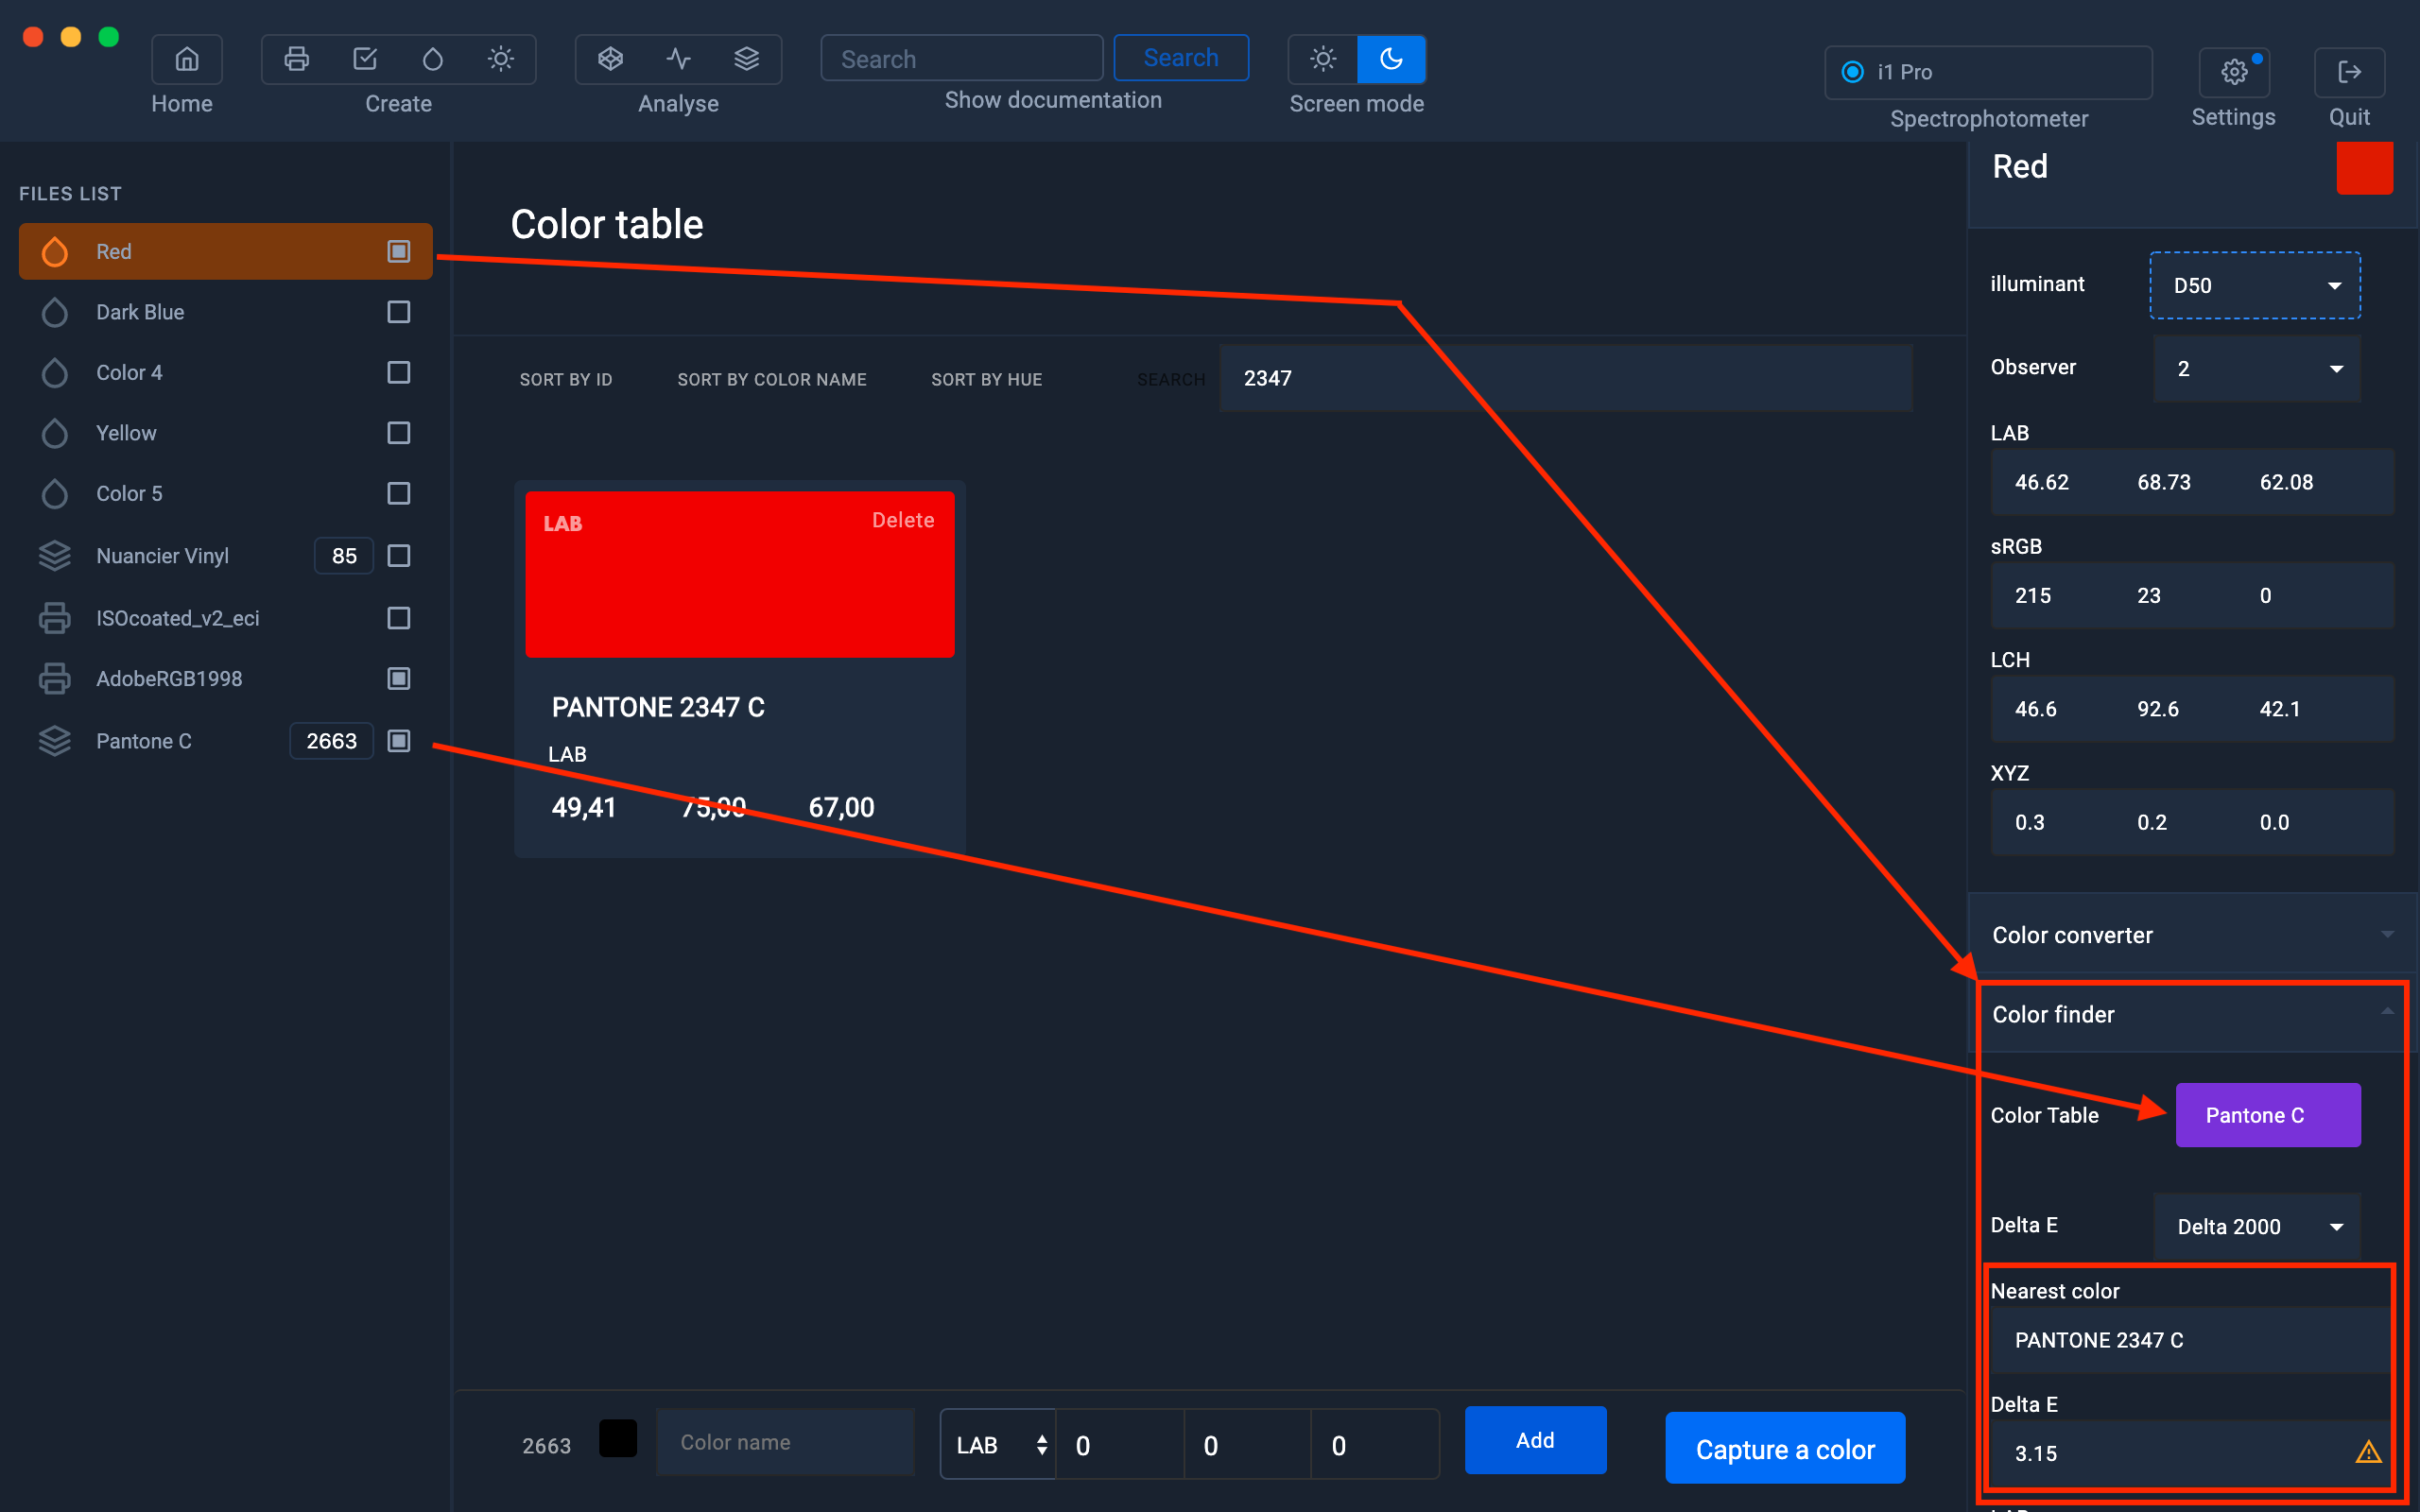
You have captured a color swatch and you need to know which is the closest Pantone® value.
To find out, simply select your color, go to the Color Finder tab, then drag and drop a color table (ex-PANTONE® C) into the Color Table area.
You will then get the color closest to the color chart with the Delta E value to give you color accuracy.
This function can also be useful for performing quality control from a color chart containing color samples to be checked.
For more information on the Color Finder module:
For more information, see chapter: Color Finder
Compare two colors with the Delta Finder
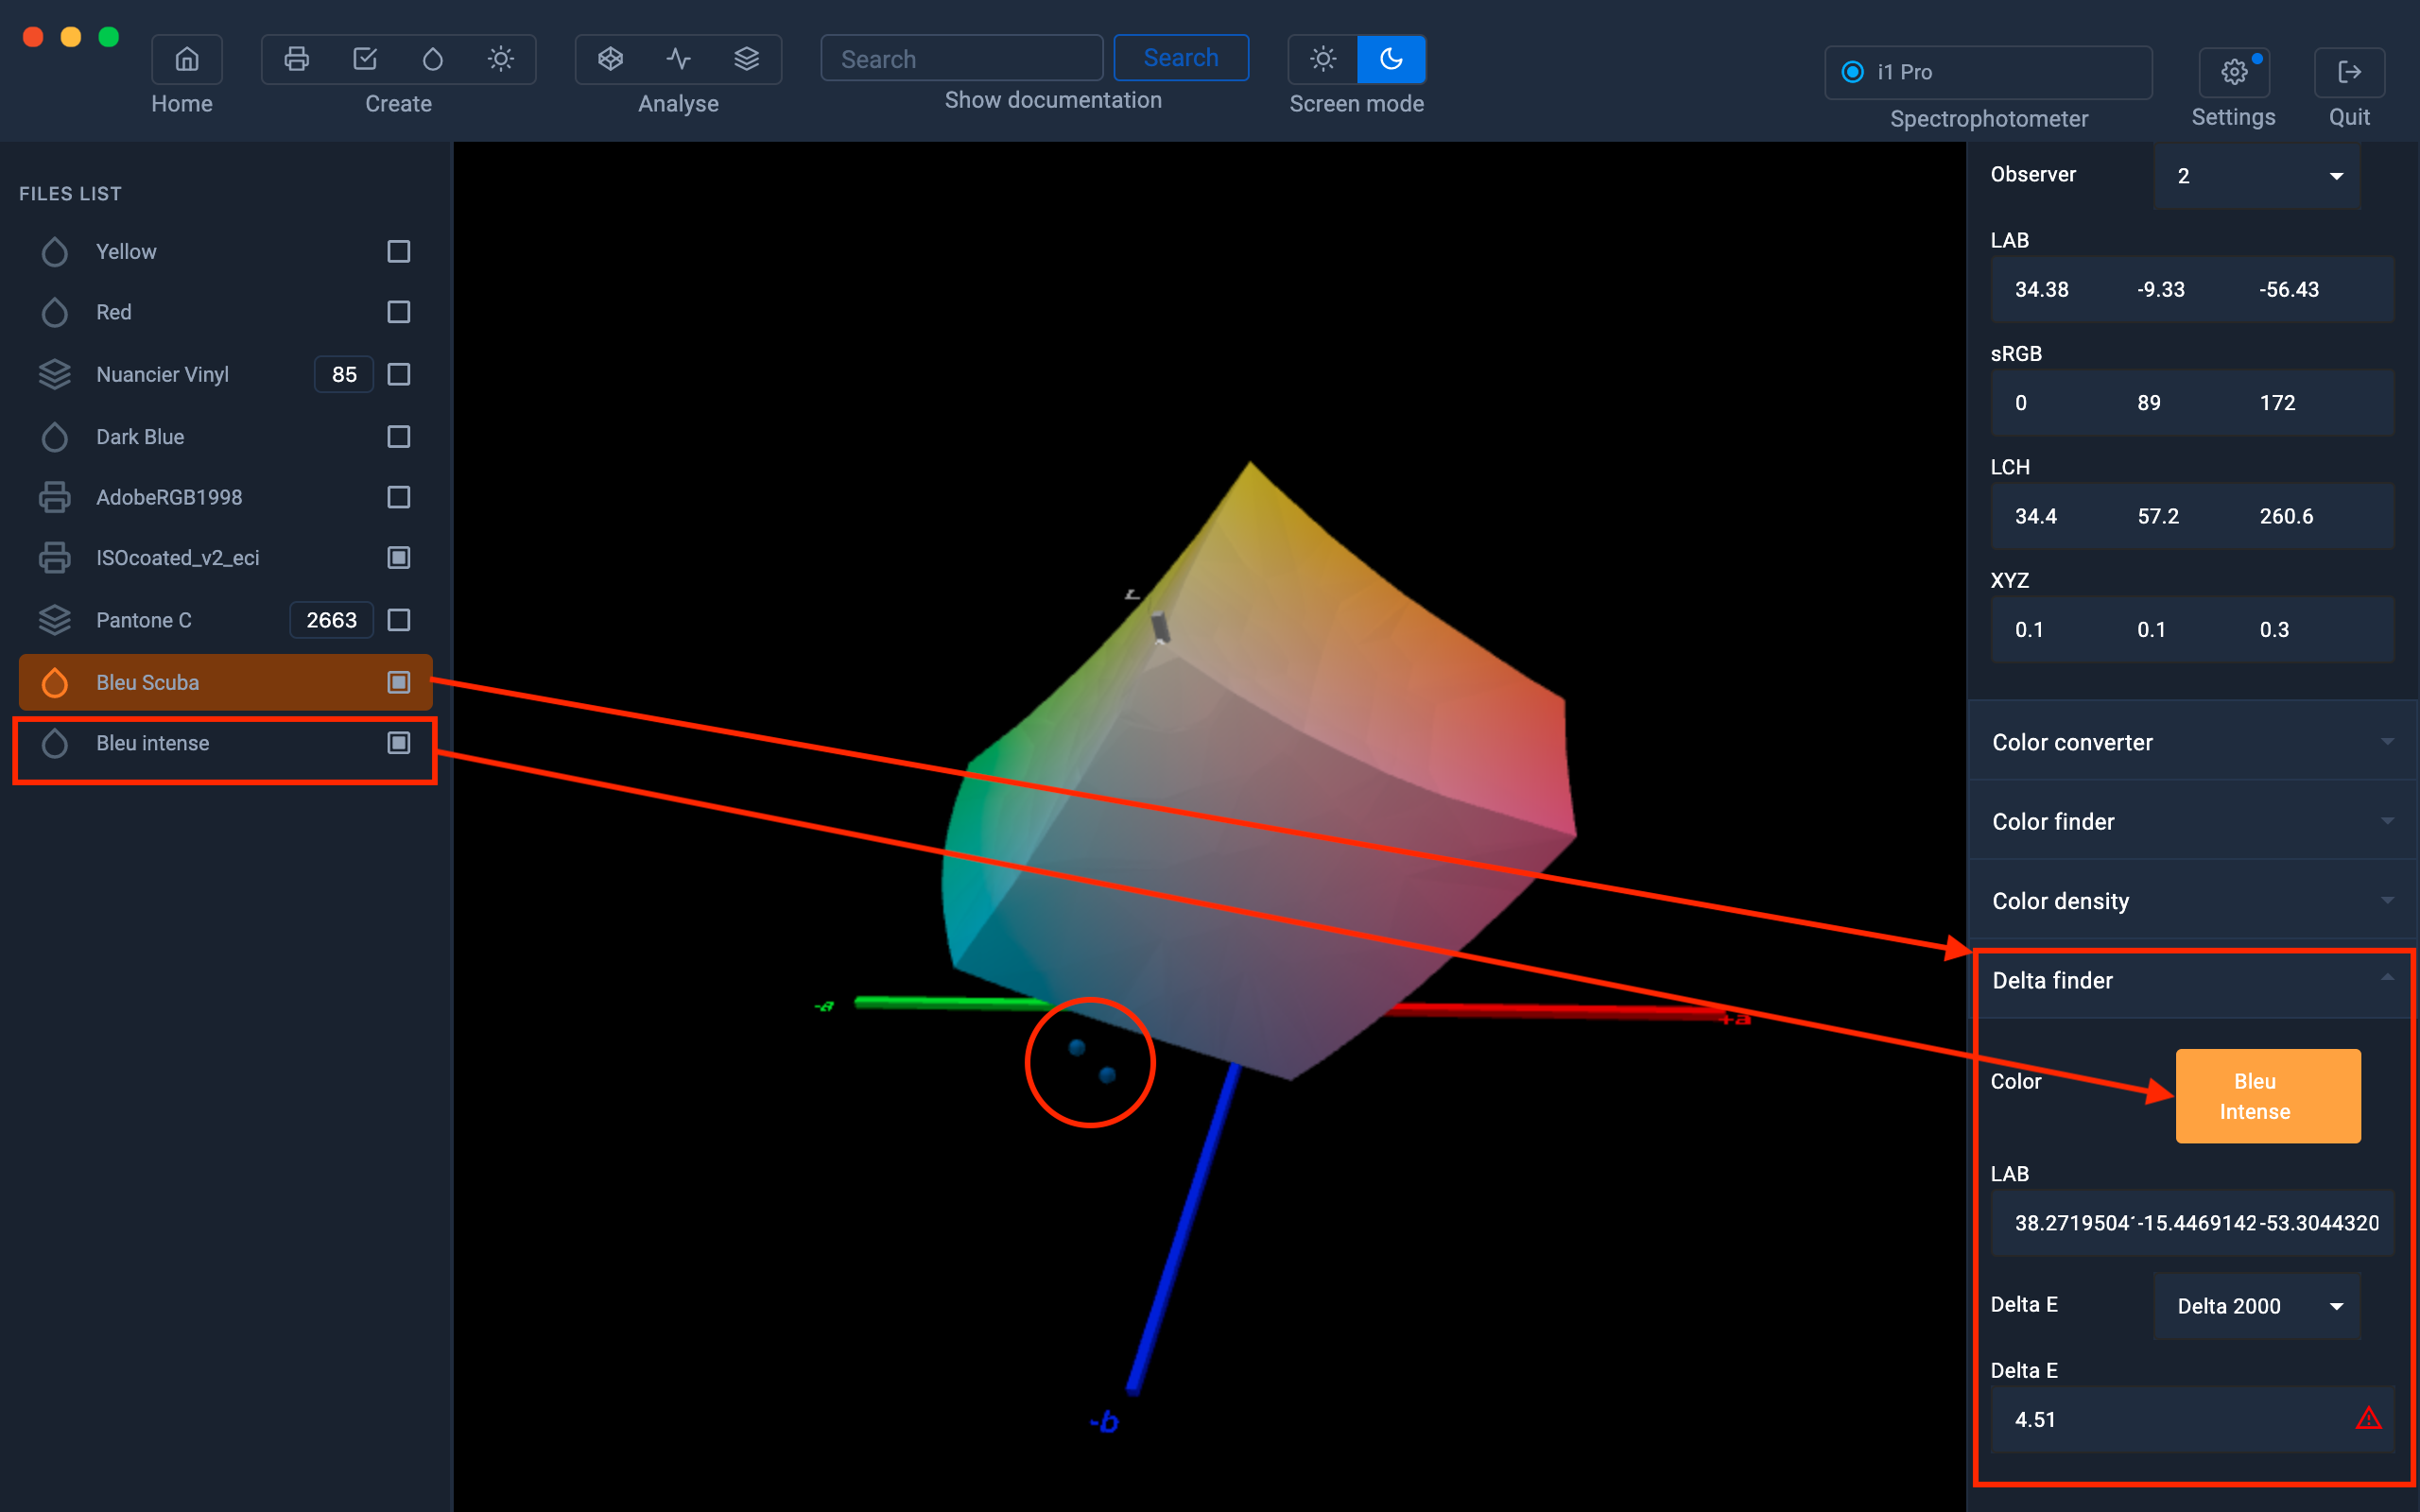
If you need to compare two color samples to know the accuracy between those colors, you can use the Delta Finder feature.
To use it, you just need to select your first color in the left column, go to the Delta Finder tab, and then drag the second color to the Color area.
You will get the Delta E value.
For more information on the Delta Finder module:
For more information, see chapter: Delta E Finder
Compare the white point of an icc profile with the white measurement of a paper
You are looking for a paper with a specific white color, no need to get samples.
Simply download the media profiles from the paper manufacturers' sites, then view or compare the white point of the icc profile with the white measurement of the reference paper.
- First step: Download the media profile from the manufacturer's website
- Second step: Import the profile into Coraye
- Third step: Select the profile then in the right column, drag and drop the white point preview to the left column.
The white point will appear as a color swatch.

- Fourth step: Measure the white of your reference paper or if you know the Lab values of your paper, create a color by right-clicking in the left column.
- Fifth step: Compare the two samples in the "Delta Finder"

Control of an illuminant
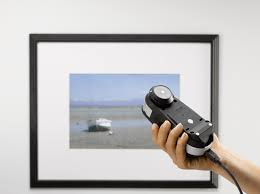
Illum Reader is a function that analyzes light.
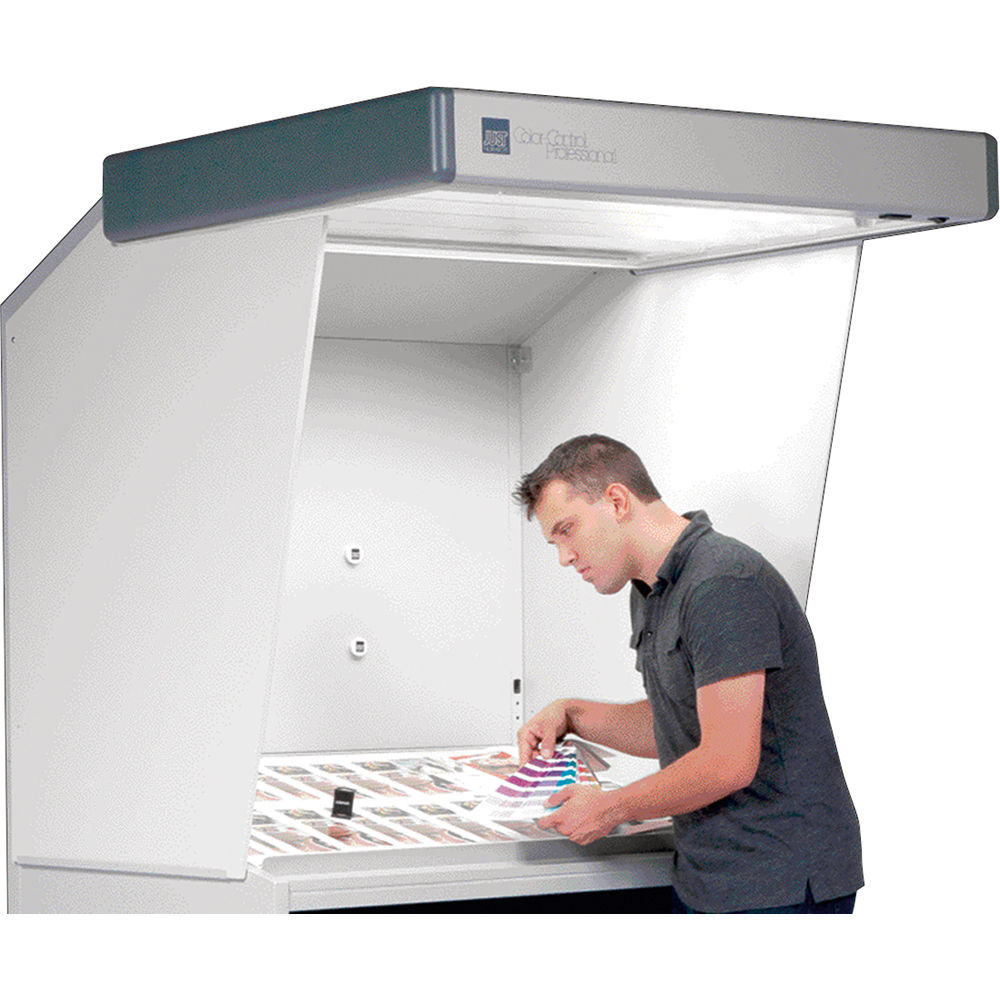
Its purpose is to check the quality of your light in a light booth or under your viewing conditions.
Prerequisites
This feature can only work with the following spectrophotometers:
- Konica Minolta MYIRO (Optional Ambient Light Adapter)
- XRite Eye One Pro
- XRite Eye One Pro (EFI ES 1000)
- XRite Eye One Pro 2 (EFI ES 2000)
- XRite Eye One Pro 3 (EFI ES 3000) and XRite Eye One Pro3 PLUS
Attention some XRite I1 Pro OEM cannot measure the illuminant
How to use Illum Reader
Click on the icon "Create Light" in the toolbar of Coraye
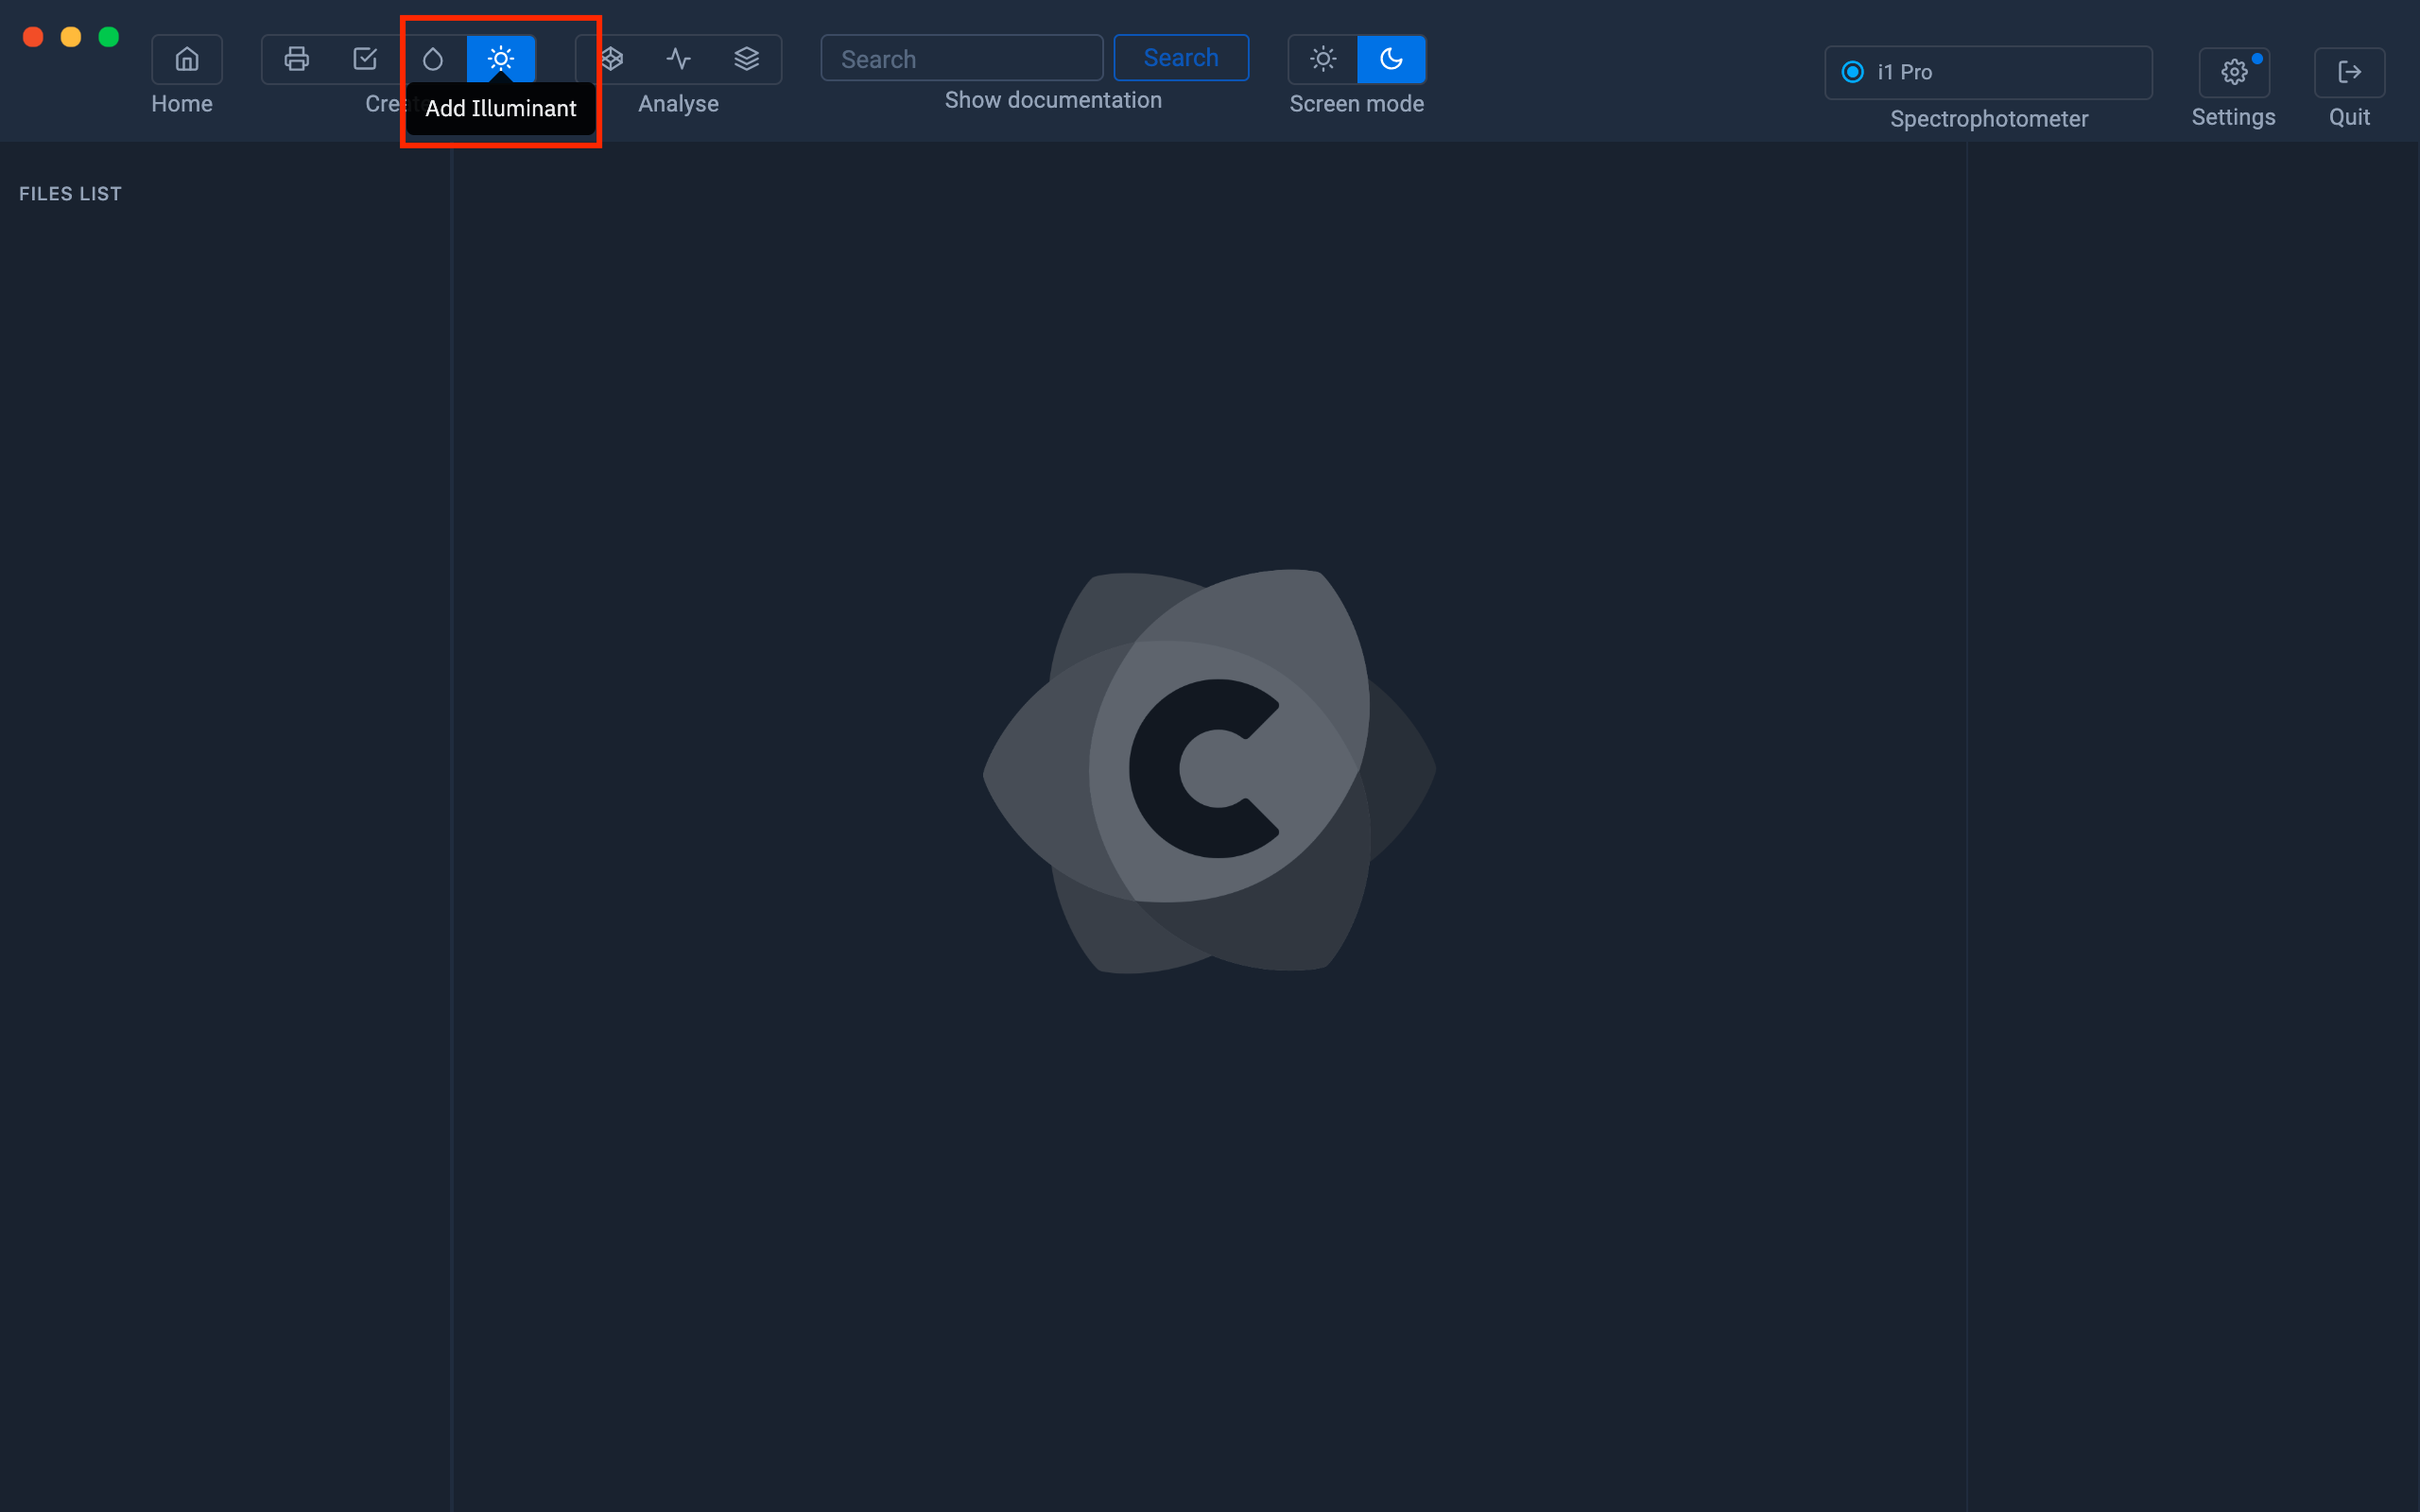
Make sure your spectrophotometer is connected.
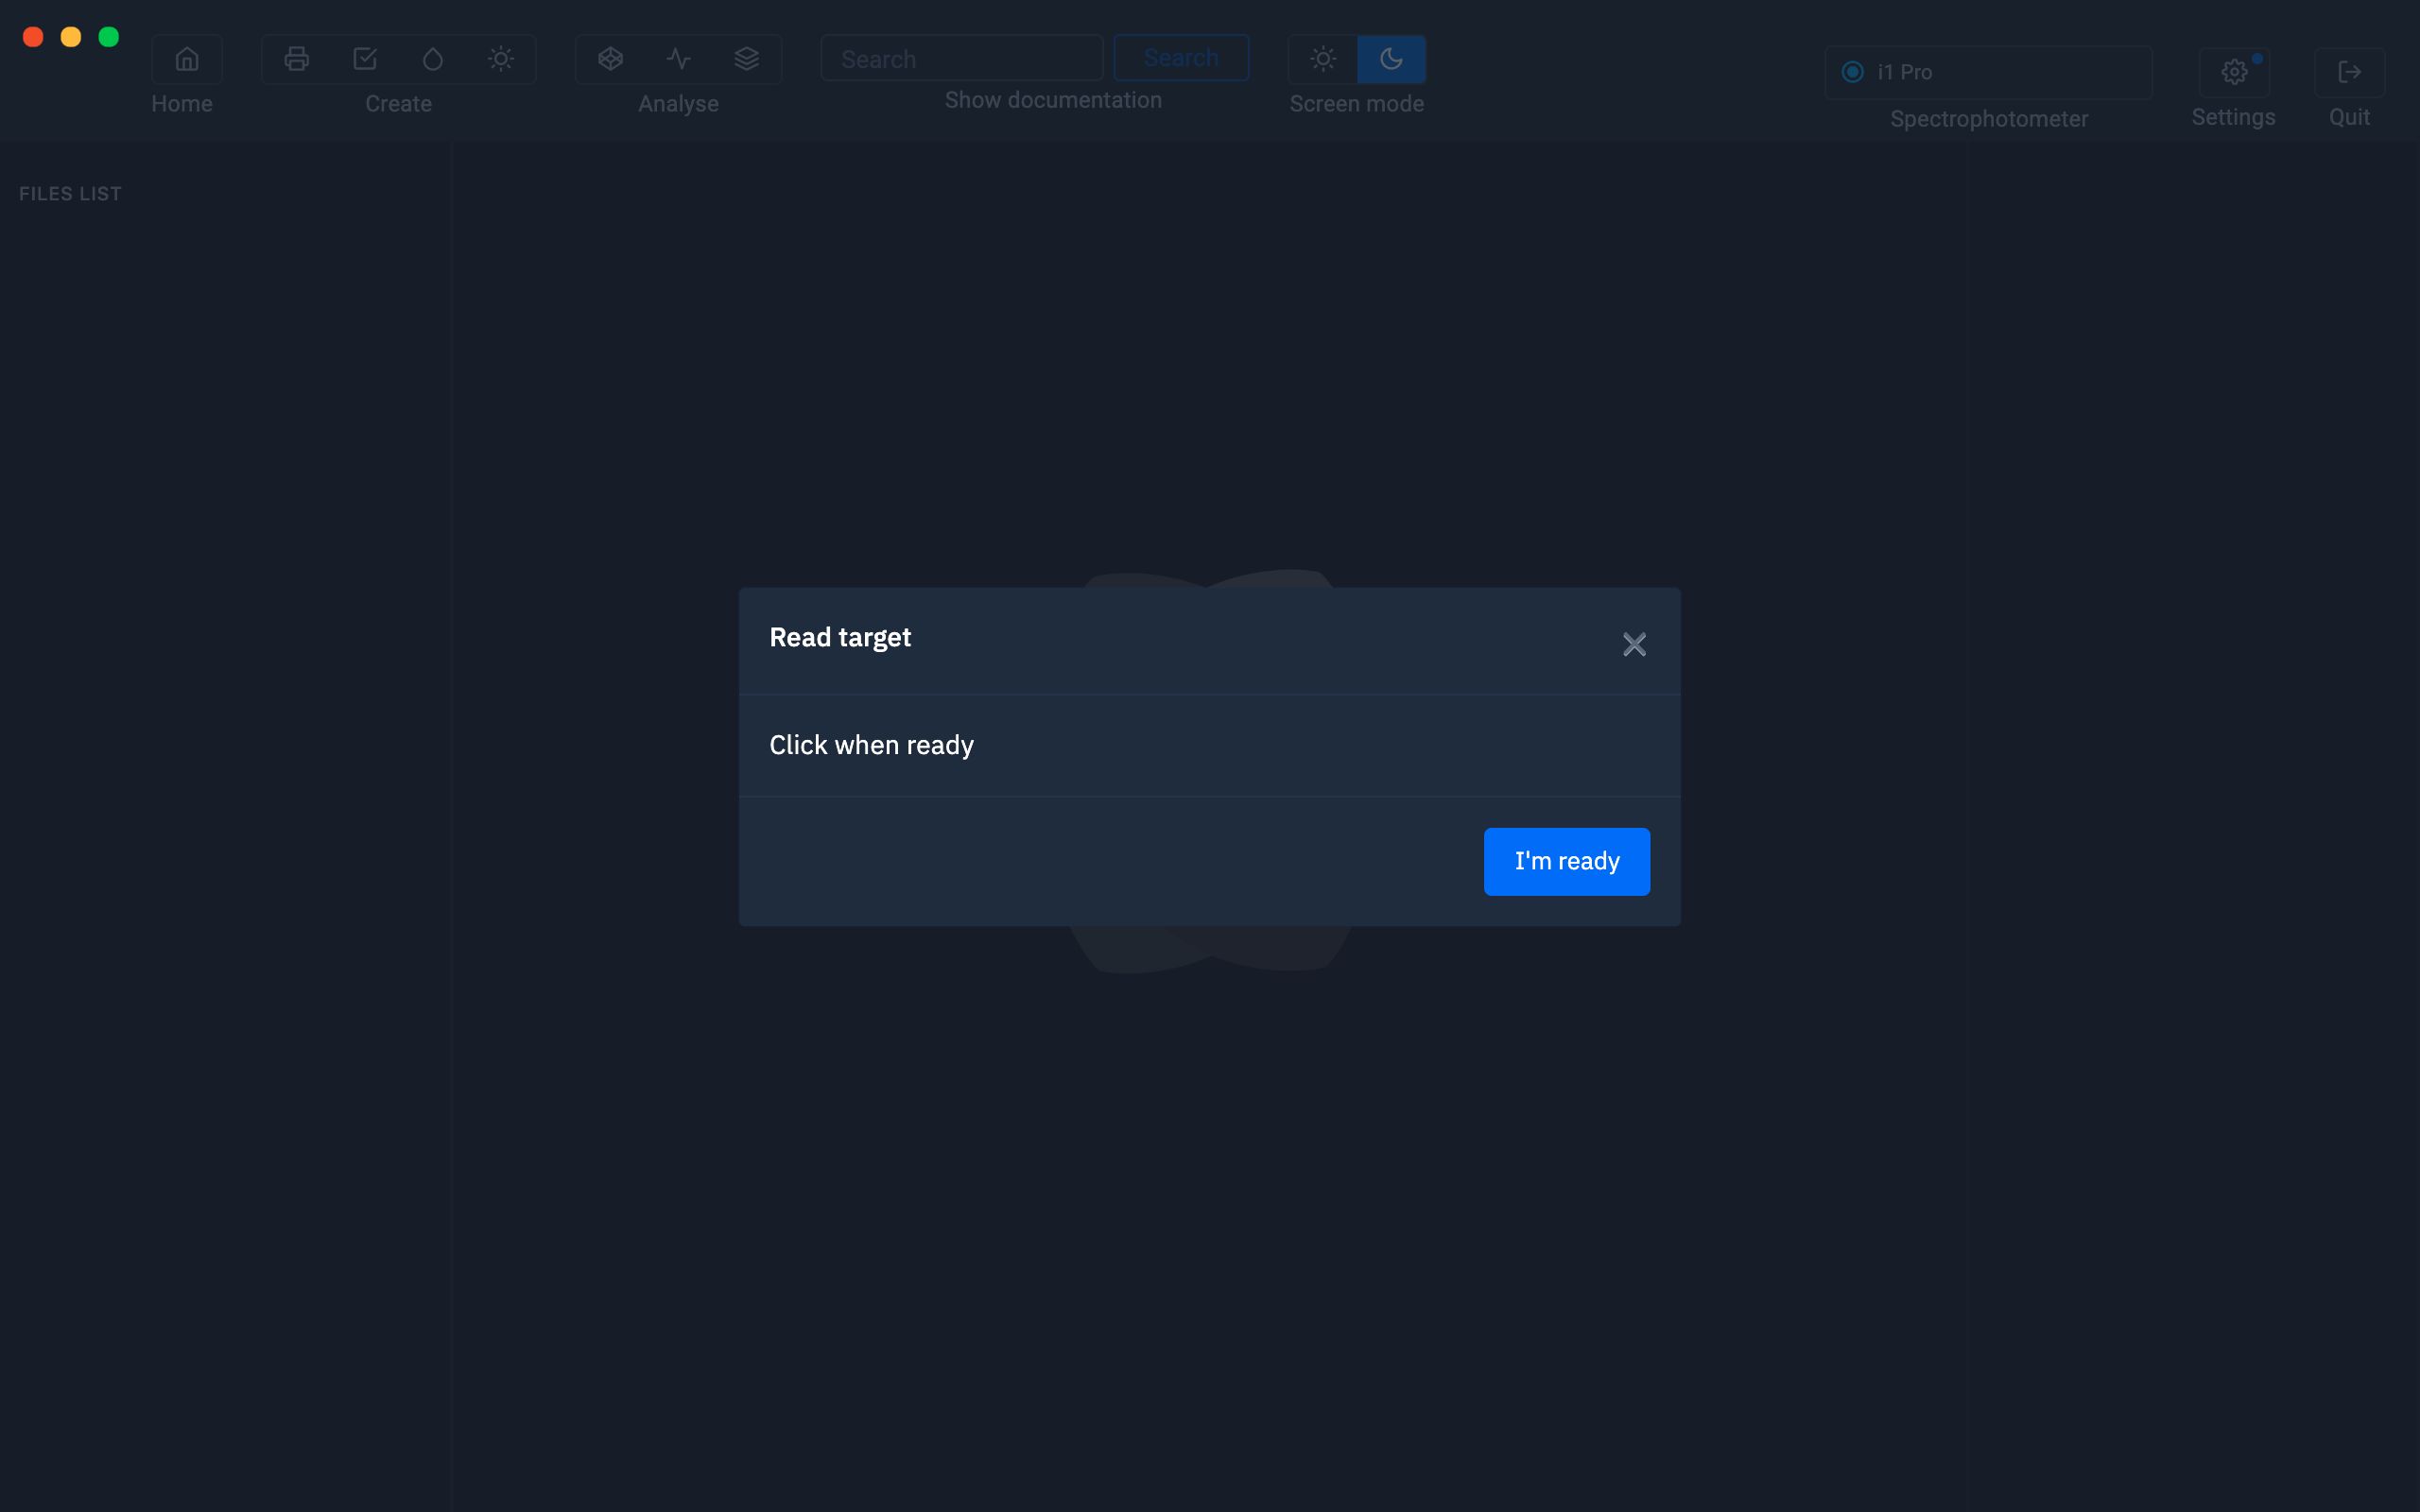
When the "Read the test pattern" window appears, click on "I'm ready".
A new window will appear to calibrate your spectrophotometer.
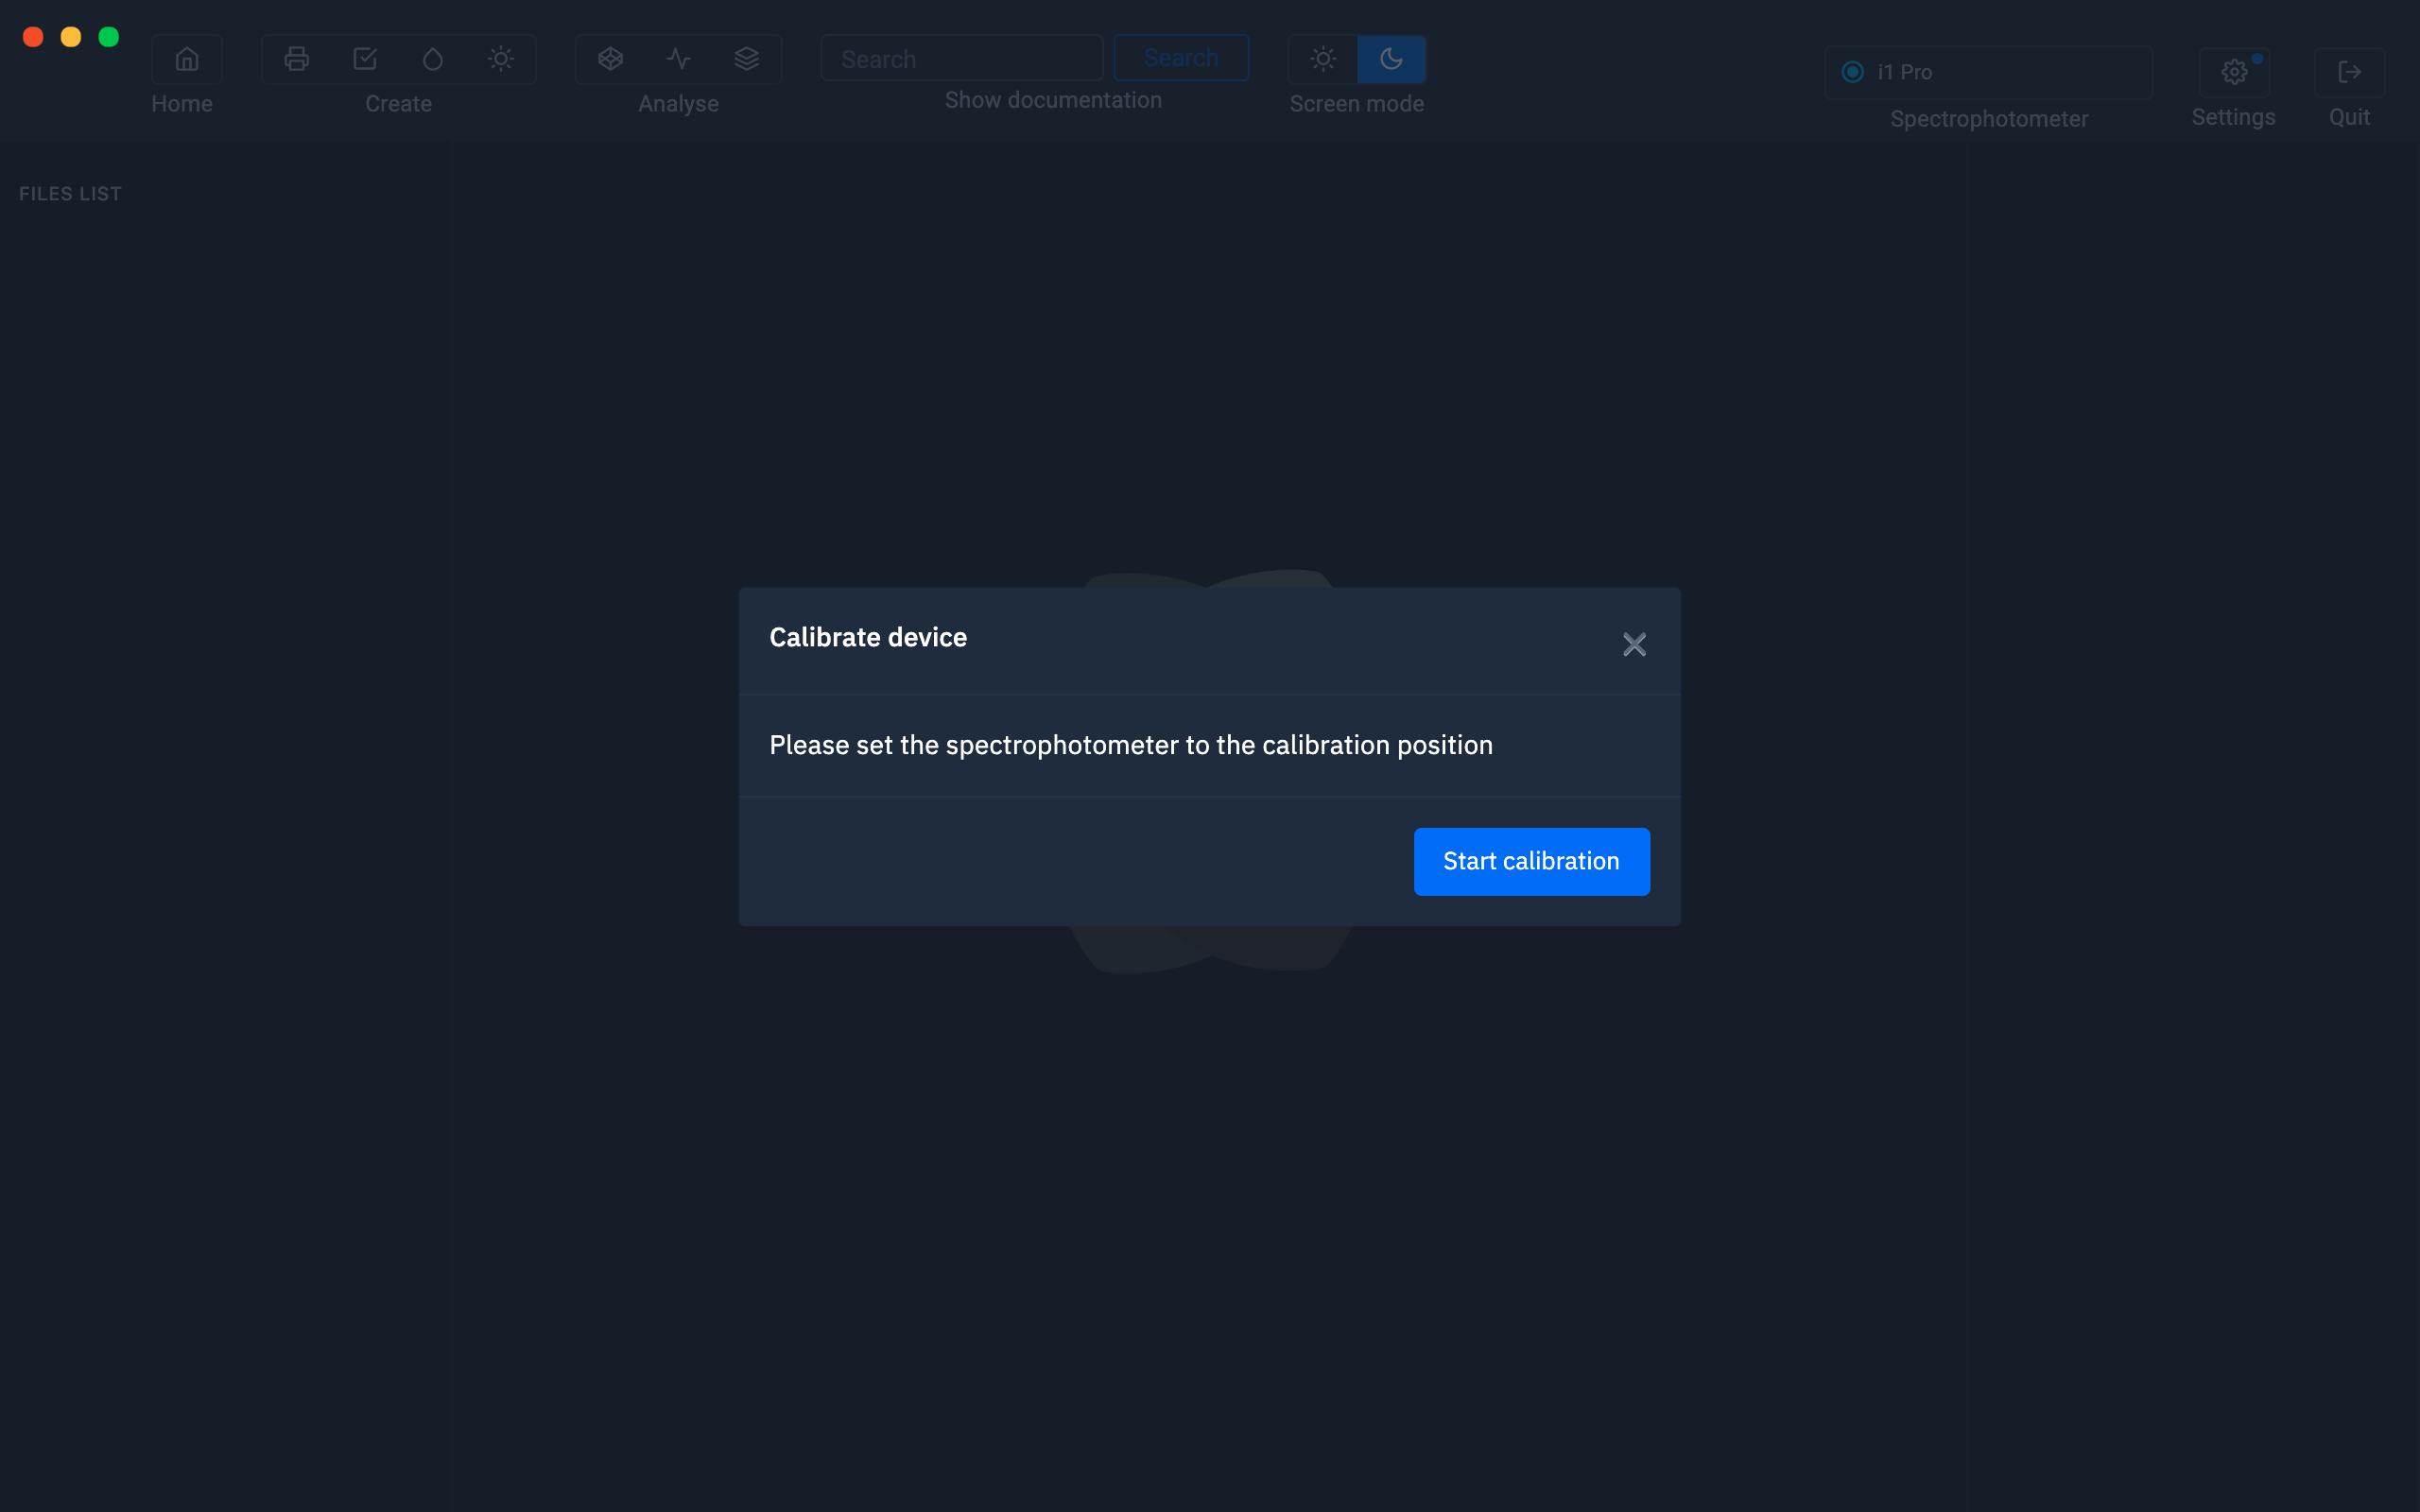
Place the spectrophotometer in its calibration position in its calibration position.
|
Konica Minolta MYIRO |
|
| XRite I1 Pro 3 |
|
| XRite I1 Pro 2 | |
| XRite I1 Pro | |
Then click on the Start calibration button.
When the calibration is complete, a new window will appear.
Attention, you must use the cap to read the light with
the Konica Minolta MYIRO, the XRite Eye One Pro 1, 2, 3 and 3 PLUS.
|
Konica Minolta MYIRO |
|
|
XRite Eye One Pro 3 and 3 PLUS |
 |
| XRite Eye One Pro 2 |
|
| XRite Eye One Pro |  |
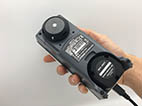
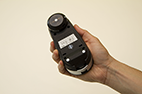
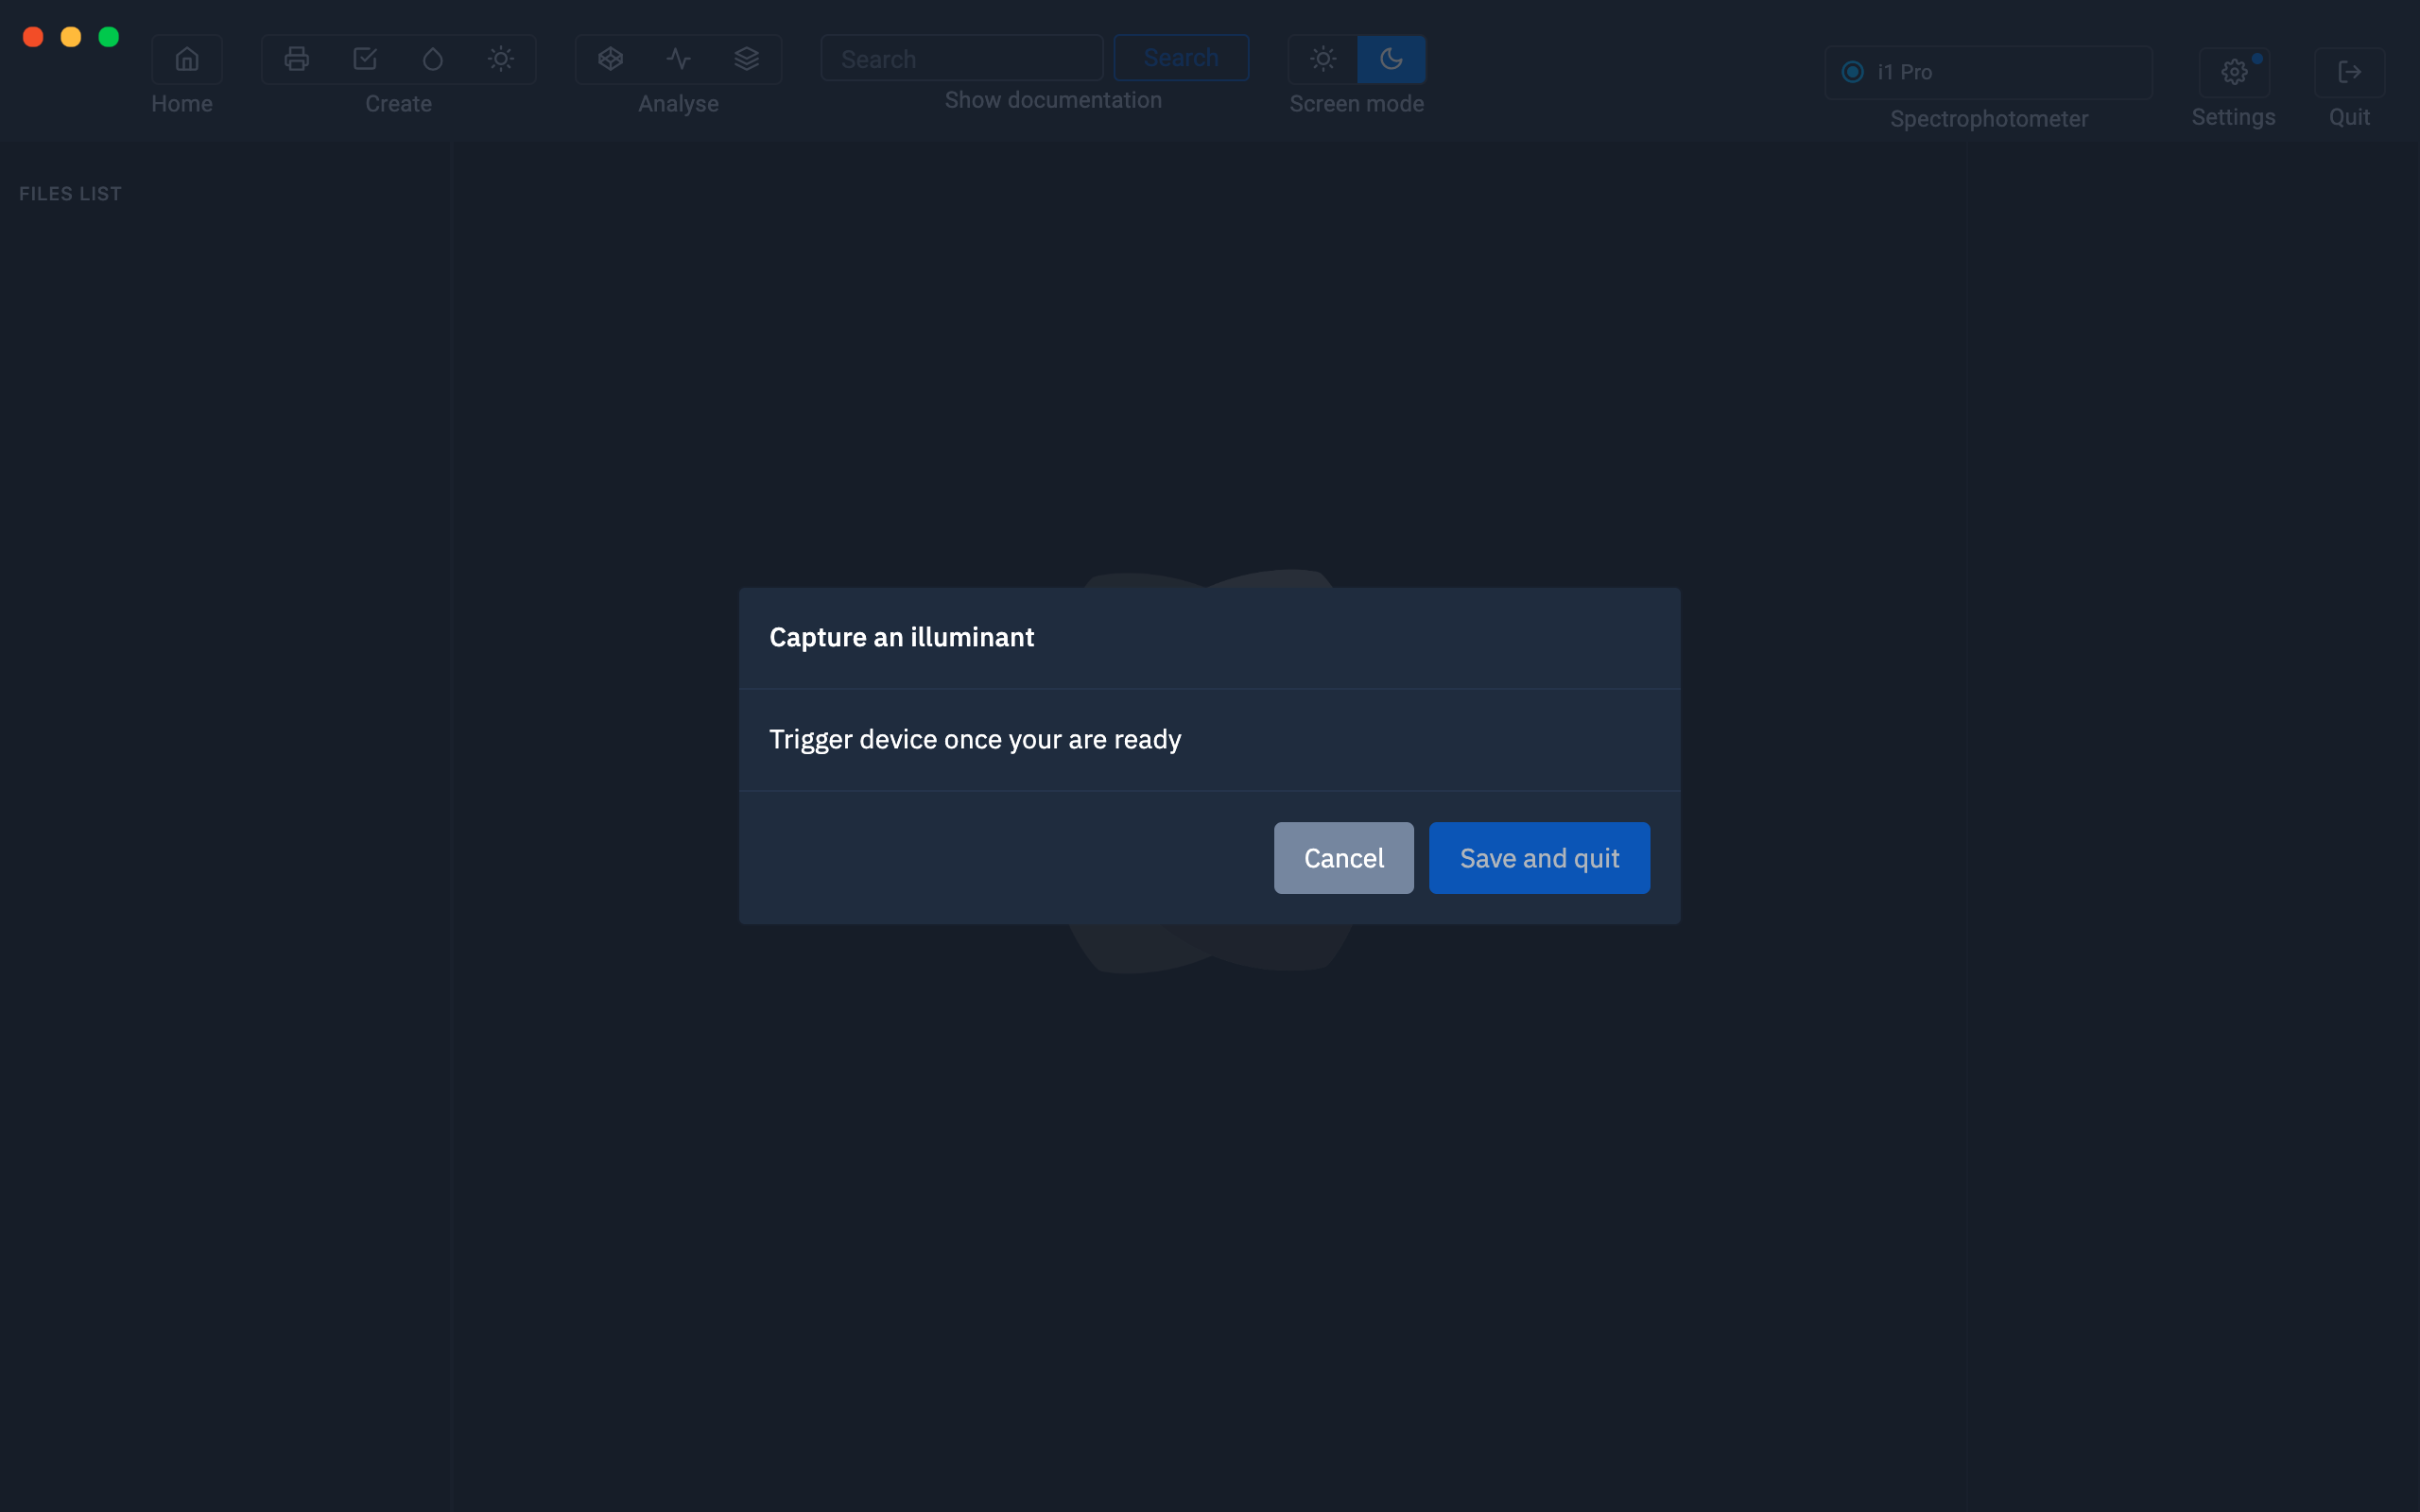
To capture the light, it is now sufficient to measure directly with the spectrophotometer.
Successive measurements will be displayed one below the other.
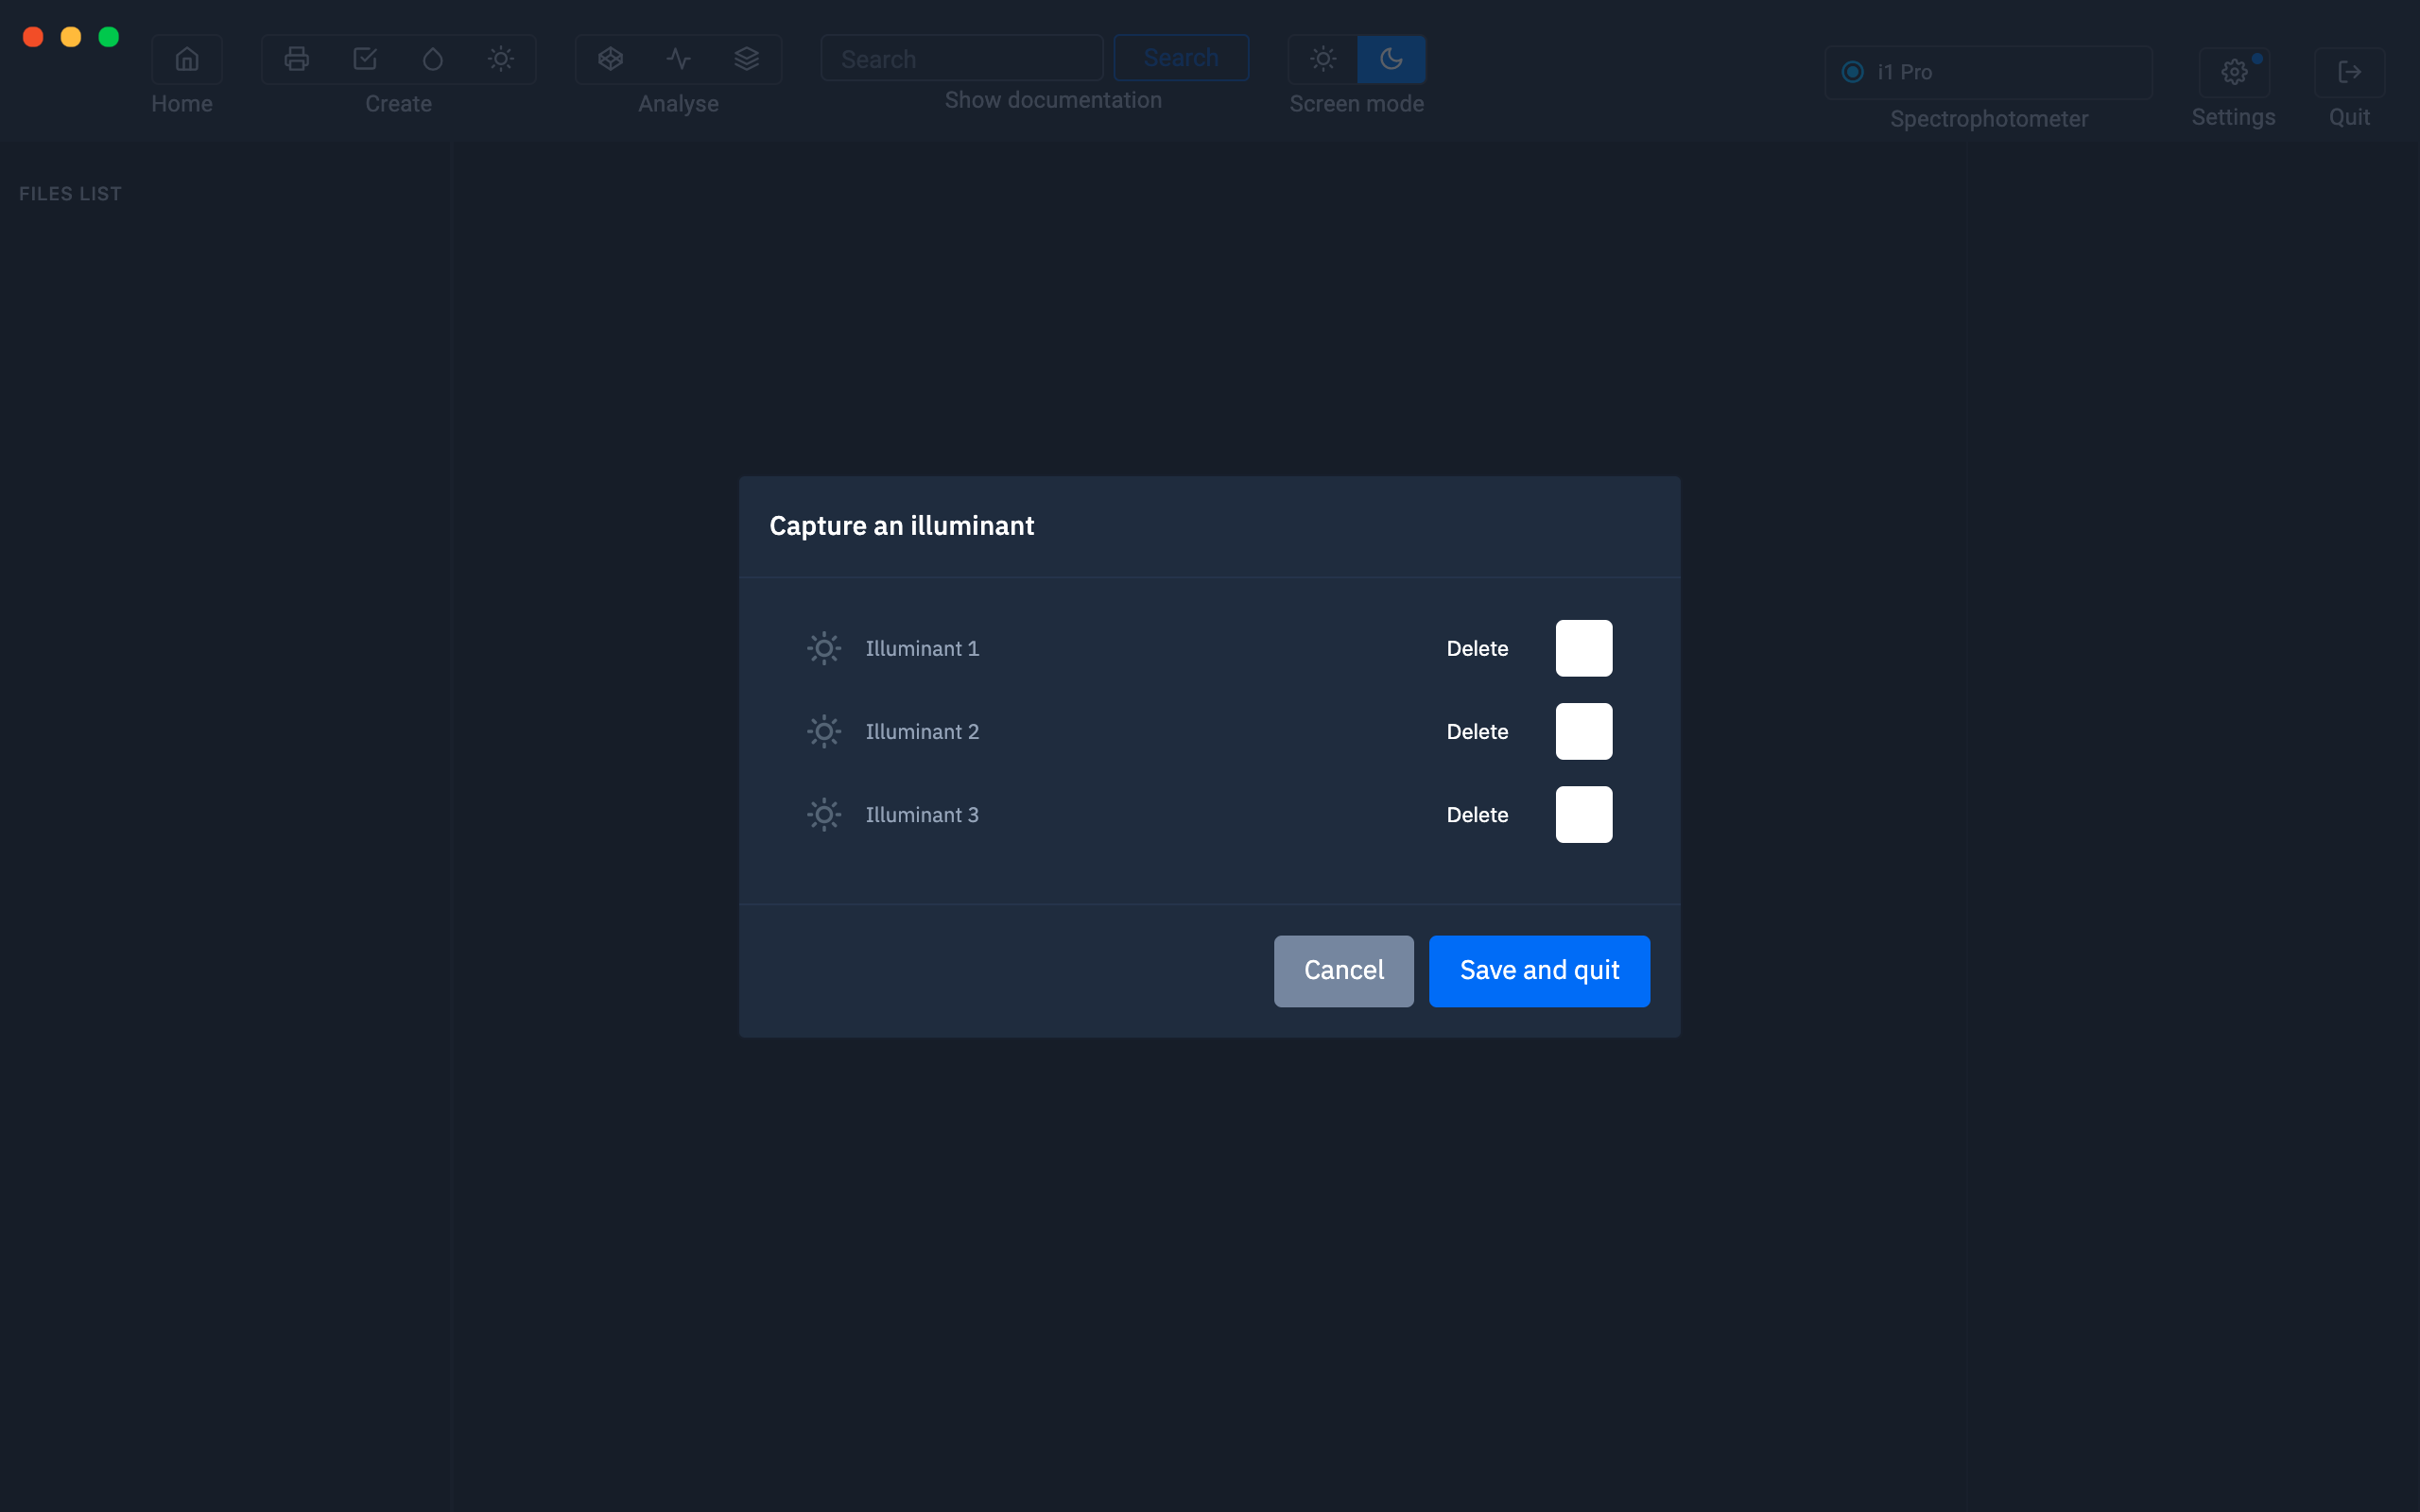
You can take multiple measurements and rename them as you want.
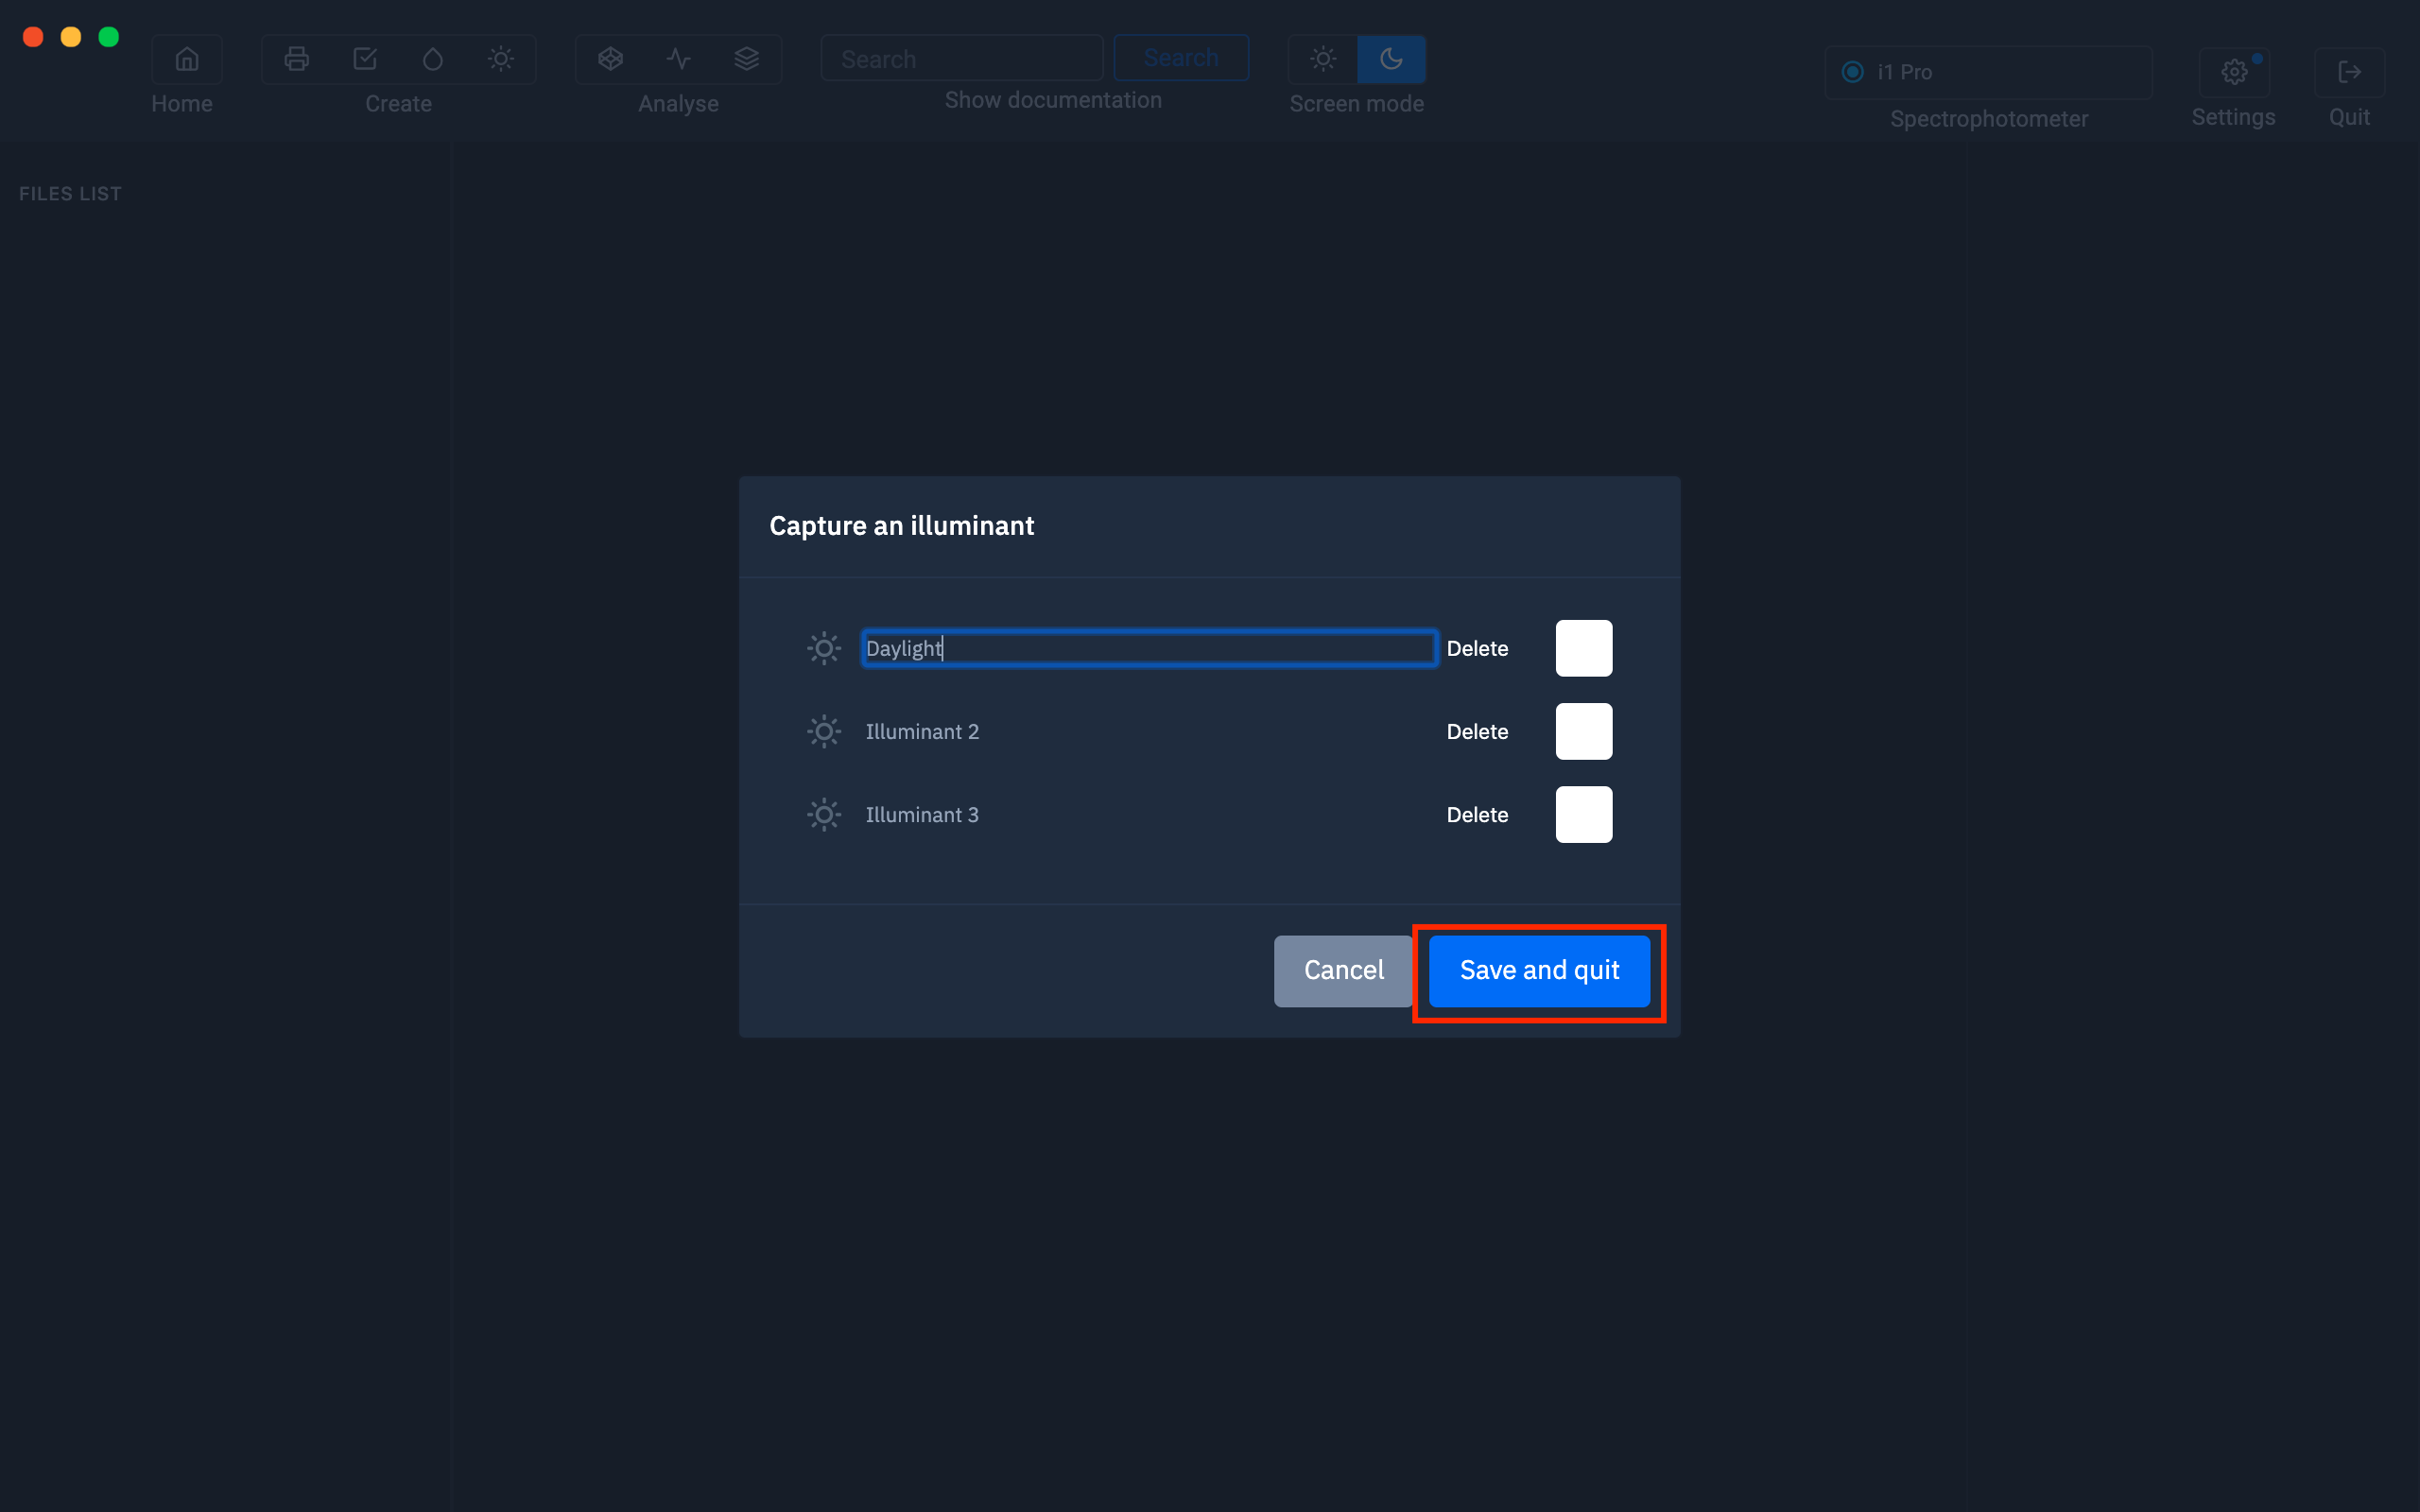
When your measurements are complete, click on “ Save and exit”.
Your light samples will be added in the left column.
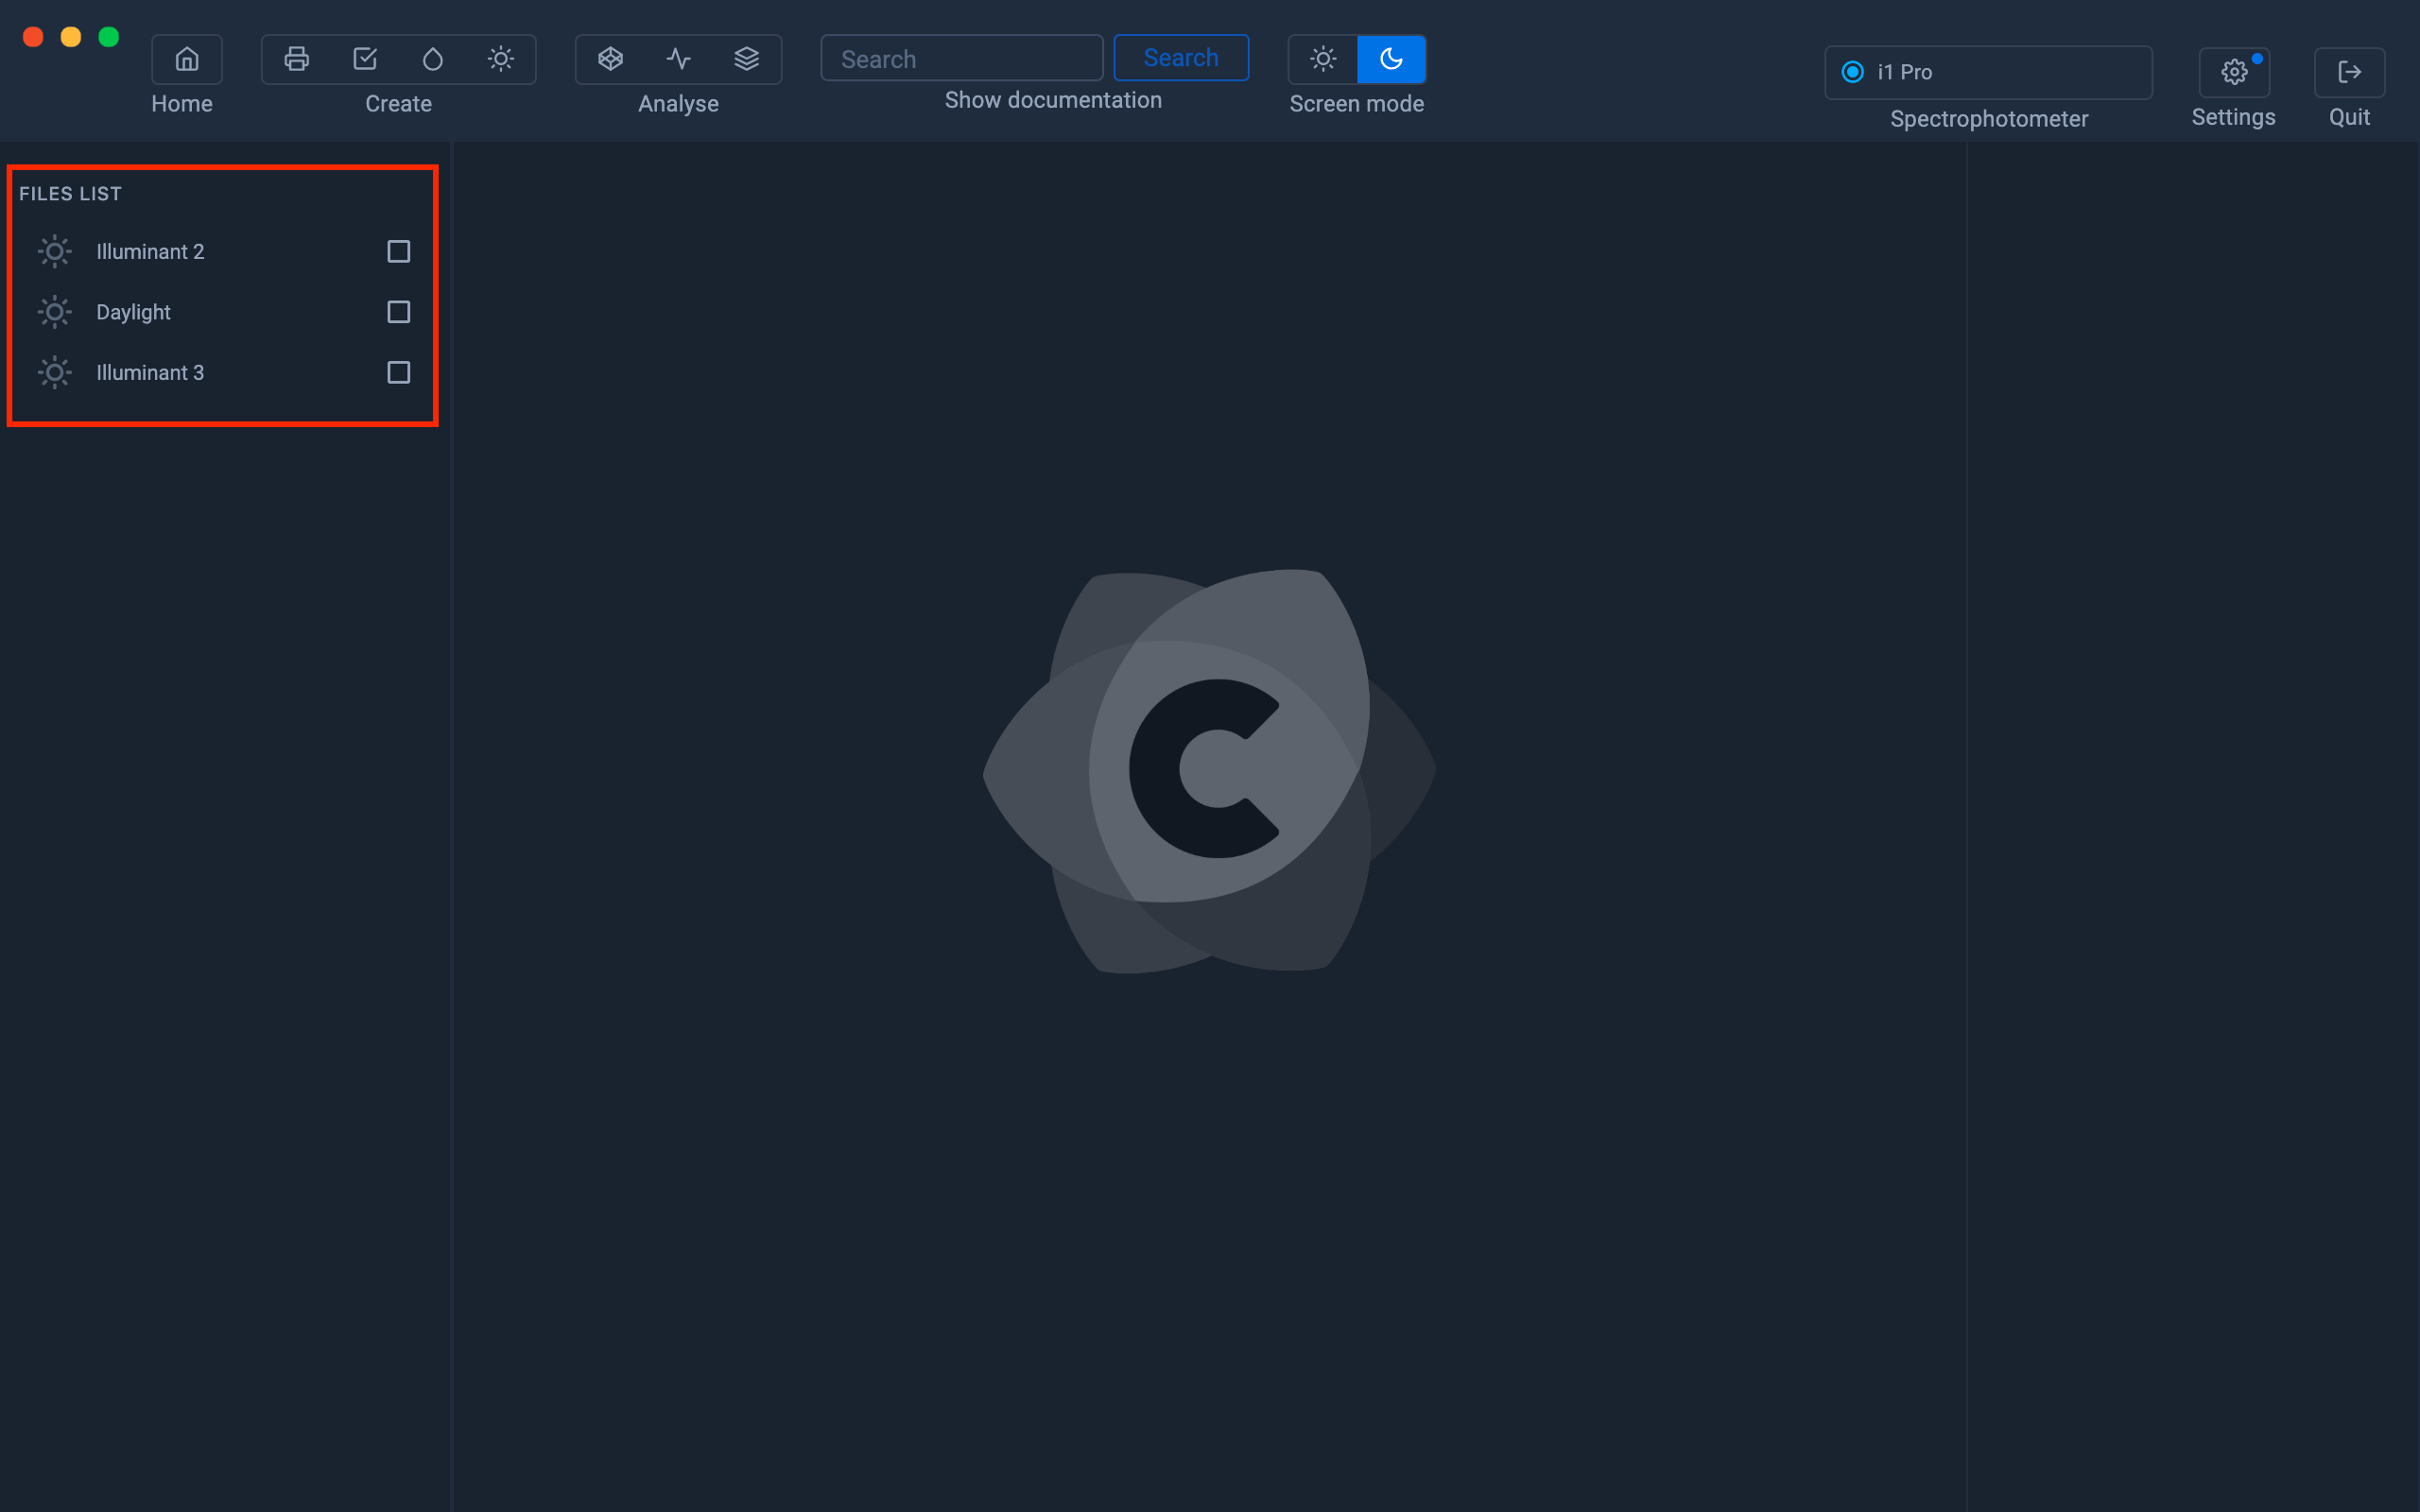
How to manage your light samples
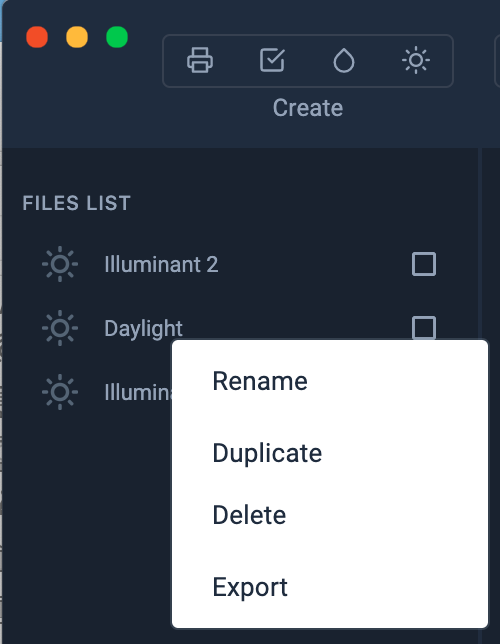
Right click on the color to rename, duplicate and delete.
These .sp files are useful for sharing and saving your light samples.
What are the values associated with the measured sample?
When we measure a light, we can get information like CCT, CRI, Ra, Brightness, Lab and x, y.

The CIE Color Rendering Index ( CRI ) is a method of determining how the illumination of a light source in eight samples compares to that provided by a reference source. Cited together, the CRI and CCT provide a numerical estimate of the reference (ideal) light source that most closely approximates a given artificial light and the difference.
The IRC is a quality index for evaluating an illuminant. It is expressed as a percentage. the higher the value, the better the quality of the illuminant.
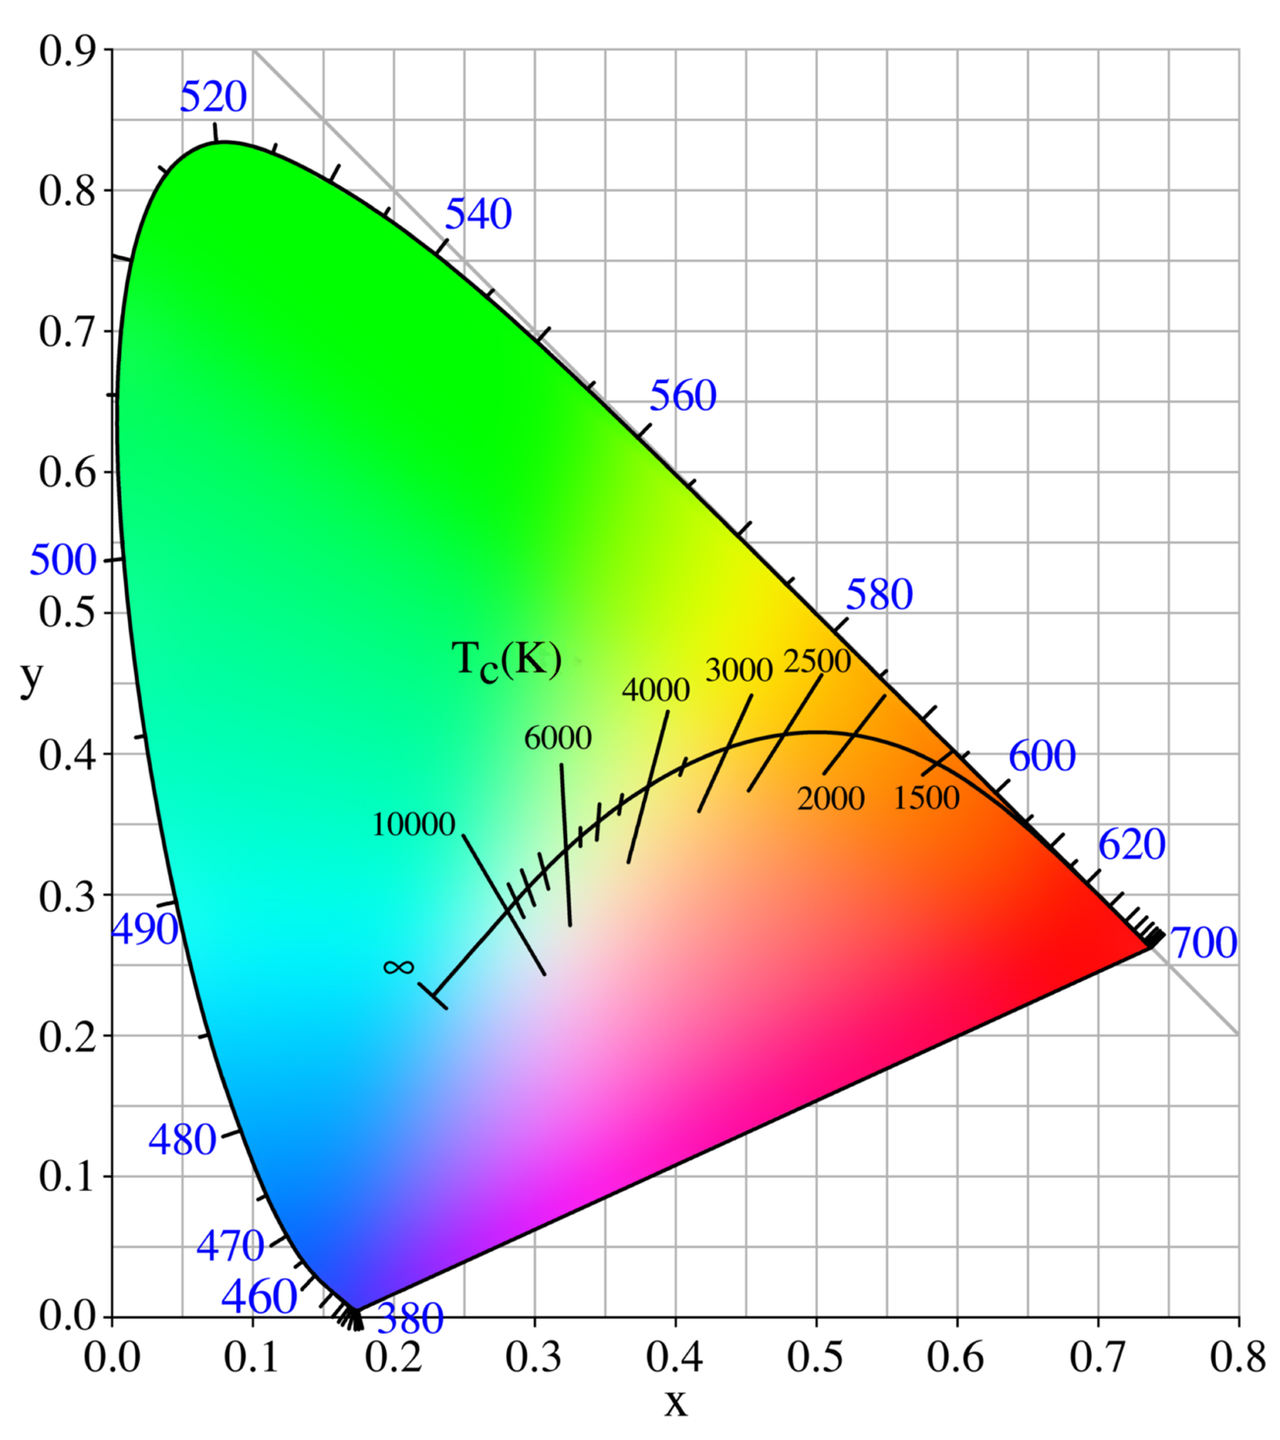
The color temperature of a light source is the temperature of an ideal blackbody radiator emitting light of a color comparable to that of the light source.
Color temperature is a characteristic of visible light that has important applications in the fields of lighting, photography, videography, publishing, manufacturing, astrophysics, horticulture and other fields.
In practice, the color temperature only makes sense for light sources which in fact correspond quite closely to the radiation of certain black bodies, that is to say a light ranging from red to orange to yellow to white. to bluish white; it does not make sense to speak of color temperature, for example, of a green or purple light.
Color temperature is usually expressed in kelvins, using the symbol K, the unit of measurement for absolute temperature.
The color temperatures greater than 5000 K are called "cold color" (bluish), while the lower color temperatures (2700-3000 K) are called "warm colors" (yellow).
"Warm" in this context is an analogy to the heat flux radiated from traditional incandescent lighting rather than temperature.
The spectral peak of warm-colored light is closer to infrared, and most warm-colored natural light sources emit significant infrared radiation.
The fact that "warm" lighting in this sense actually has a "cooler" color temperature is often confusing.
Source: Wikipedia
To save your measurement, right click on the measured light in the left bar, then select "Export" to save as a .sp file.
As you see, you can also rename, duplicate or delete the file when you click on it.
Control your stand or your viewing conditions
IllumReader can be useful for checking uniformity, color temperature, light intensity in a booth, and checking viewing conditions for proofs, objects and prints. In the field of graphic arts, ISO standards have been defined to standardize the conditions for viewing prints. Knowing how to control your light is, in a way, knowing how to control your color.
| Viewing condition | P1 Critical Comparison | P2 Practical Appraisal |
 |
 |
 |
ISO 3664: 2009 - VIEWING CONDITIONS
Light source
• The relative spectral power distribution should match that of the CIE D50 illuminant.
• UV energy must comply with CIE D50 illuminant (correlated with M1 in ISO 13655).
Two levels of light intensity
• Critical comparison P1: for example two impressions: illuminance 2000 ± 500 Lux
• Practical evaluation of P2: less critical comparisons, for example. software-proof hard copy: 500 ± 125 Lux or exact adjustment of the illumination of the lighting booth to be monitored
Additional definitions
• Homogeneity (control over 9 areas in your stand)
• Surrounding: neutral gray diffuse surface
• Viewing angle to avoid reflections
Light measurement can be used to calculate an Isc profile.
View your reflectance curves in Spectral Viewer.
It might be helpful to compare the reflectance curves of your color sample with a spectral curve of a specific light to understand the effect of metamery.
If you need to view the spectral curve of your measured light, you can use the spectral viewer.
For more information, see chapter: Spectral Viewer
Color Finder
Color Finder helps you find one color among thousands of others! Let's learn how to use it.
Do you need to find the color closest to your reference swatch, among the colors of a PANTONE®, RAL® guide or a custom guide, such as a color guide on fabric, vinyl or leather?
If so, Color Finder is the tool for you.
In addition to giving you the closest color, it will quantify the difference between the reading color and the color closest to your guide (Delta E).
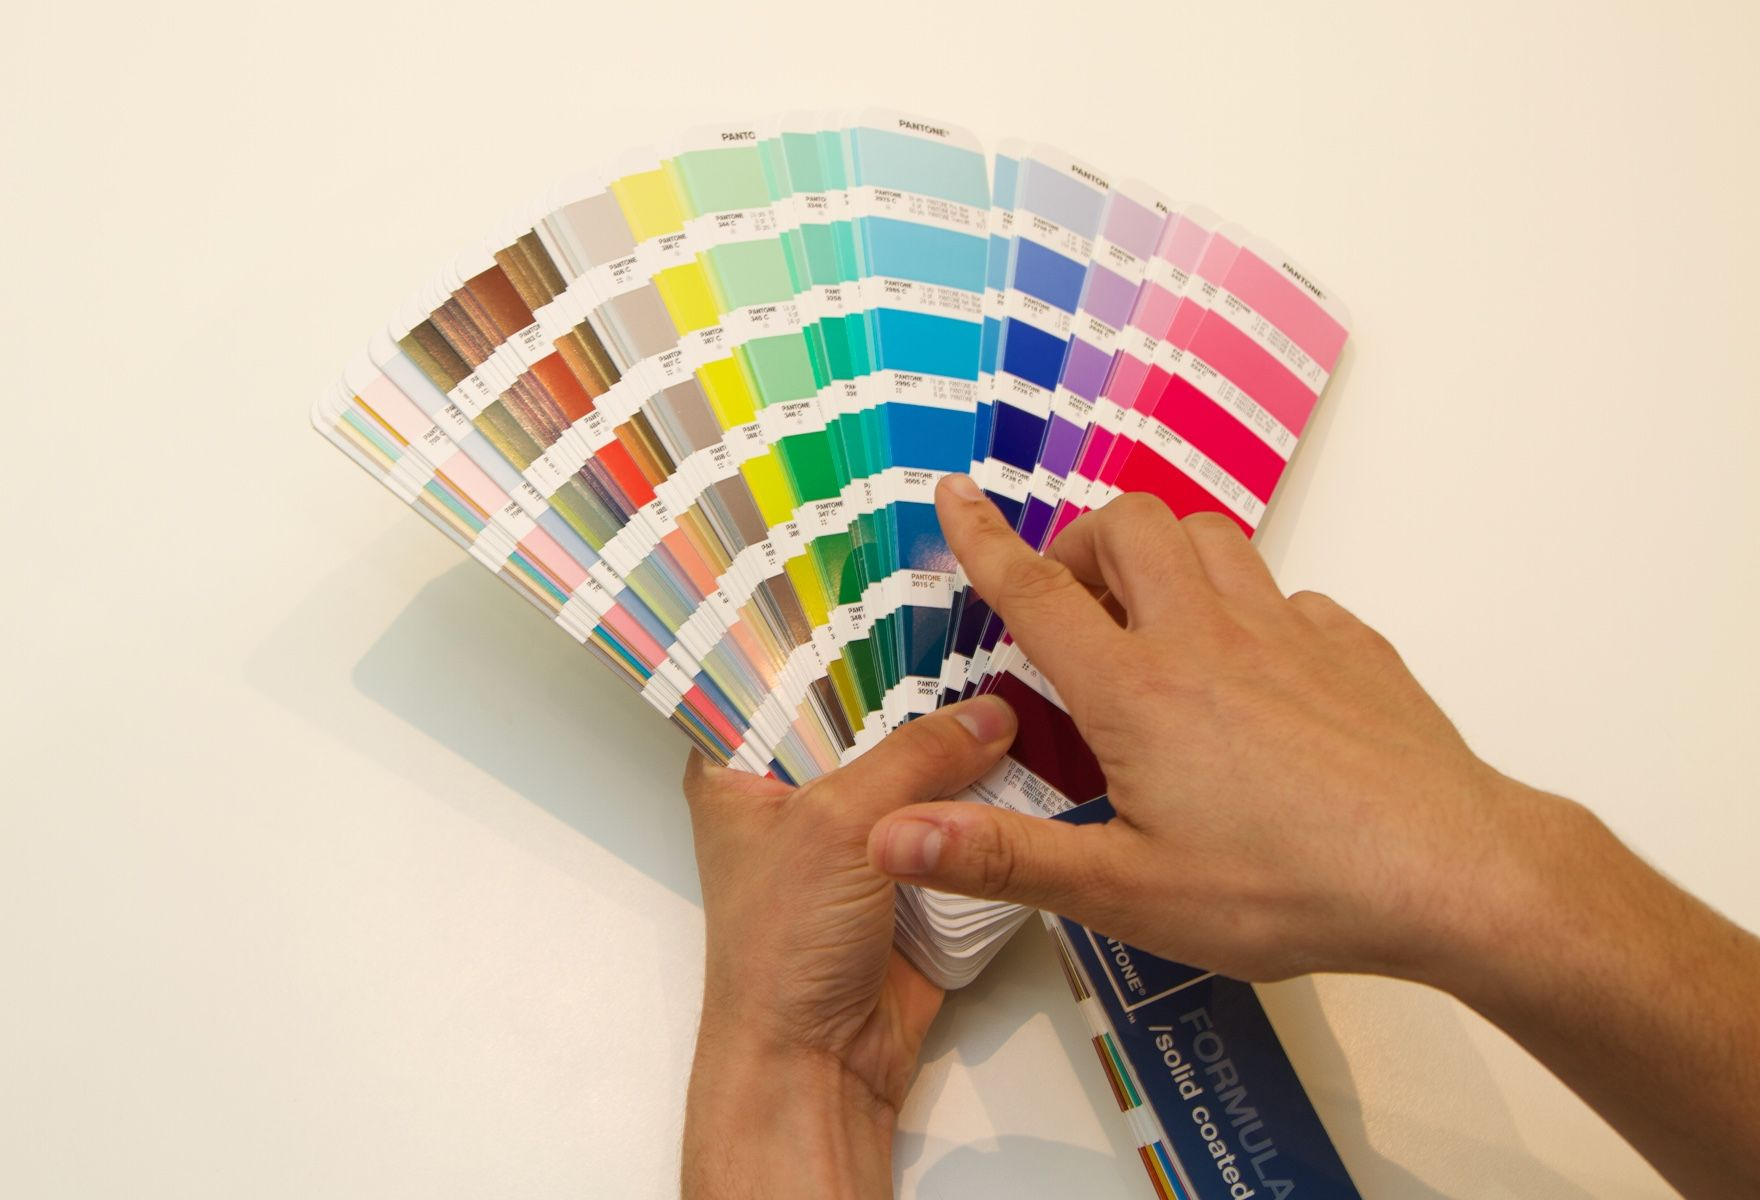
In this example we will be using a PANTONE® spot color table.
To use this PANTONE spot color table, ® you must be licensed to use it.
The best way to get it is to purchase a PANTONE® Formula Guide.
With each one, you will have a code to download the PANTONE® Color Book in digital format with the PANTONE® COLOR MANAGER software.
How to use Color Finder to find a color in a guide
First of all, you must import your color table in a format compatible with Coraye (.cxf, .aco, .acb, .ase, csv, .qtx or .table) and the colors previously read with Color Reader (. spc).
Drag and drop them from the folder to the left column.
Now select the spot color and drag the color table from the left bar to the location of the color table in the lower right area.
The color closest to the guide will appear in the " Near Color " area and the Delta E between the measured color and the found color will be displayed below.
This feature can be useful for knowing which color is closest in a guide such as RAL® or PANTONE®.
But it can also be useful to control the color in a quality control process.
You can also create your own vinyl, fabric or leather color guide to find the right color for any type of application.
Color Converter
The Color Converter module allows you to convert a measured color (or imported from a table) to RGB or CMYK
When you have measured a color with your spectrophotometer, you may need to convert it to RGB, CMYK, or LAB.
Color Finder does this for you and also displays Delta E values after conversion to indicate if the color is reproducible.
How to use Color Converter to convert color with ICC profile
Measure or import the colors to convert, then the icc profile to use to perform the conversion.
For example, I select two ICC profiles (AdobeRGB1998 and Isocoated_v2) and two .spc files (2 colors measured previously.
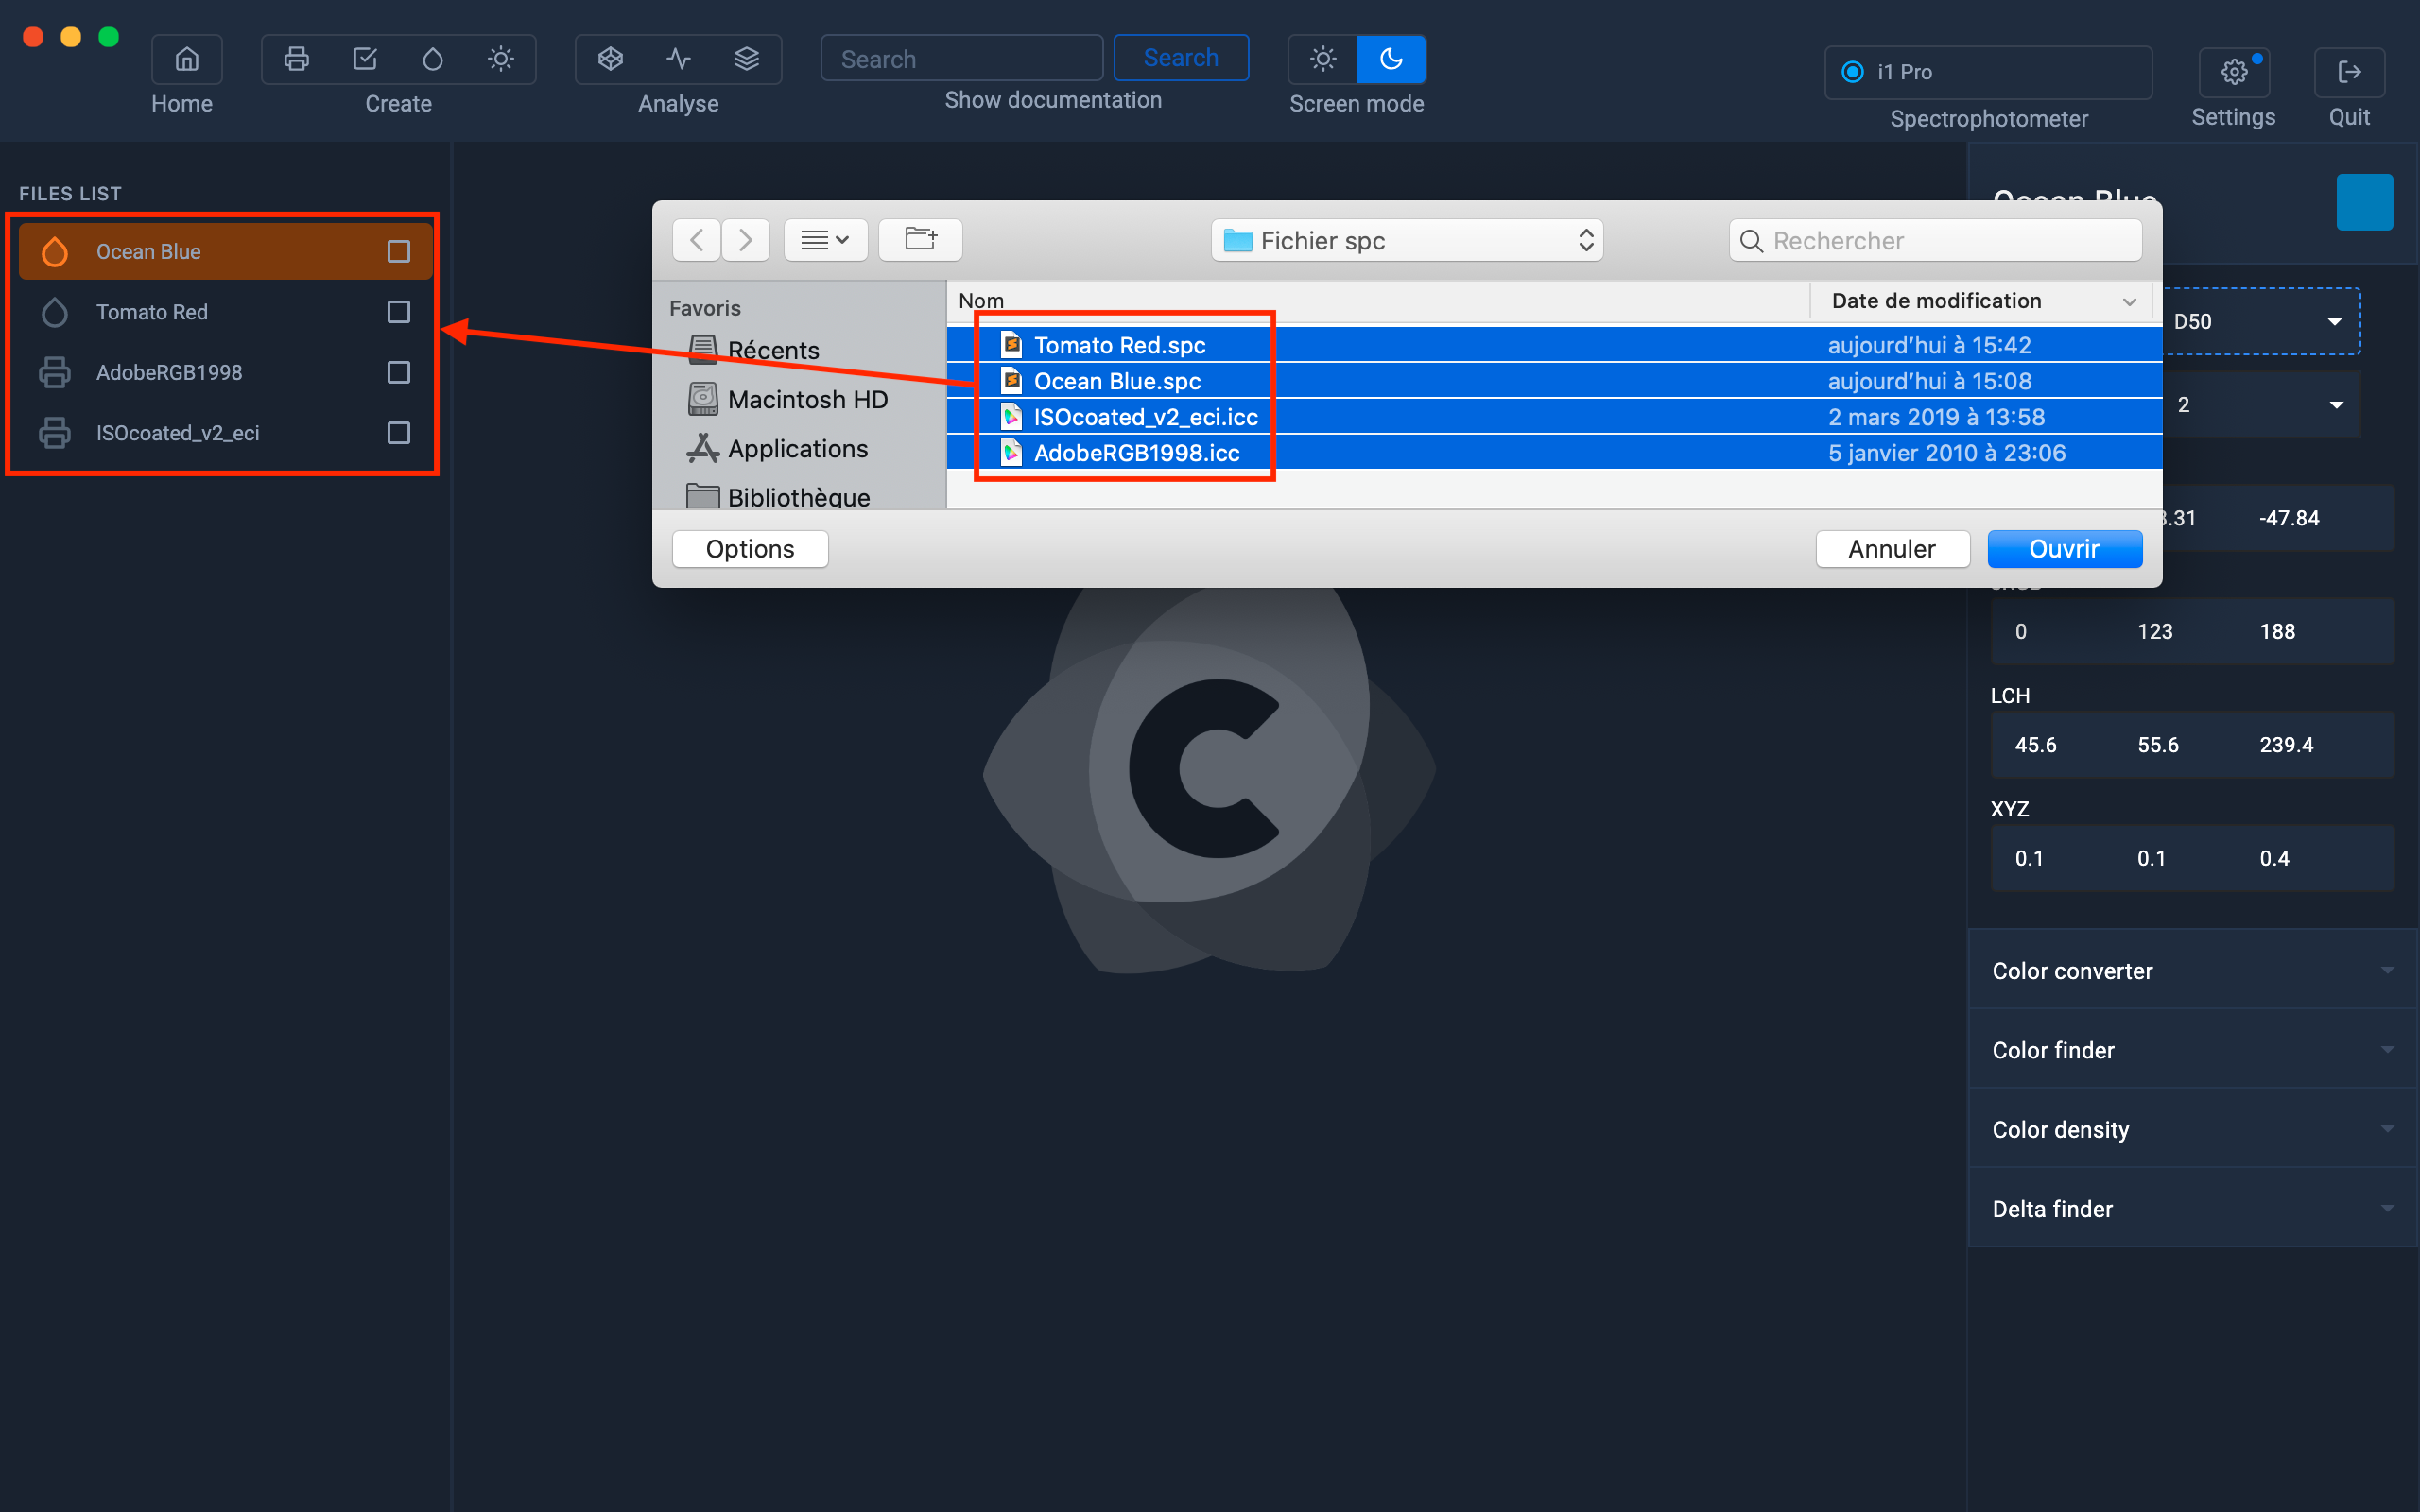
Scroll down to the " Color Converter " menu in the bottom right bar, then drag the icc profile to its location in the Color Converter menu.
Select the rendering intent of the file and the Delta E formula
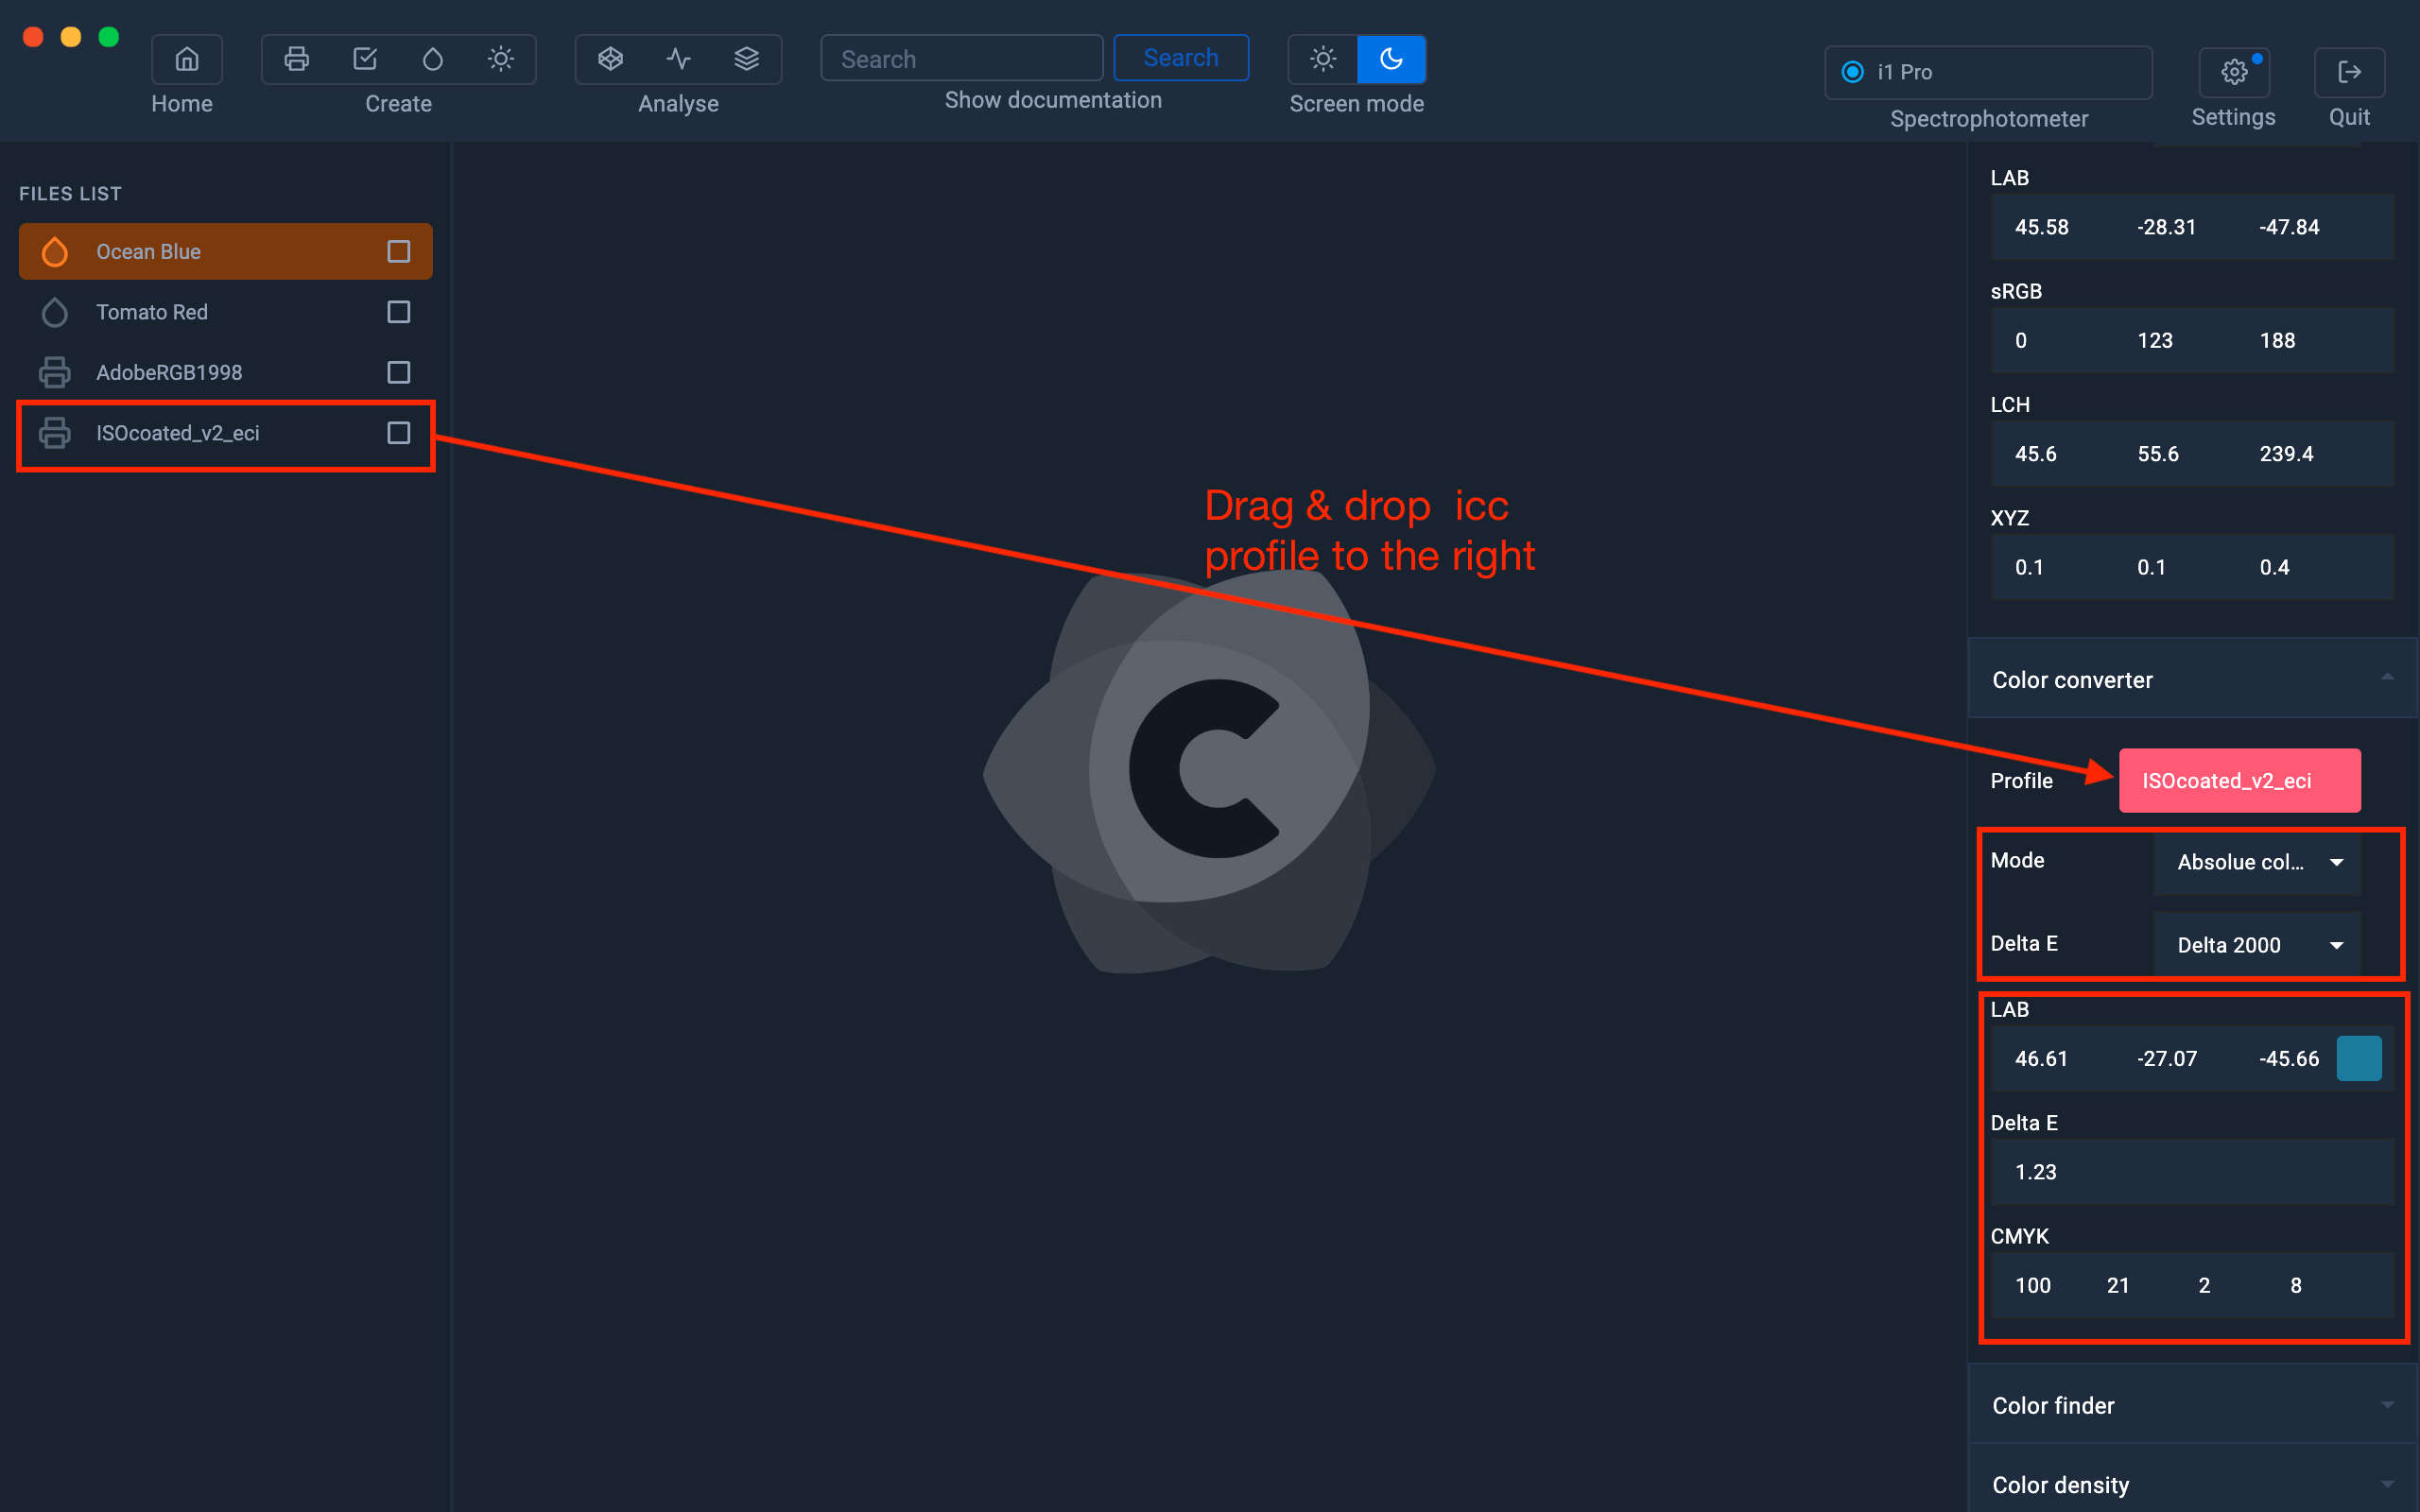
Your color is automatically converted to CMYK or RGB, depending on its color space.
Same example but with an RGB profile, the result will be in RGB.
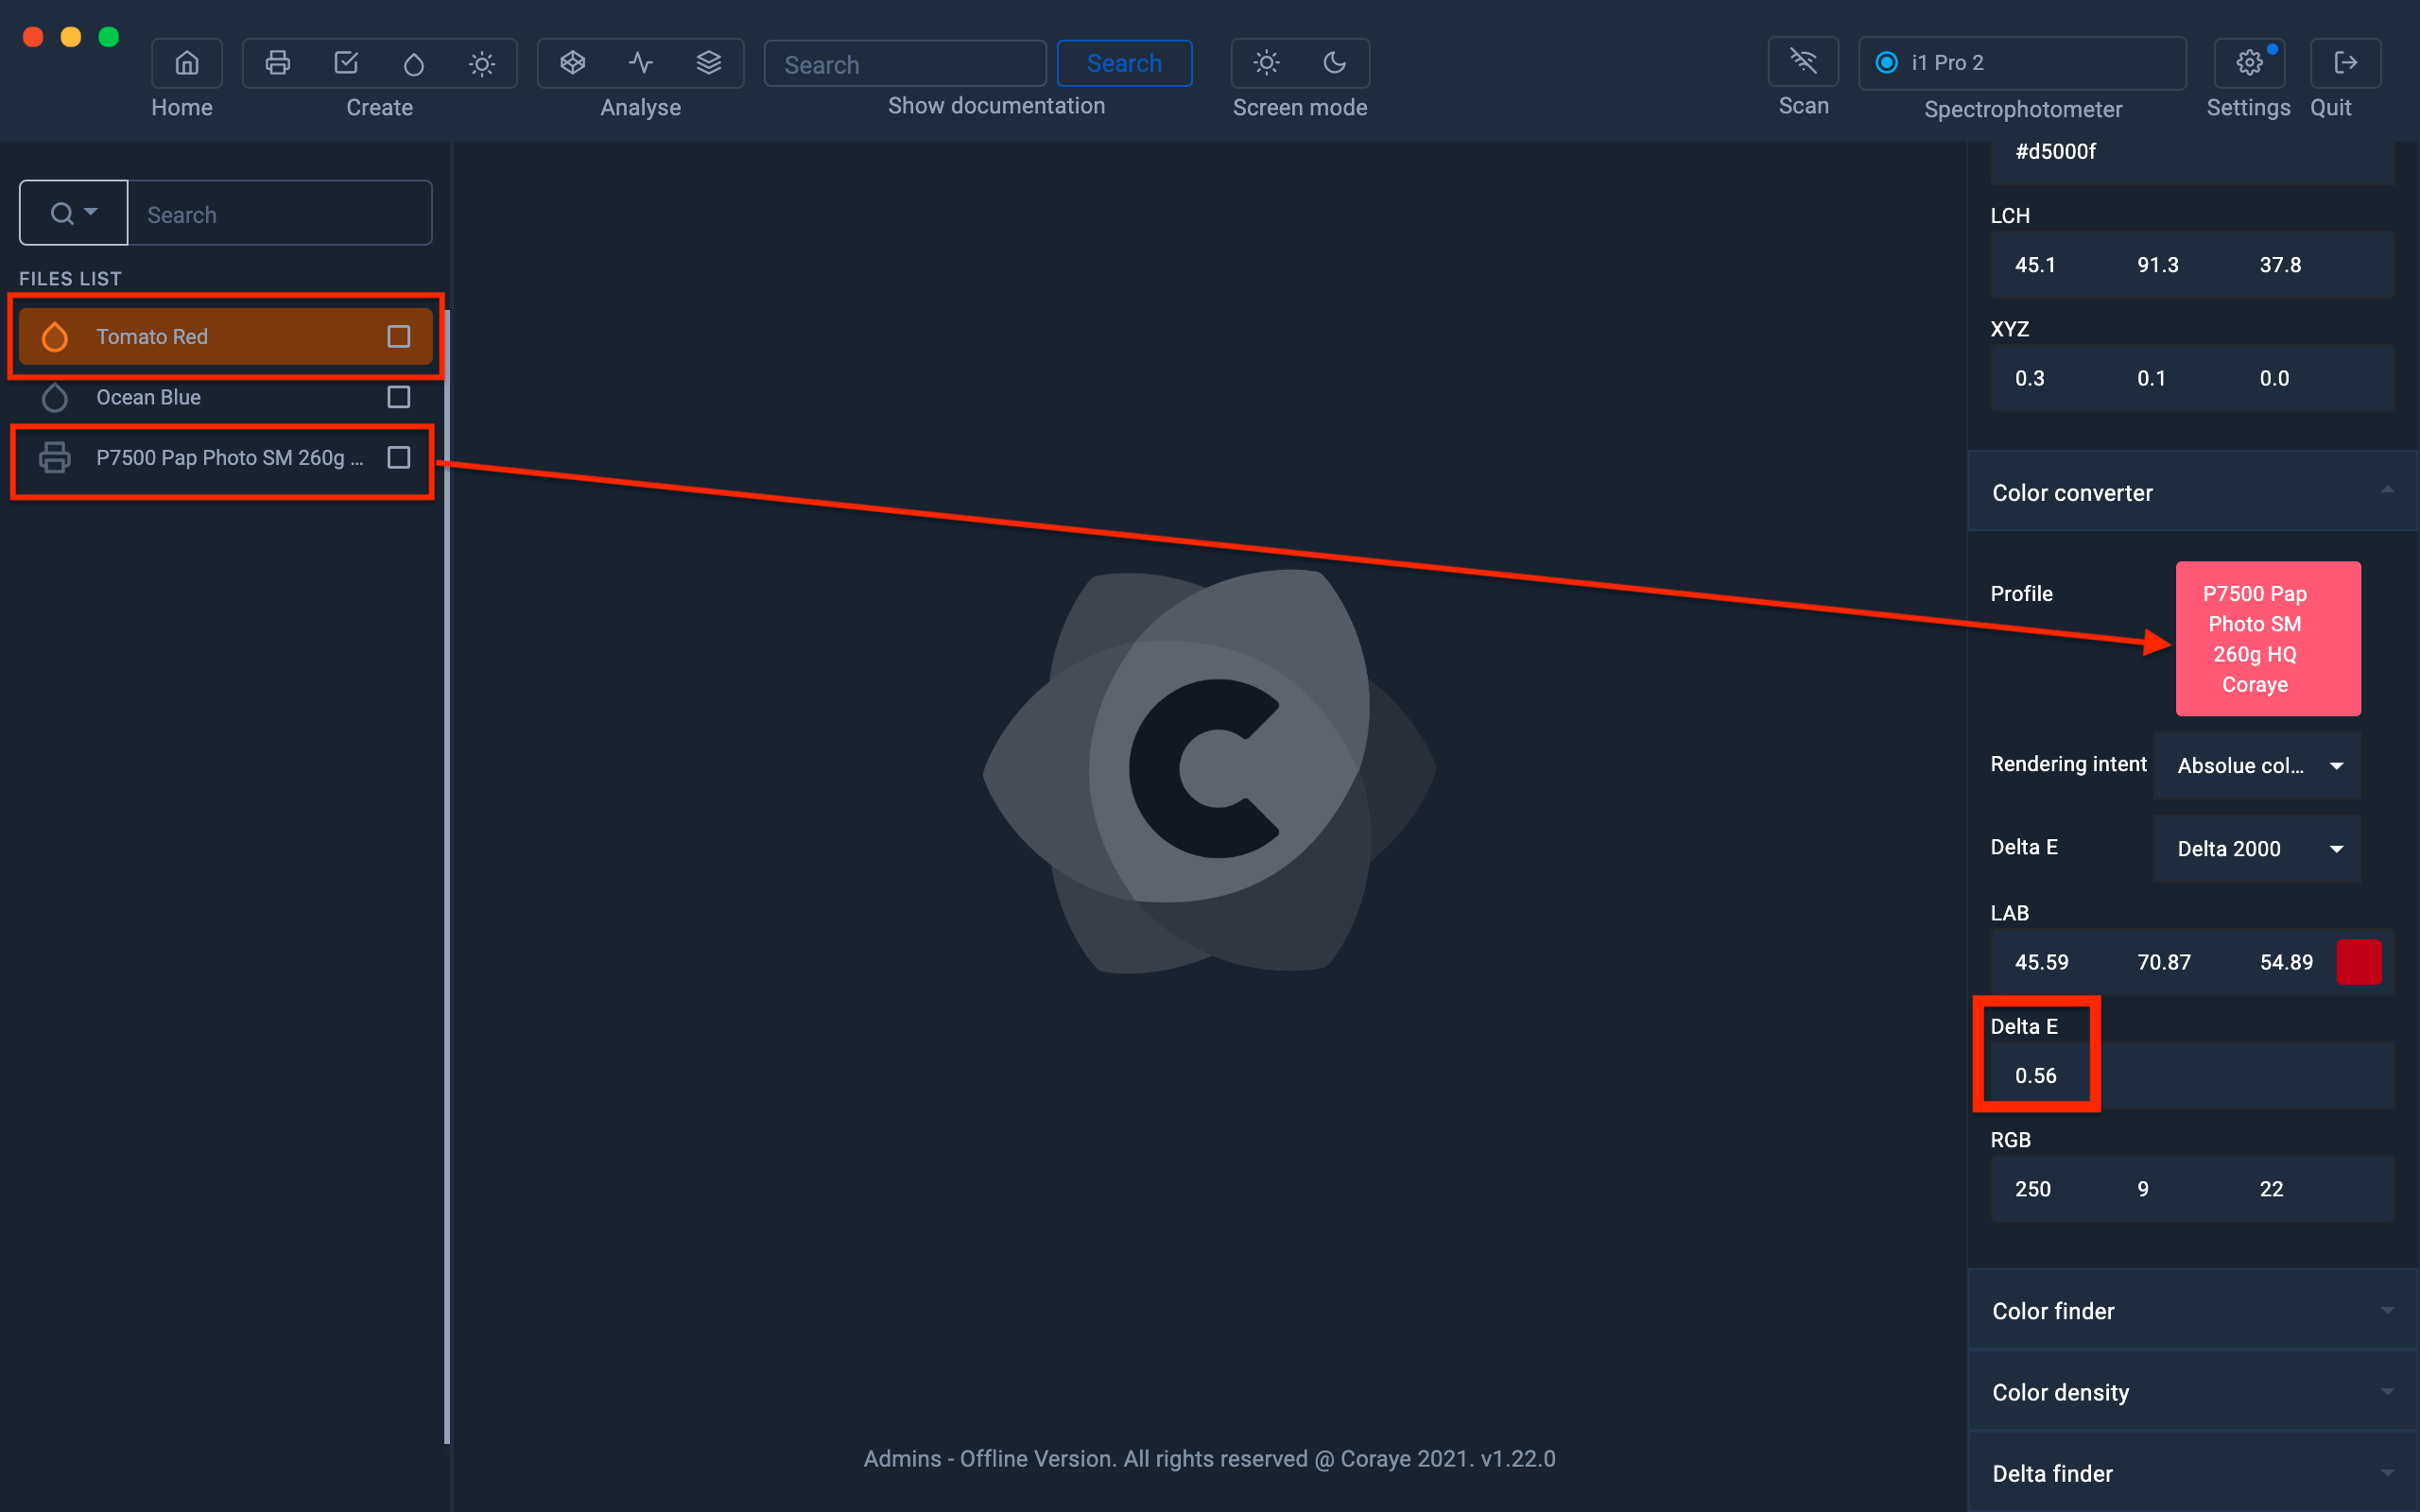
Another example: you can use a paper simulation profile to do the conversion.
If the Delta E is close to 0, it means your color is reproducible on the printer with this paper.
So if your Delta E is greater than 2, it means your color cannot be accurately reproduced.
In the example below, the Delta E is less than 1, the Tomato Red color is therefore reproducible on the Epson SC-P7500 printer
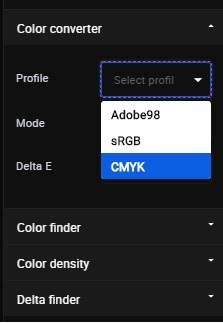
If you don't have a profile to convert your colors, you have a choice of three profiles:
-
sRGB
-
Adobe RGB 1998
-
CMYK (Isocoated_v2_eci.icc) corresponding to the Fogra 39 standard
Delta Finder
This tutorial explains how to compare two colors.
For example a measured color and a Pantone value from a digital color chart.
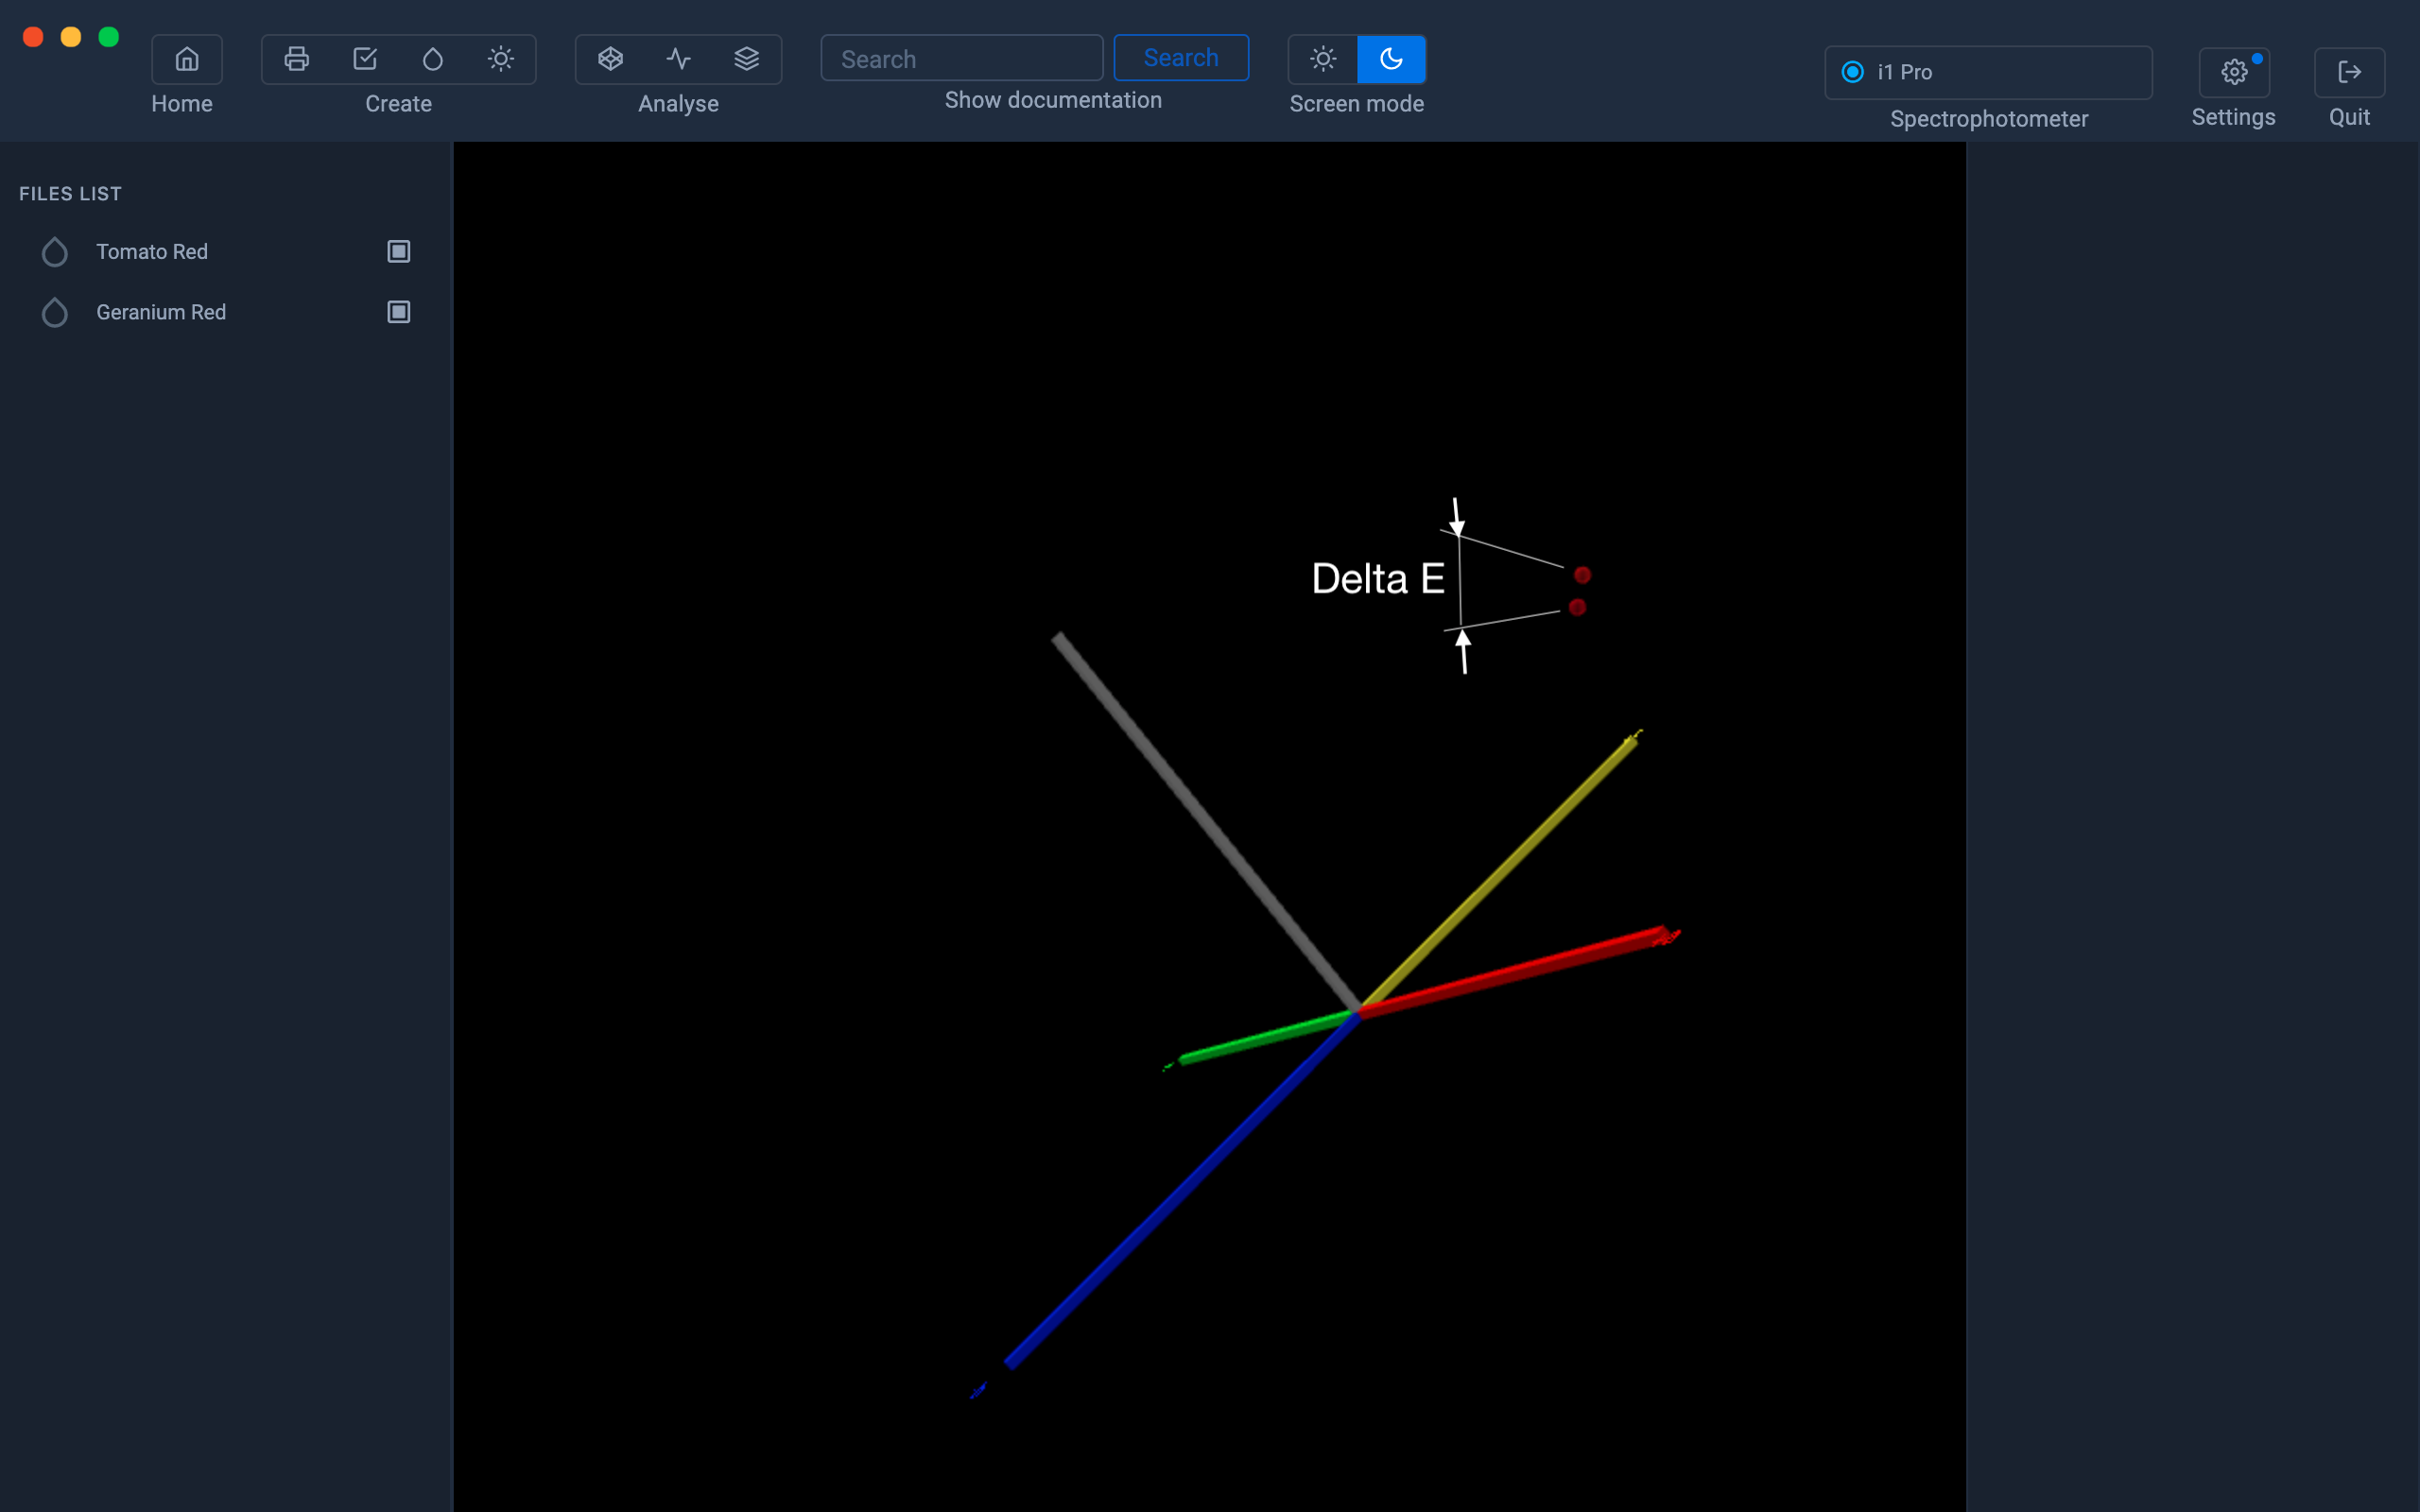
The Delta E makes it possible to quantify the difference between two colors.
But if you want to know more about what Delta E is, we encourage you to check out the Wikipedia article:
https://en.wikipedia.org/wiki/Color_difference (English version is more complete)
If a Delta E number is less than 1 between two colors that are not touching, it is barely noticeable by the average human observer.
A Delta E between 3 and 6 is generally considered an acceptable number in commercial reproduction, but the difference in color can be seen by printing and graphics professionals.
The Delta E Finder module is able to compare two types of files:
.spc: A color measured with a spectrophotometer. The file contains the measured spectral values.
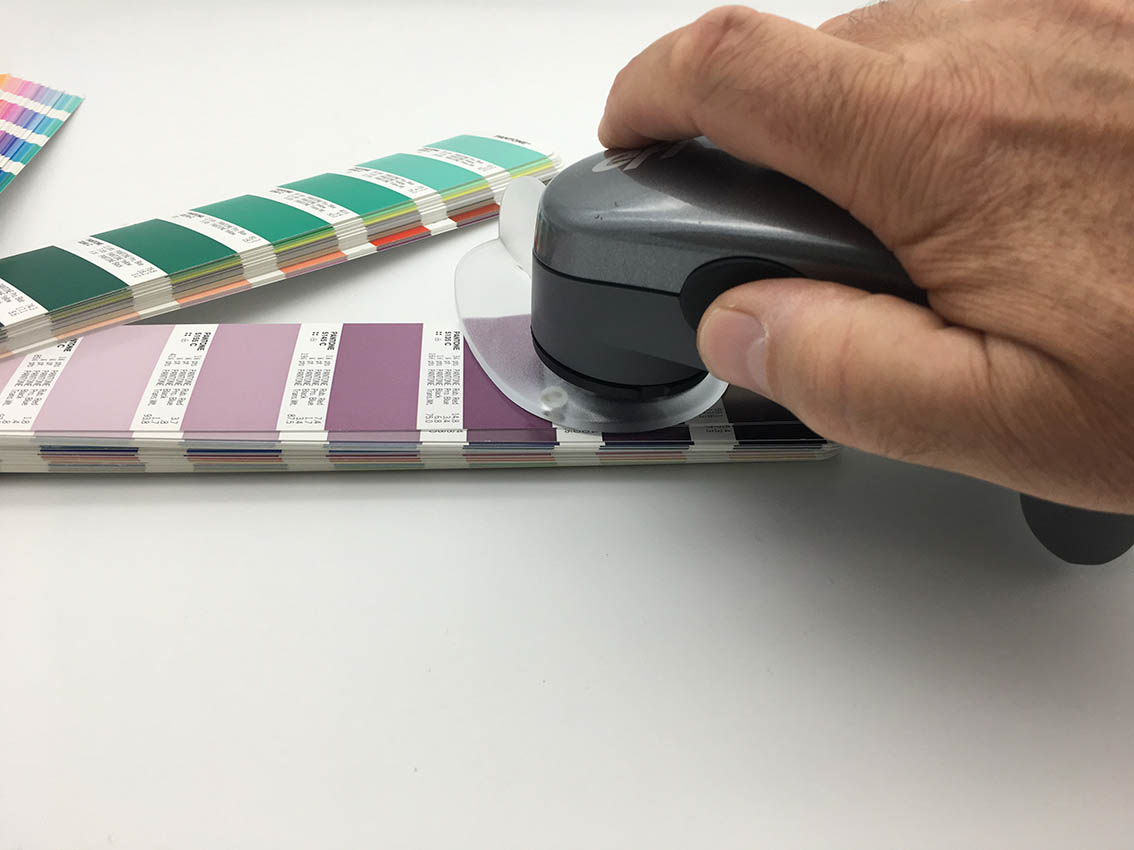
Read a PANTONE® sample with your spectrophotometer
In this example we will be using a PANTONE® color from a color table.
To use this PANTONE® color table you must have an appropriate license.
The best way to get it is to buy a Formula Guide from PANTONE®. Each purchase of Formula guide gives you access to a code to download its digital version from the PANTONE® COLOR MANAGER software.
For more information, see chapter: Capture of a Color
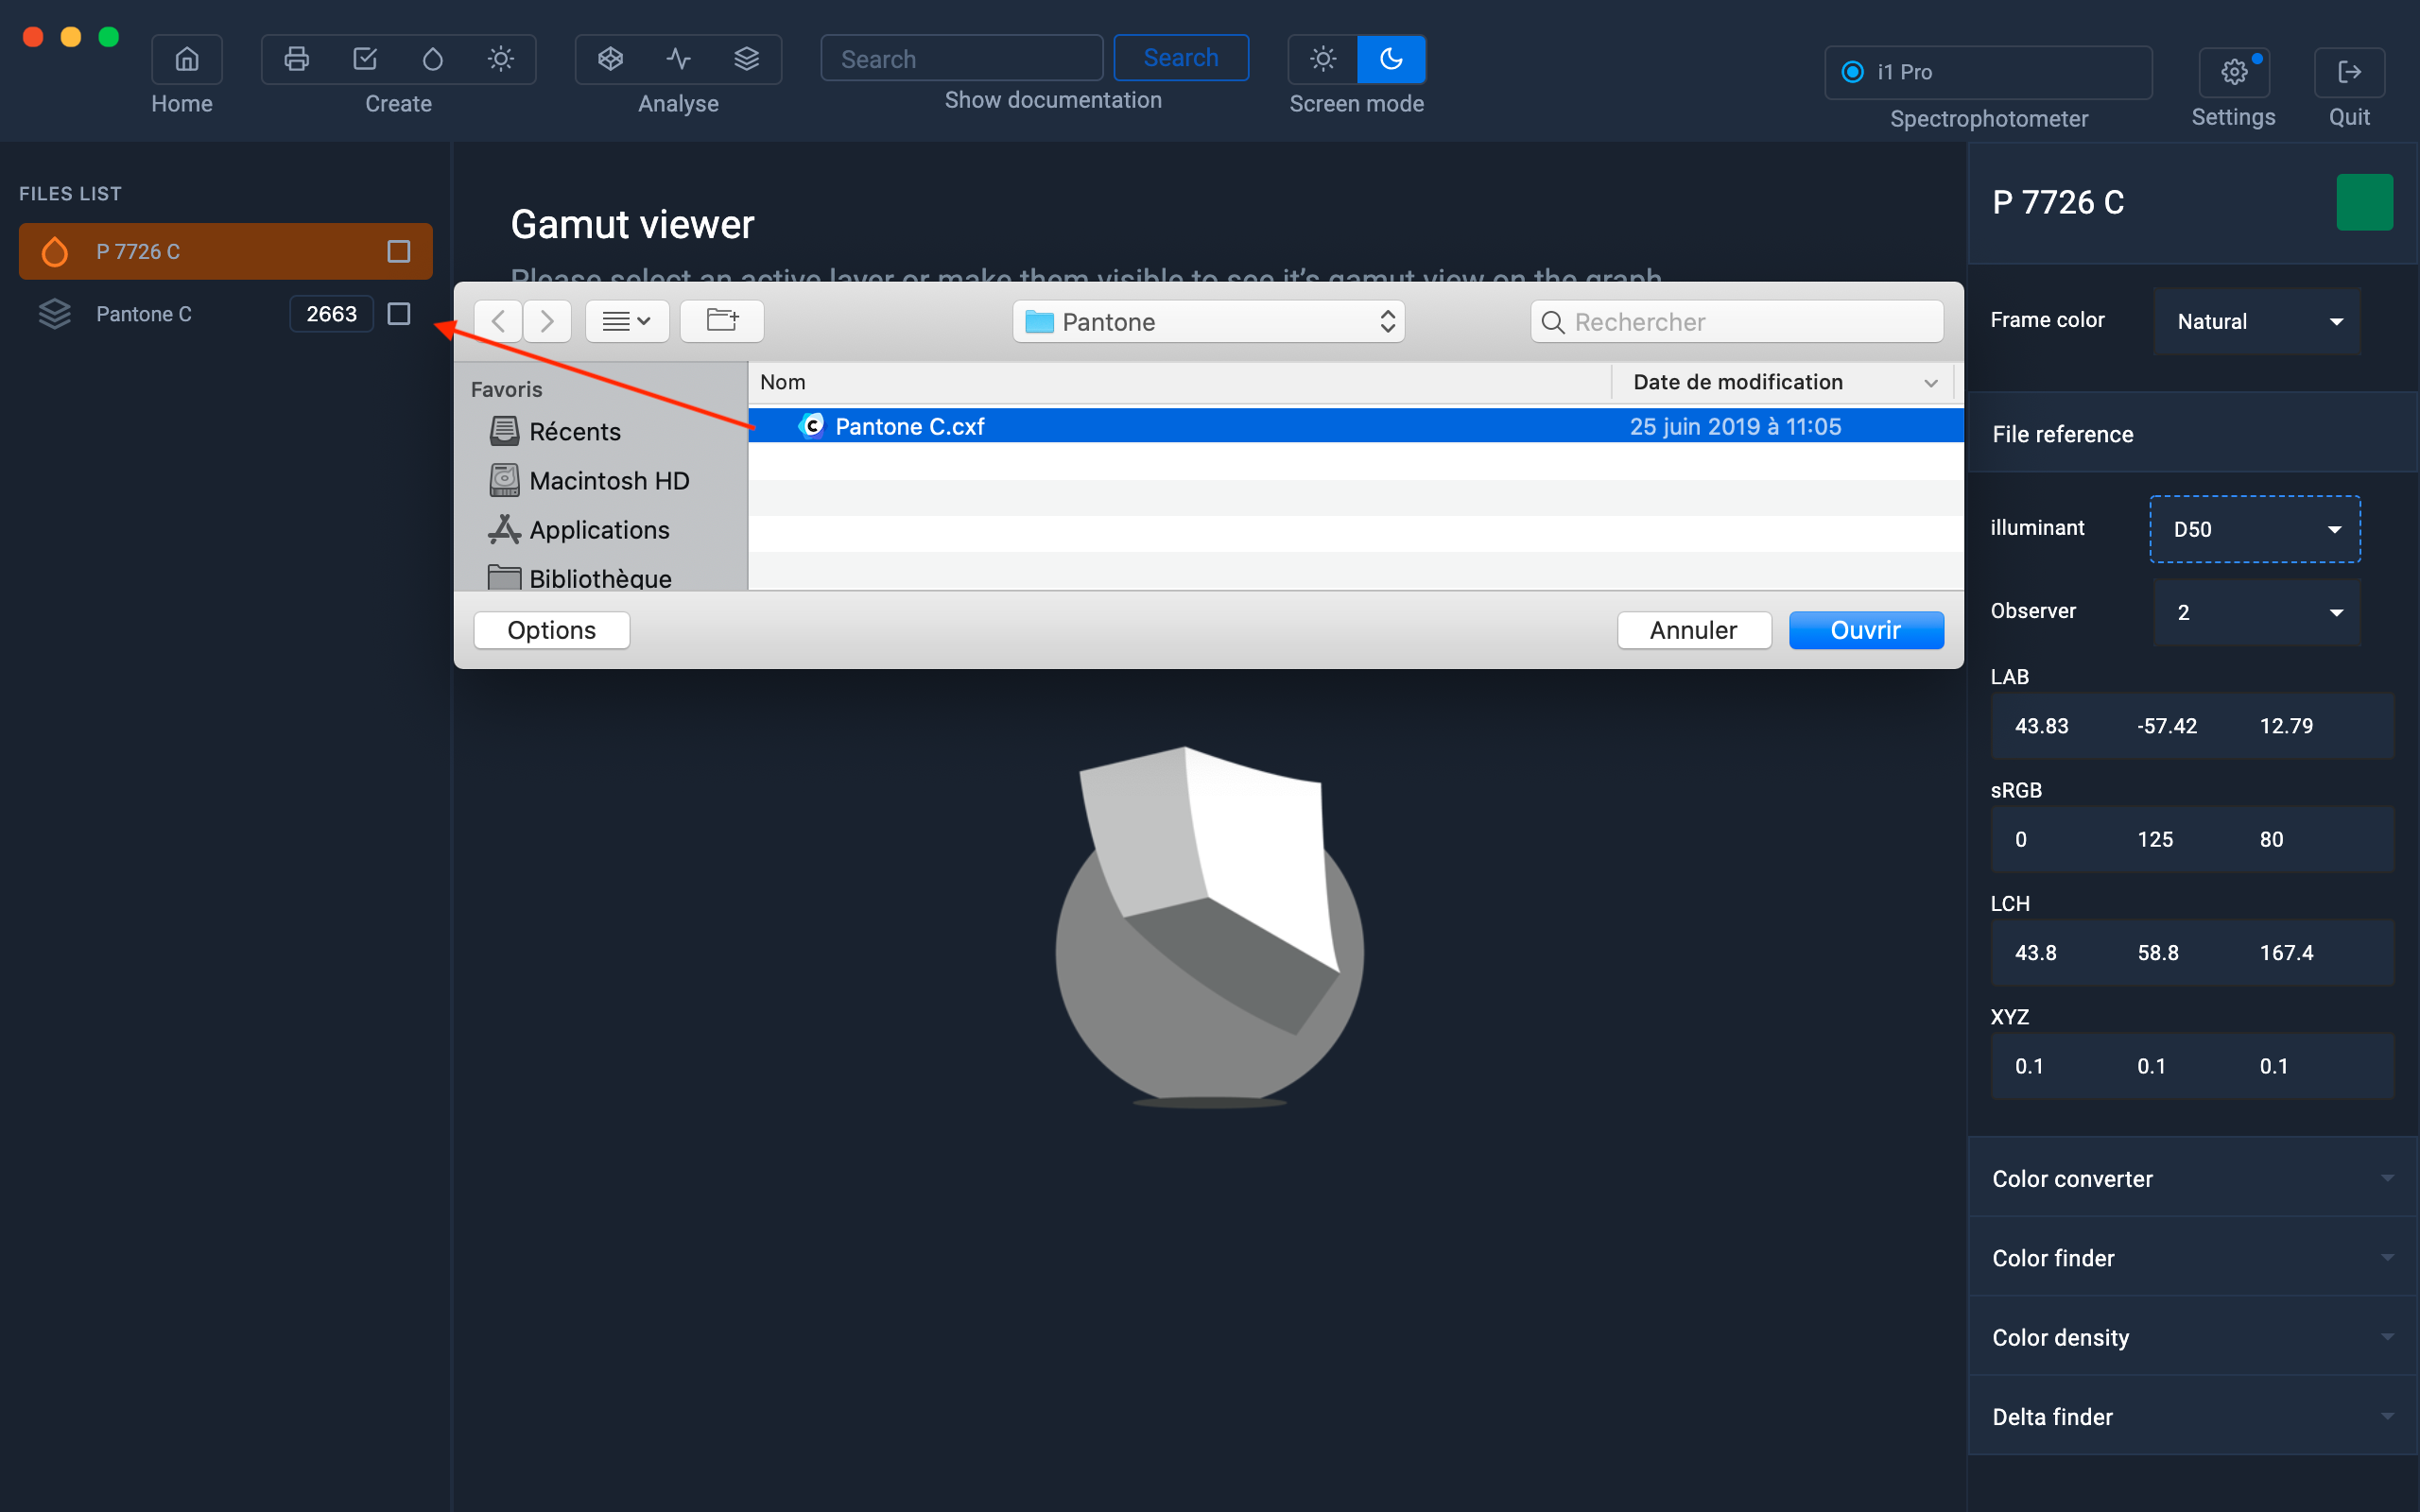
Import PANTONE C digital color chart
To import a color table, you just have to drag it into the files column on the left.
For more information, see chapter: Color table
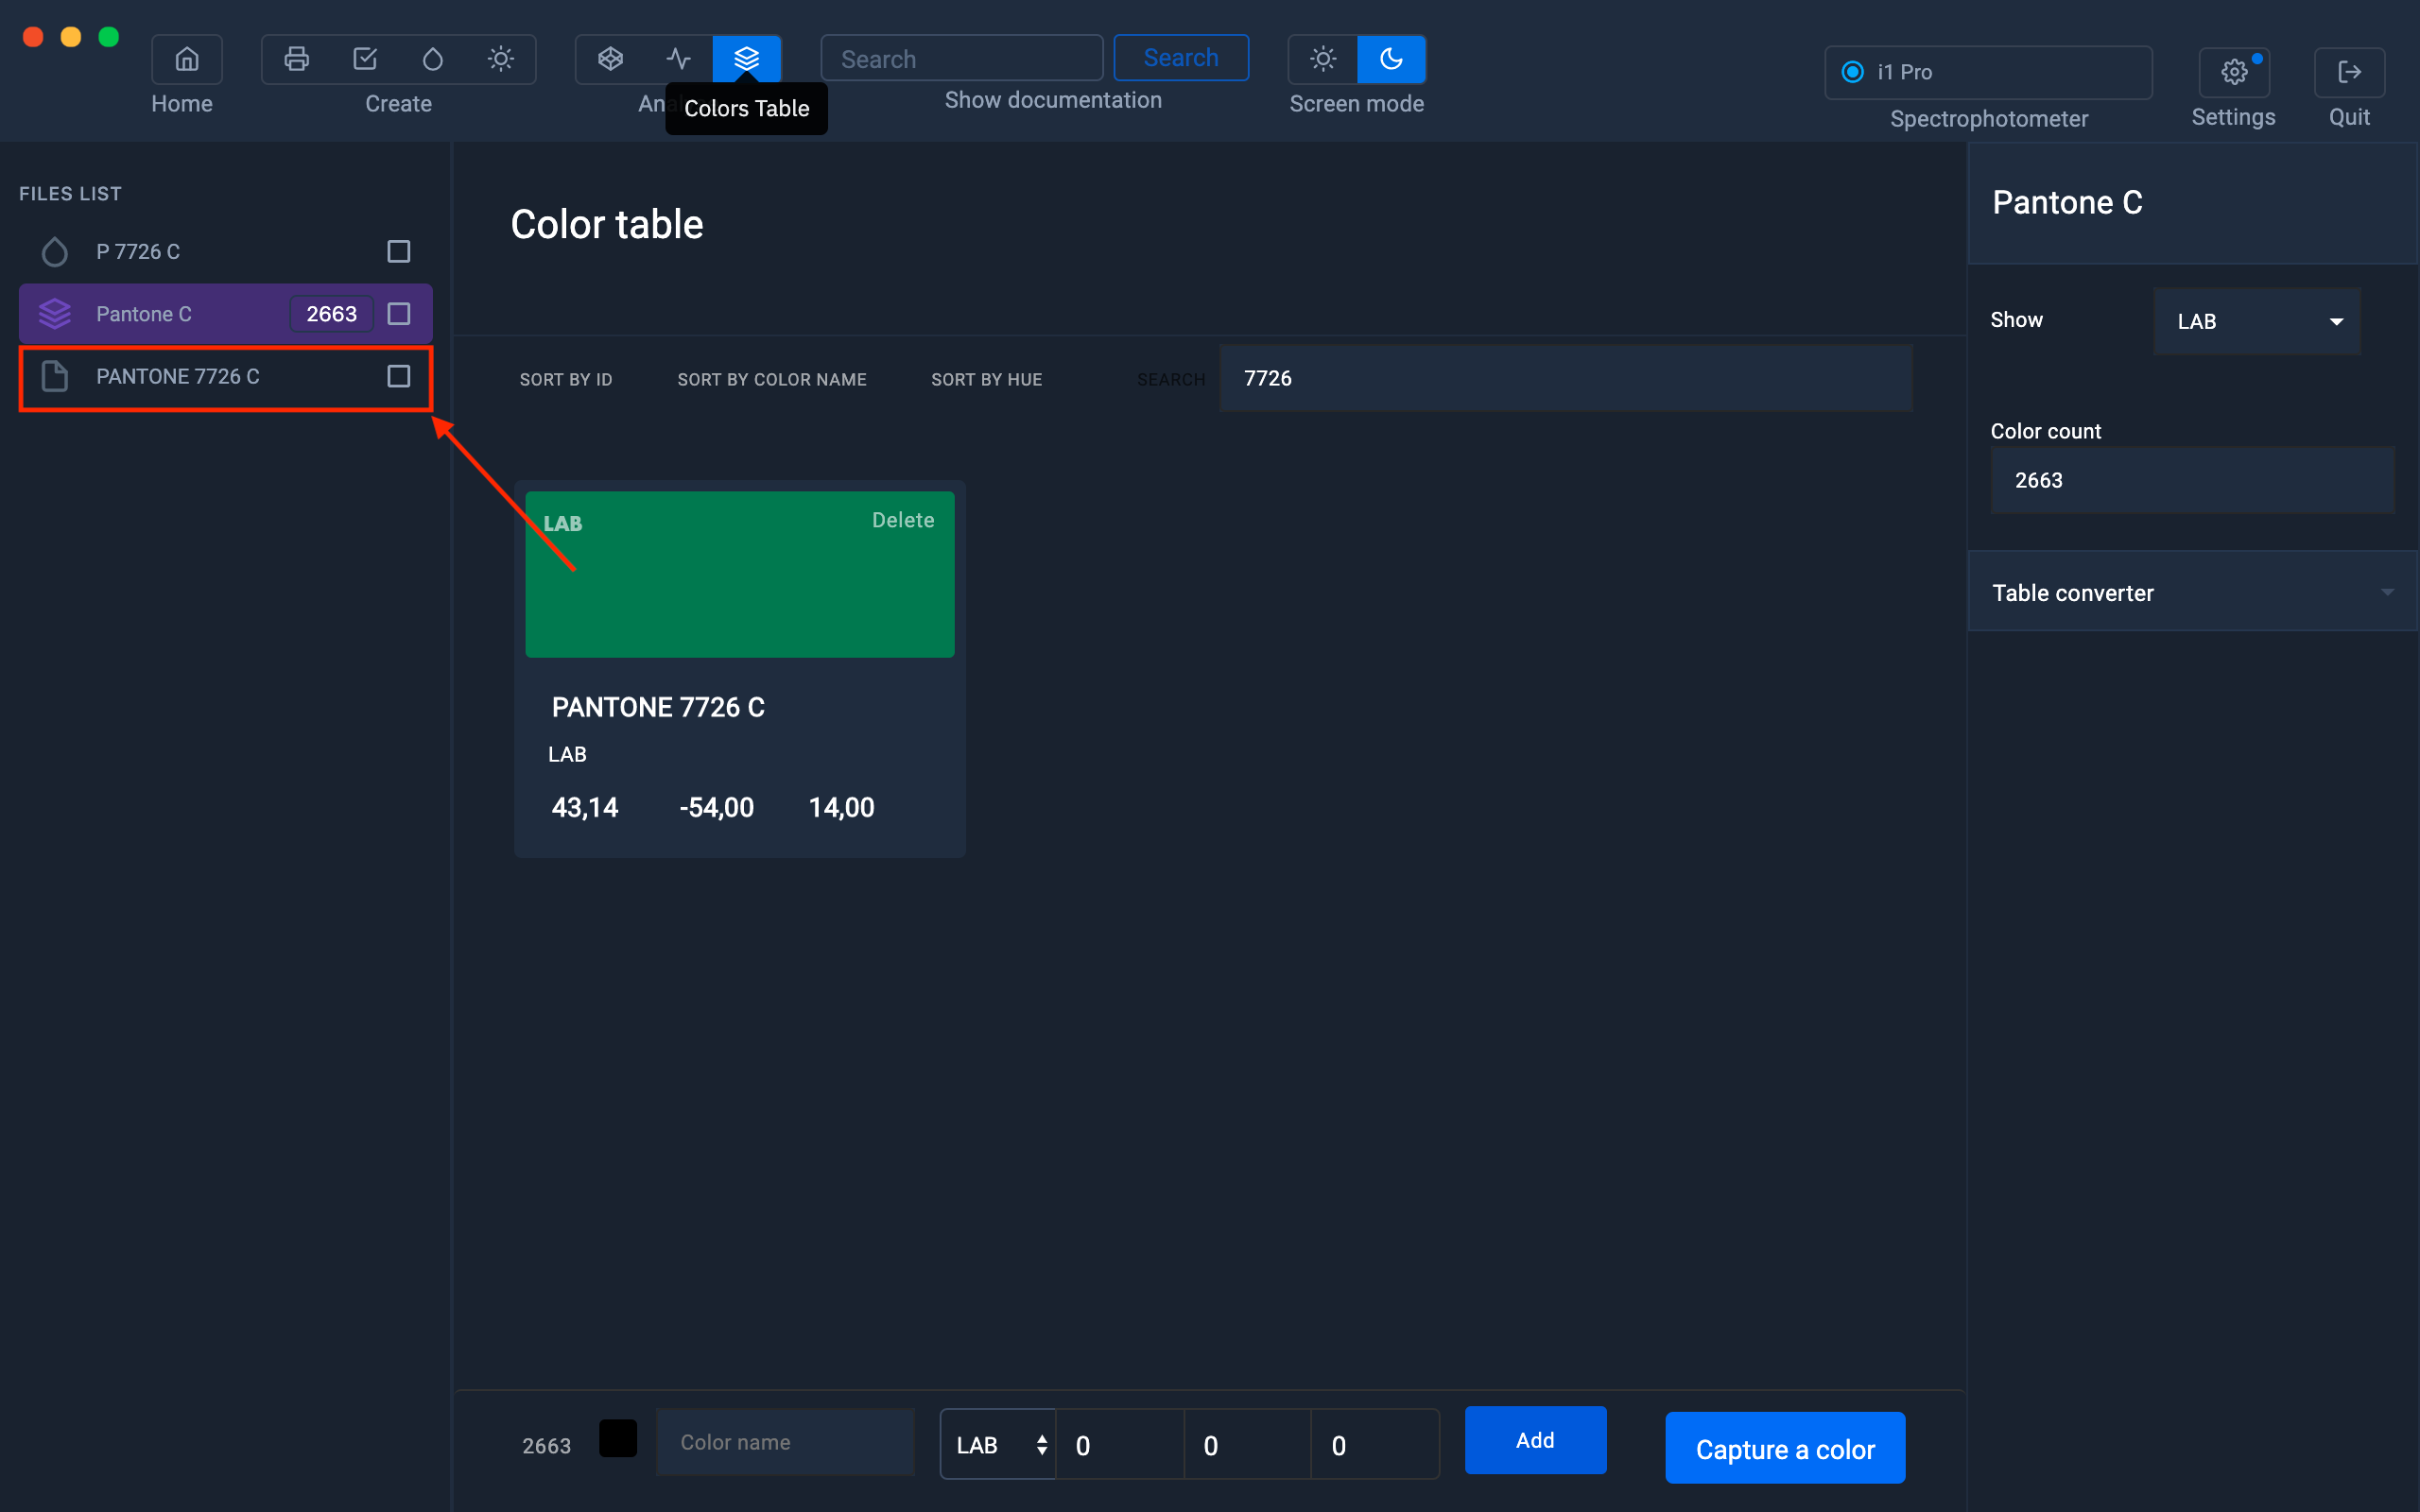
Import a selected color from a table to the files column
In your PANTONE® table, indicate in the search bar, the reference of the chosen color, then drag the color in the column of files on the left.
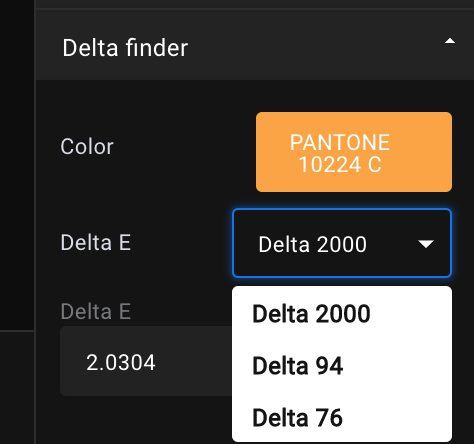
How to get the Delta E between two colors?
The last step is to select one of the two colors, open the Delta Finder module and then drag the second color into the "Color" field of " Delta Finder ".
The Delta E value will be displayed just below.
In our example the Delta E00 between the reference value of the PANTONE 7726 C and the value of the measured sample is 1.4

Choice of the Delta E calculation method
Conclusion
PANTONE® paper color charts are less accurate than their digital versions because printed versions cannot be reproduced with absolute values, let alone wear and tear from handling.
In addition, measurement with a spectrophotometer is more precise and is not disturbed by the ambient environment unlike a visual comparison (Observation under a bad light source for example).
Show density
Because a workshop spectro-densitometer is expensive, the use of the spectrophotometer, which already equips your copier or your proofing system, can, thanks to Coraye, serve as a densitometer.
Introduction
This feature, offered by Coraye, cannot replace a workshop densitometer if the spectrophotometer you have does not support M3 mode (polarizing filter).
To be able to measure a wet ink density, your densitometer must be equipped with a polarizing filter in order to obtain the same density values between wet ink and dry ink.
Regarding color values (Lab), measurement should always be performed on dry inks.
However, if you do not have a workshop spectrodensitometer, but only a workshop densitometer, Coraye will be able, thanks to this functionality, to allow you to determine the optimum density values corresponding to the Lab values of the primary colors and additional information recommended by the ISO 12647 standard.
Hereinafter, a sheet explaining the ISO 12647 standard: ISO 12647
Measure your primary colors
The first thing to do is read your solid color samples Cyan, Magenta, Yellow, and Black, for example.
Remember to read the paper value, on an unprinted area, if you want to get the relative density values.
Capture primary colors and paper
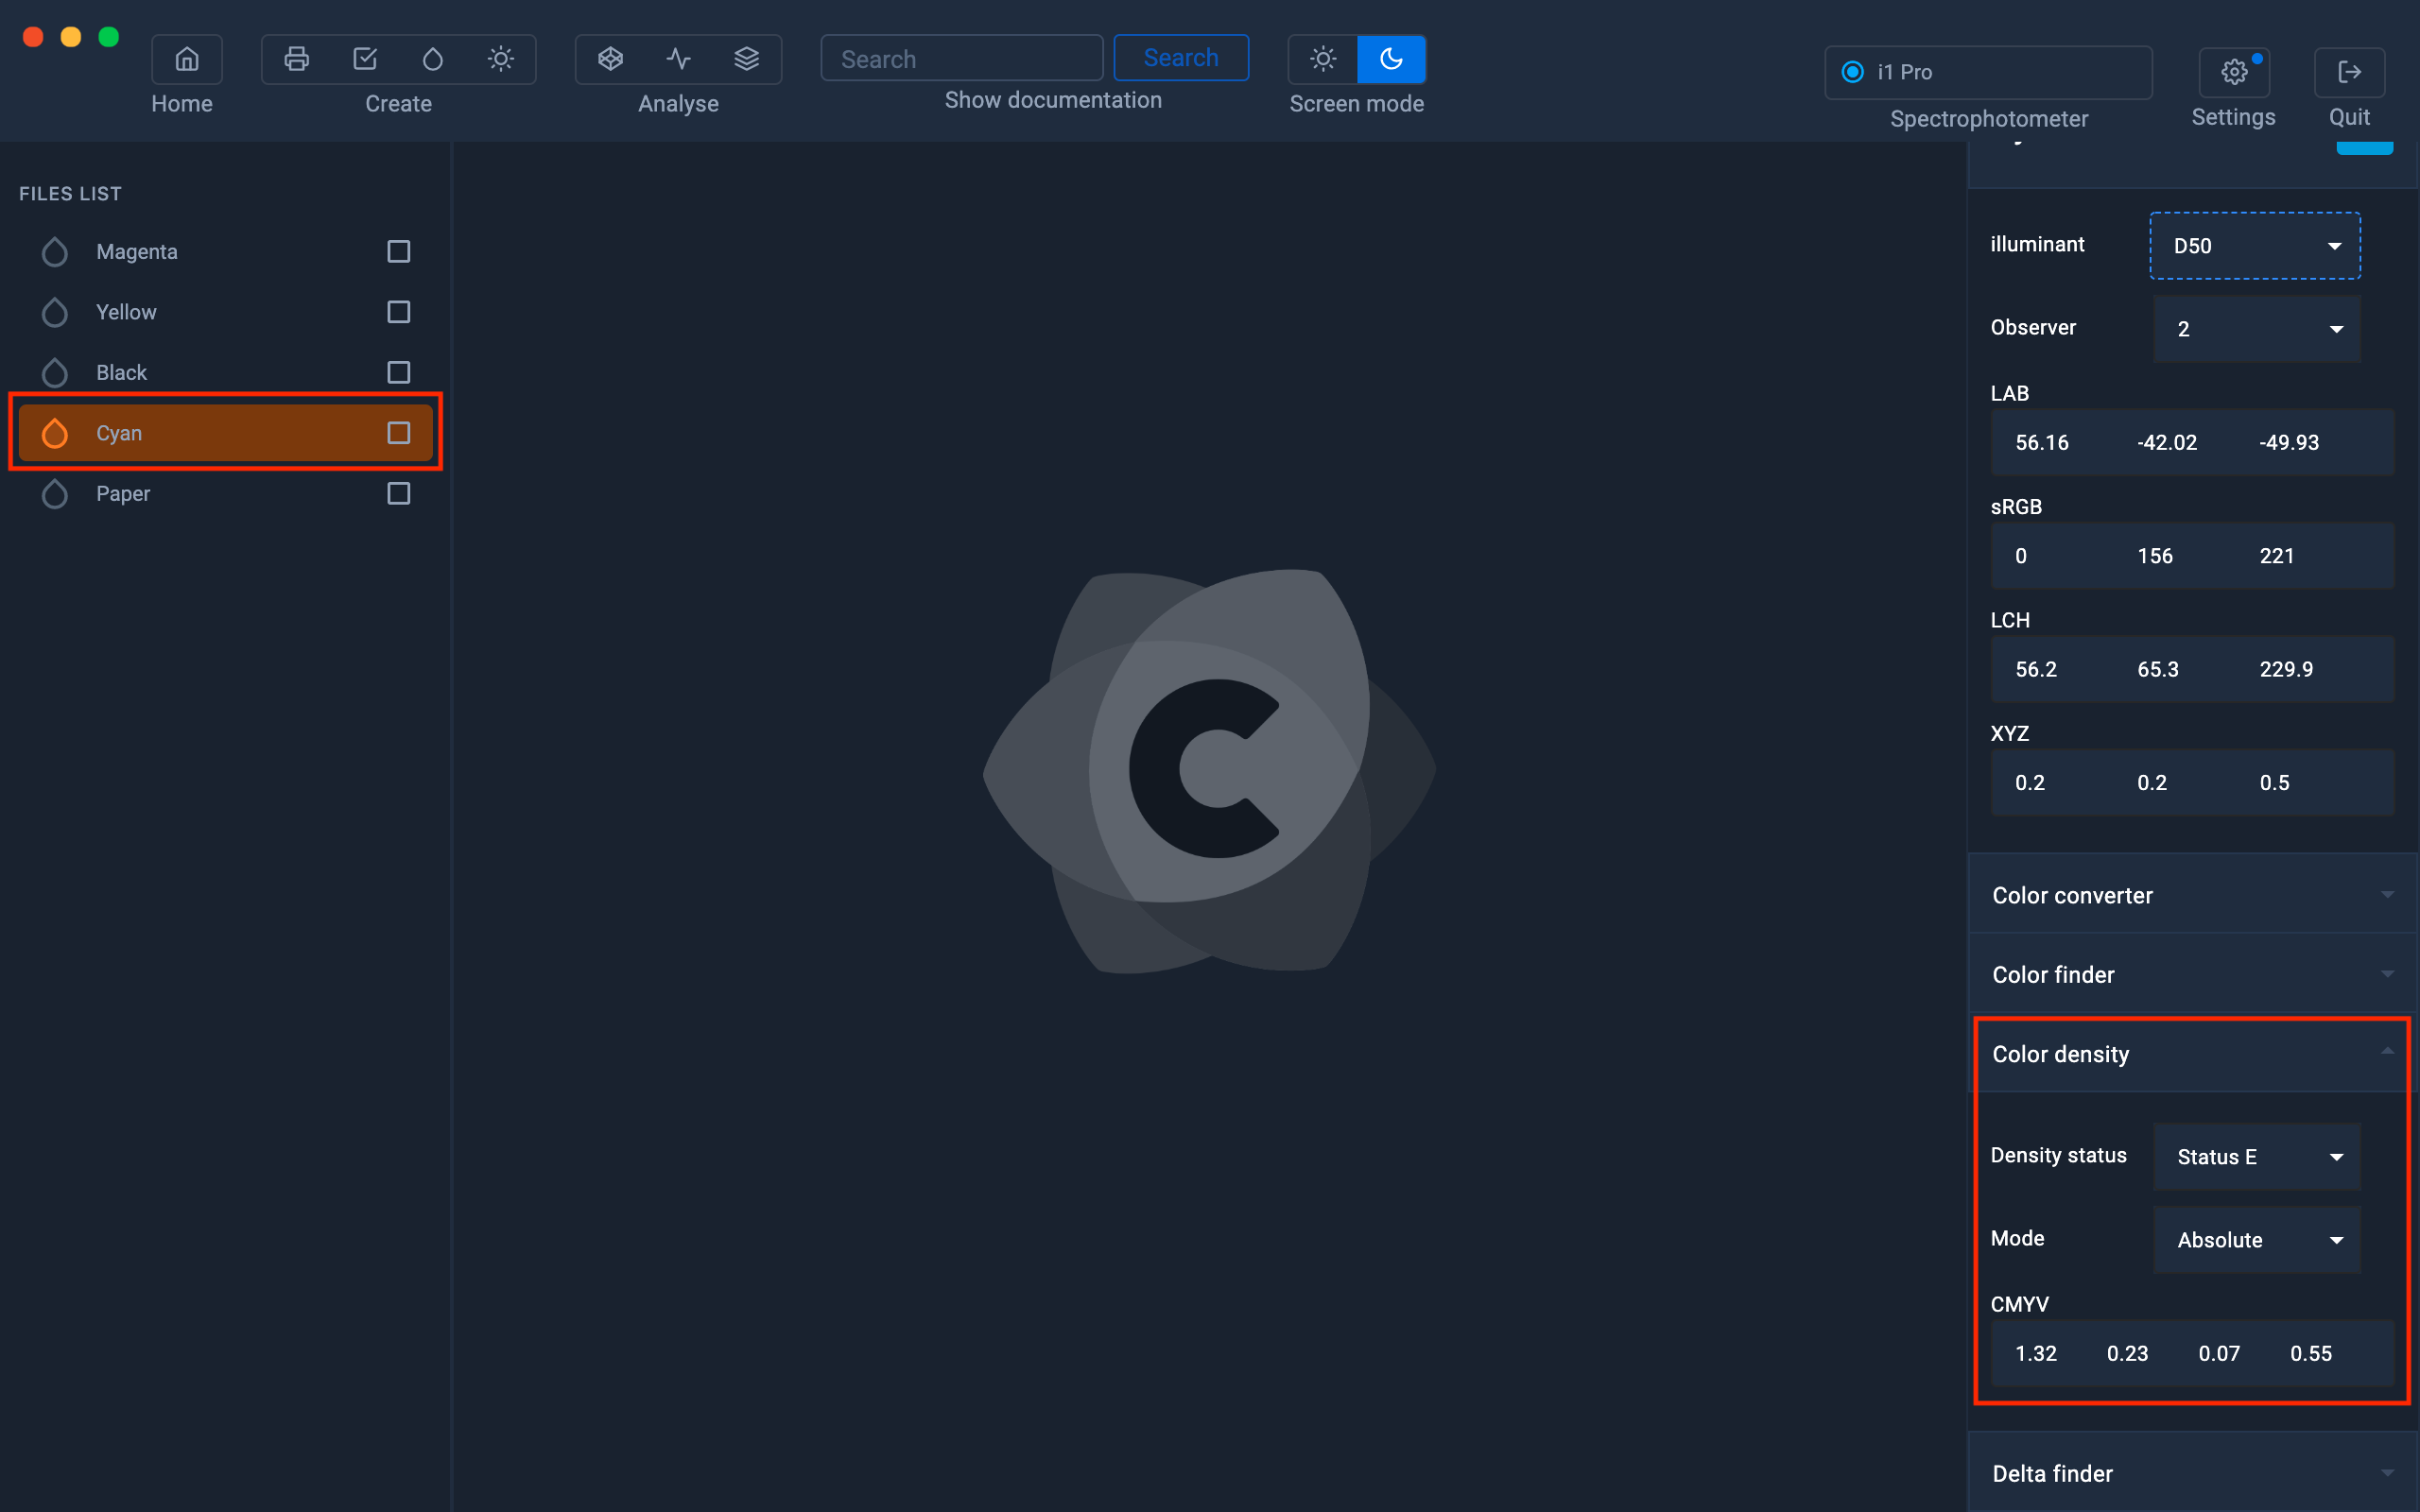
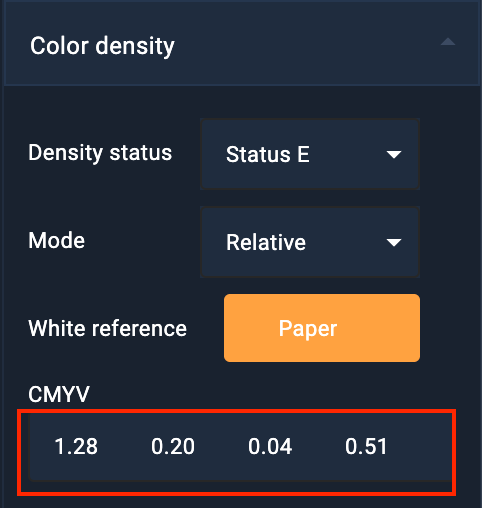
Get your density values
To see the density values, simply select your color in the left column, then move to the right column to view the values in the " Color Density ."
Why CMYV and not CMYK?
When you measure density, you use a densitometer that uses Red, Green, and Blue filters to filter out Cyan, Magenta, and Yellow density values.
But the densitometer cannot distinguish the difference between a single black and a composite black. it will then provide us with a density value relative to a "visual black".
The trends
The different modes supported by Corayes
- Status E: response of the densitometer which is the standard accepted in Europe for color reflection densitometers.
- Status T: Wideband Color Reflection Densitometer Response, which is the accepted standard in the United States for color reflection densitometers.
- Status A: ANSI PH2.18, densitometer response. This is the accepted standard for reflection densitometers intended for the measurement of photographic color prints.
- Status M: Negative color photographic print density (ie negative color, internegative, intermediate, original inversion, intermediate inversion).

Absolute density vs relative density
Select Density Status Mode
- Absolute Density: Density measured with the included paper density. - Relative density: Density measured without paper included (- Paper)
If you want to know more about this topic: Absolute density vs relative density
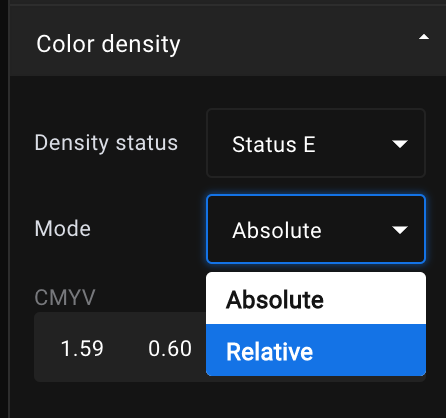
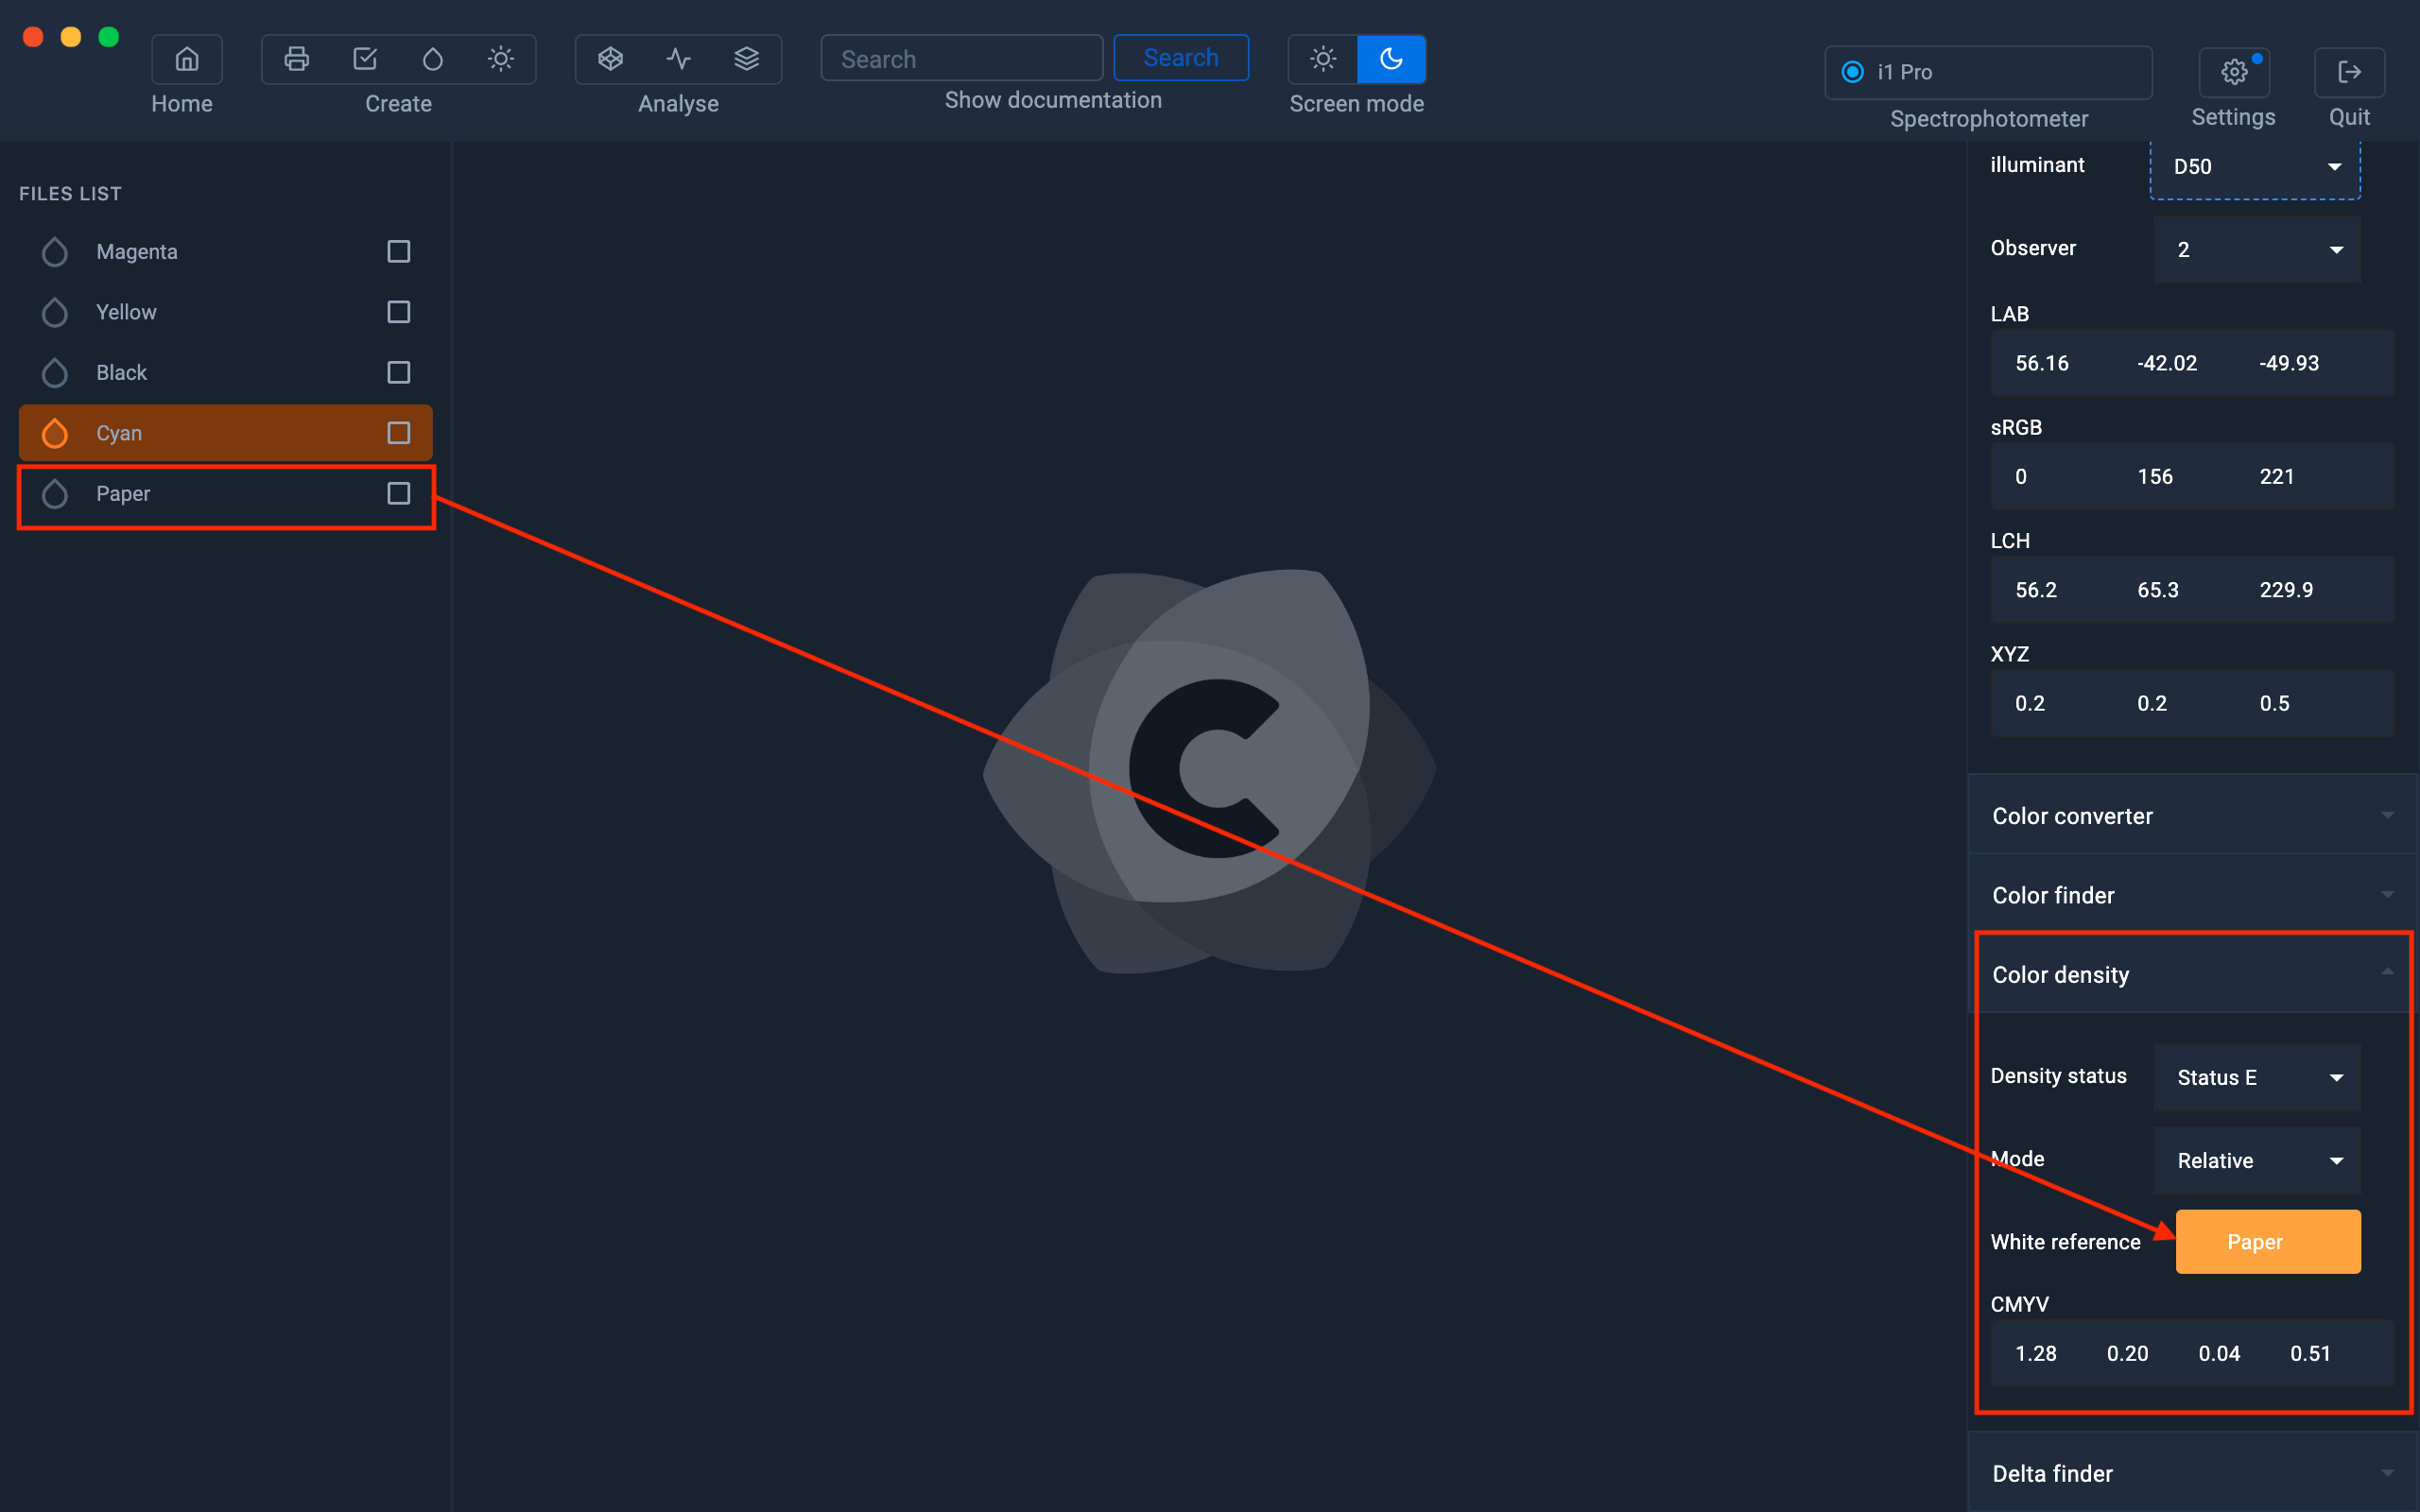
To get the relative density values, you need to select "Relative" in the "Mode" area, then drag and drop the paper reading into the "White Reference" area.
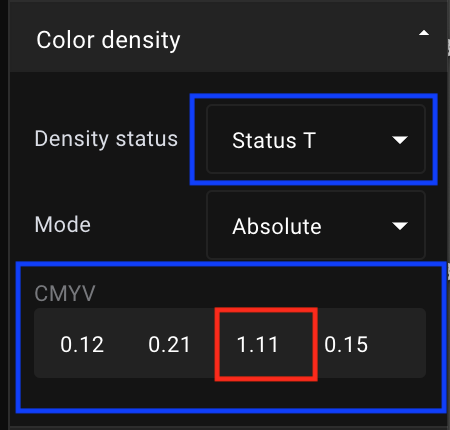
Status E vs. Status T
In the field of printing, the difference between the European standard (status E) and the American standard (status T) is the solid yellow color which is not the same.
In Europe they use "lemon" yellow ink instead of the United States which uses "egg yolk" ink.
As a result, the density measurement is not carried out on the same frequency zone.
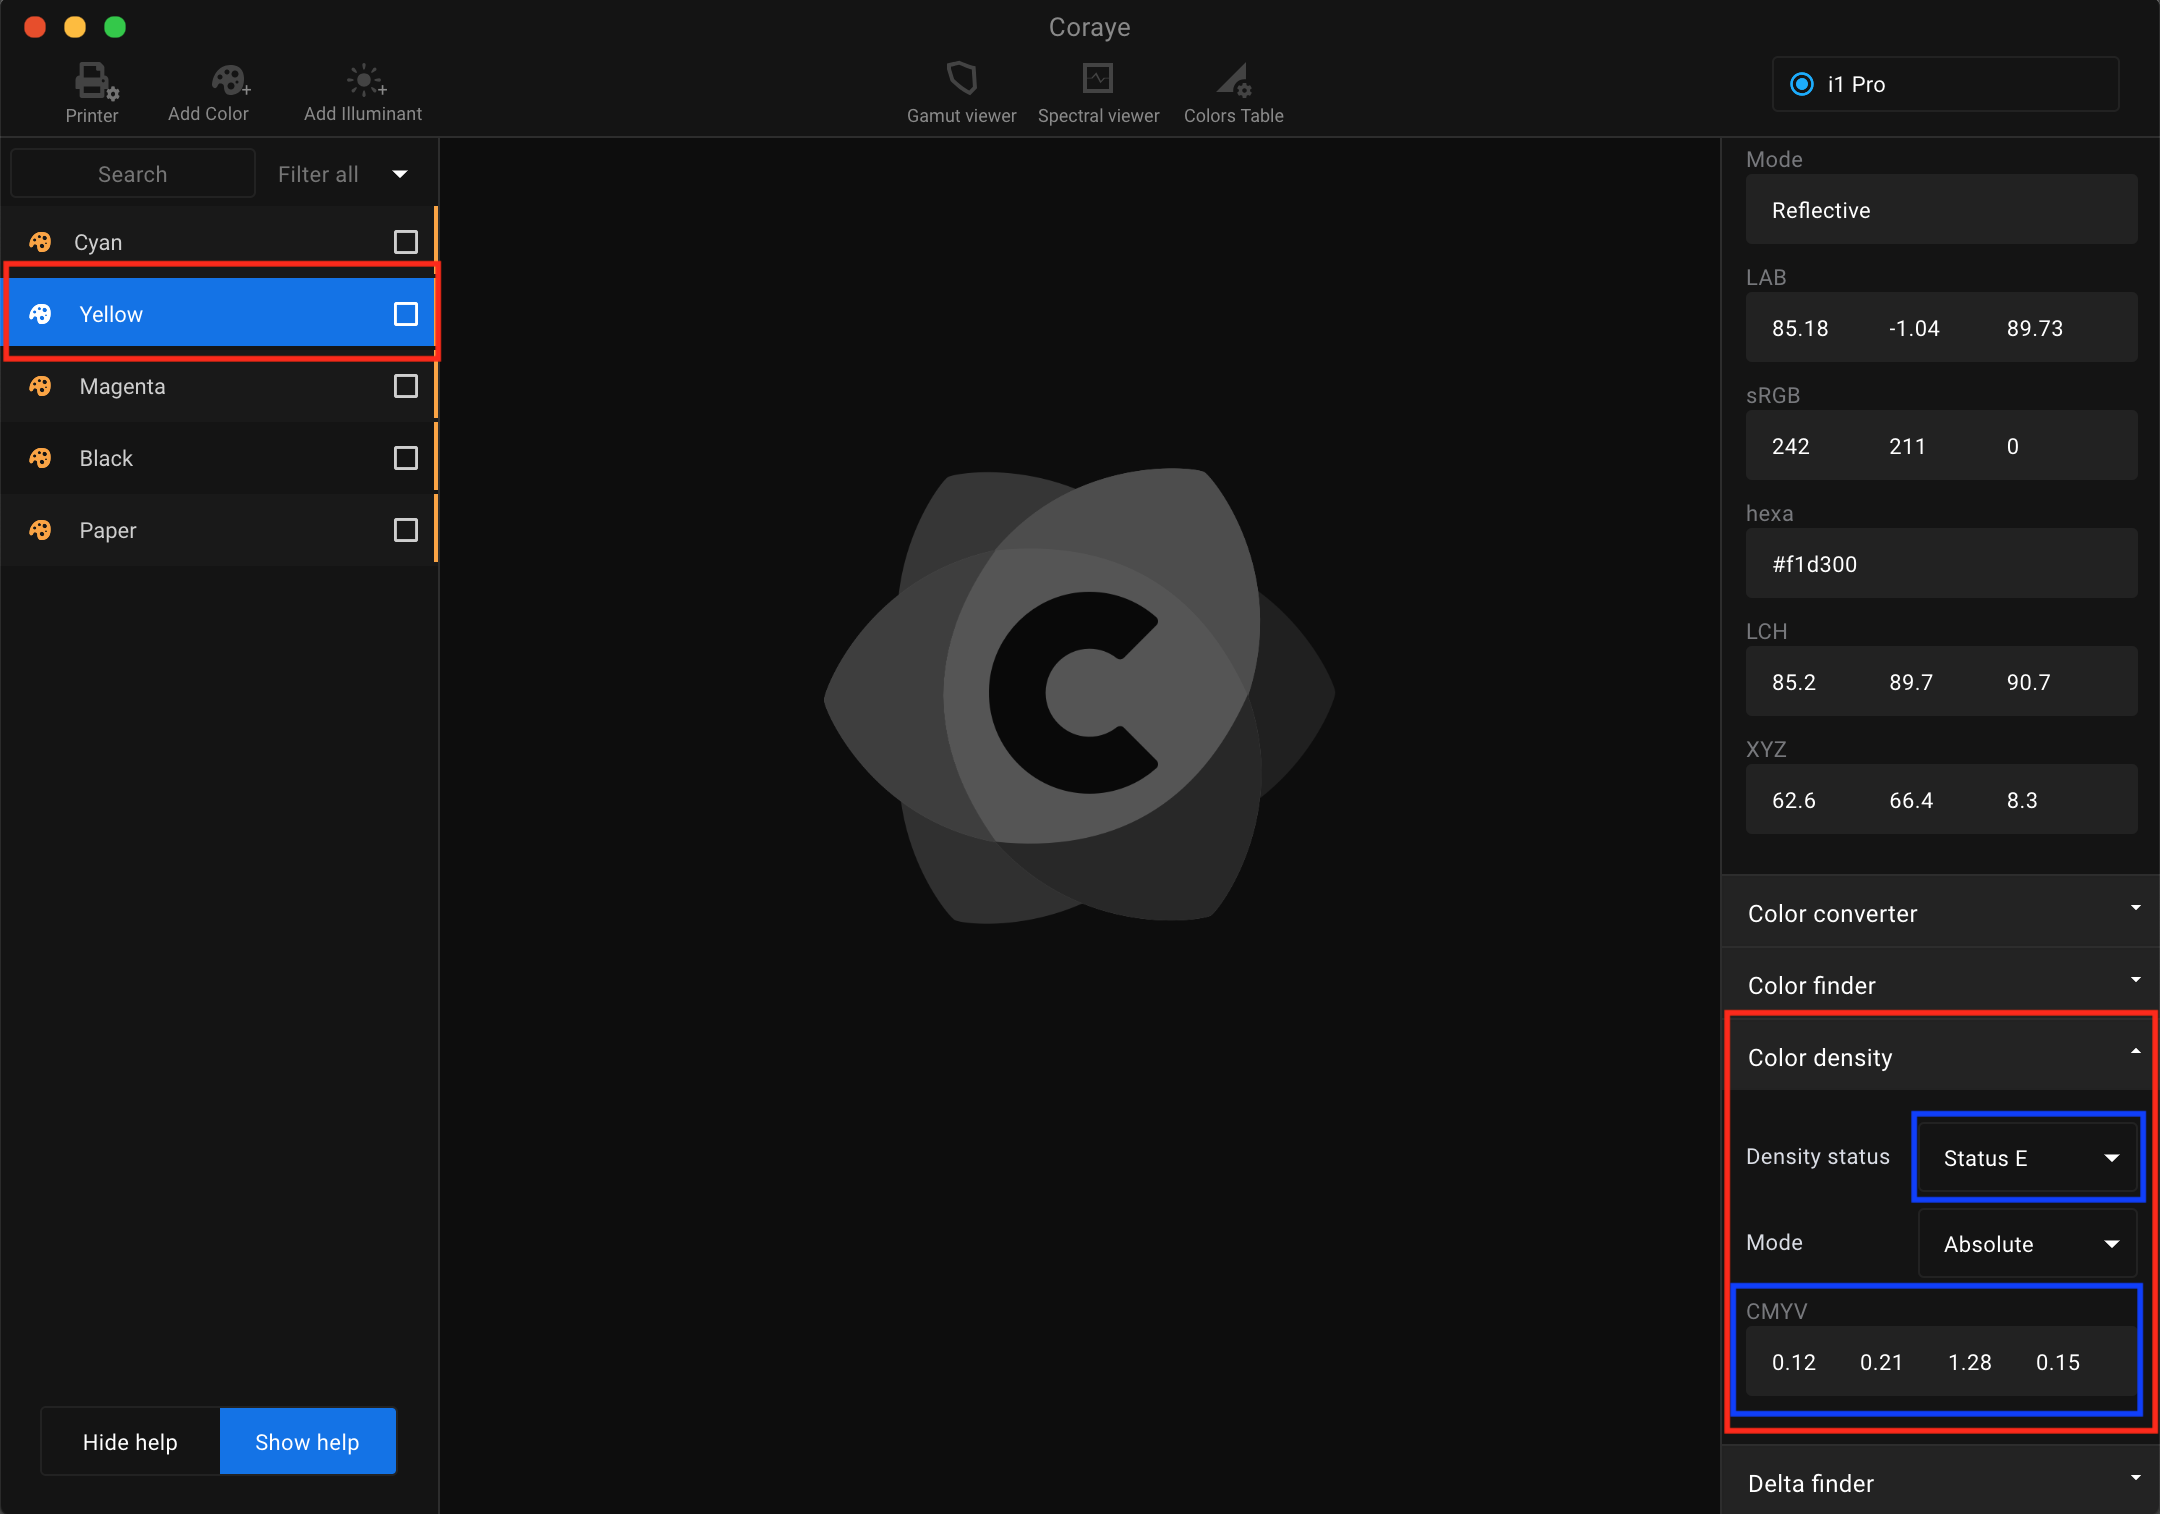
In our example, the yellow measured in Status T gives a density of 1.11 while in Status E it is 1.26
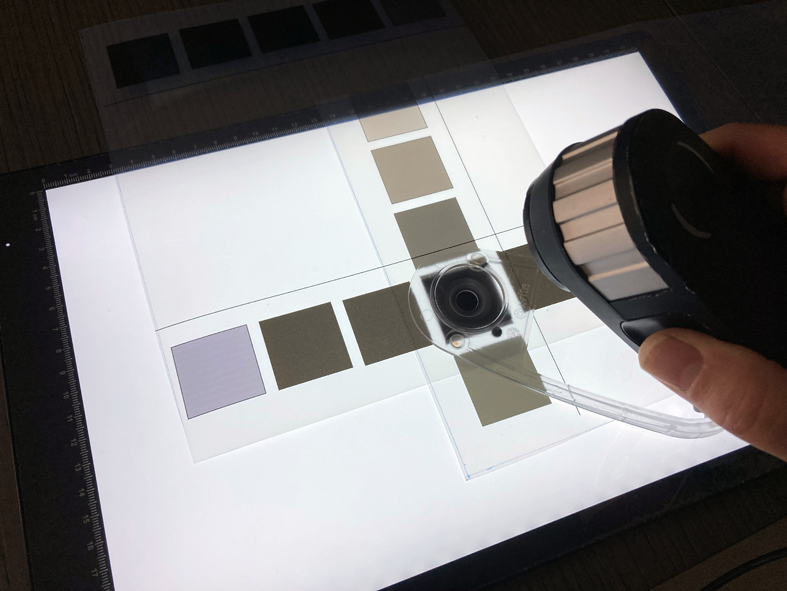
Measure your densities in Transmission mode
You are a screen printer or a photo lab and you need to measure the density of your films in transparency ?
For this you will need:
- Color Capture module by Coraye
- An XRite I1 Pro 1, 2, 3 or 3 PLUS spectrophotometer
- A flat light table
To start, connect the XRite I1 Pro spectrophotometer, click on the "Add Color" icon
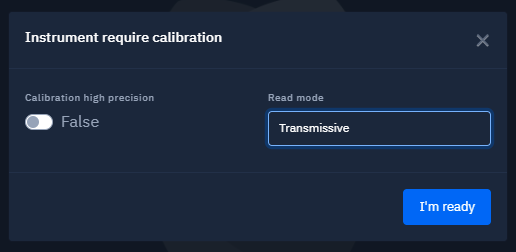
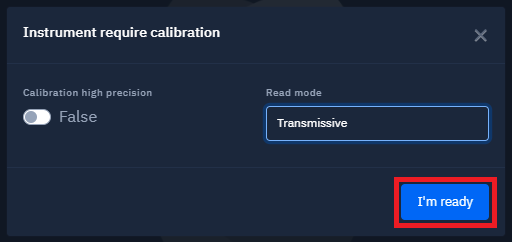
Select the "Transmissive" reading mode
Then click on the "I'm ready" button
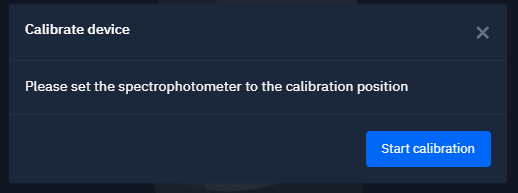
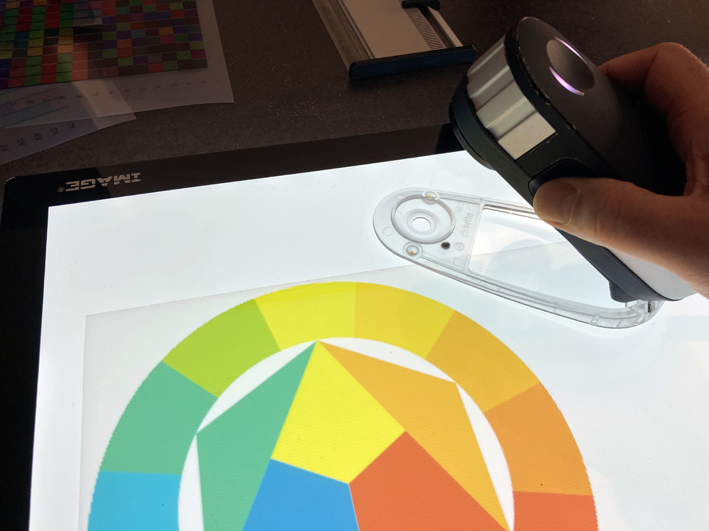
Position the spectrophotometer on its calibration base
Then click on the "Start calibration" button
Once your spectrophotometer calibration is complete, turn on and measure the light tablet.
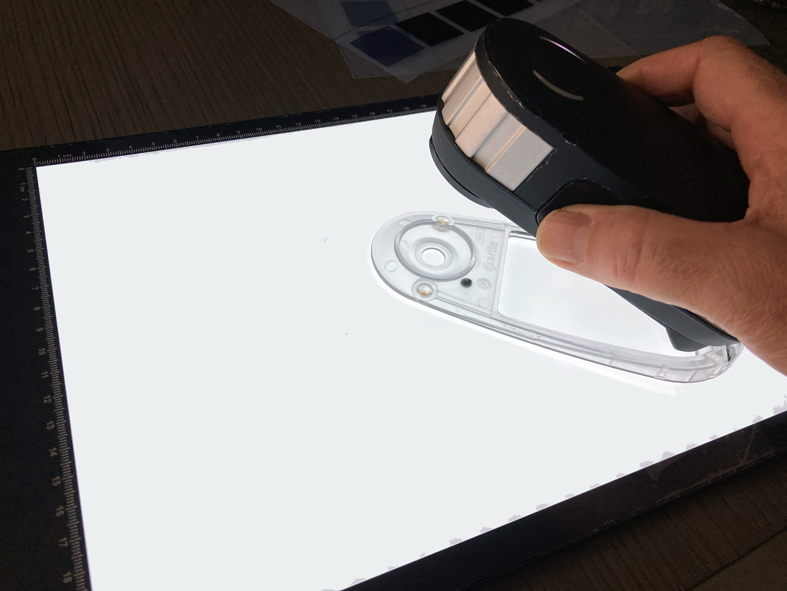
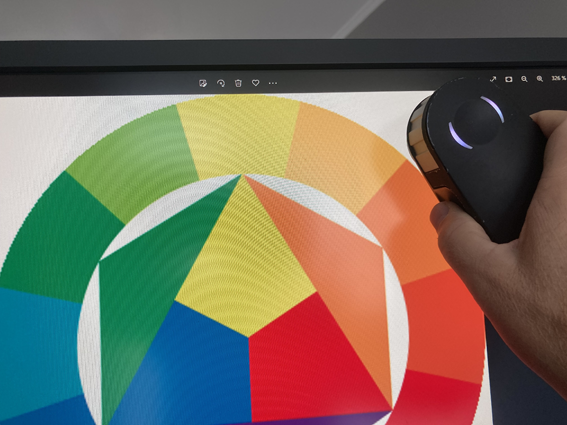
Measure your films on the light table
After renaming your measurements, you can click on the "Save and quit" button to save them.
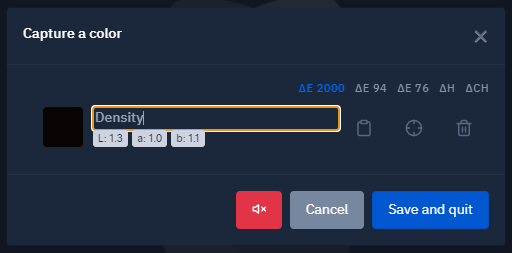
Select the measured sample, then pull down the "Color density" menu to view the density values.
If you want to know the black density value, only the fourth value corresponding to the V (visual) will be taken into consideration.
In our example we have a black density value (V) equal to 2.82

Color measurement on a backlit screen or media
Function soon available in version 1.30.0 of Coraye
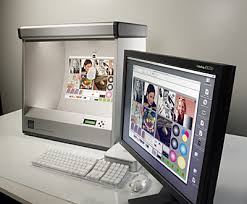
The theoretical color and the color displayed on a screen (especially when it is not calibrated) often hold unpleasant surprises.
How can we then calmly communicate the color displayed on our screen?
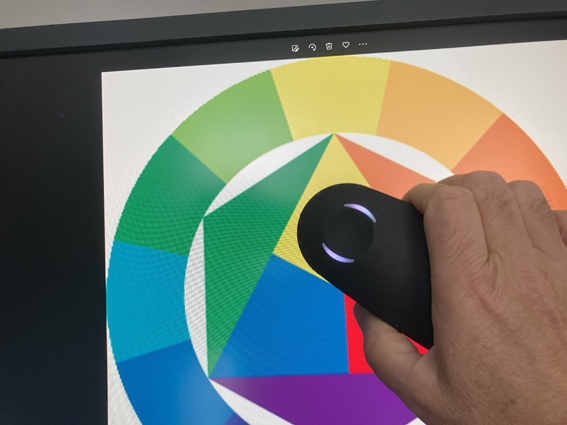
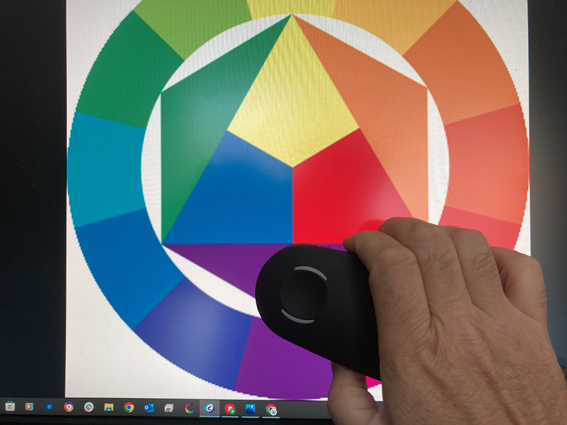
The solution proposed by Coraye consists in directly measuring the colors on the screen with a spectrophotometer in transmission mode.
The measurements can then be exported, converted, analyzed, like a measurement taken on paper or another type of material.
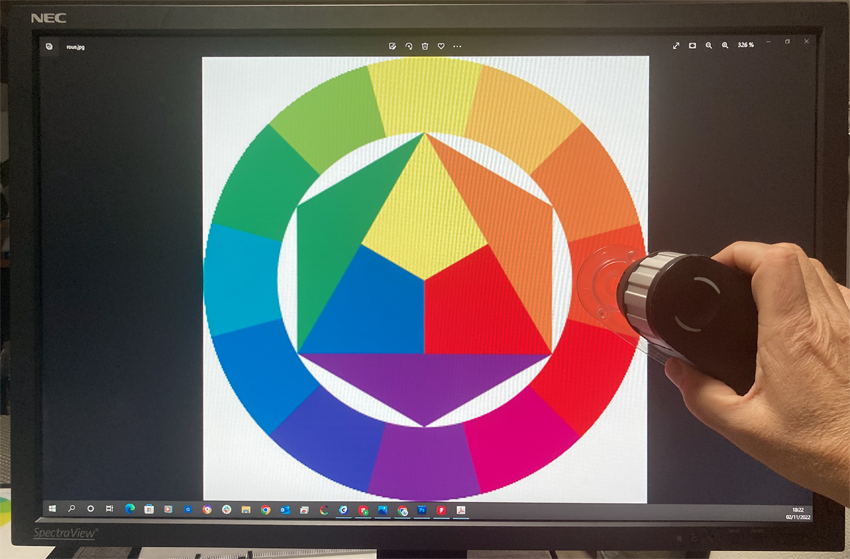
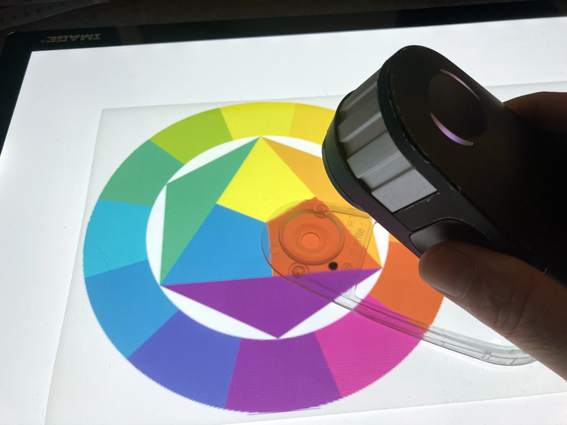
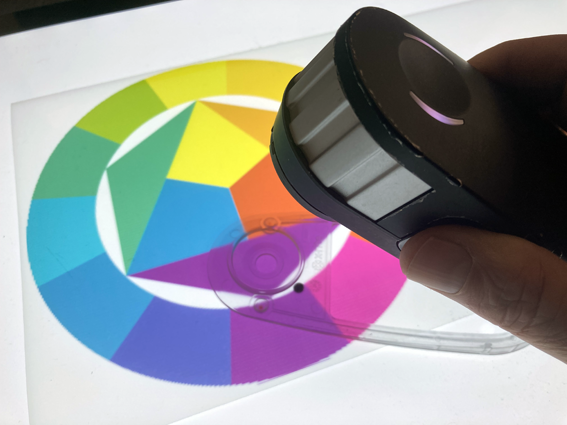
How to capture the colors on your screen ?
To illustrate this tutorial, we will display a color wheel on a secondary screen.
Prerequisites:
- Color Capture module
- A spectrophotometer (see list below)
Start by connecting your spectrophotometer.
Spectrophotometers supported by Coraye's "Color Capture" module:- XRite I1 Pro 3 & I1 Pro 3 PLUS
- XRite I1 Pro 2
- XRite I1 Pro & I1 Pro UV
- EFI ES1000
- EFI ES2000
- EFI ES3000
In the Coraye software, click on the “Add Color” icon located in the menu at the top left of the software.
A window is displayed allowing you to define the playback conditions.
These settings are dependent on the playback instrument you are going to use.
Use Reflective mode to measure on paper or material
Use Emissive mode to capture the spectral curve of a color on your screen or on backlit media
Use Transmissive mode to measure a color on your screen or on backlit media.
Since in "Transmissive" mode the spectrophotometer does not emit illuminant to perform the measurement, the measurement conditions disappear.
Click on the "I'm ready" button
If your spectrophotometer needs to be calibrated, Coraye will ask you to start the calibration procedure.
During calibration, you must position your spectrophotometer in its calibration position.
| XRite I1 Pro 3 ES3000 |
|
| XRite I1 Pro 2 ES2000 |
|
| XRite I1 Pro ES1000 |
|
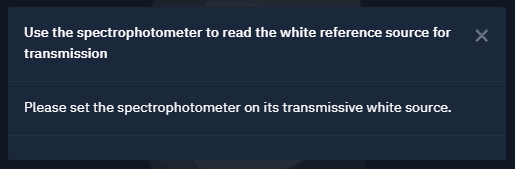
Reference white measurement
In "Transmissive" mode it is necessary to measure the reference white (RGB values: R=G=B = 255 or CMYK: C=M=Y=K= 0)
This step is important because the color measured is dependent on the intensity and the type of illuminant used for the backlighting of your screen (or light table).

In our example, we have white at the four corners of our image.
We will therefore choose an area large enough to measure our white frame of reference.
White should be measured on the screen your colors will be displayed on and under the same viewing conditions
Ditto if the measurement is carried out on a light table.
 Reference white measurement
When you arrive on this window, you can measure the colors on your screen.
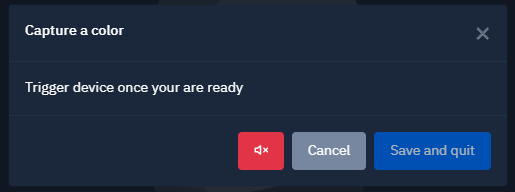
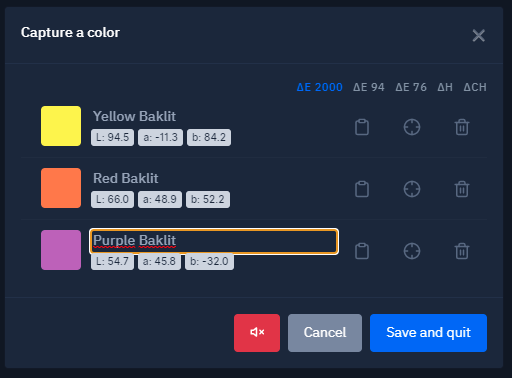
Let's measure three colors: Yellow, red and purple
 |
 |
 |
The successive measurements will be displayed one under the other.
The Lab values for each of the colors appear as they occur to help you make corrections between the actual colors of the objects (or materials) and the retouching of the images displayed on a graphic display.

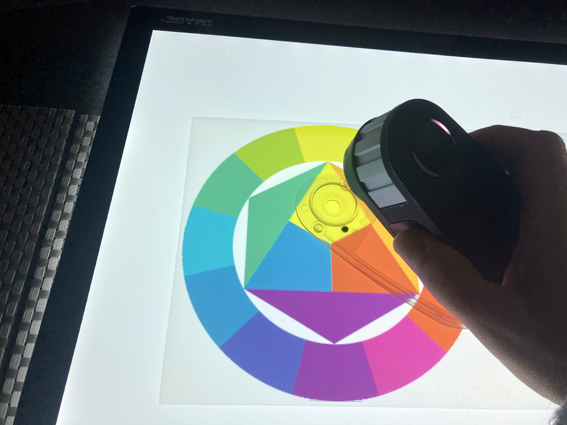
How to capture colors on transparent backlit media (Backlit for example)
Prerequisites:
- Color Capture module
- A compatible spectrophotometer
- A light table
The method for capturing colors on backlit transparent media is exactly the same as for measuring colors on a screen.
The only difference will be when choosing the white reference:
- If you want to measure the colors taking into account the media (absolute mode), you will have to measure the white on the table directly.
- If you want to measure colors ignoring the media (relative mode), you will need to measure the white on the media.
 Relative measurement |
 Absolute measurement Absolute measurement |
Let's measure three colors: Yellow, red and purple
 |
 |
 |
The measured colors will be displayed as the reading progresses:
The exploitation of the measurements is identical to that of the measurements carried out in "Reflective" mode (on paper or a material)
We invite you to continue by clicking on the following link: