Calibration and Characterization
Do you need to calibrate your printer or characterize your press? Then you've come to the right place with the right software.
- Introduction to calibration and characterization
- Create a profile from a standard test pattern
- Create a profile from a calibration
- Print an RGB test pattern
- Create an icc profile from an average of measured charts
- Customization of charters
- Importing a measurement file made with the XRite I1 Profiler software
- Export of a measurement file made with Coraye to the XRite I1 Profiler software
- Barbieri Gateway & Chart Generator
- Characterization of a backlit in transparent mode with the I1 Pro 3 + XRite
Introduction to calibration and characterization
To establish the ICC profile of a printer, you must first choose the paper and ink for the printer and manage the quantity of ink on the support ( Calibration ).
And in a second step to print in CMYK or RGB with the printer a test chart (for example an IT8.7 / 3 chart) and to measure with a spectrophotometer the colors in L * a * b * of the test chart to generate a profile ICC ( Characterization ).
The printer's ICC profile, calculated with appropriate software, therefore makes the link between CMYK or RGB and L * a * b * spaces.
The purpose of the ICC profile is to optimize the chroma of your prints.
For a large format printer or press profile, the method is the same.
For professional results, the use of a spectrophotometer is still necessary.
For more information, see the website: Wikipedia.org - ICC Profile
Create a profile from a standard test pattern
This tutorial explains how to create a printing profile starting from a standard test chart without a calibration step.
To faithfully reproduce colors on your printer, you will need a paper profile that matches your printing conditions. (Printer, inks, paper, resolution and illuminant)
By default, you can use the profiles and settings provided by the paper manufacturer.
But sometimes this is not enough, maybe you will need more precise chroma to meet your requirements.
In addition, paper manufacturers do not always provide all icc profiles for all printers.
Create your personalized profile
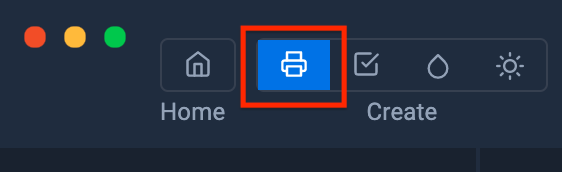
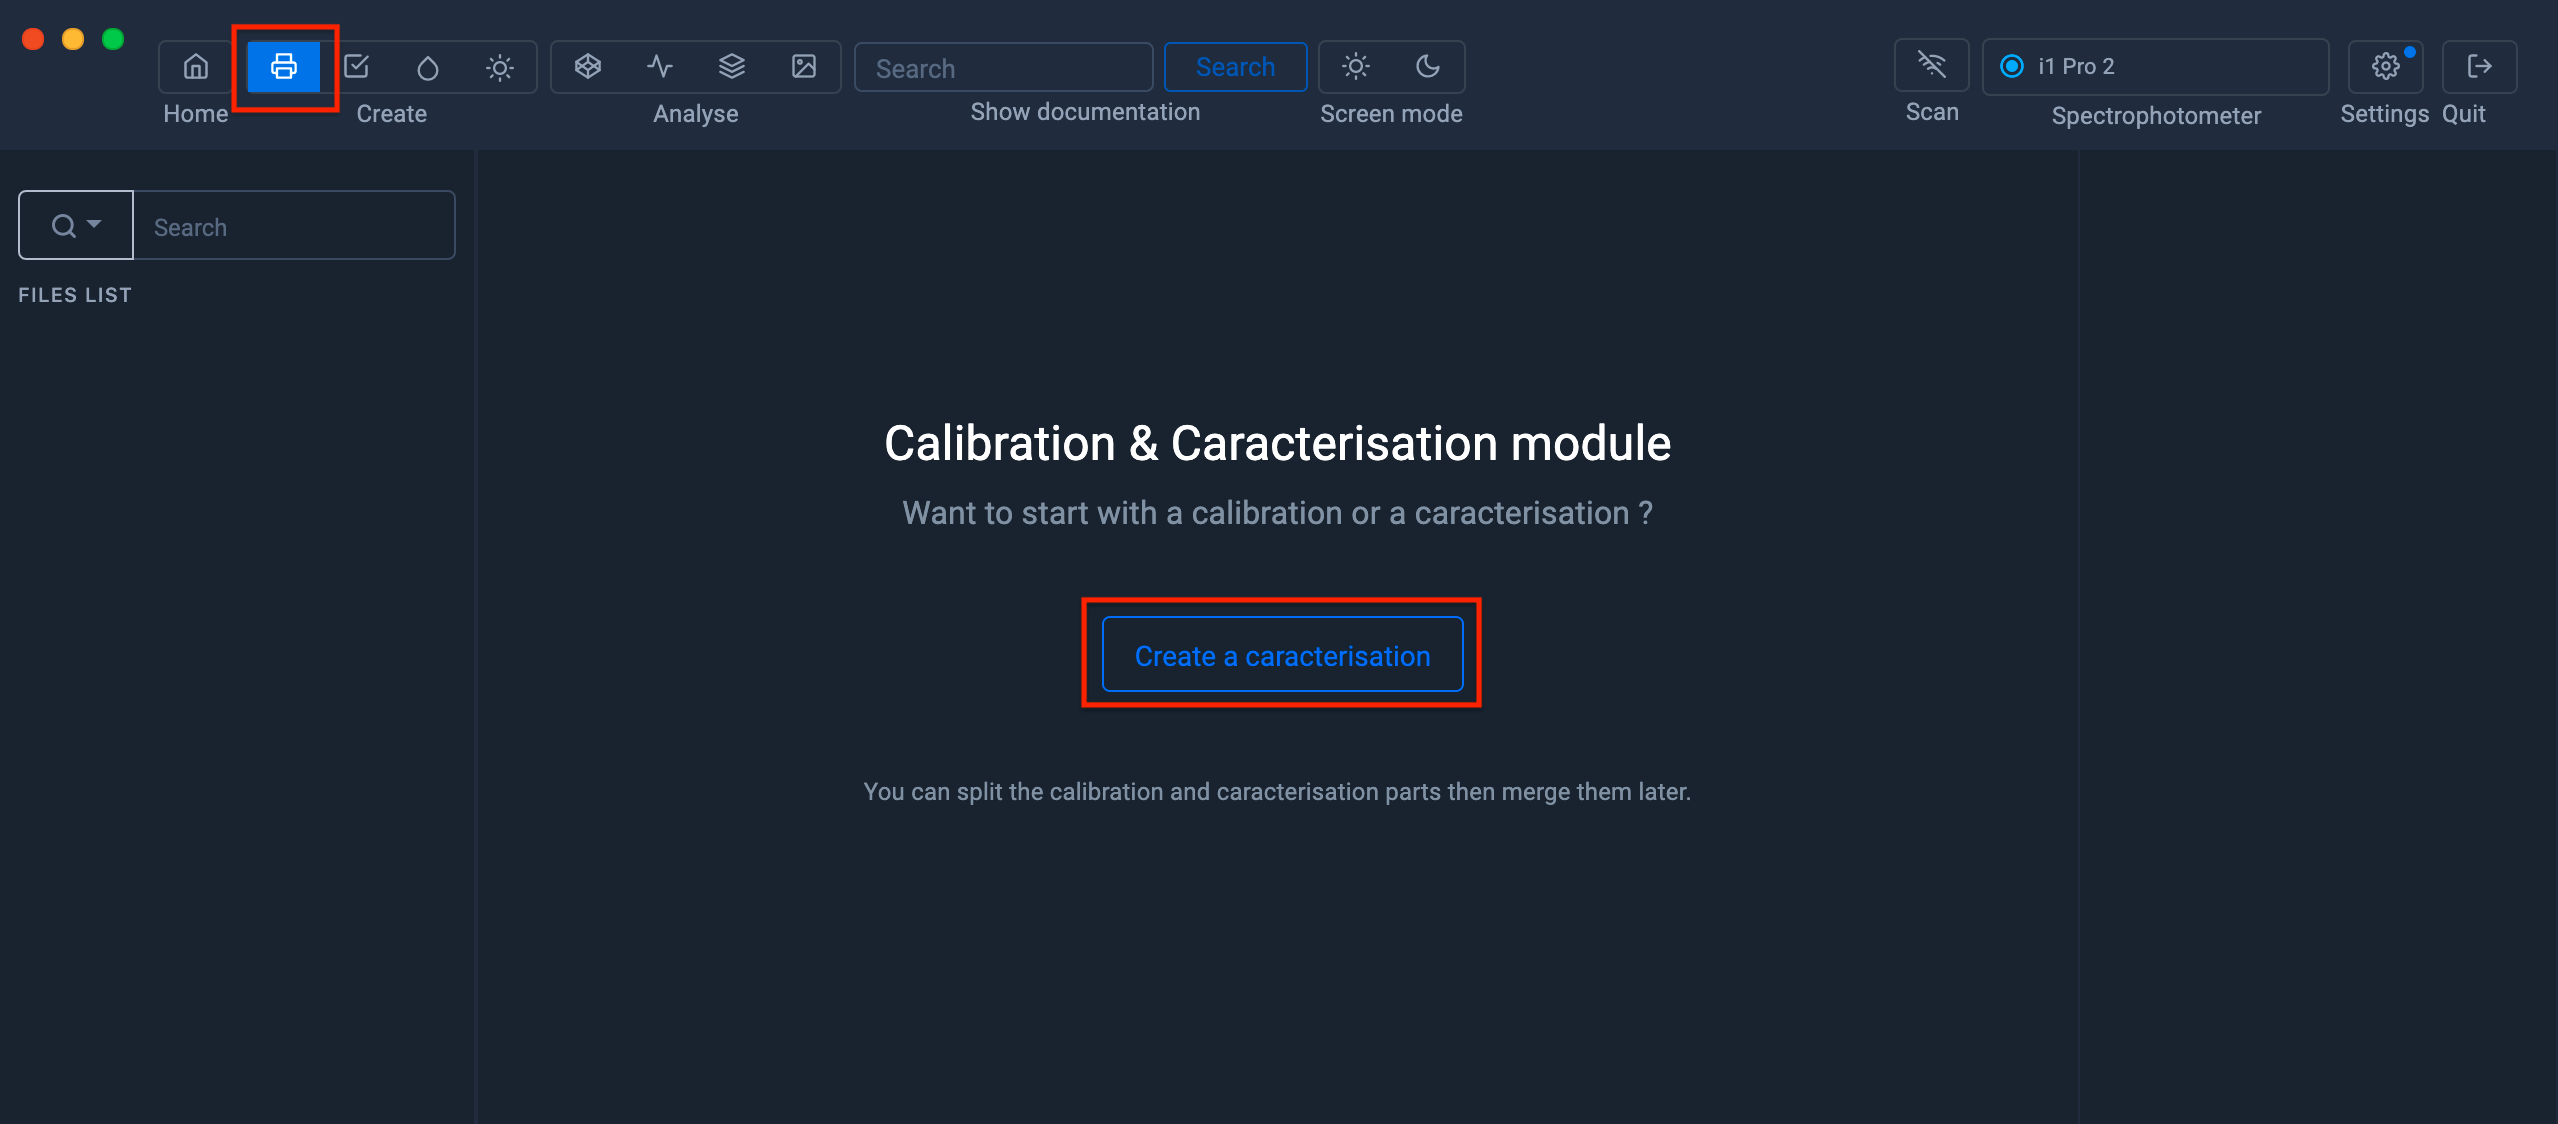
Let's start by launching the profile creation module by clicking on the "Create Profile" logo in the upper left corner.
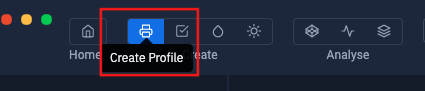
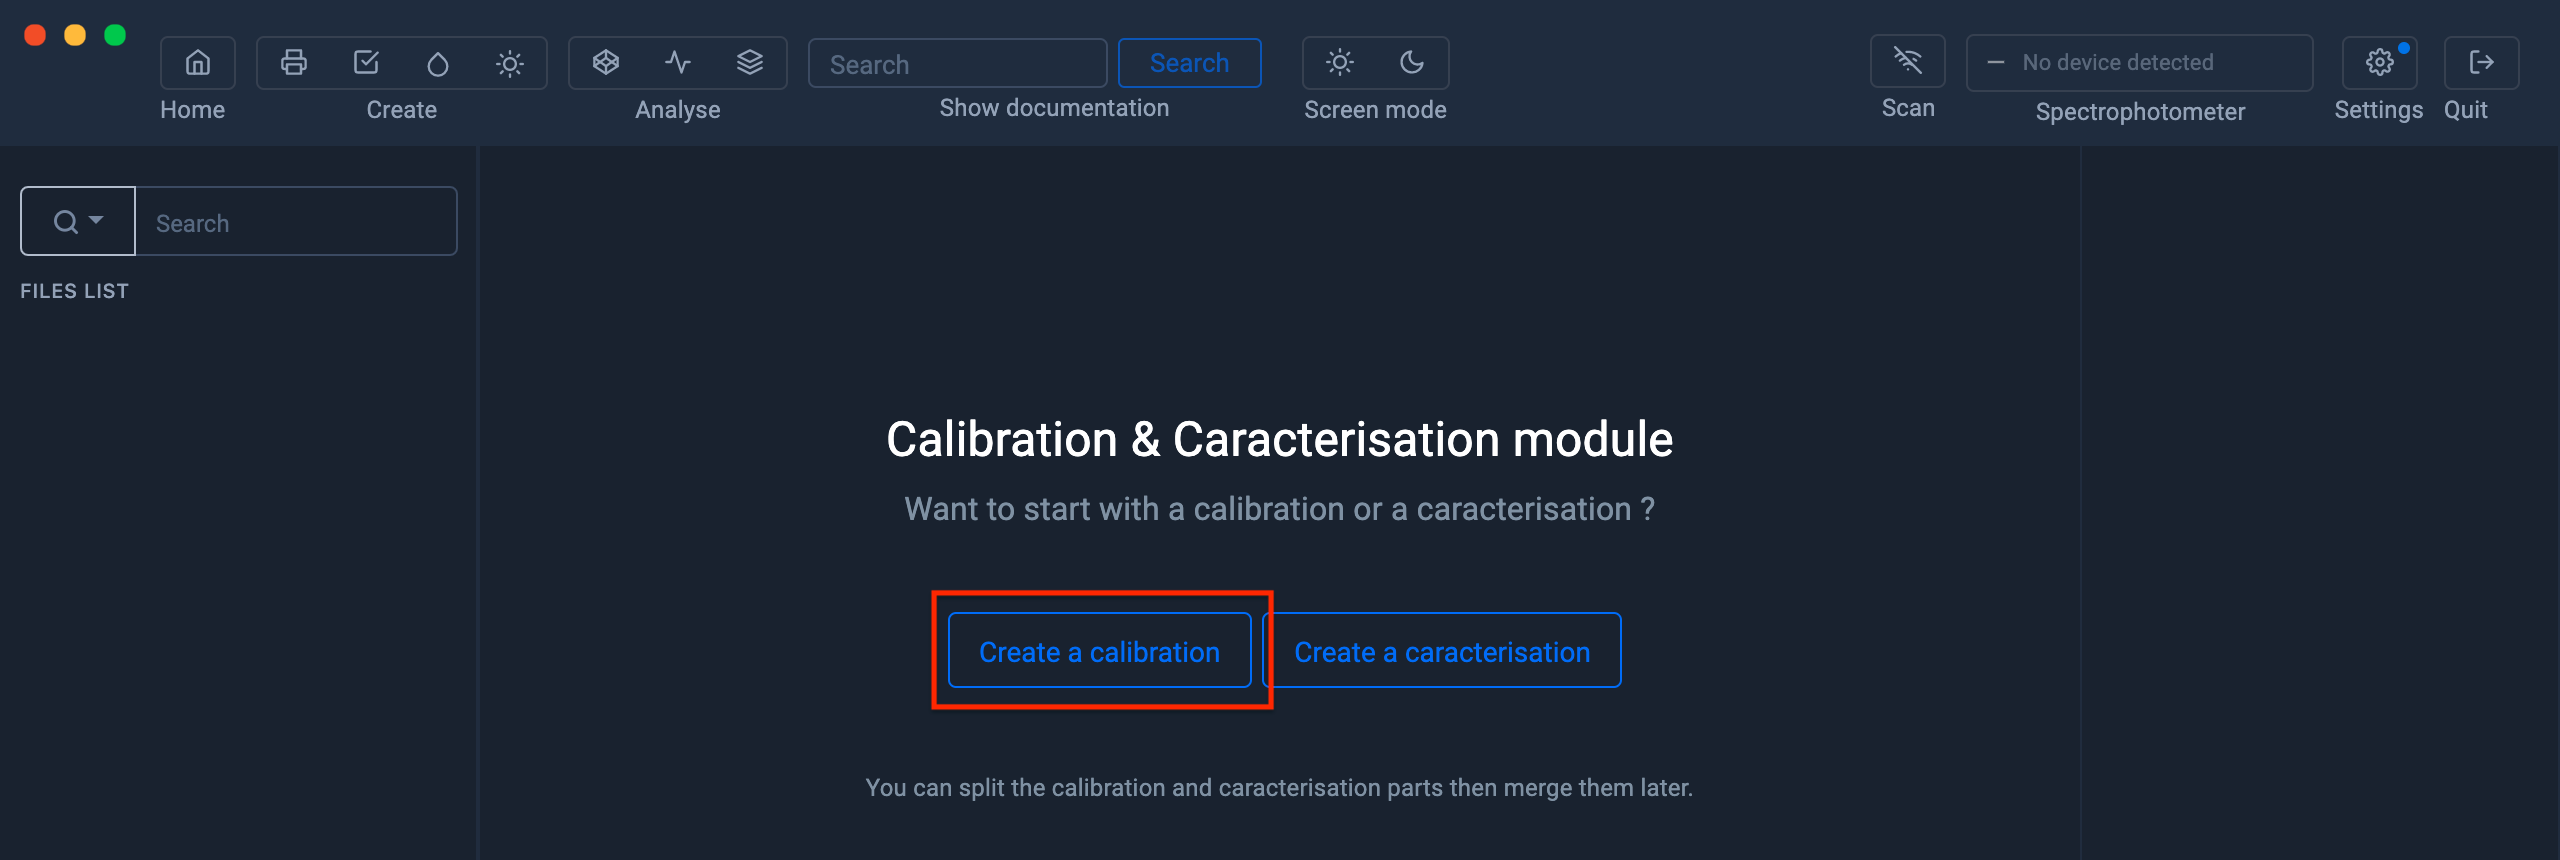
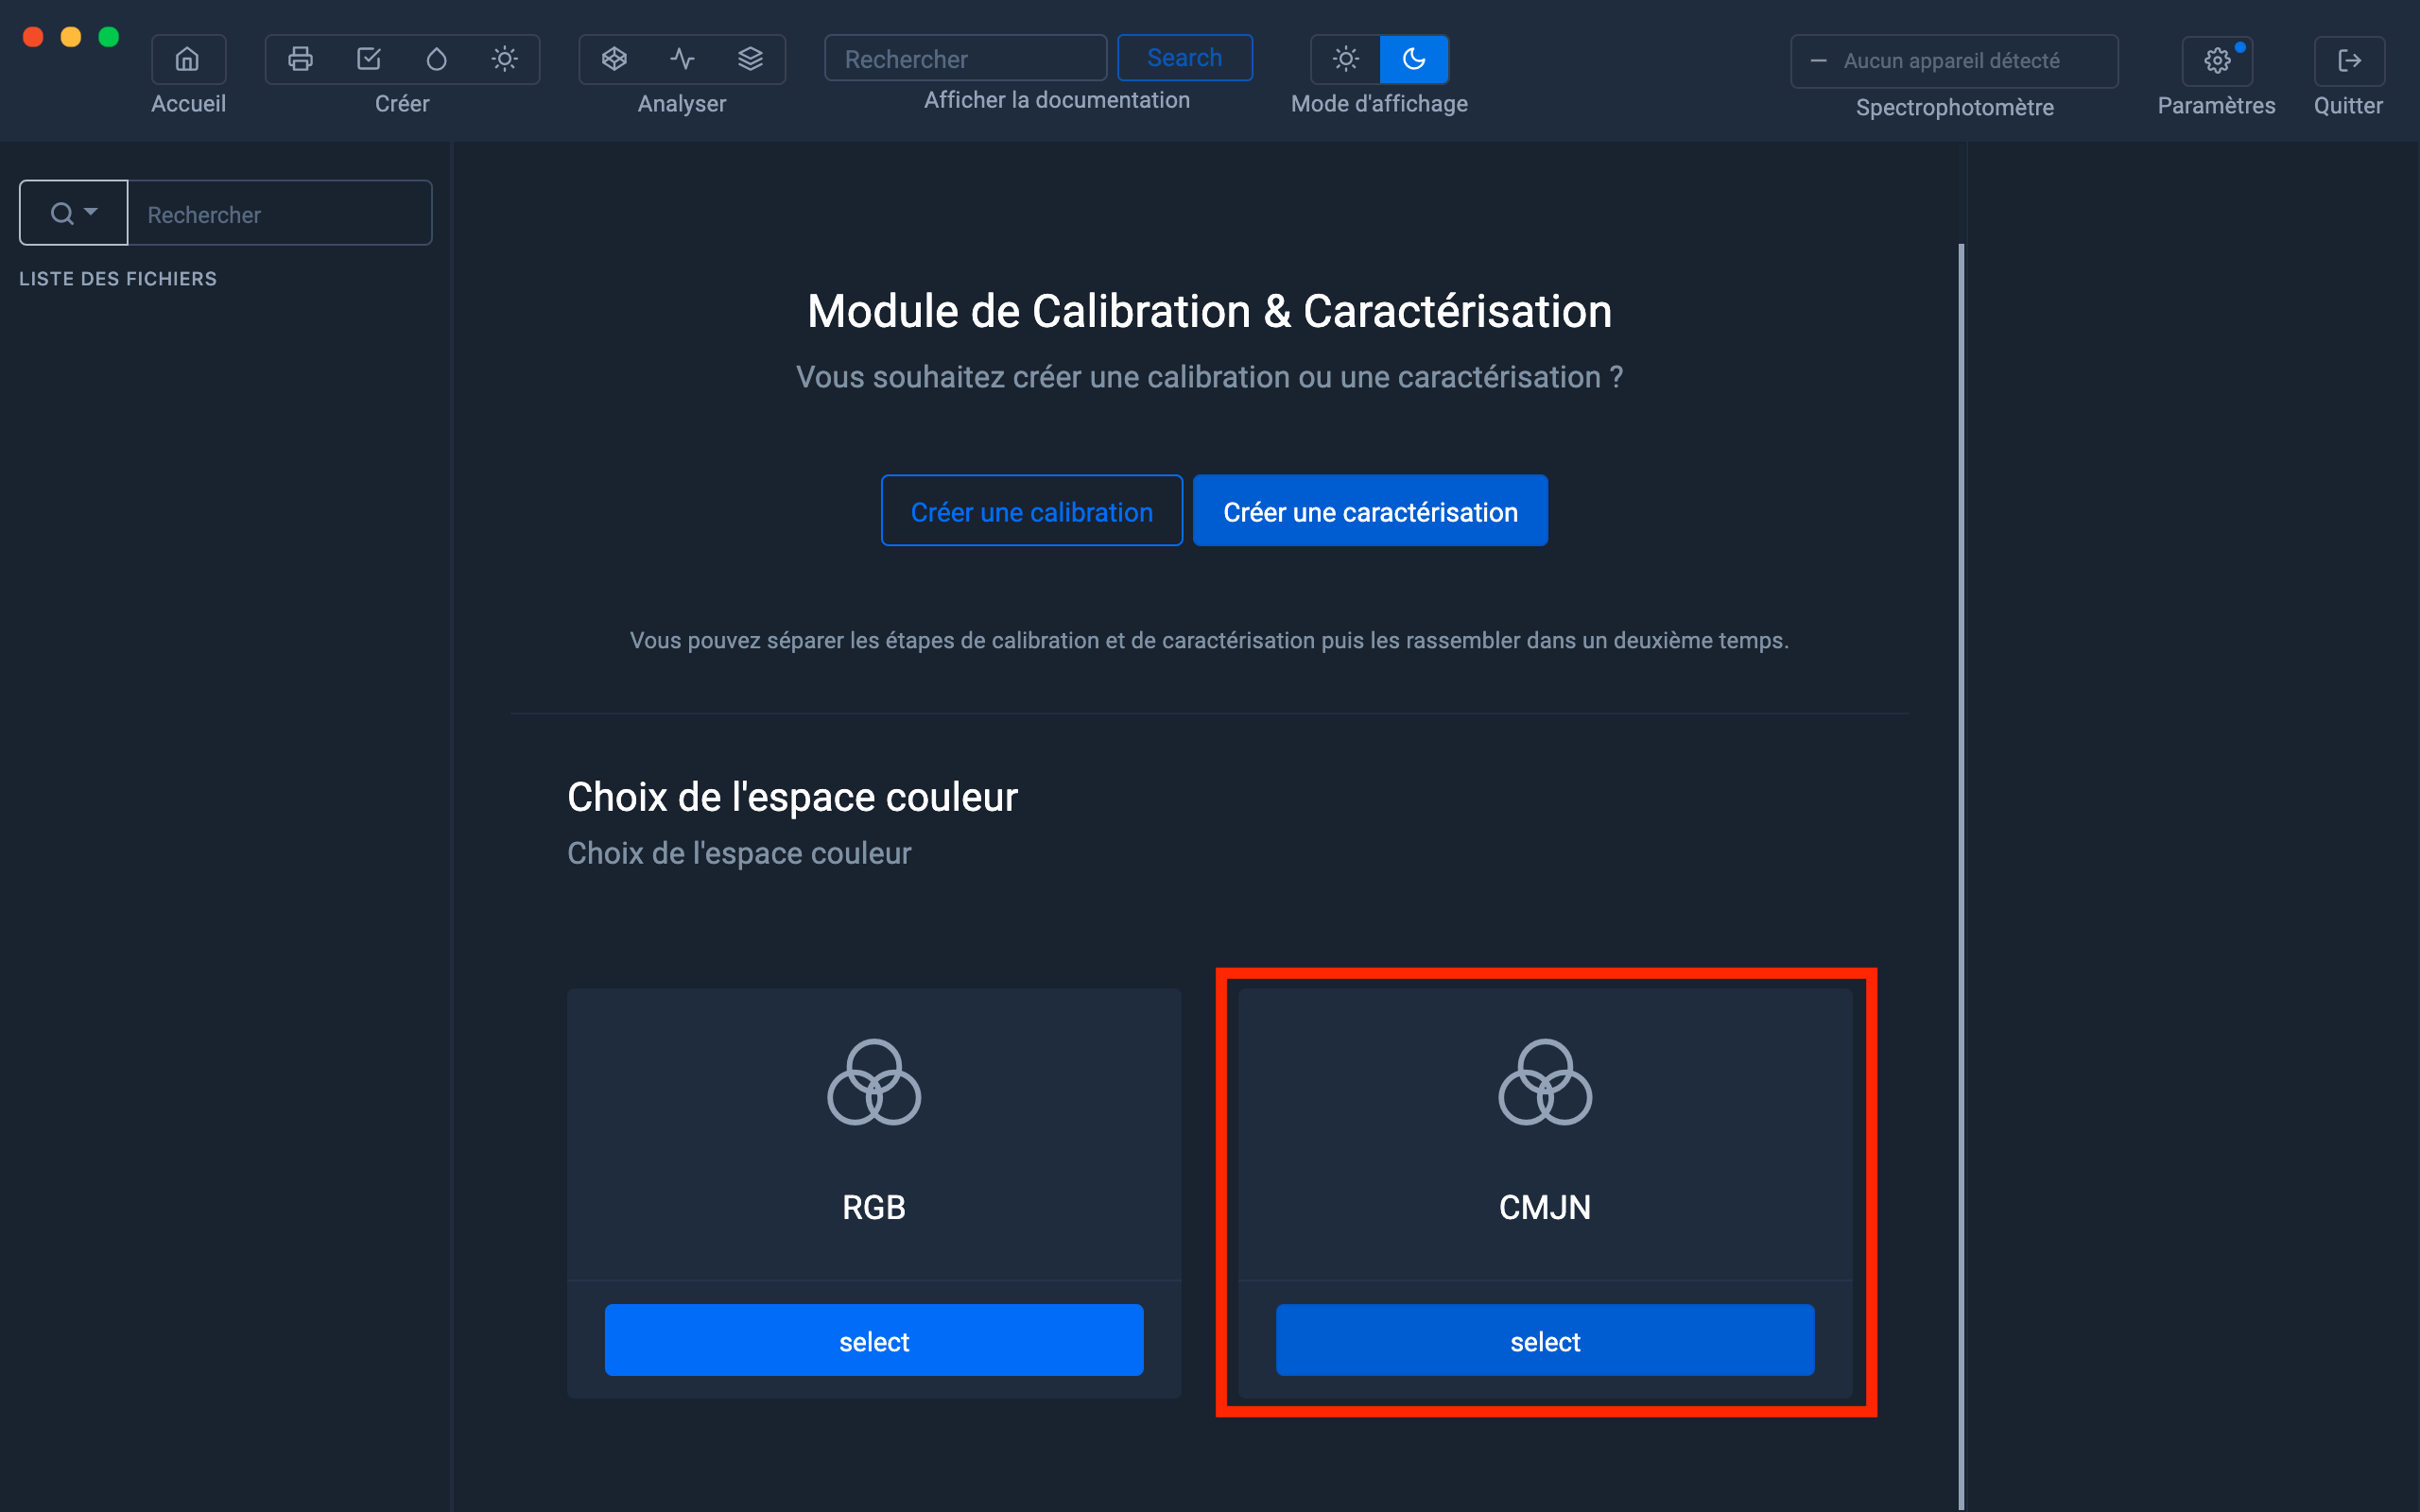
The "Calibration & Characterization " module window will appear. Click on the " Characterization " button
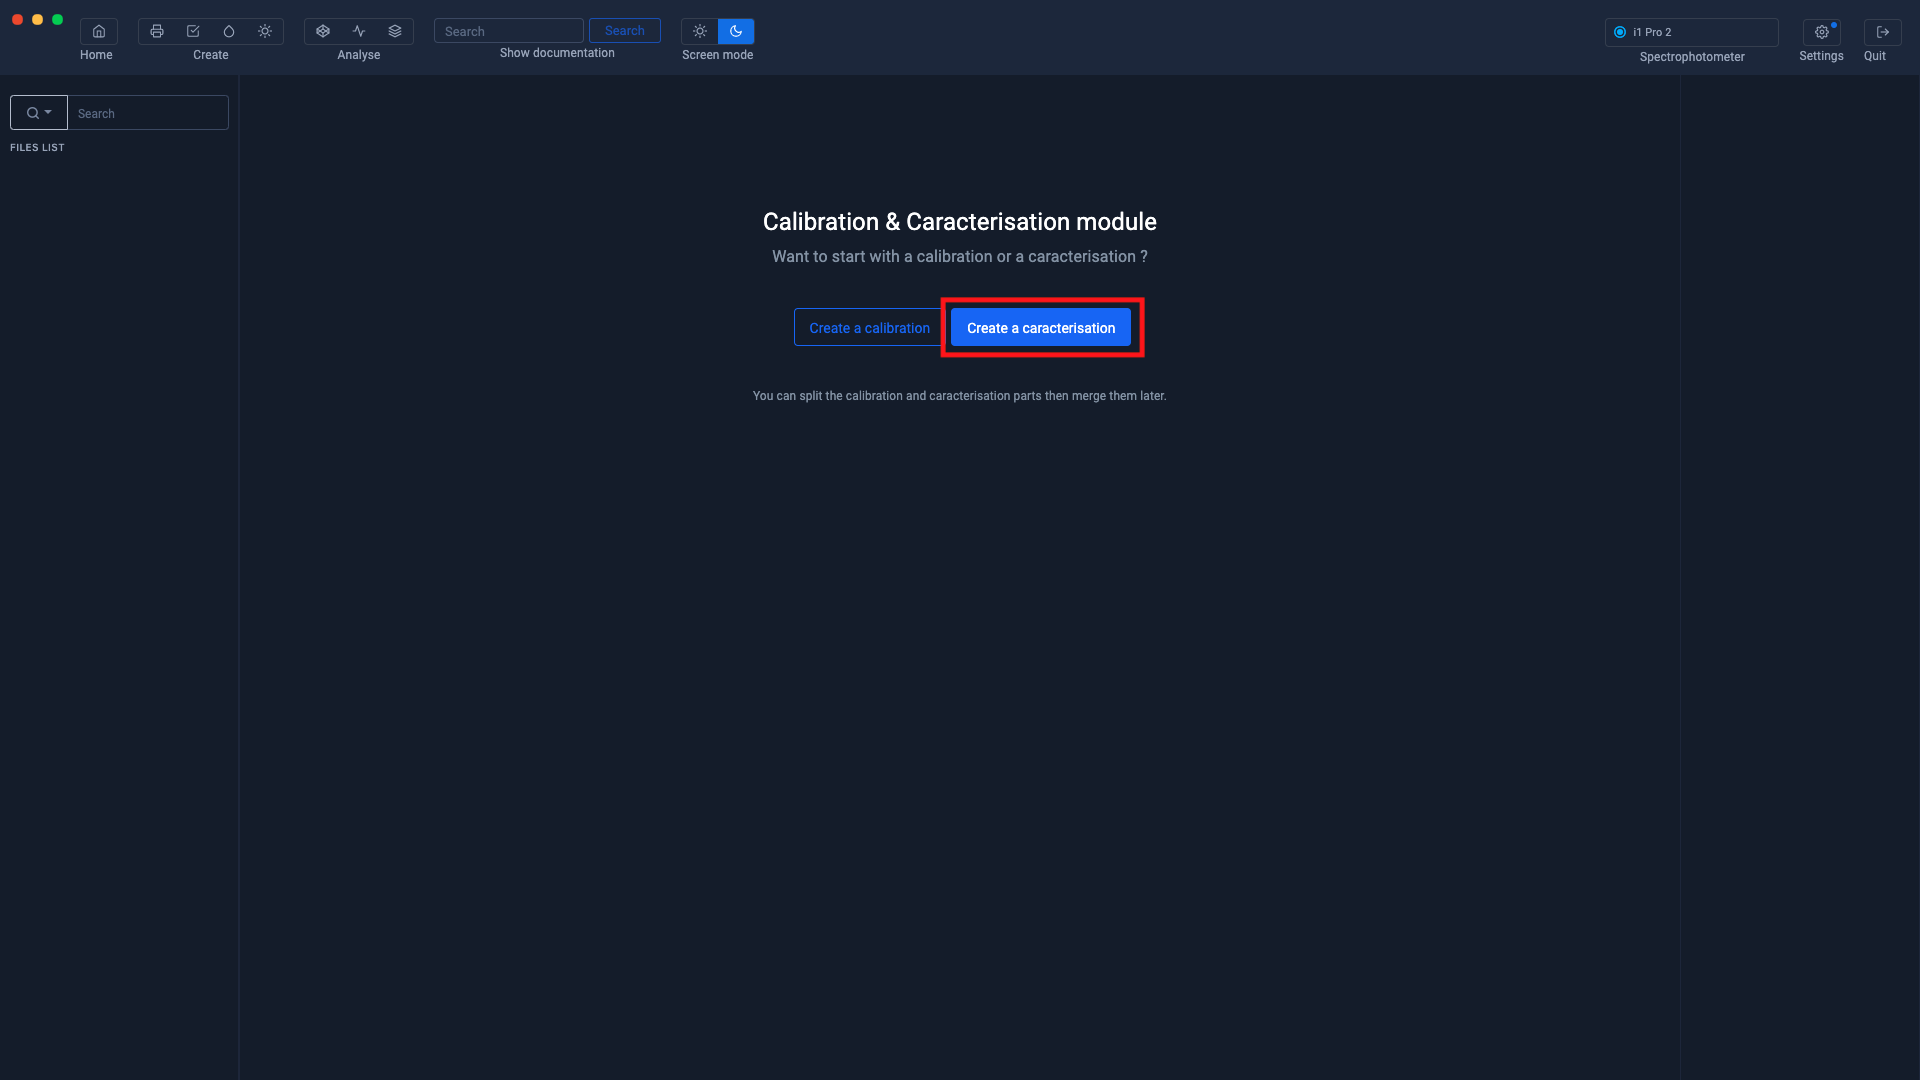
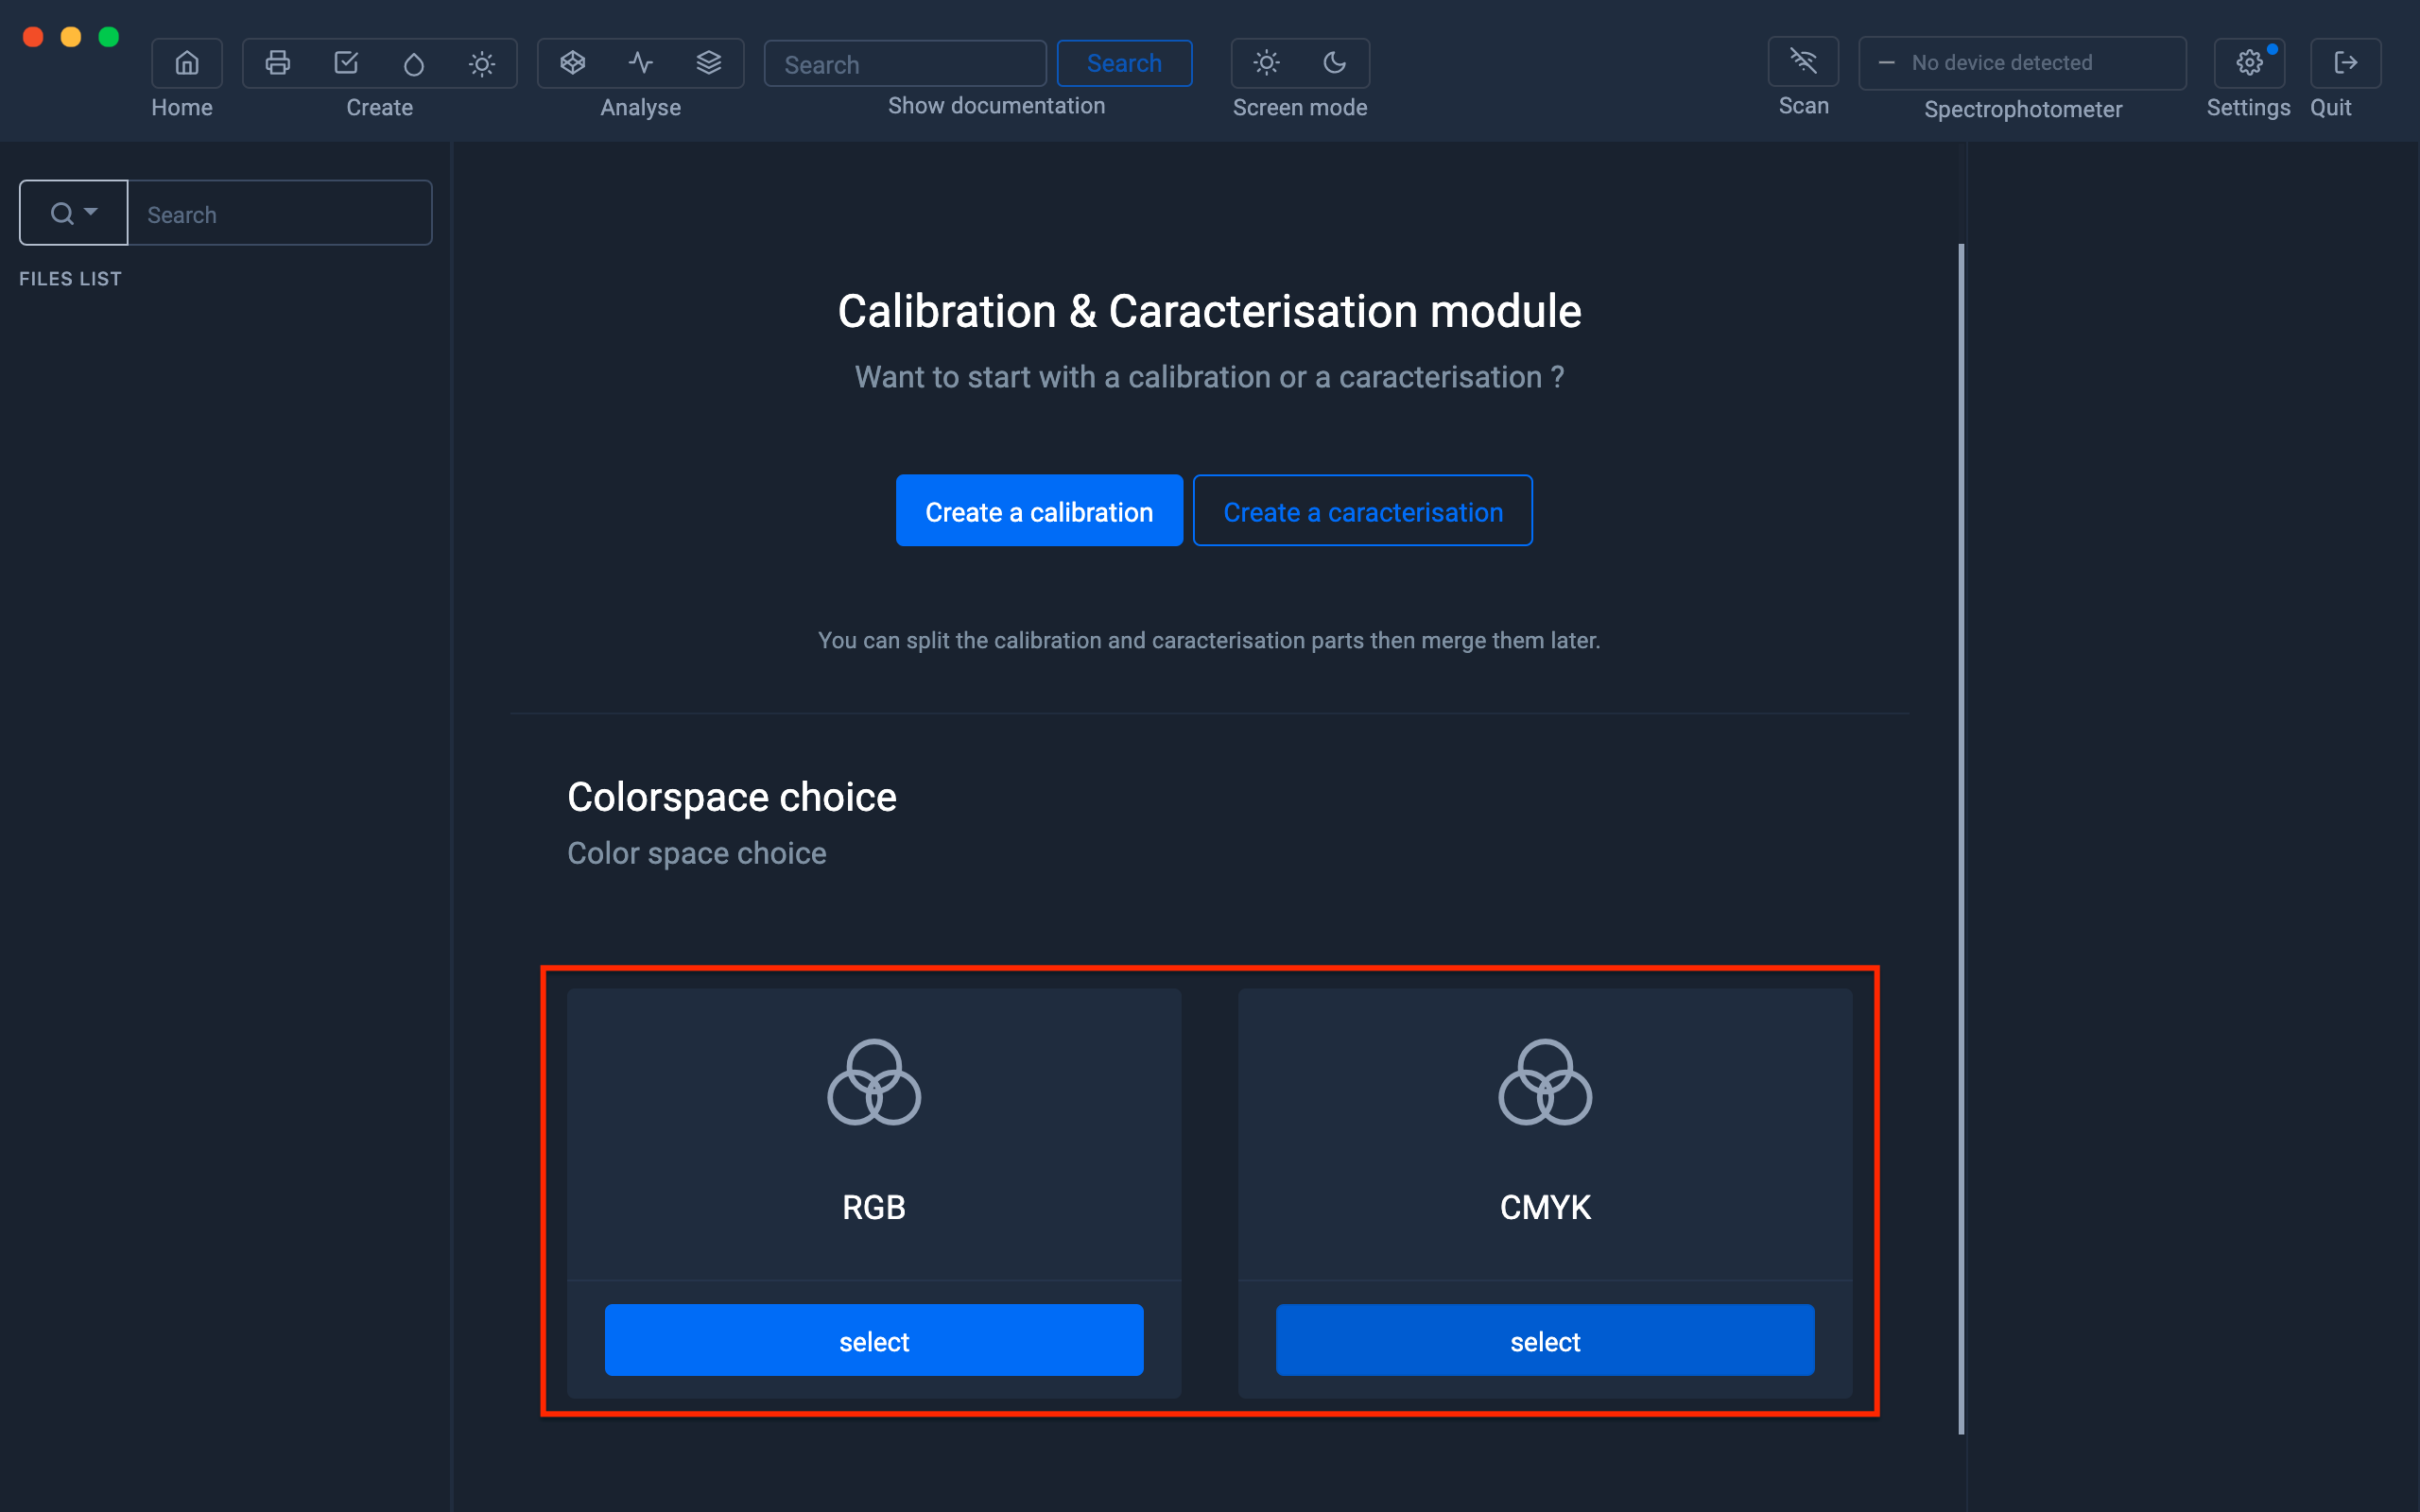
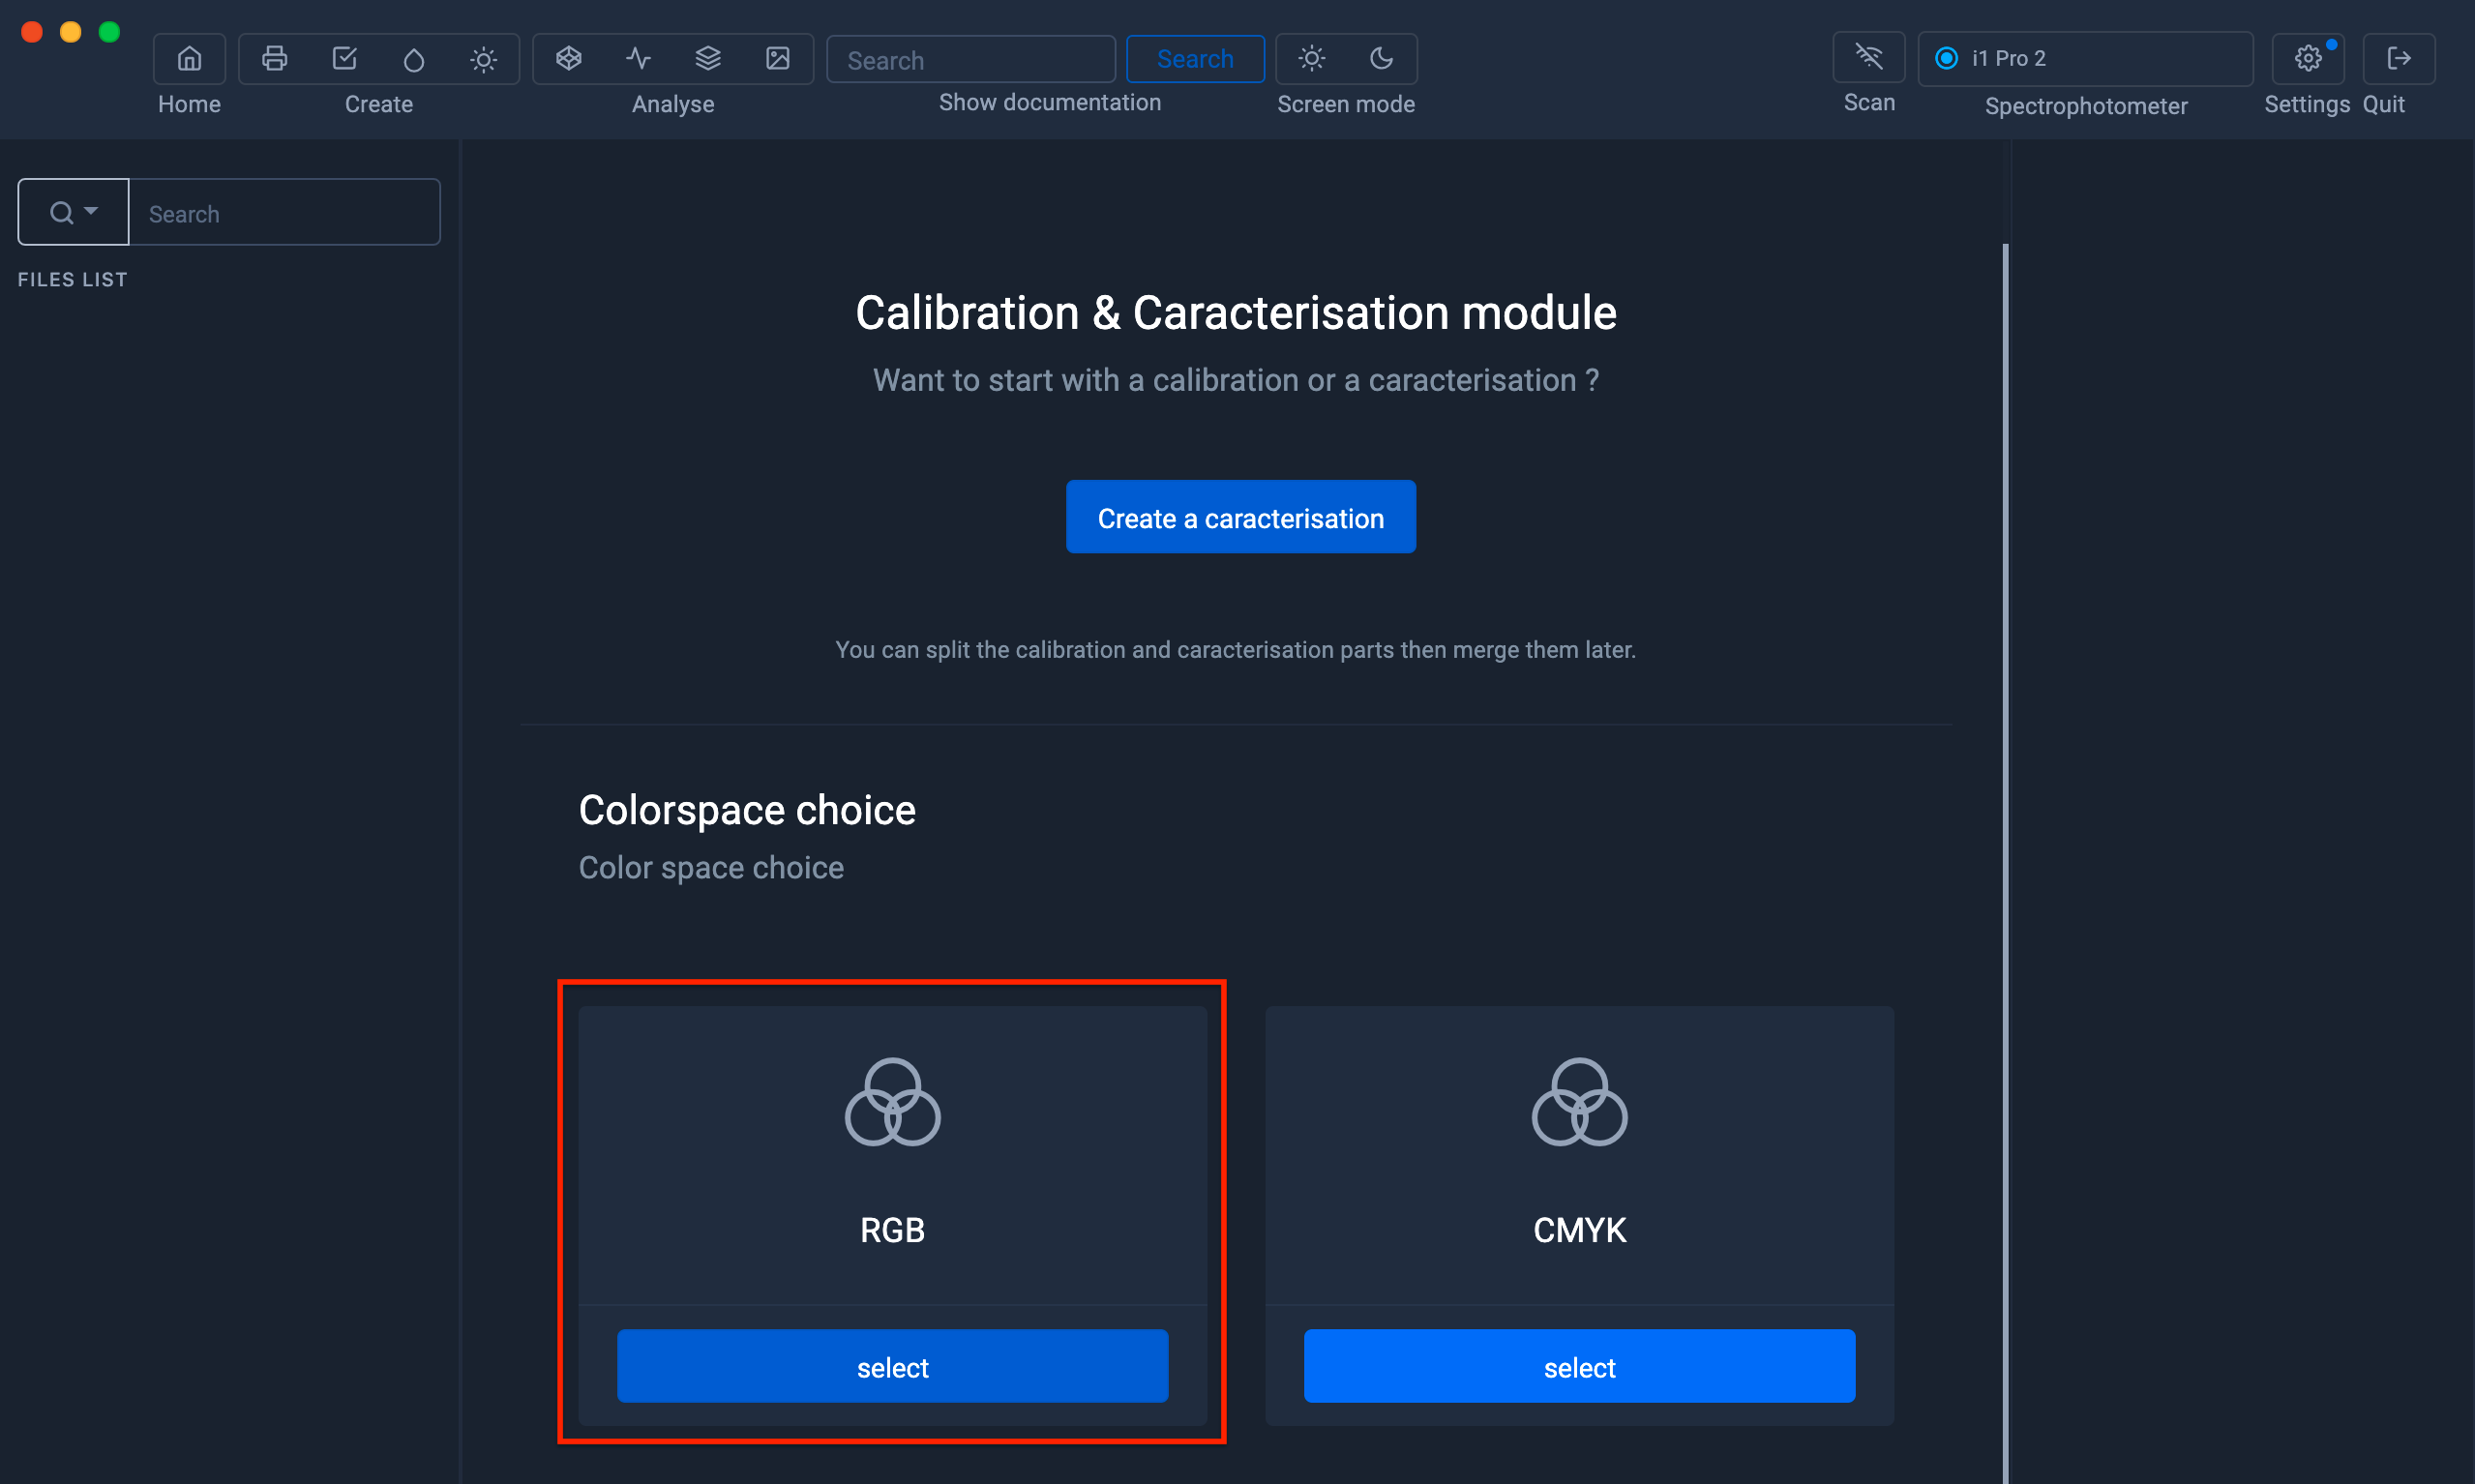
Typically, you will select RGB mode if you need to print from a driver (For example, if you want to print directly from Photoshop or another application without going through printer software (RIP))
If you are printing from a professional RIP (EFI, Caldera, Onyx, Ergosoft, Wasatch, NeoStampa, Epson Edge Print, etc.), you may need to create your ICC profile in CMYK mode.
Selection of the benchmark
Click on the " CMYK " button
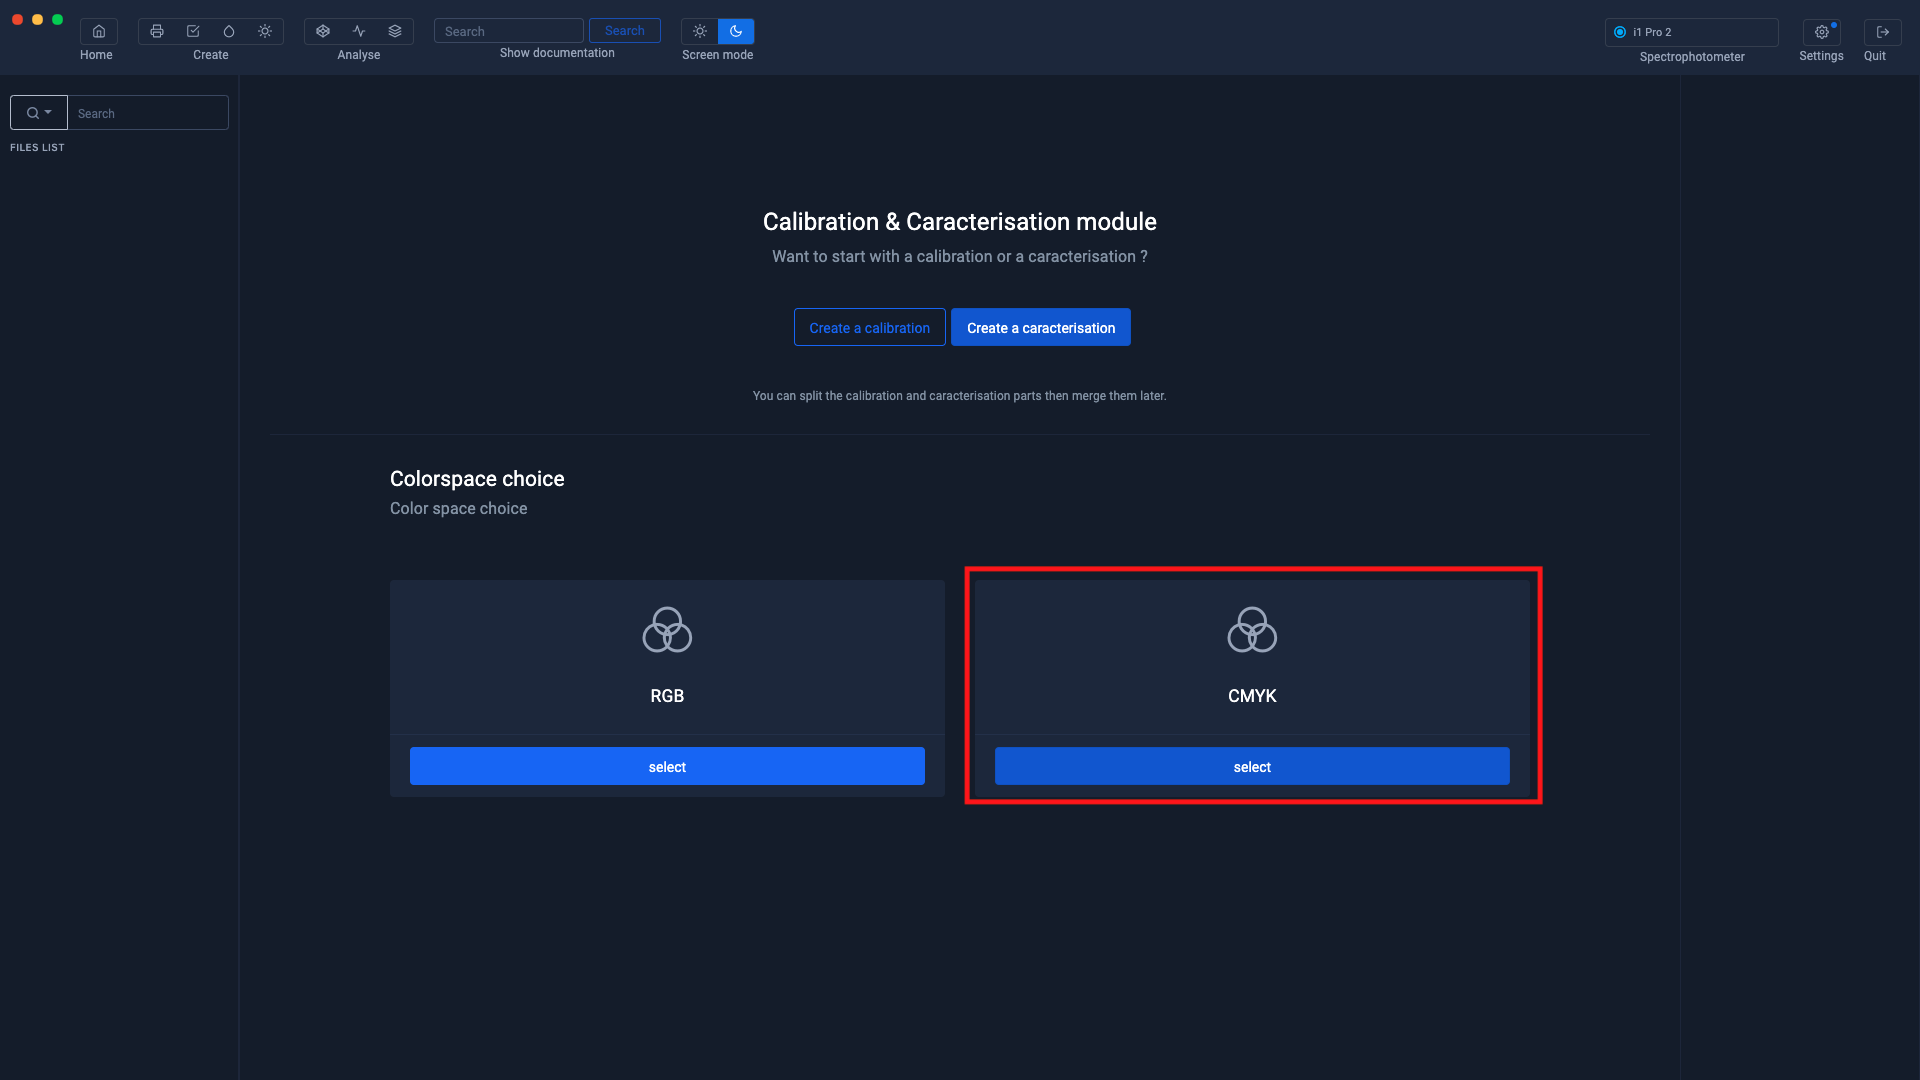
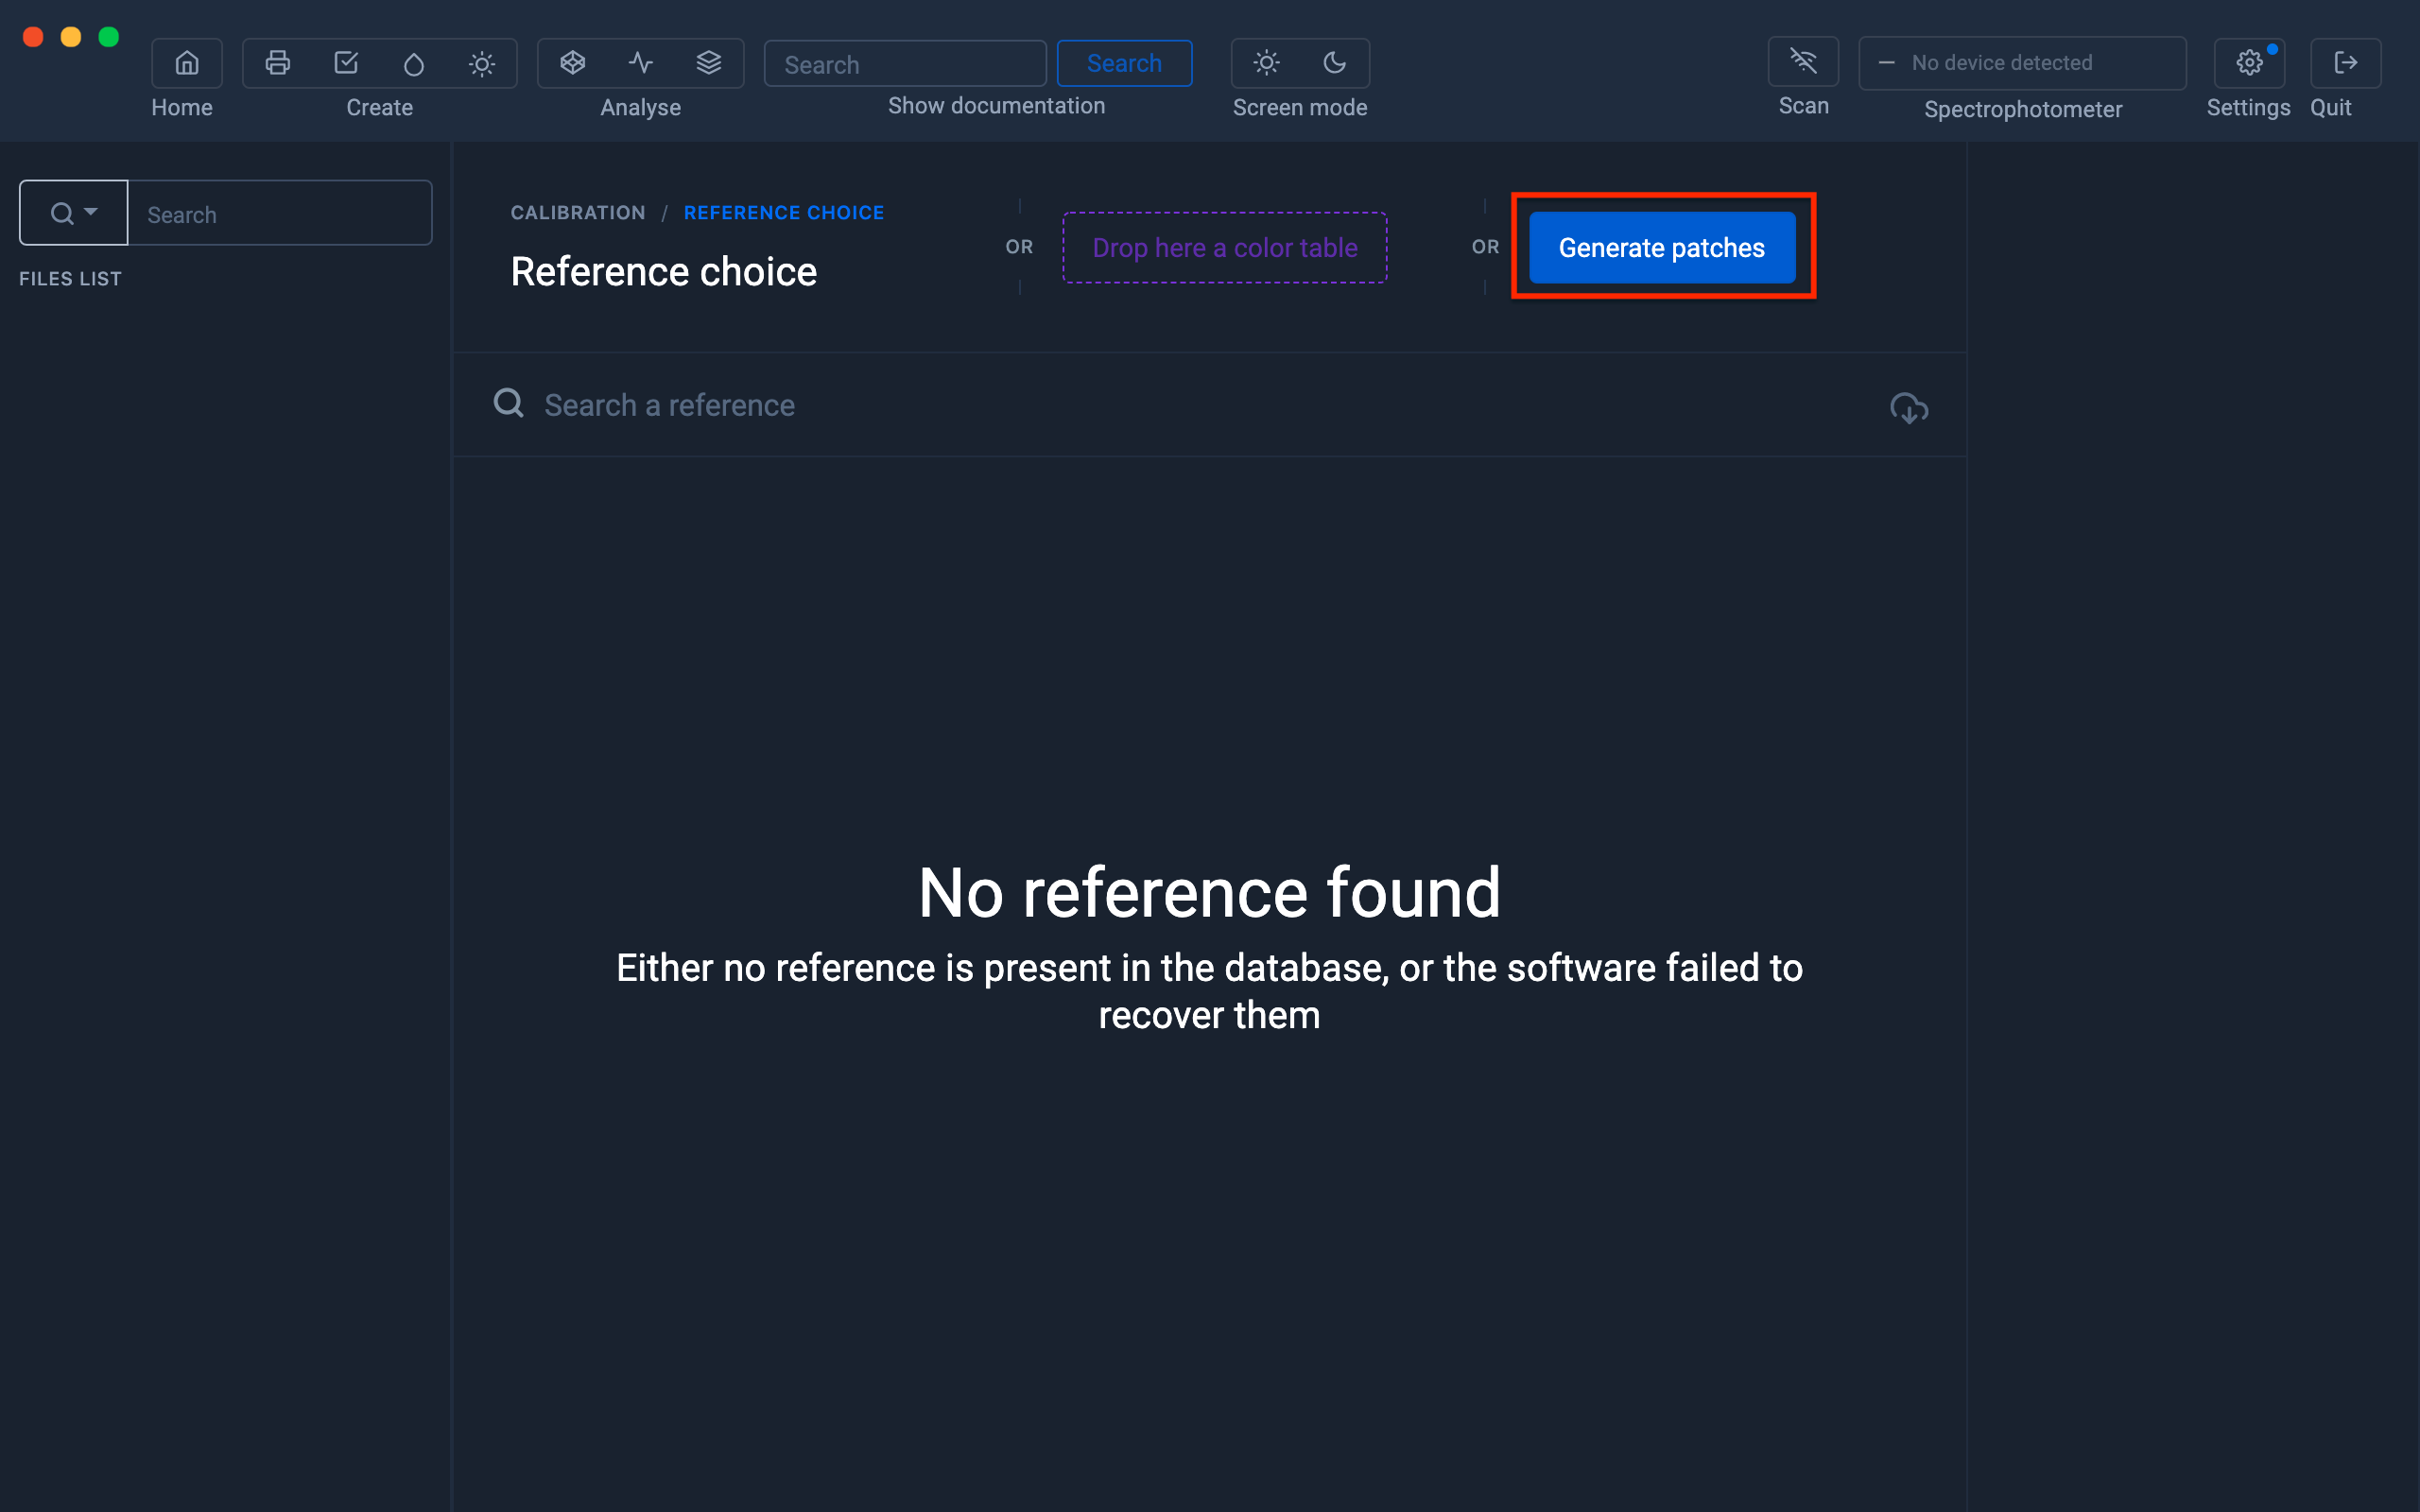
A list of benchmarks appears.
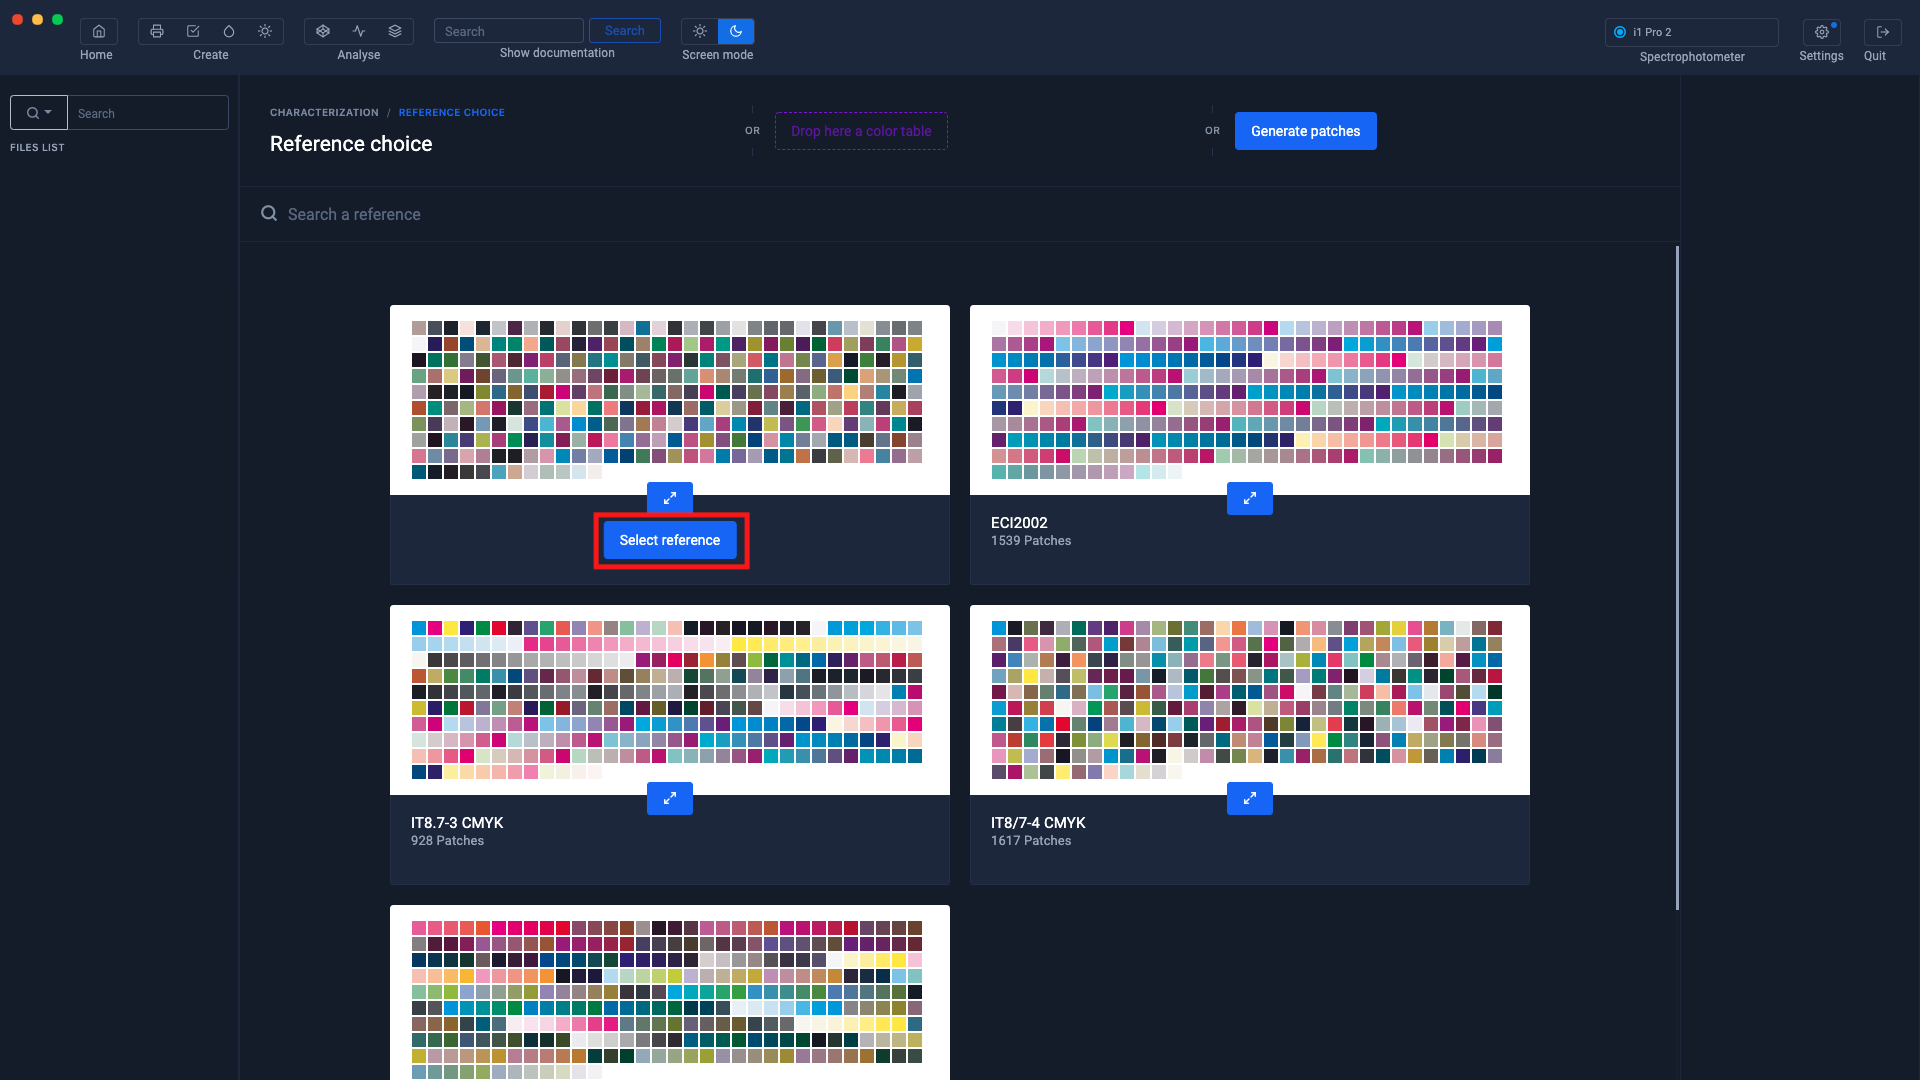
By clicking on the " Show all patches " button you can view all the patches in the range.
This button is located under the crosshairs
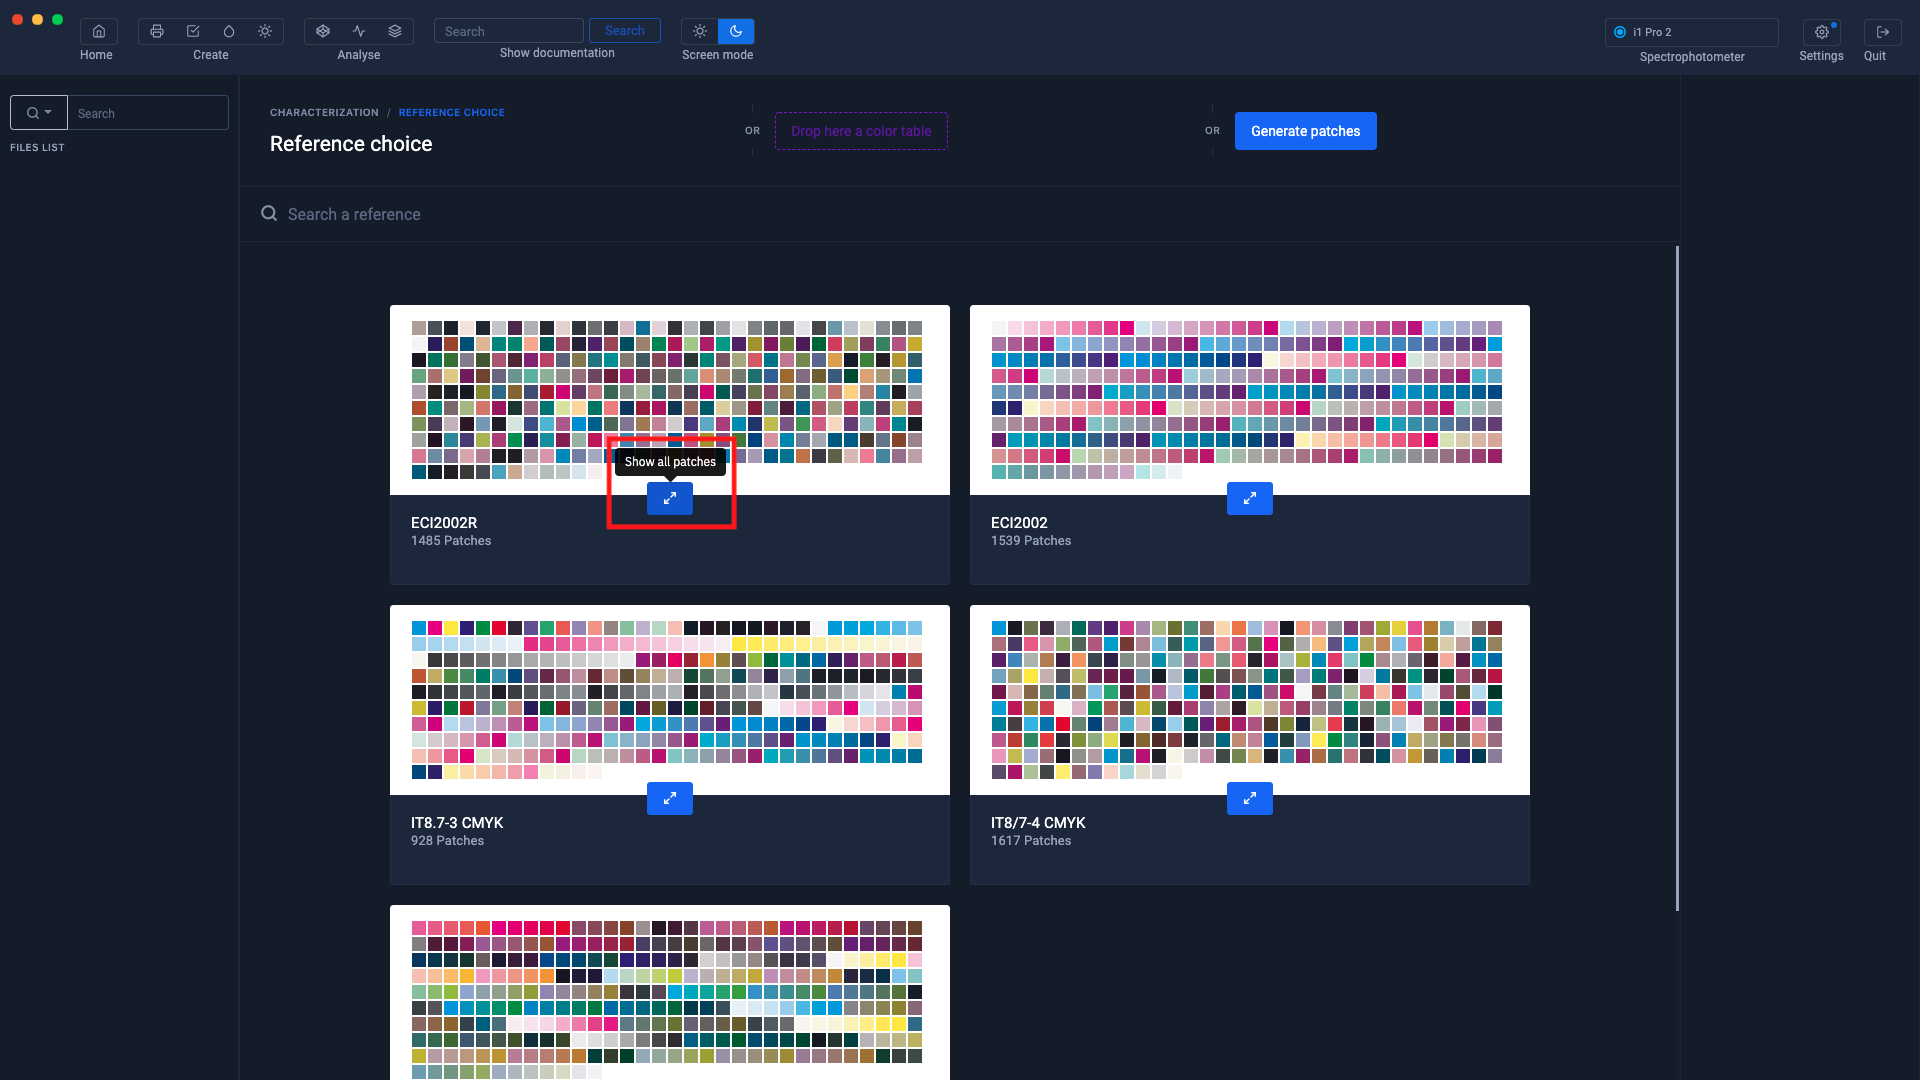
When you hover over the staff with the mouse, a " Select reference " button appears.
Click on the " Select reference " button corresponding to the ECI2002R test pattern
Editing the test pattern
At this step, you can customize your test chart before printing it.

To find out more, see the chapter: Customizing charts
Printing the test pattern
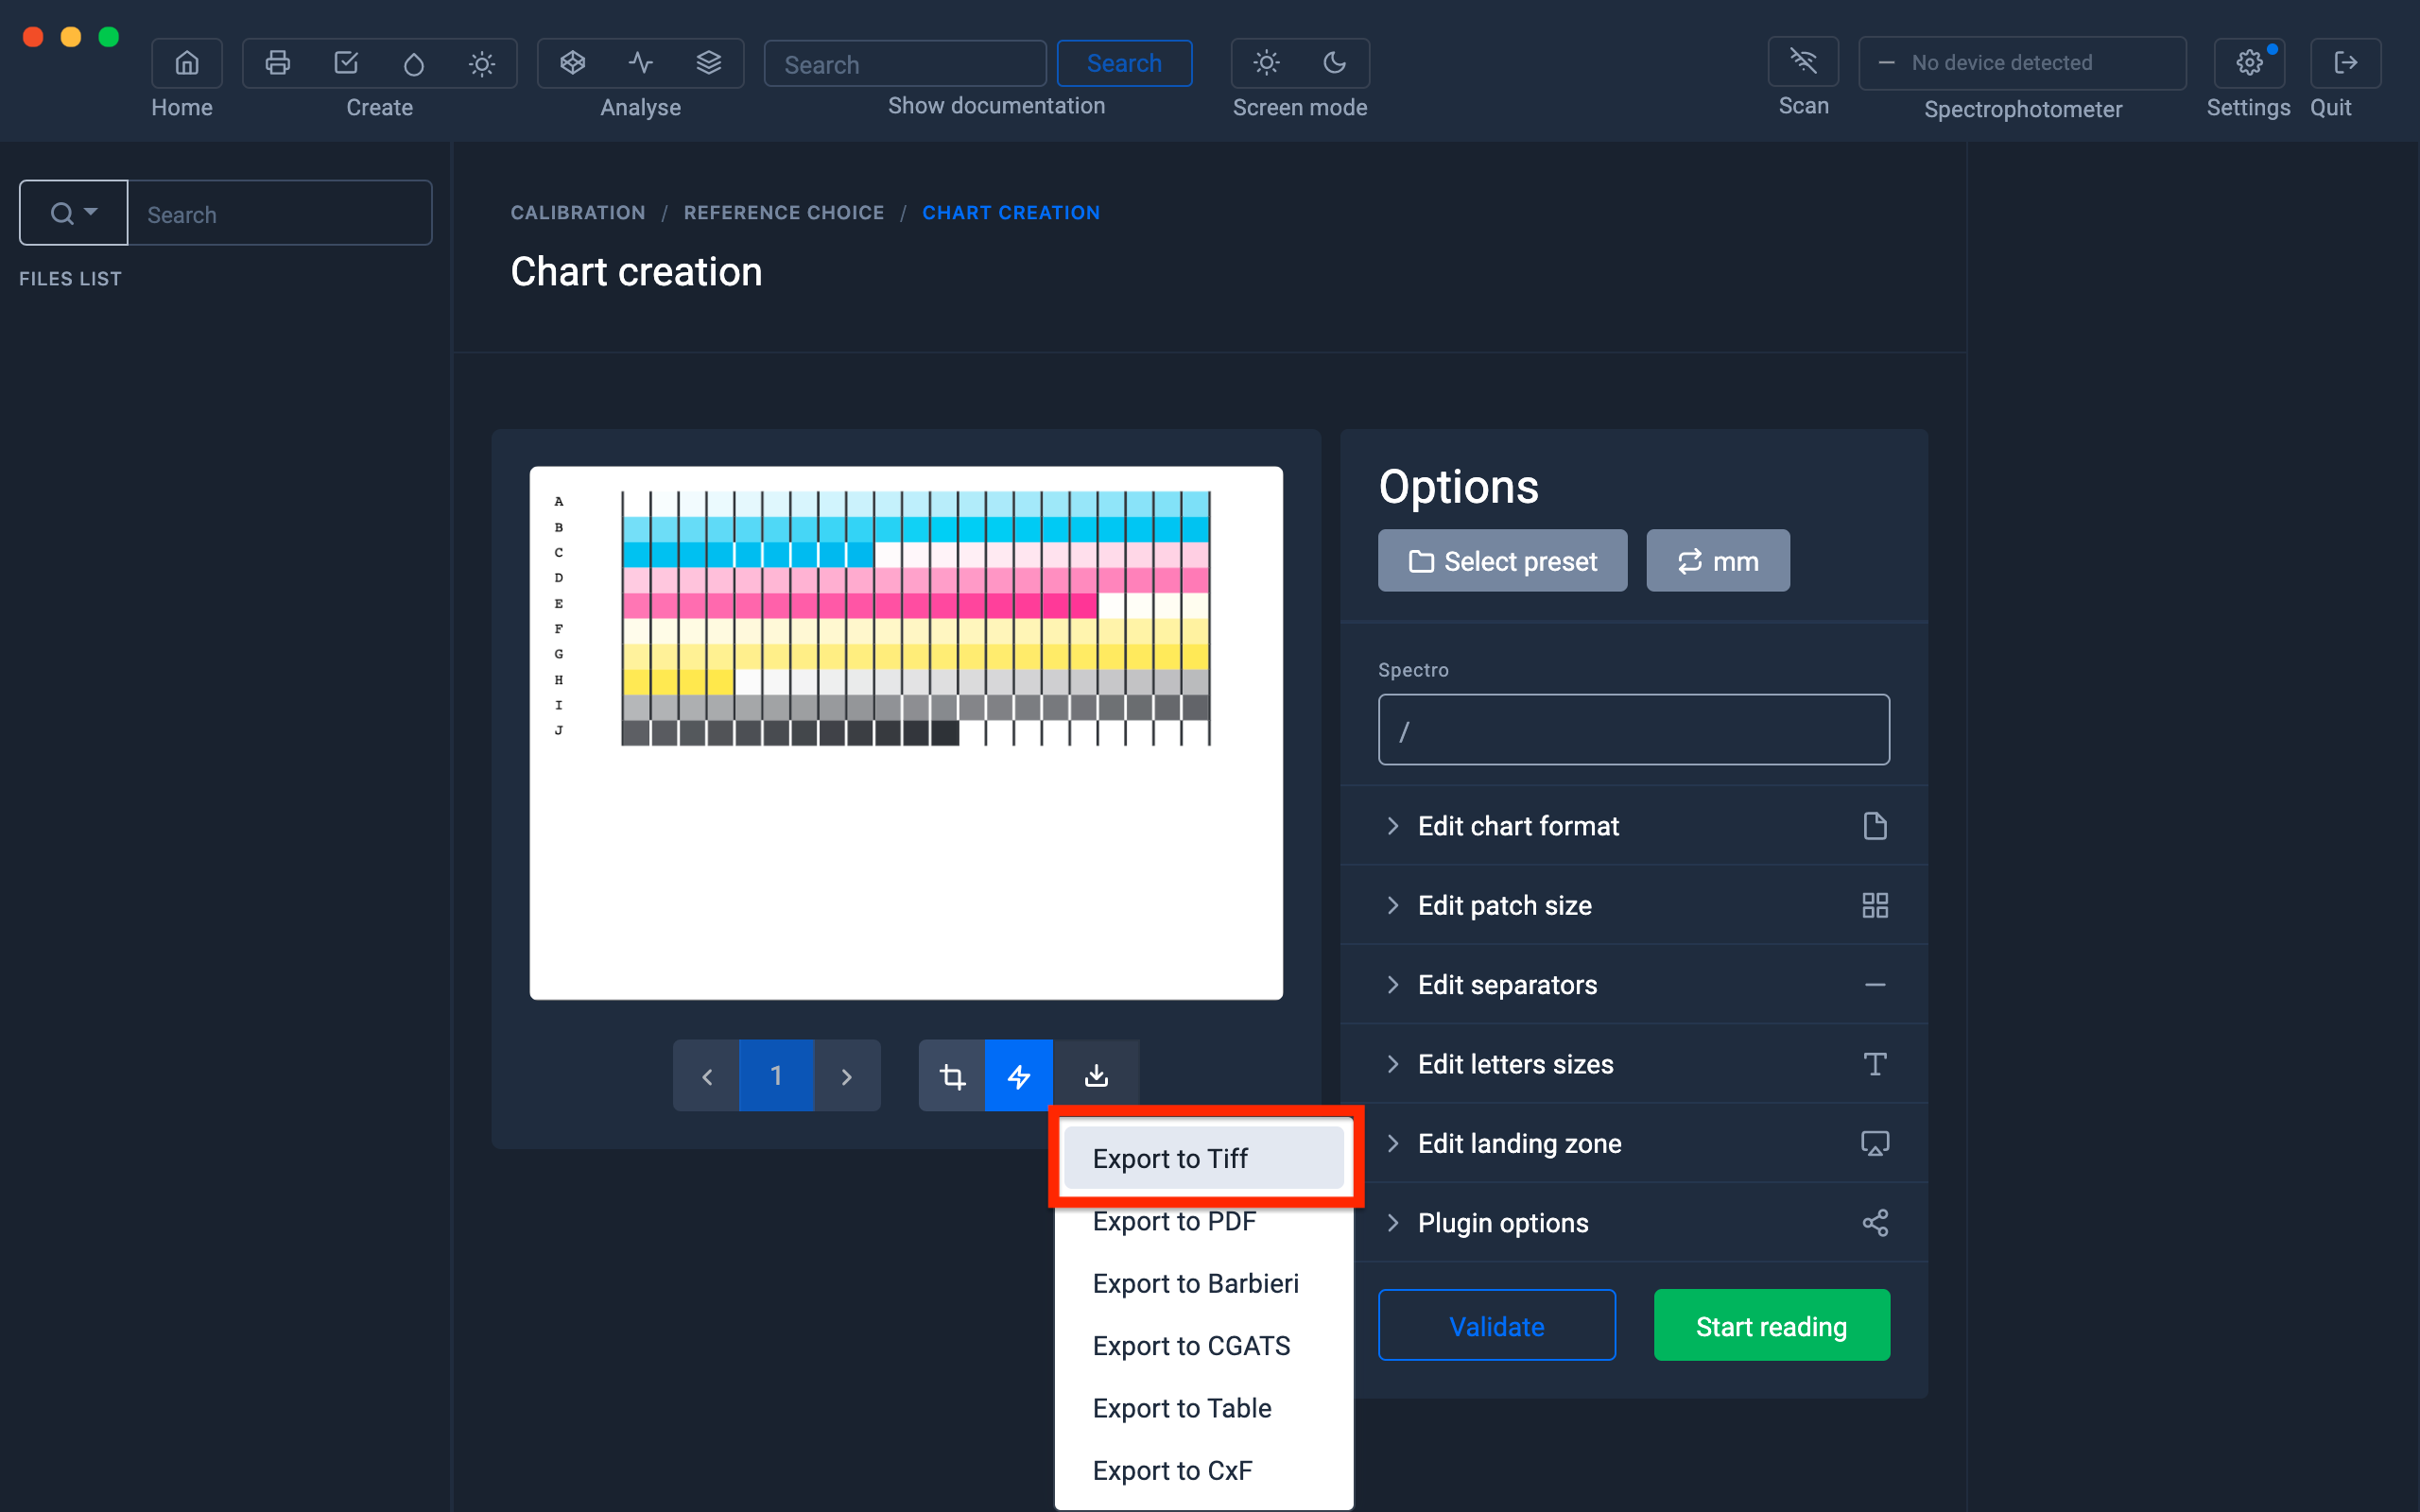
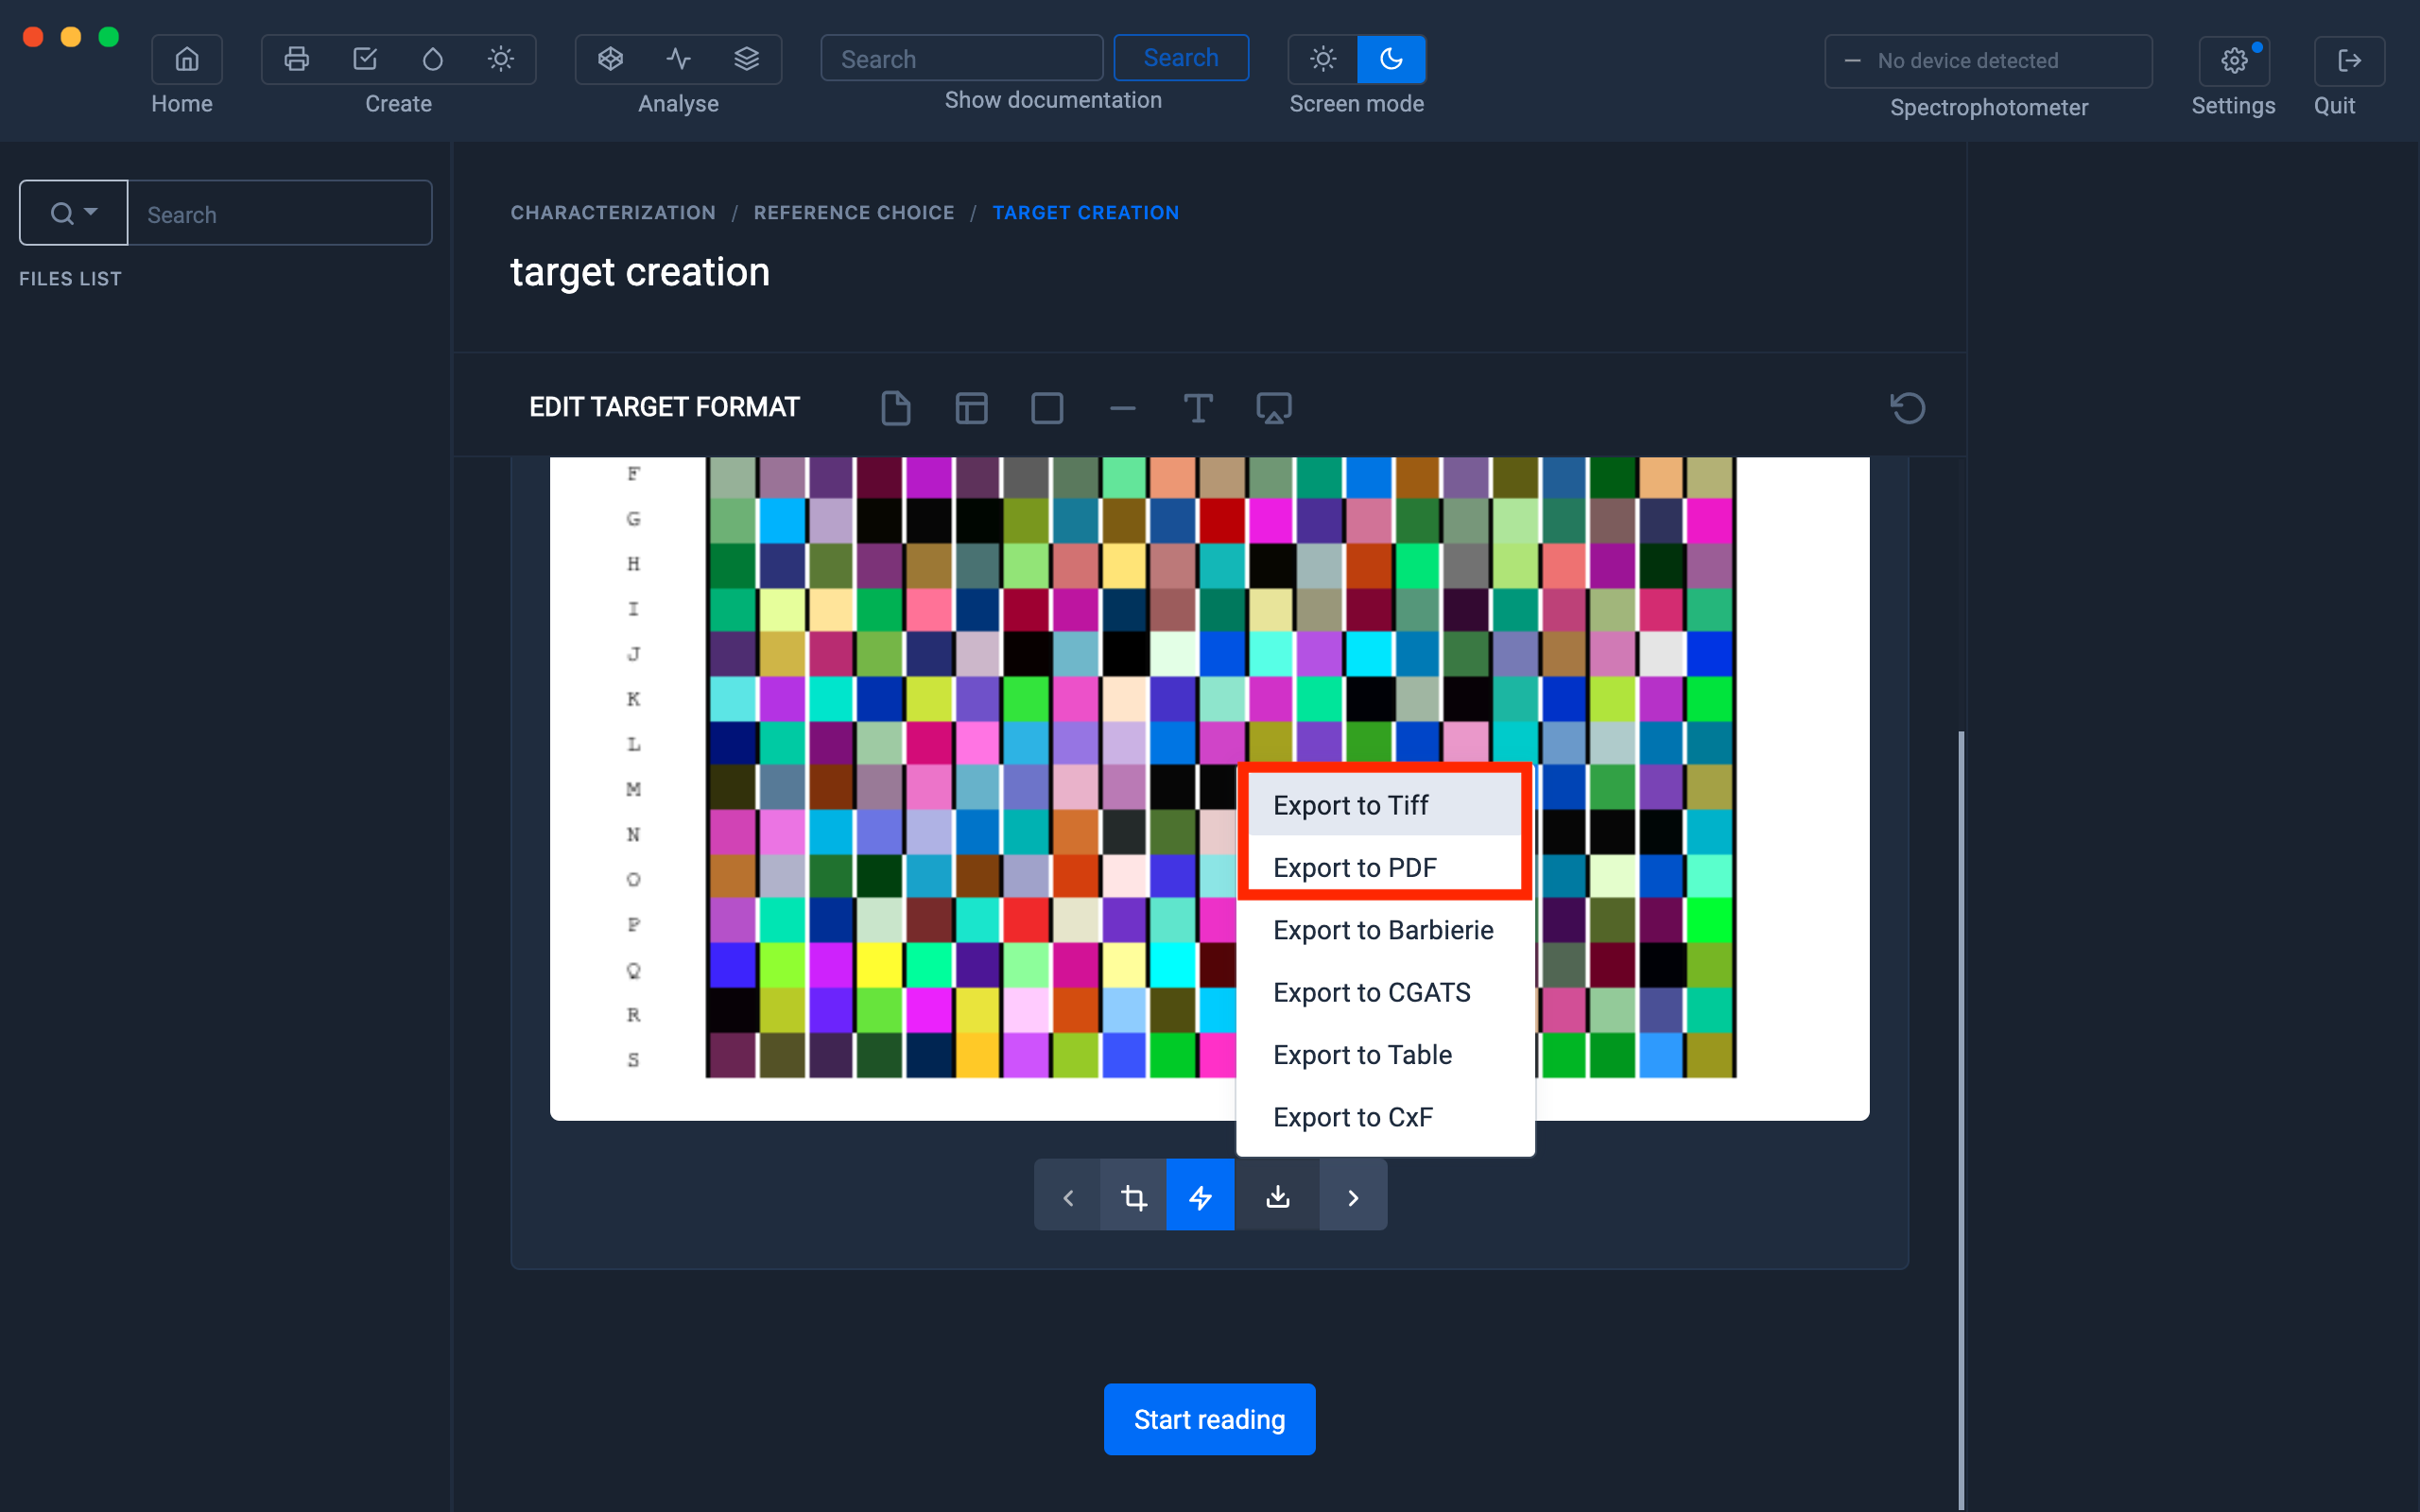
When the test chart is finished, export it in Tiff or pdf format to print it.

Patterns can be made up of multiple pages, depending on the number of patches and the page size.
Important: you must print the ranges without color management.
If the profile is intended to be used by a RIP, you must print the CMYK or RGB targets under the conditions defined by the RIP.
If the profile is intended to be used via a printer driver, you must print the RGB targets under the conditions defined by the printer manufacturer.
For more information, see the chapter: Printing an RGB test patternvia a driver
Target measurement
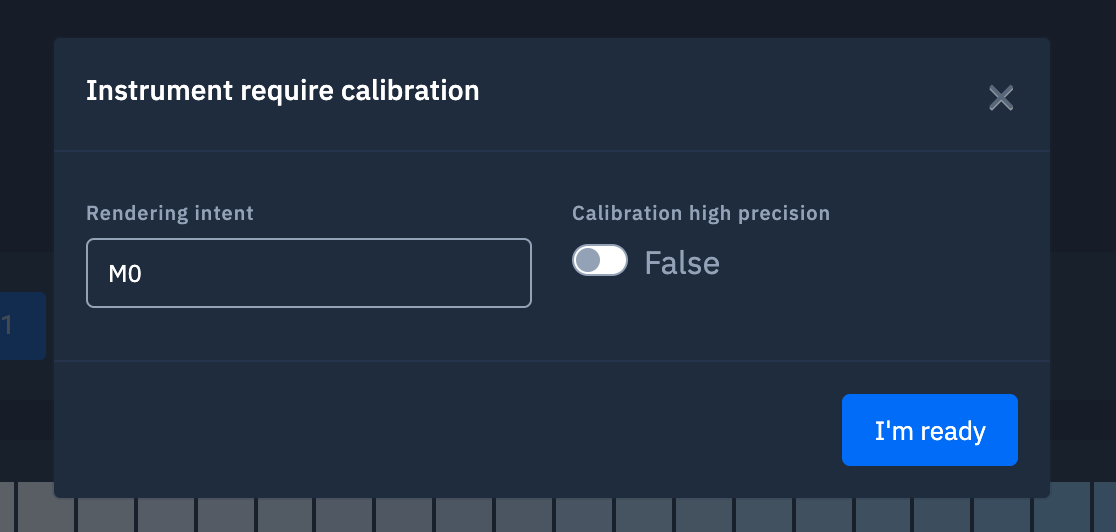
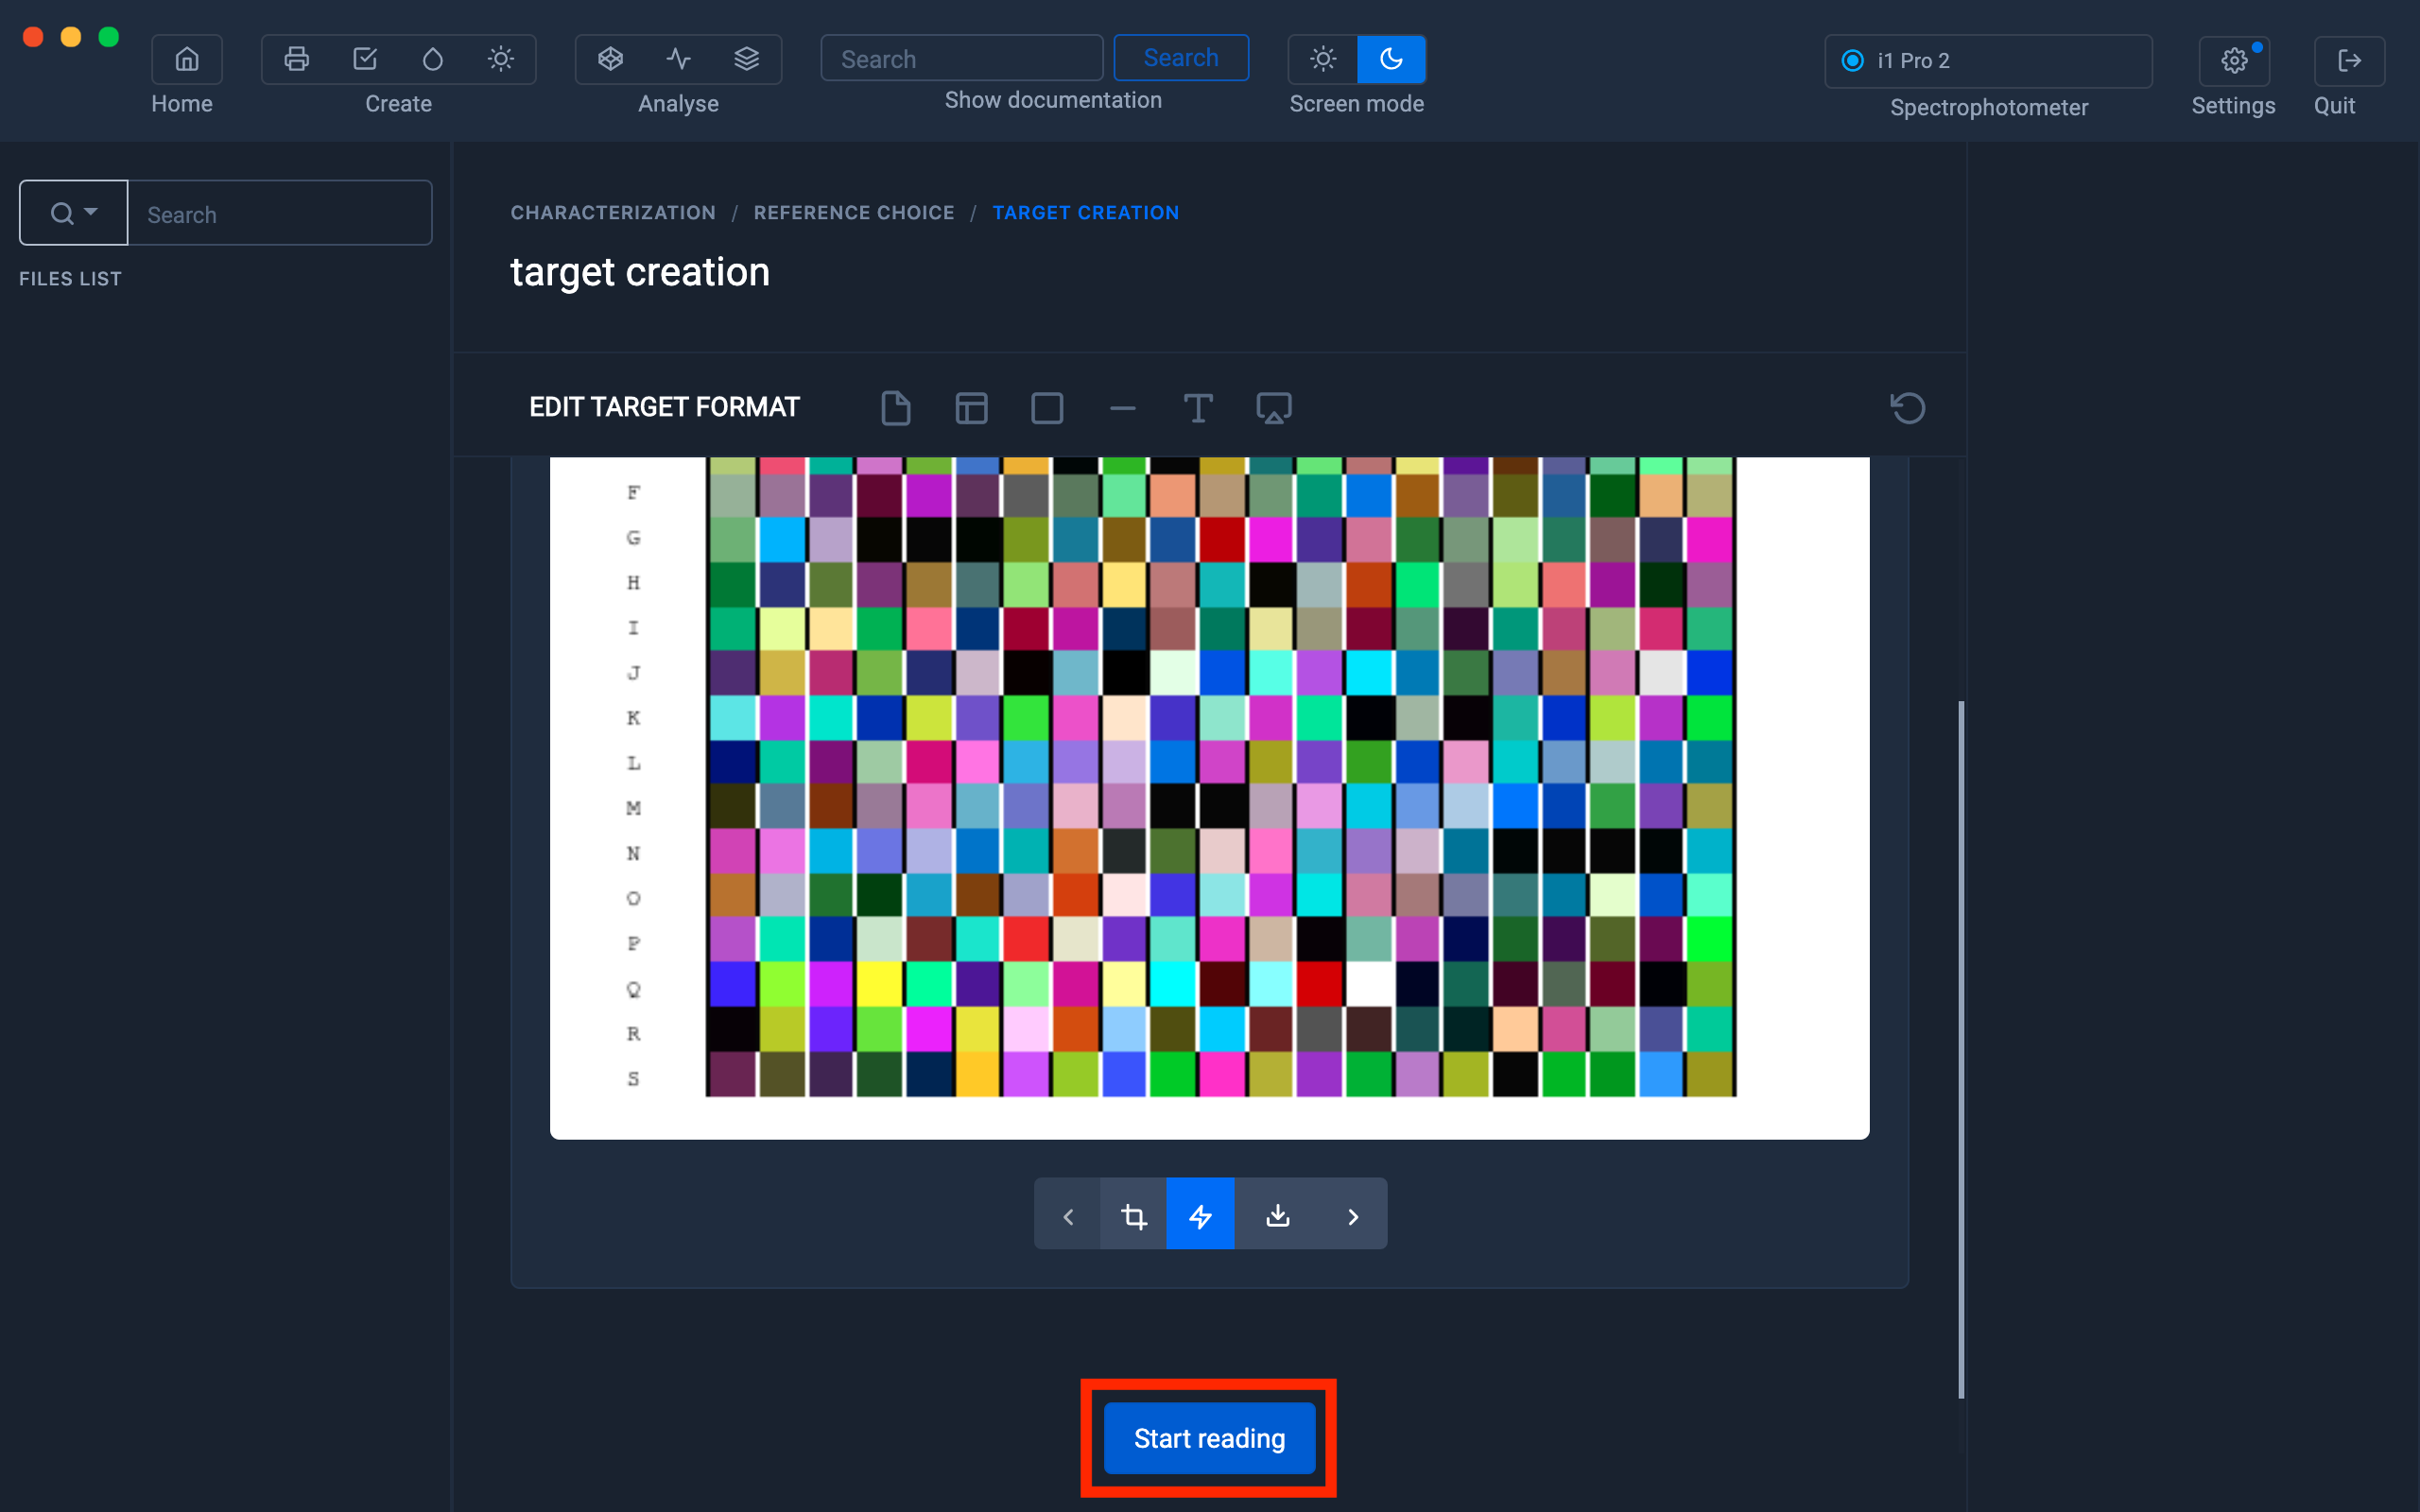
Once the test chart has been printed, click on the " Start reading " button to start measuring the range.

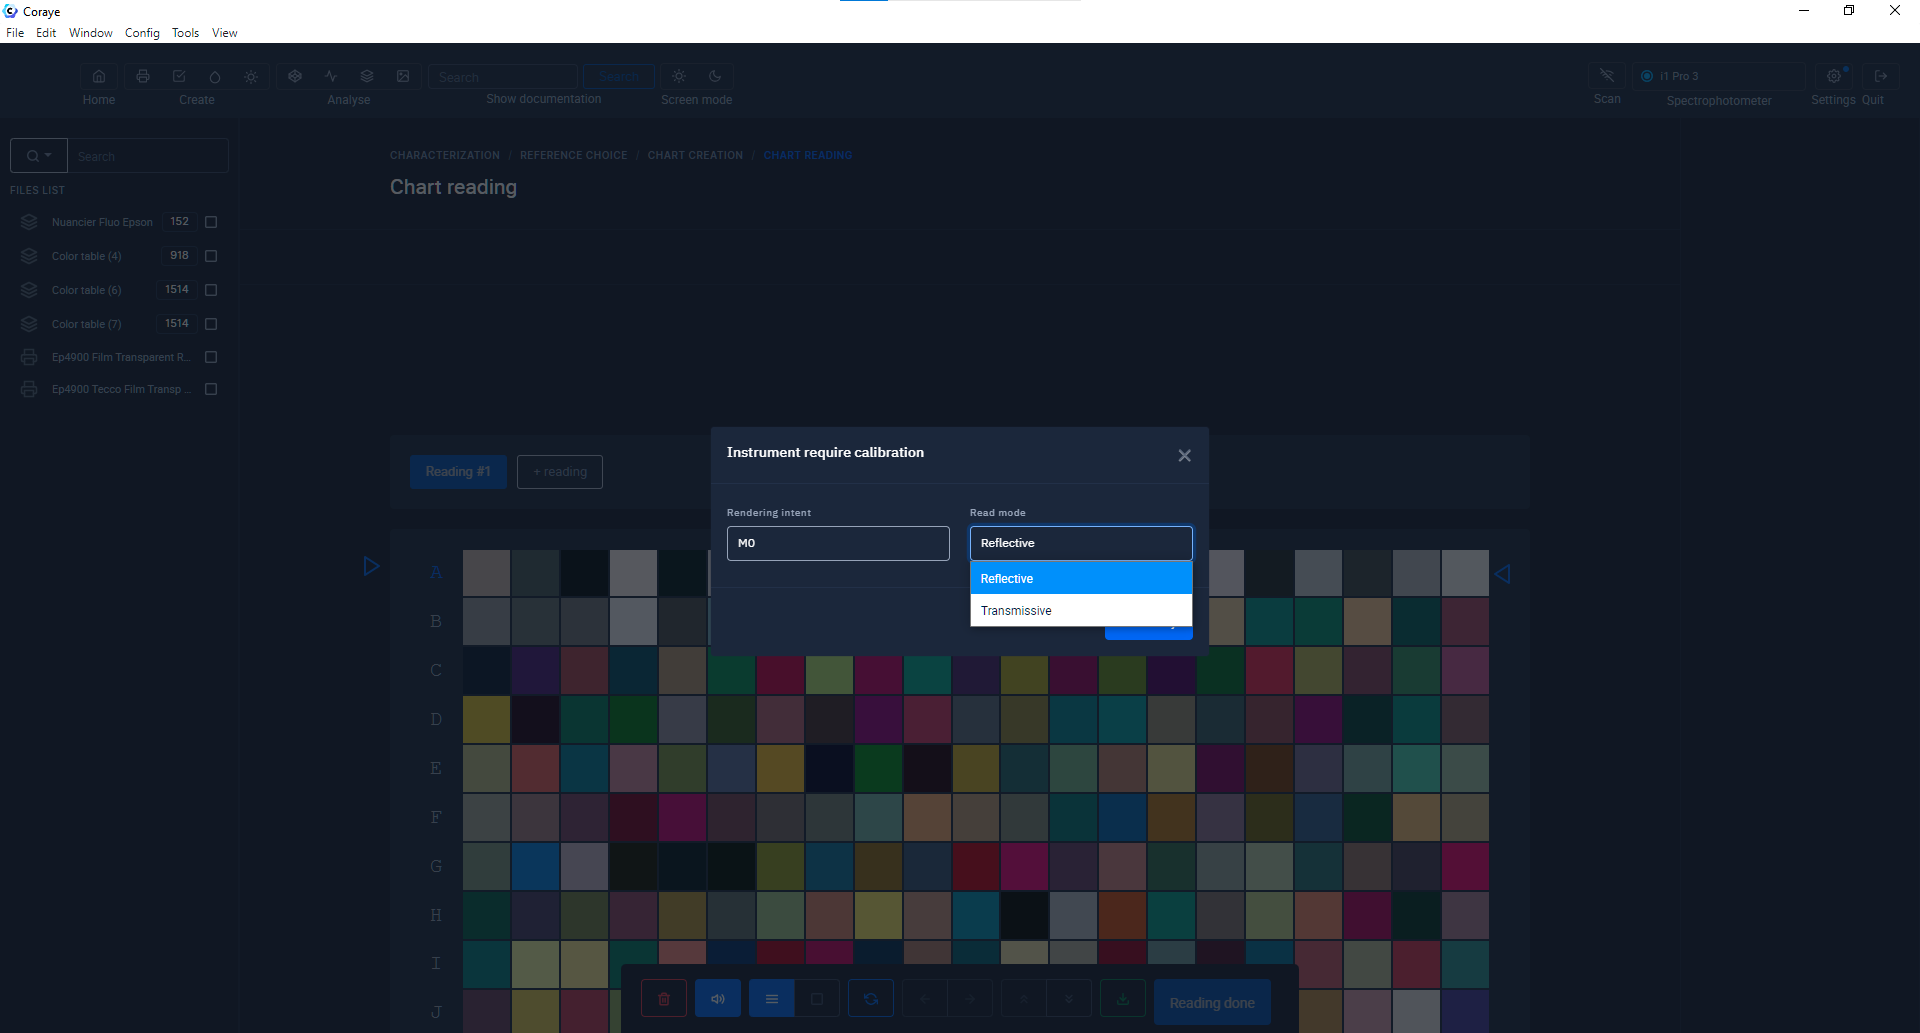
Select the measurement options, then click the " I'm ready " button.
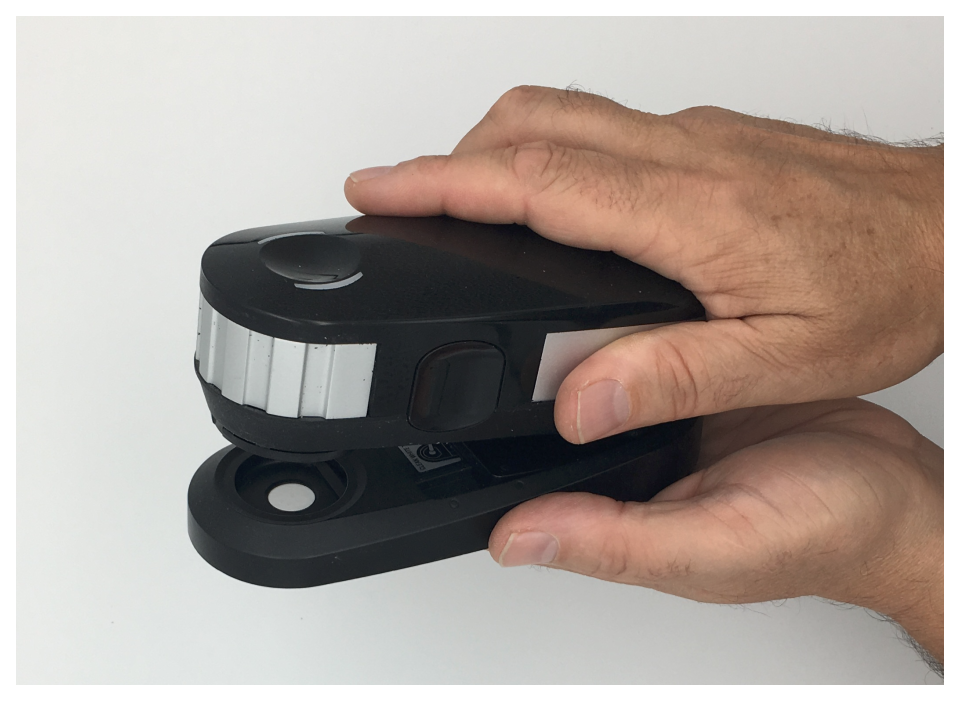
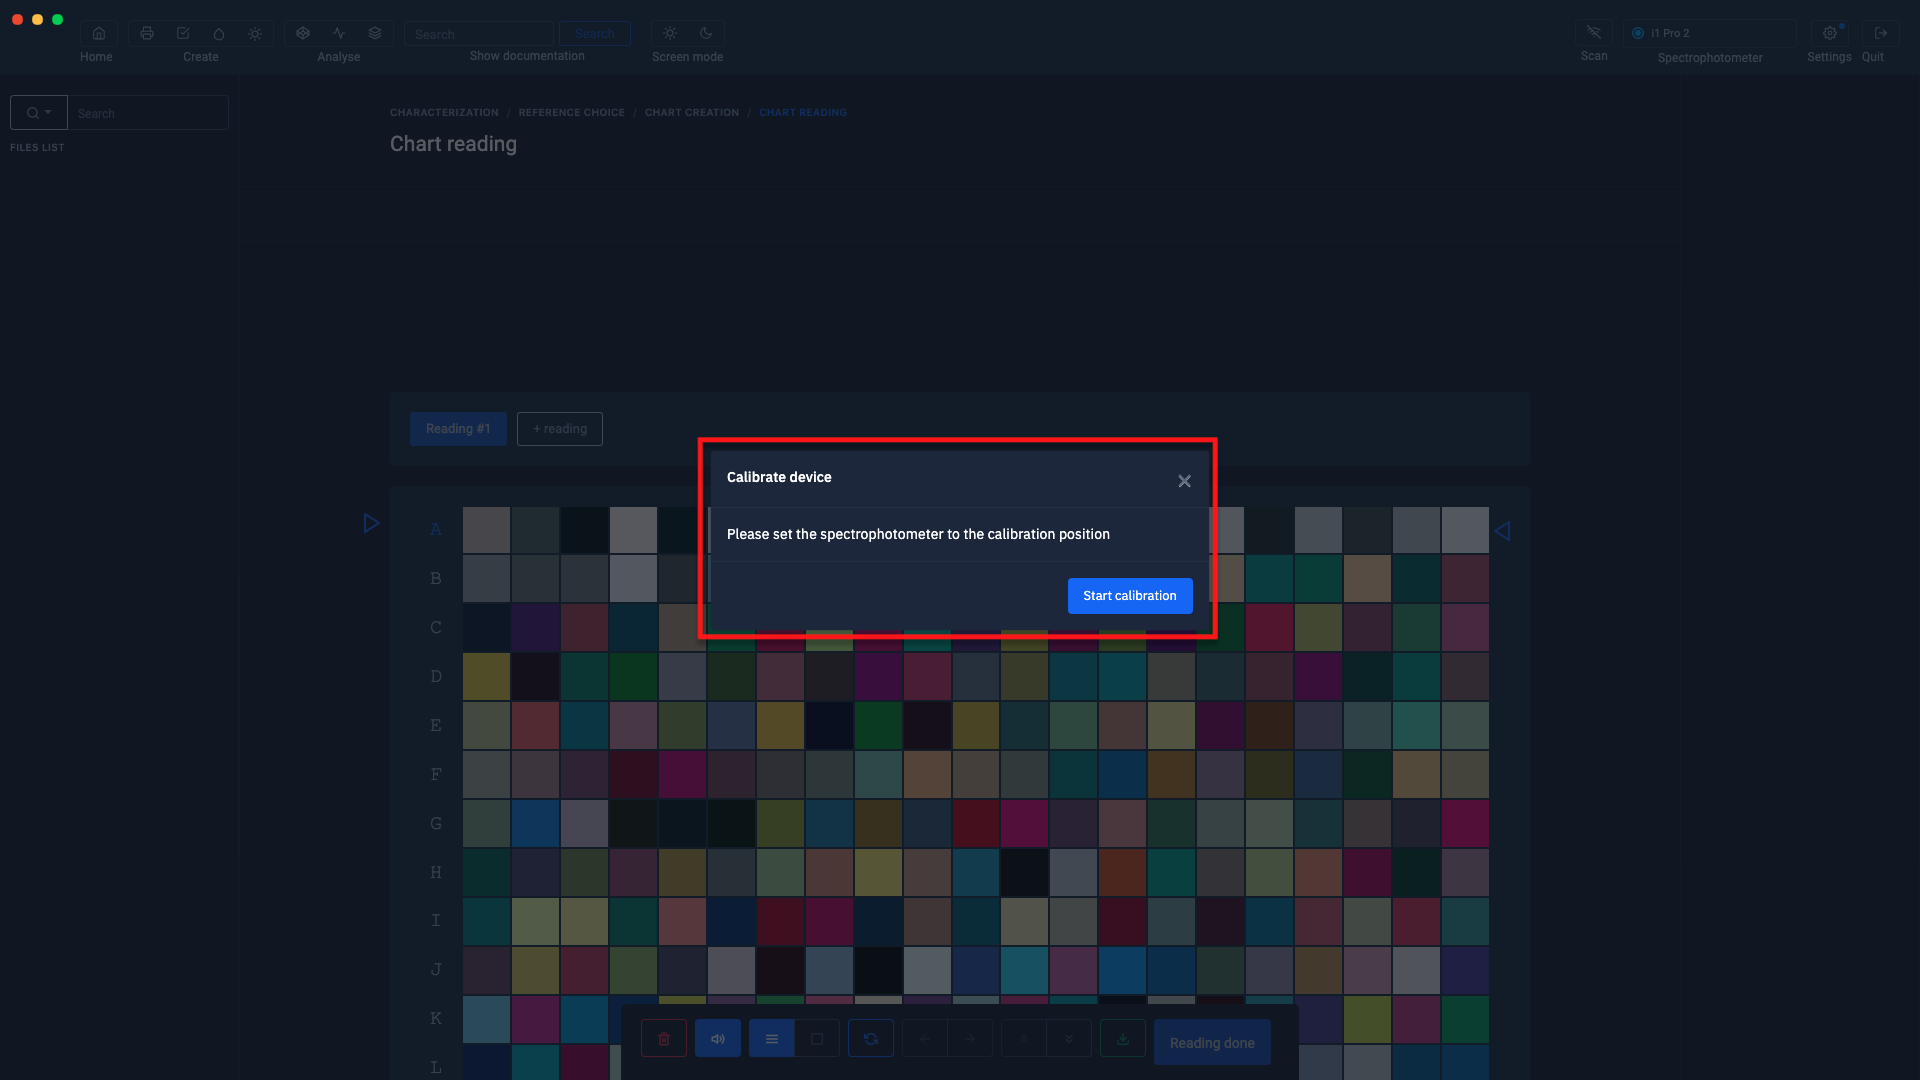
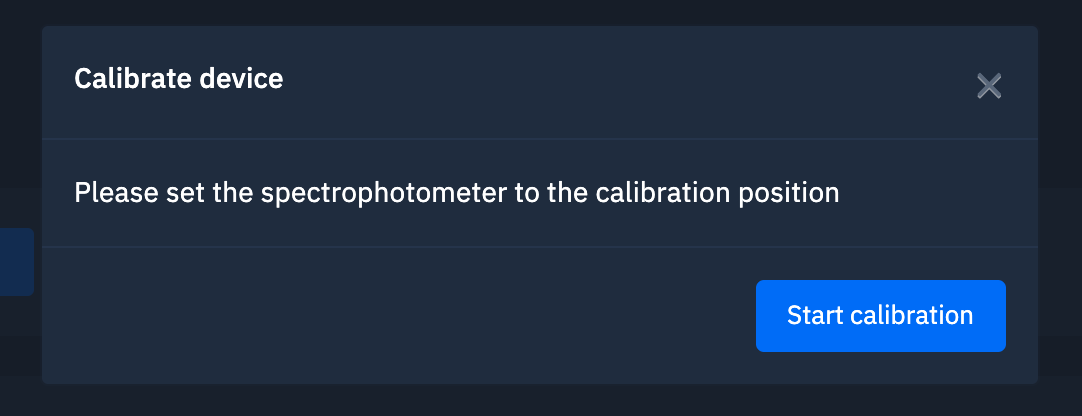
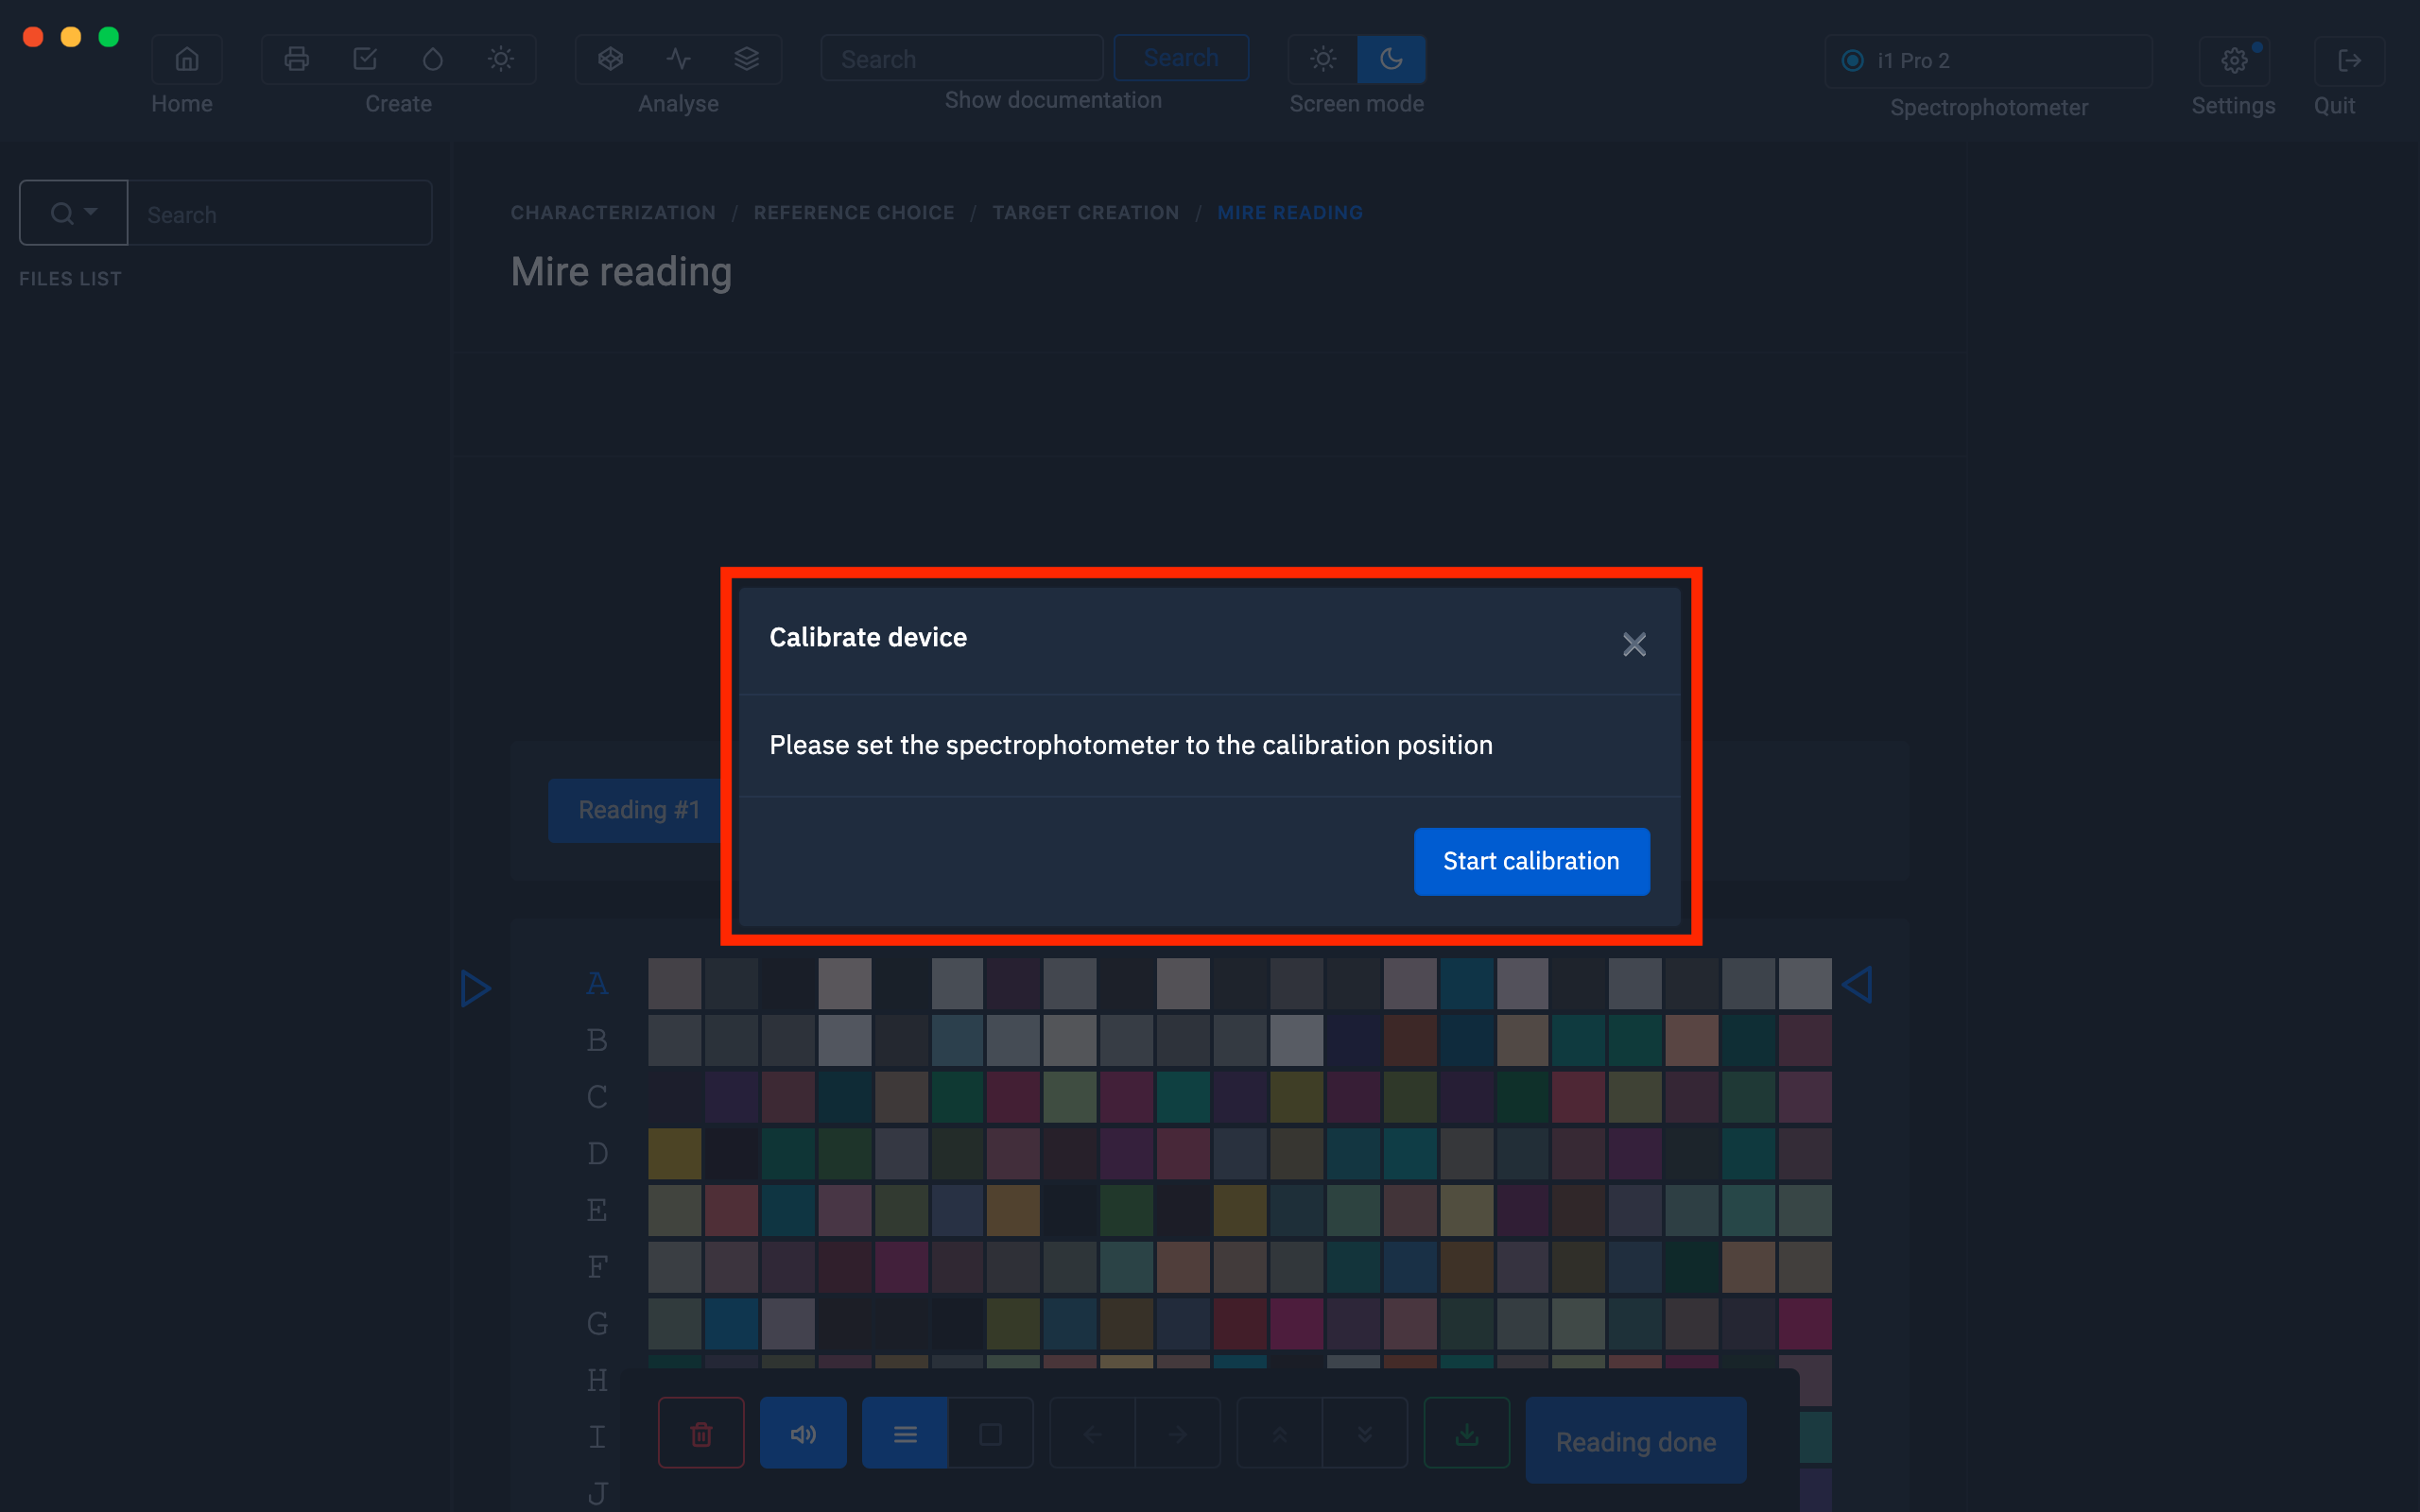
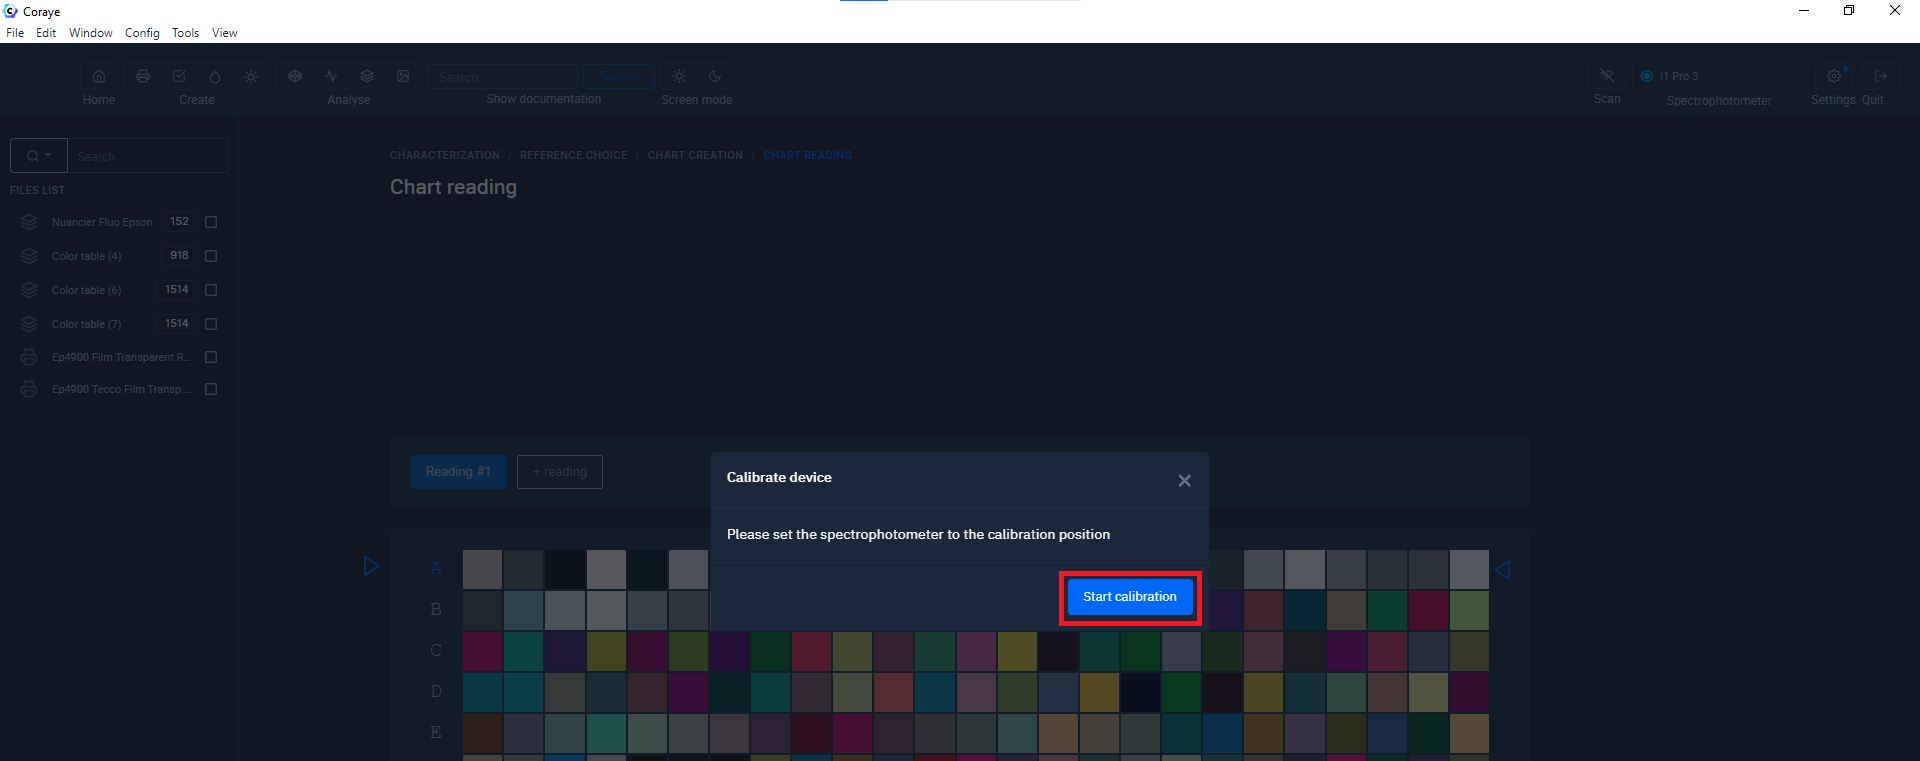
Position the spectrophotometer in its calibration position
Then click on the " Start calibration " button.
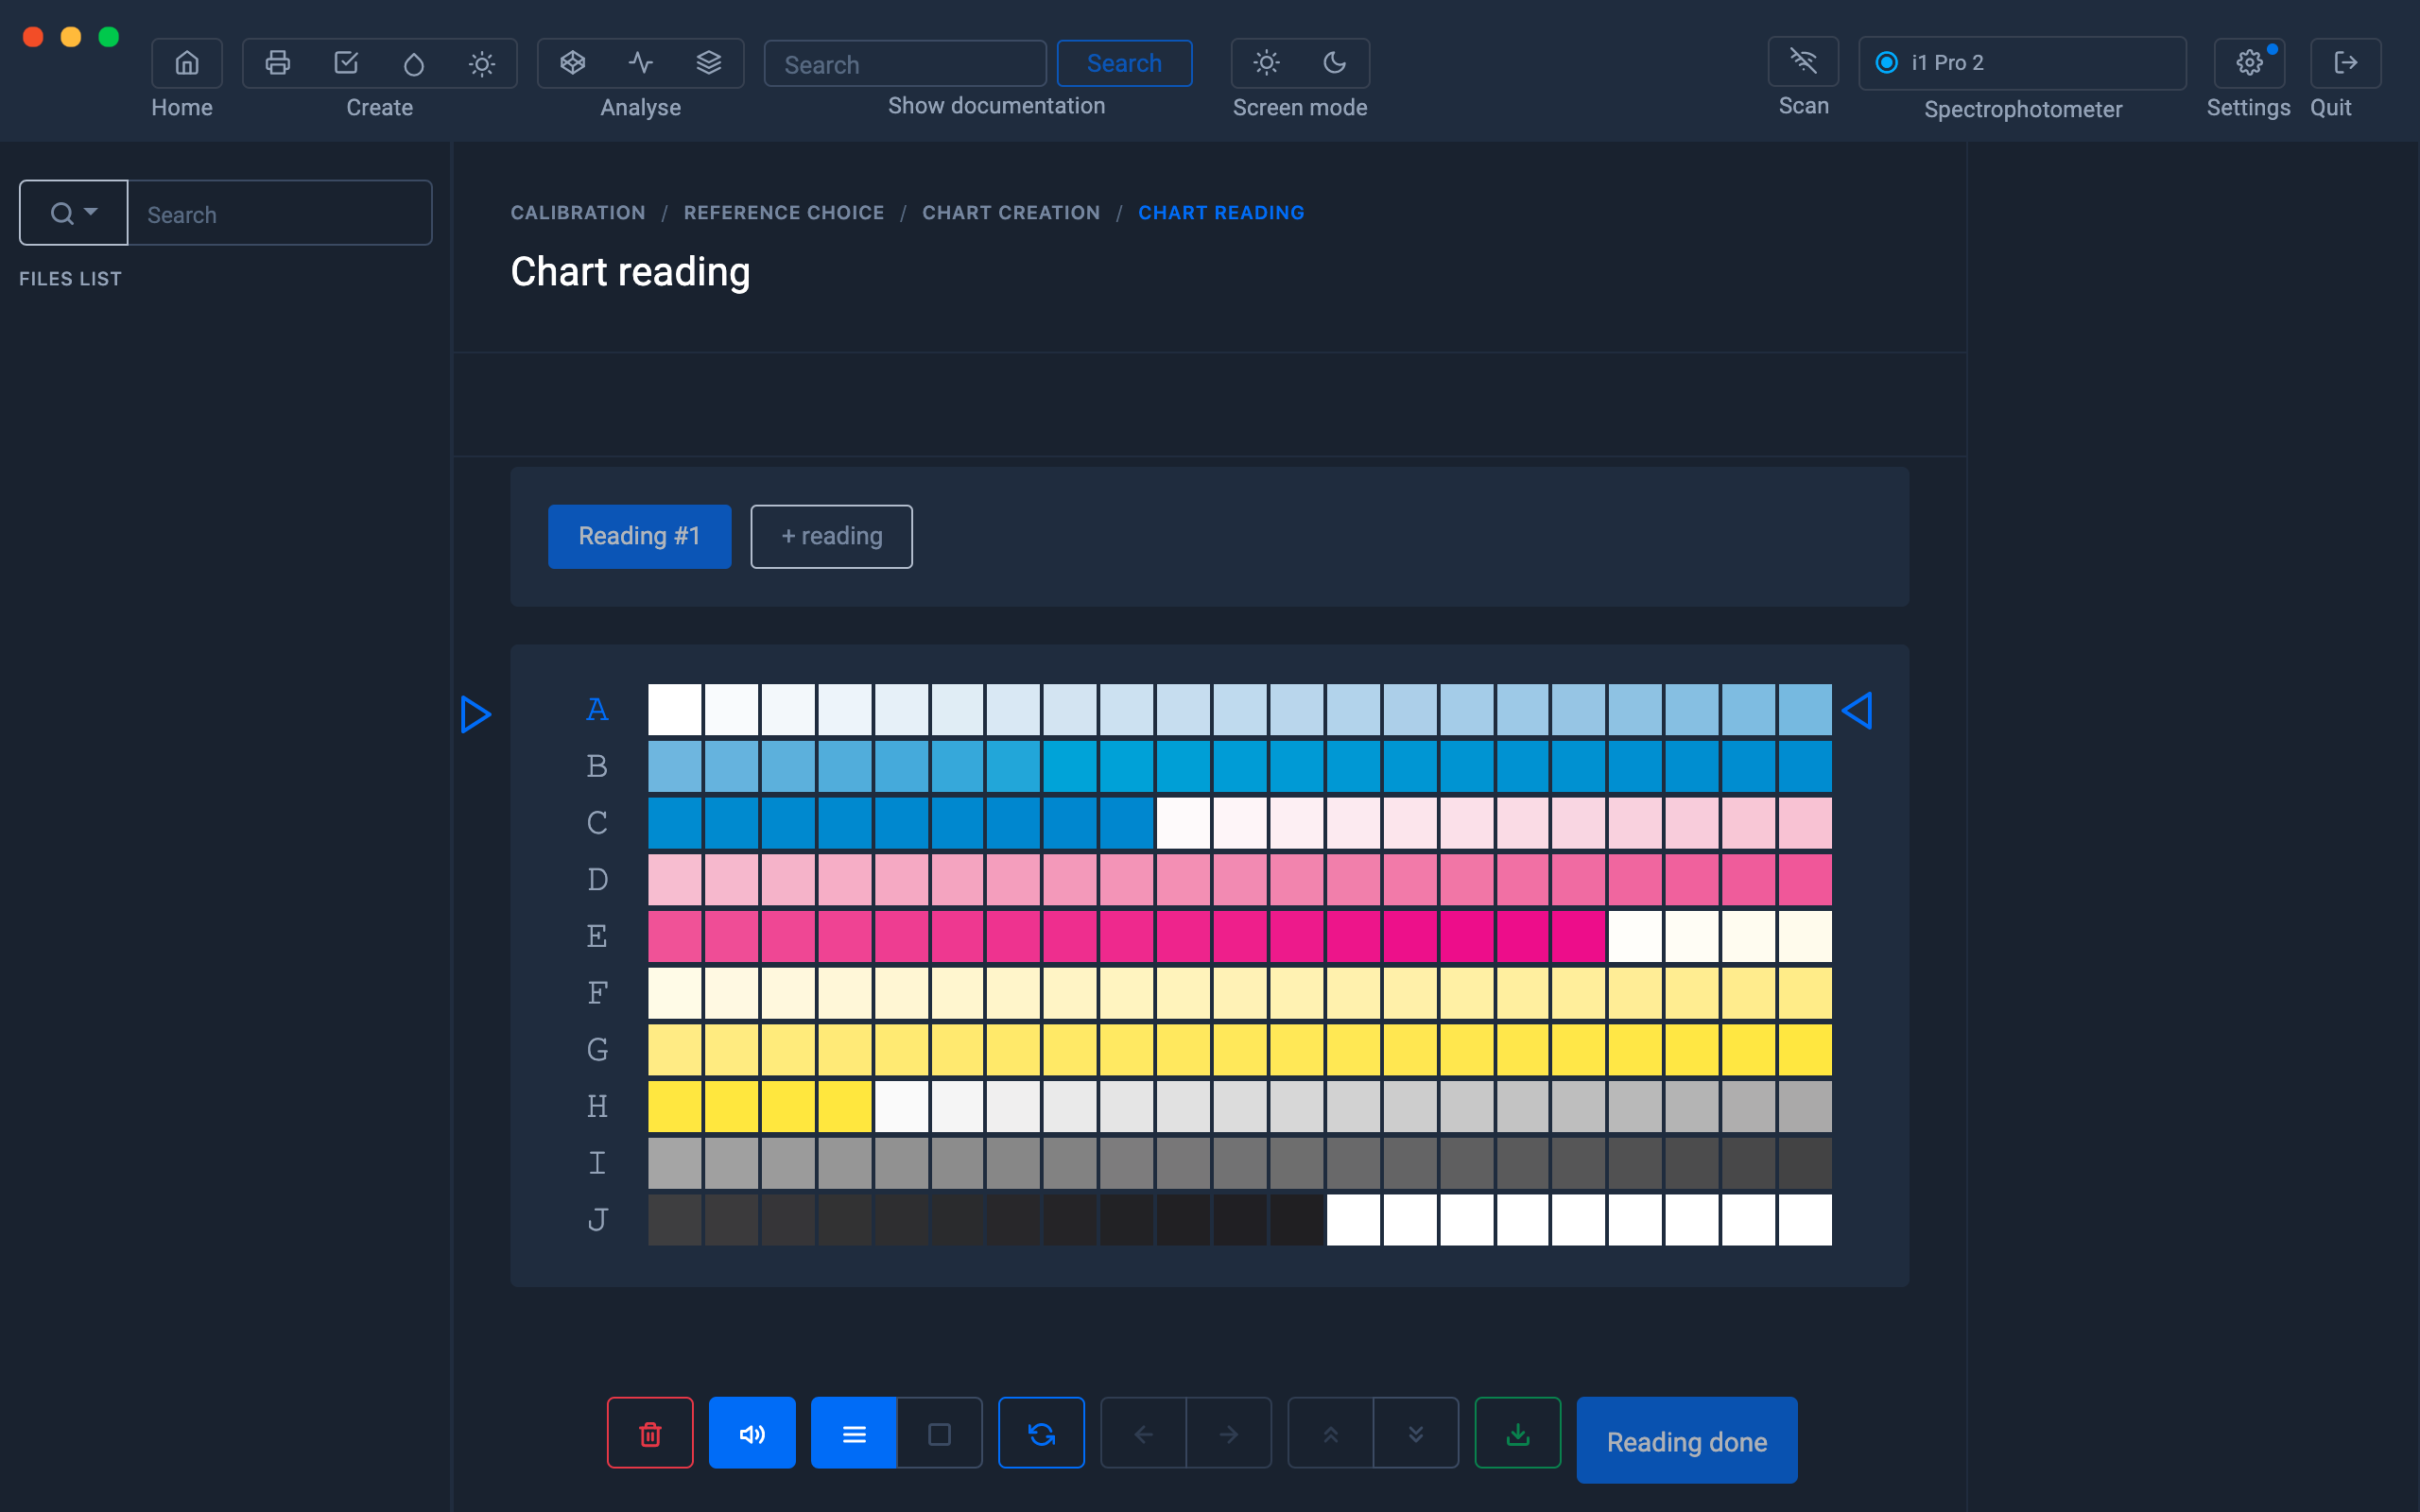
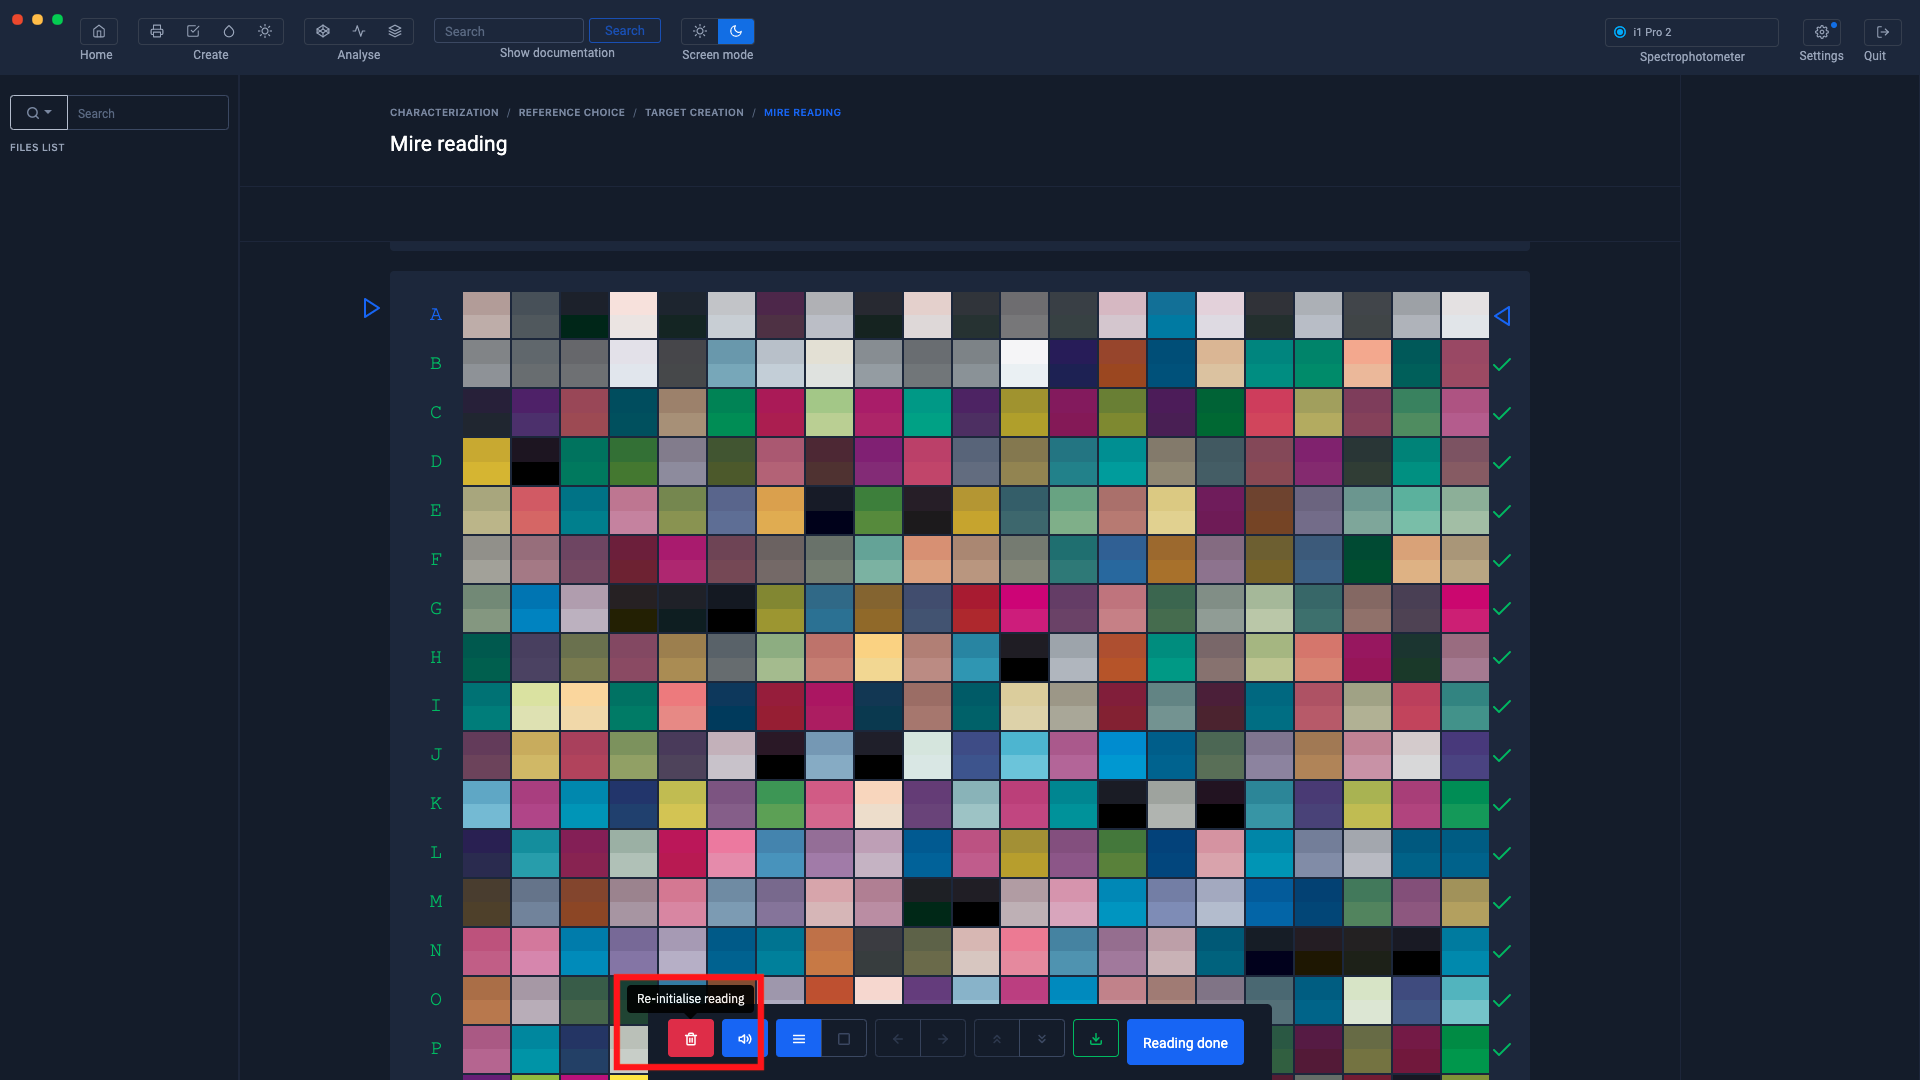
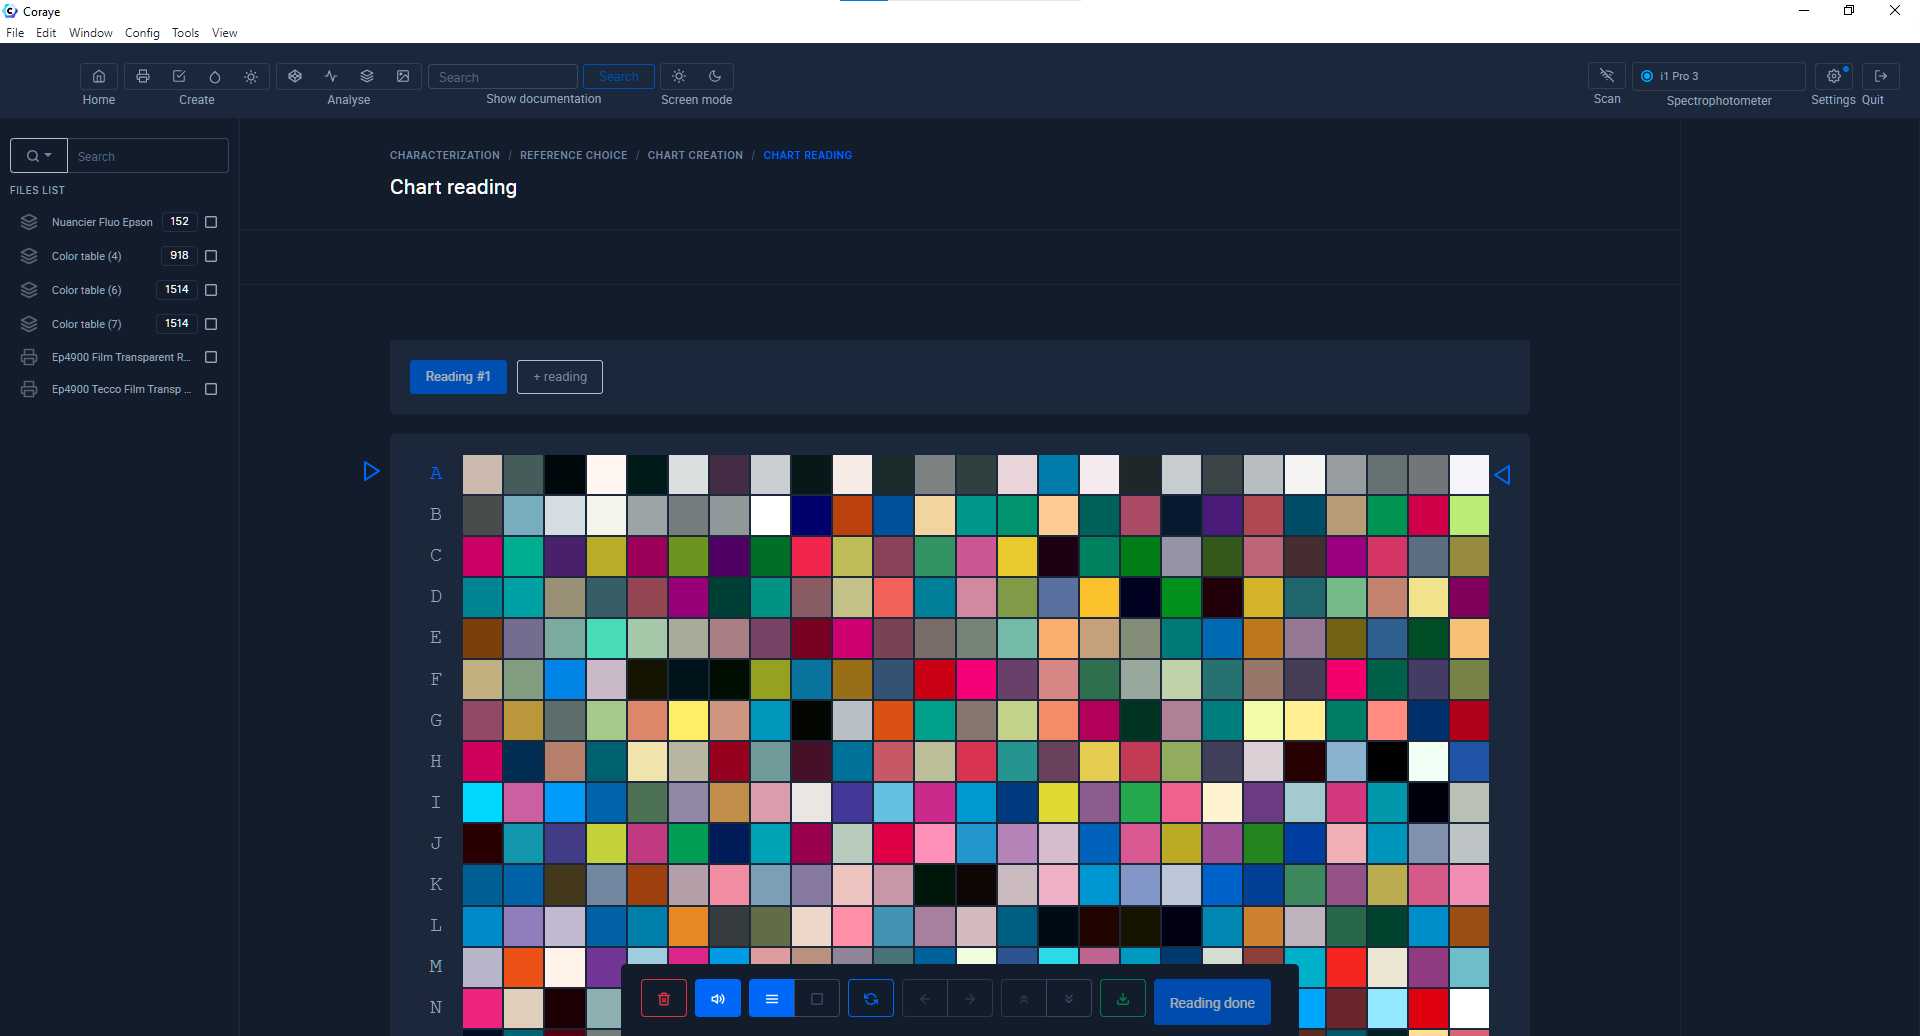
Perform the range measurement
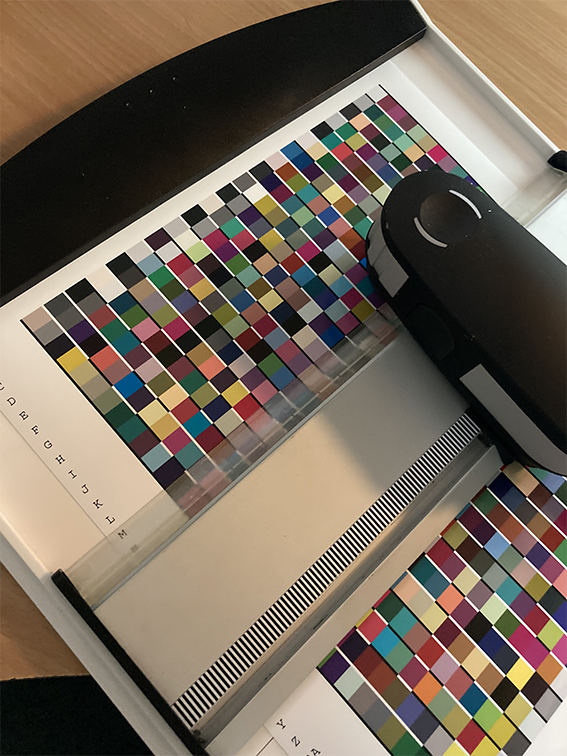
Tape playback begins from the blank of the paper on the right of the letter and ends on the blank on the opposite side.
The measurement starts with line "A", Measure the line corresponding to the line selected on your screen.
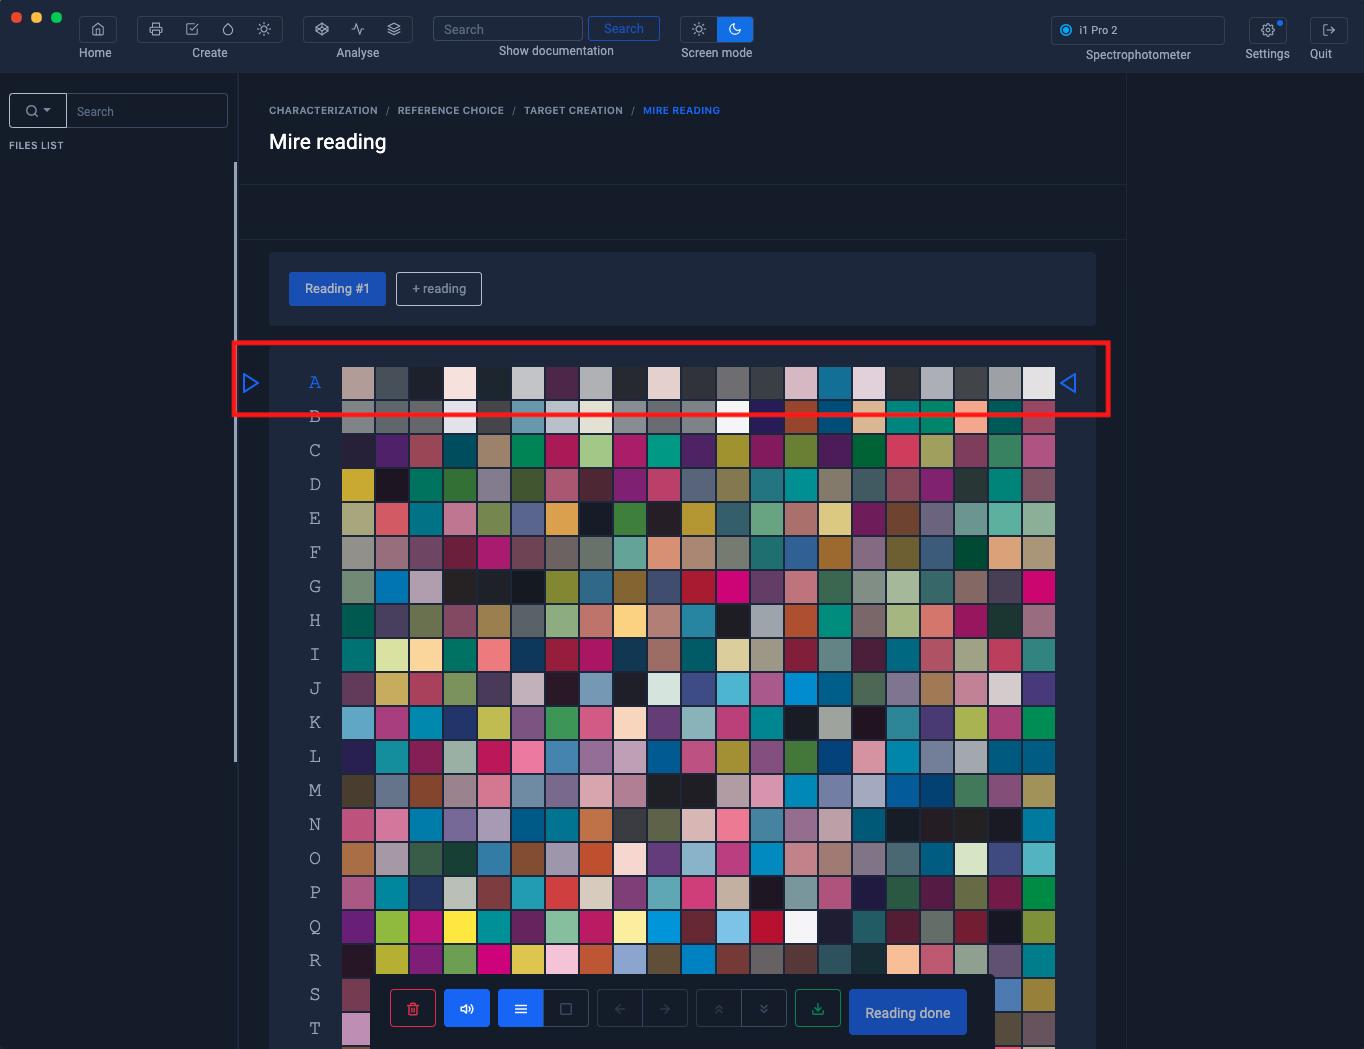
When you have read a line, Coraye will make you read the next unread line.
You can visually check whether there is any error when measuring the line, by comparing the top and bottom color of the measured patches.
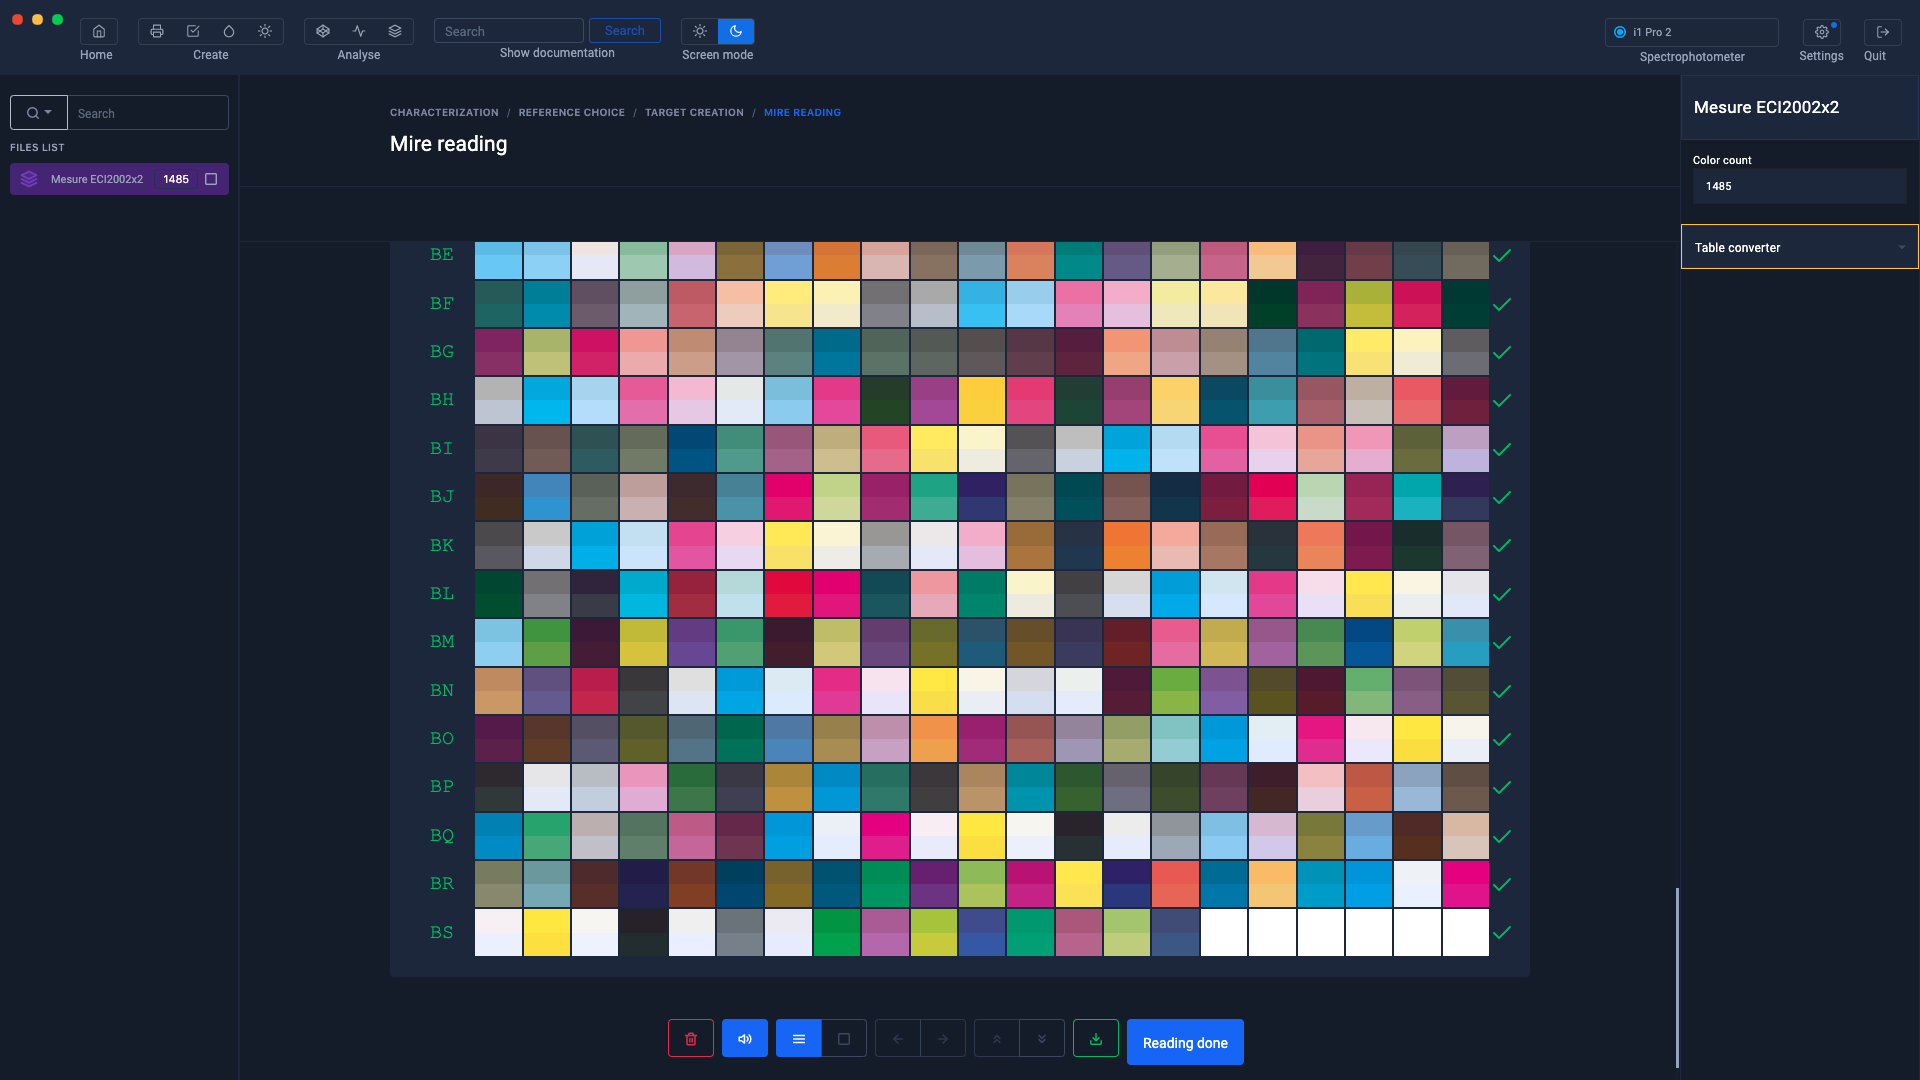
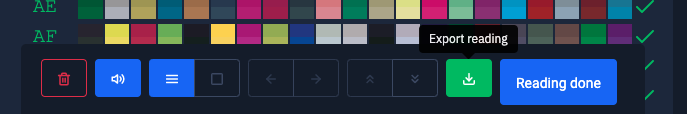
Saving the measurement
To save the measurement in the form of a .table file, click on the green " Export reading " button located at the bottom of the window.
This will be added to the files in the left column.
When the range measurement is complete, click on the " Reading complete " button
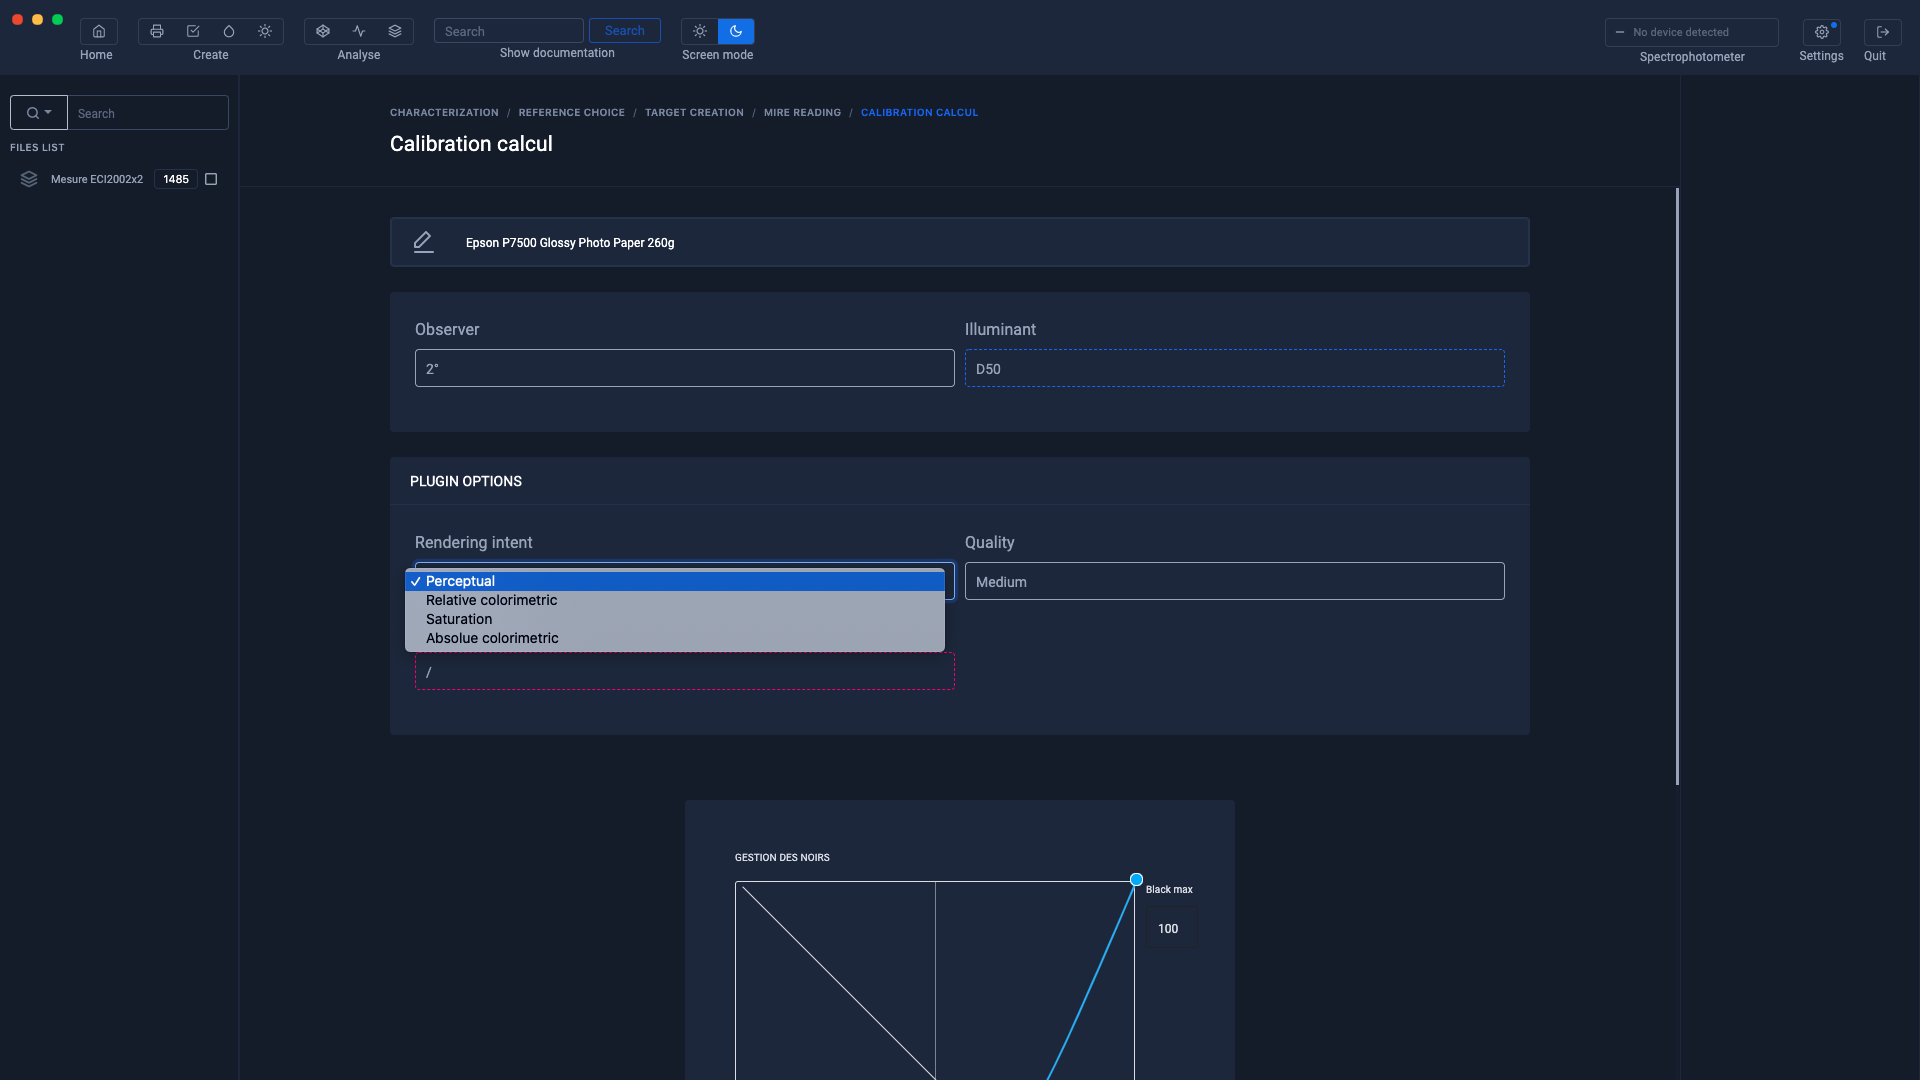
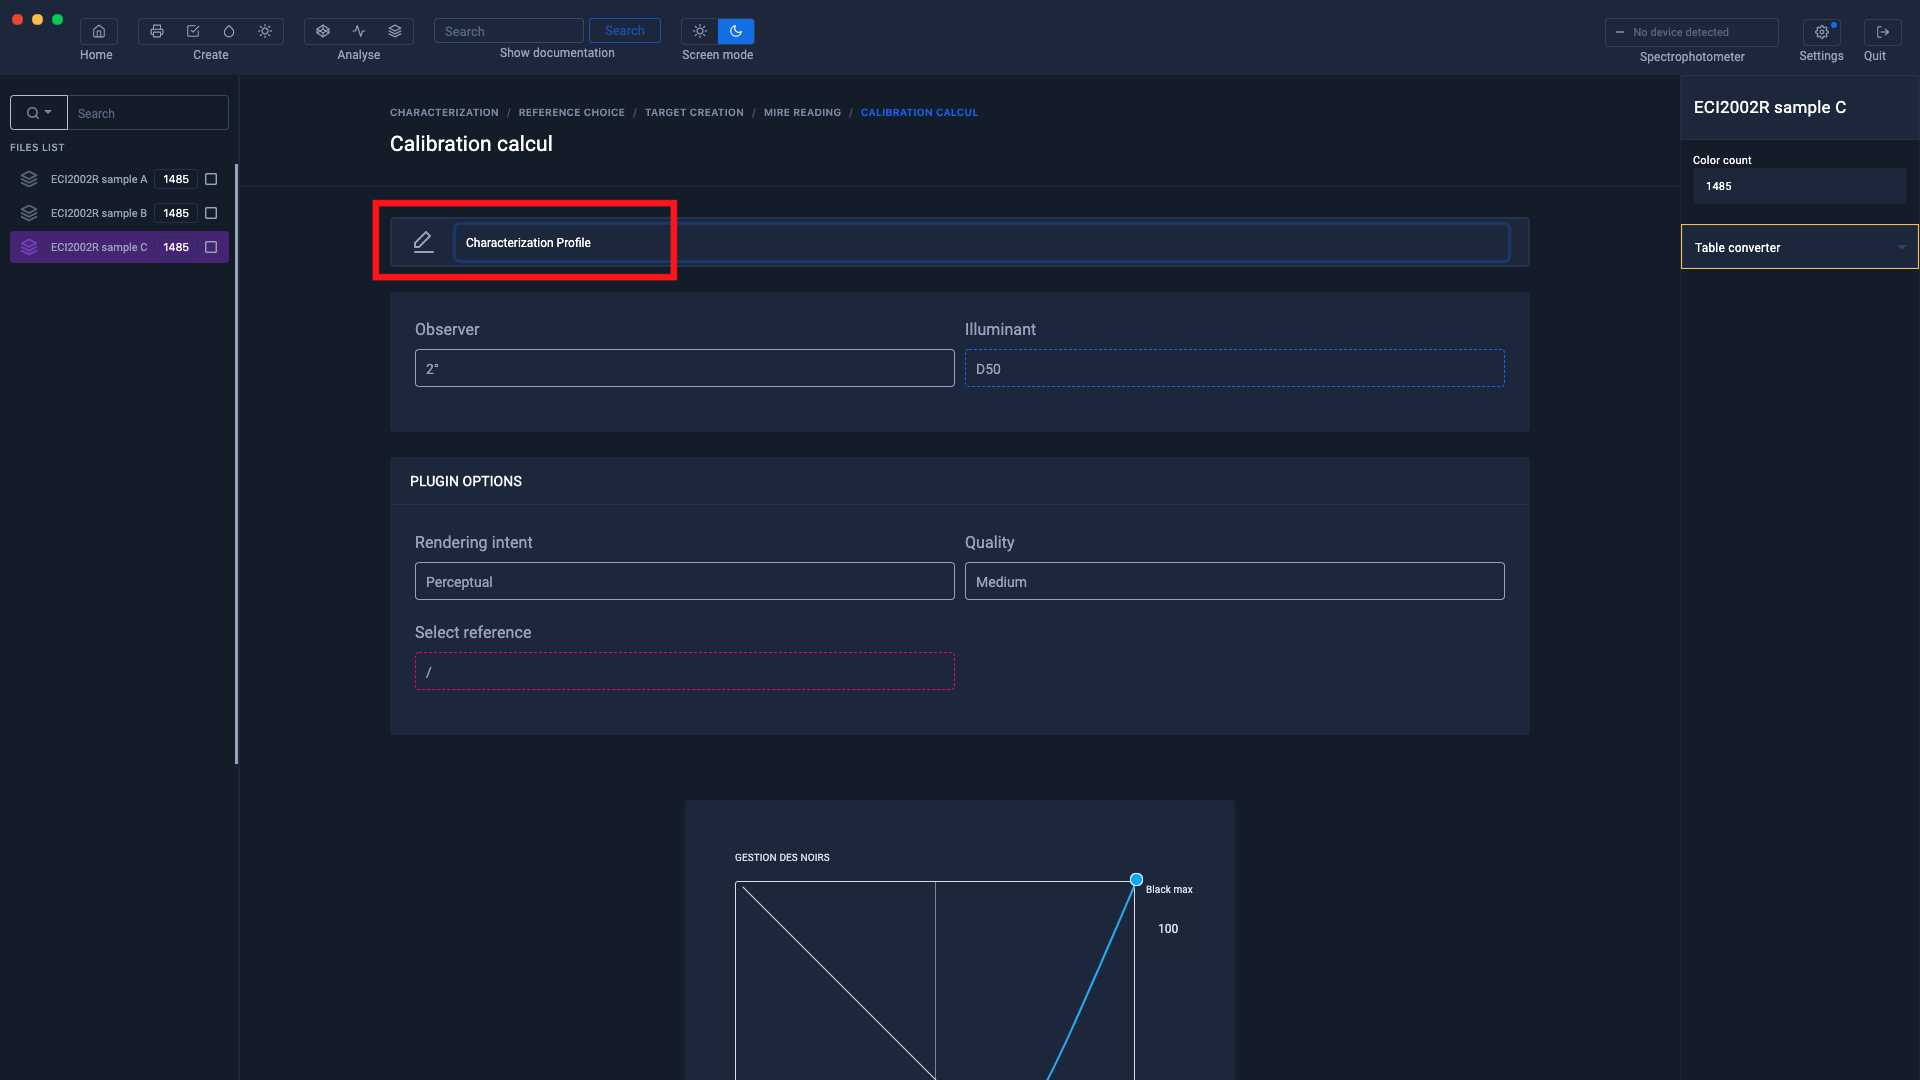
Parameters for creating the icc profile
Before calculating the profile, you can choose some options:
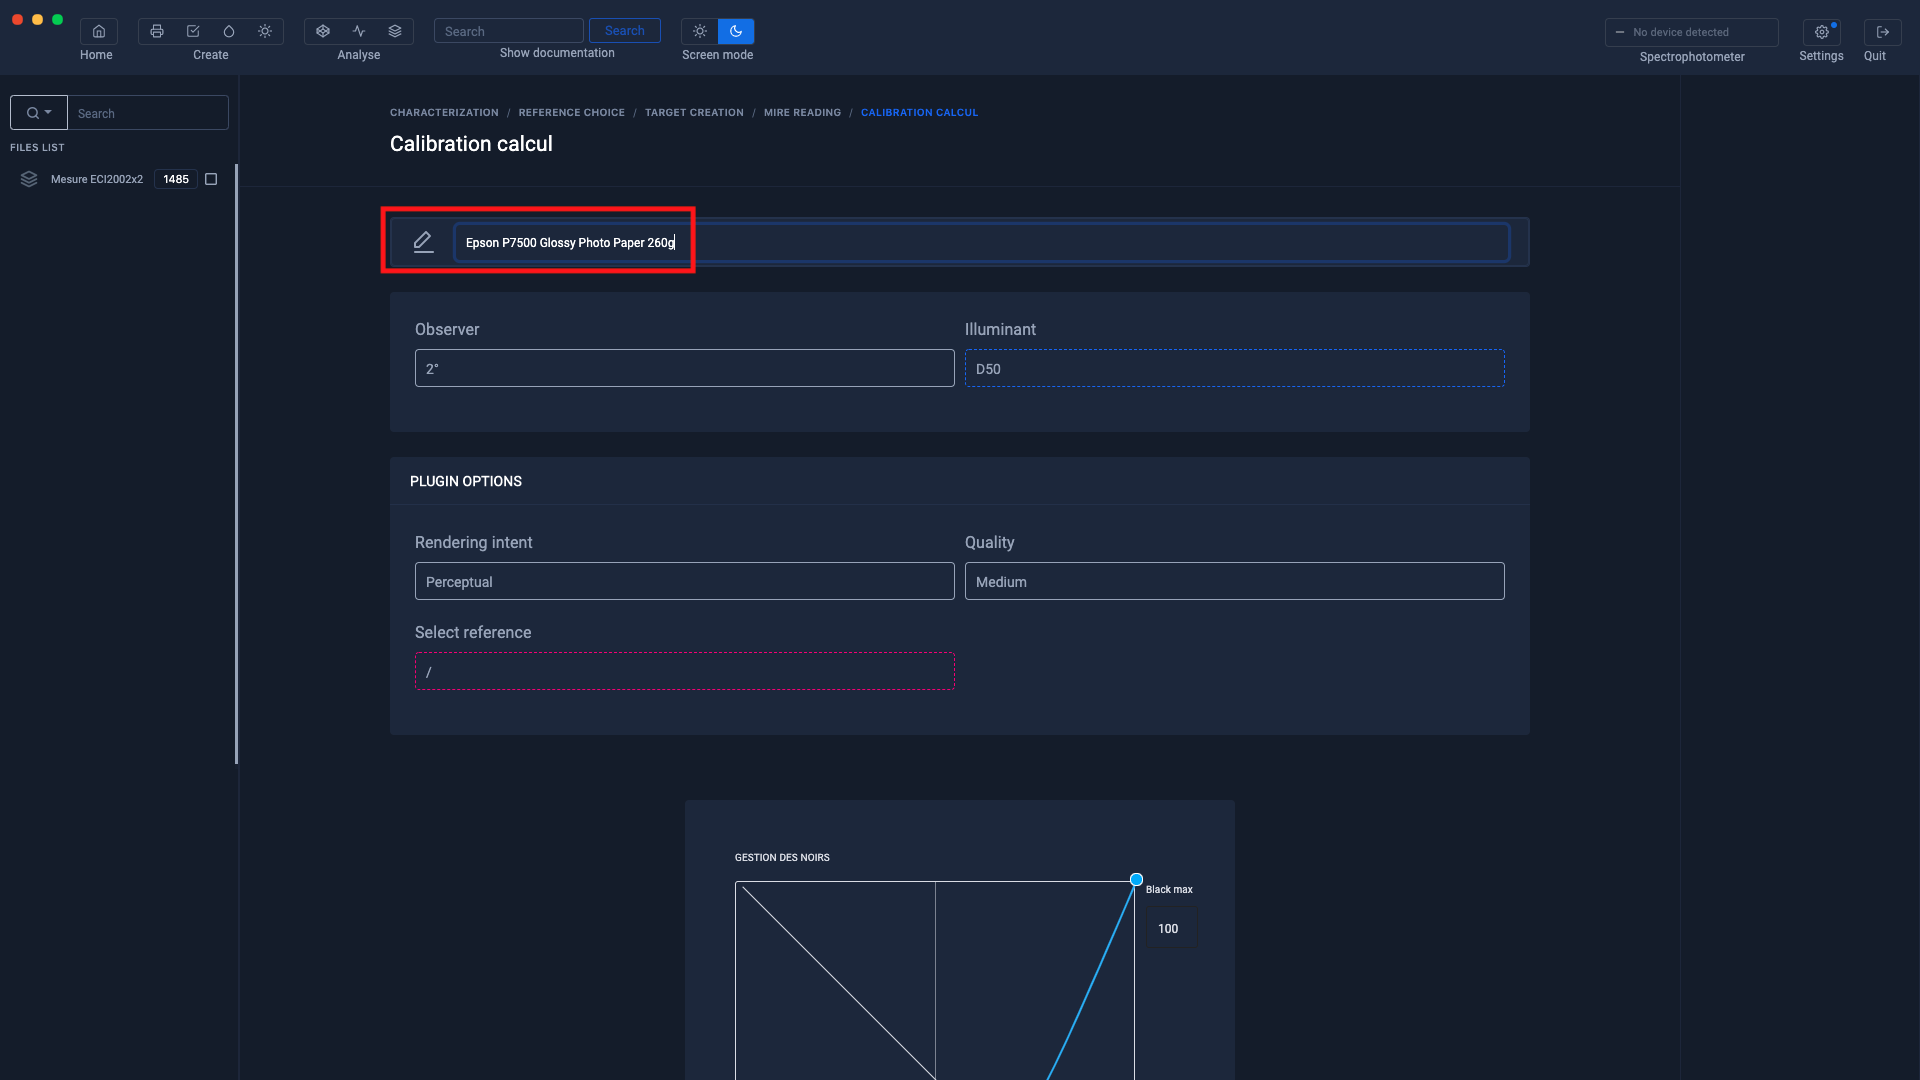
Reference illuminant

Observe
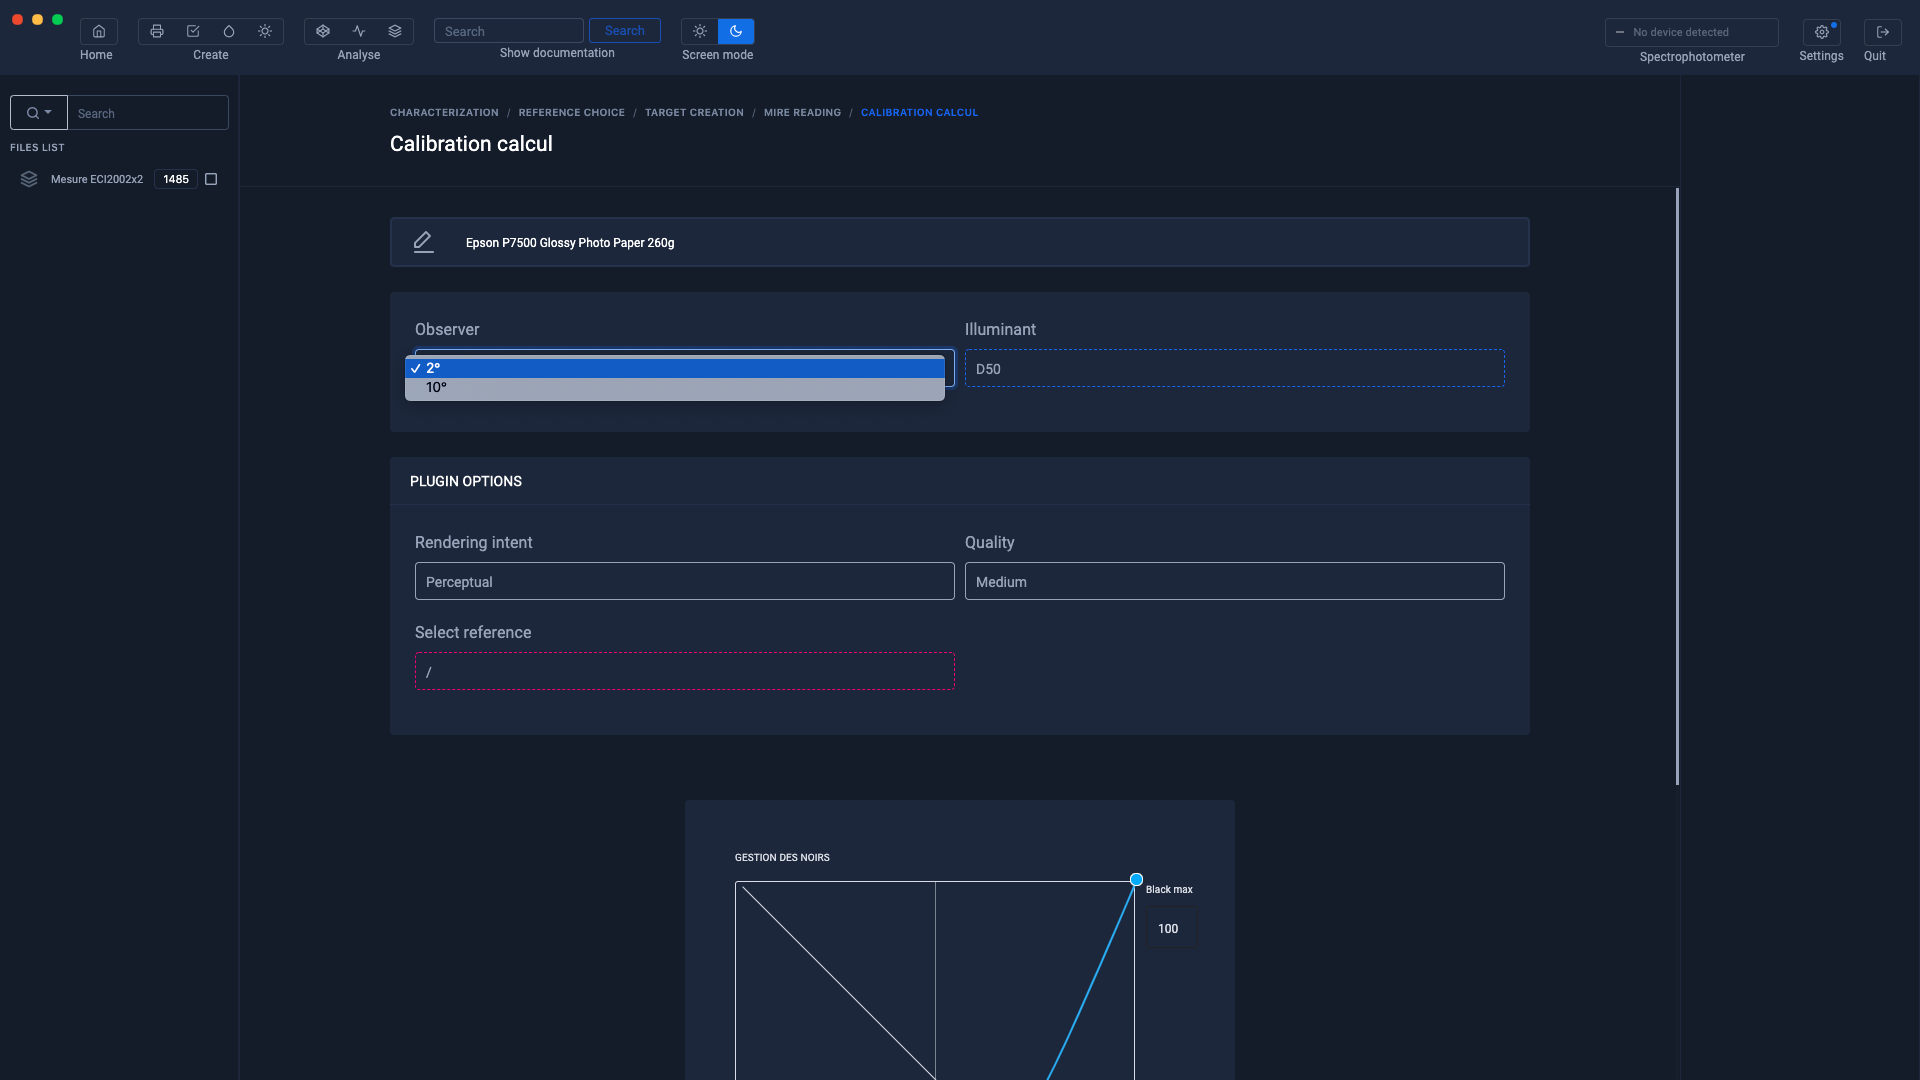
Default calculation mode
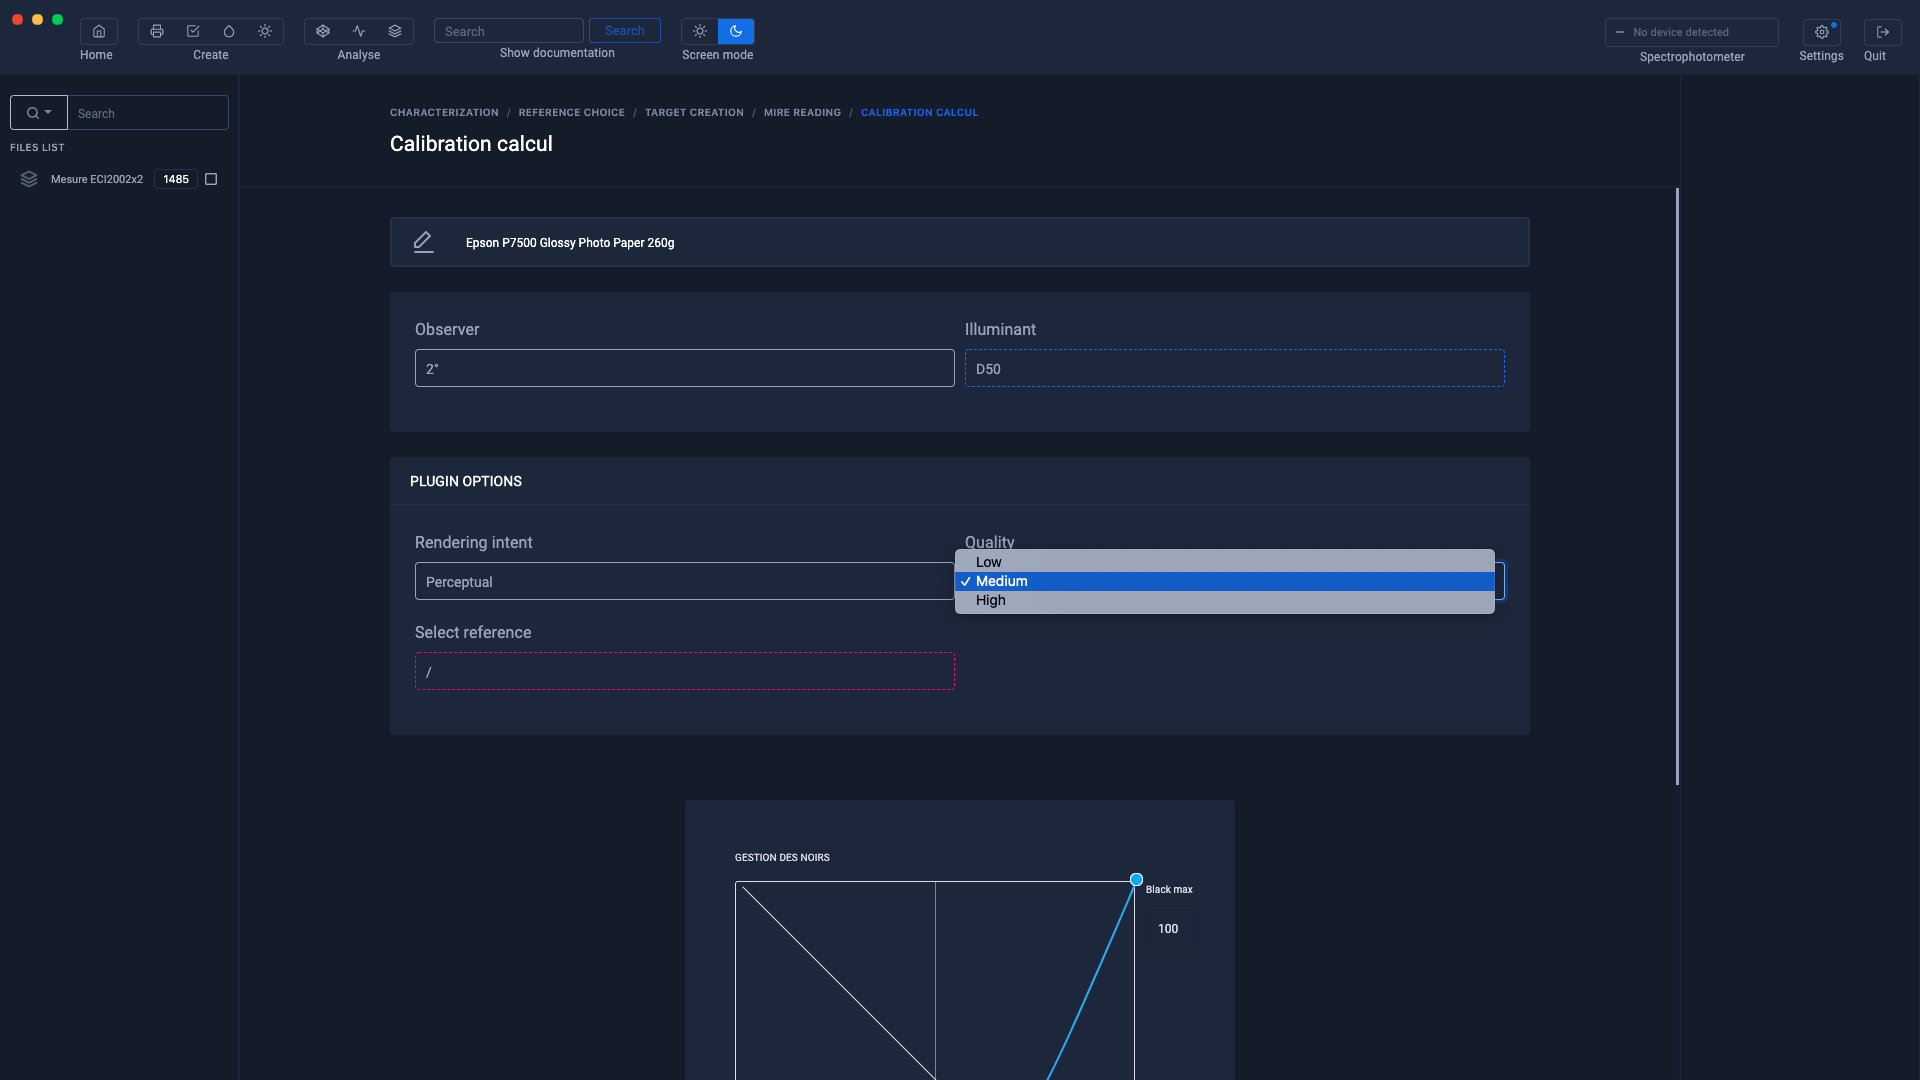
Profile quality We advise you to stay on the " Medium " quality
Reference profile
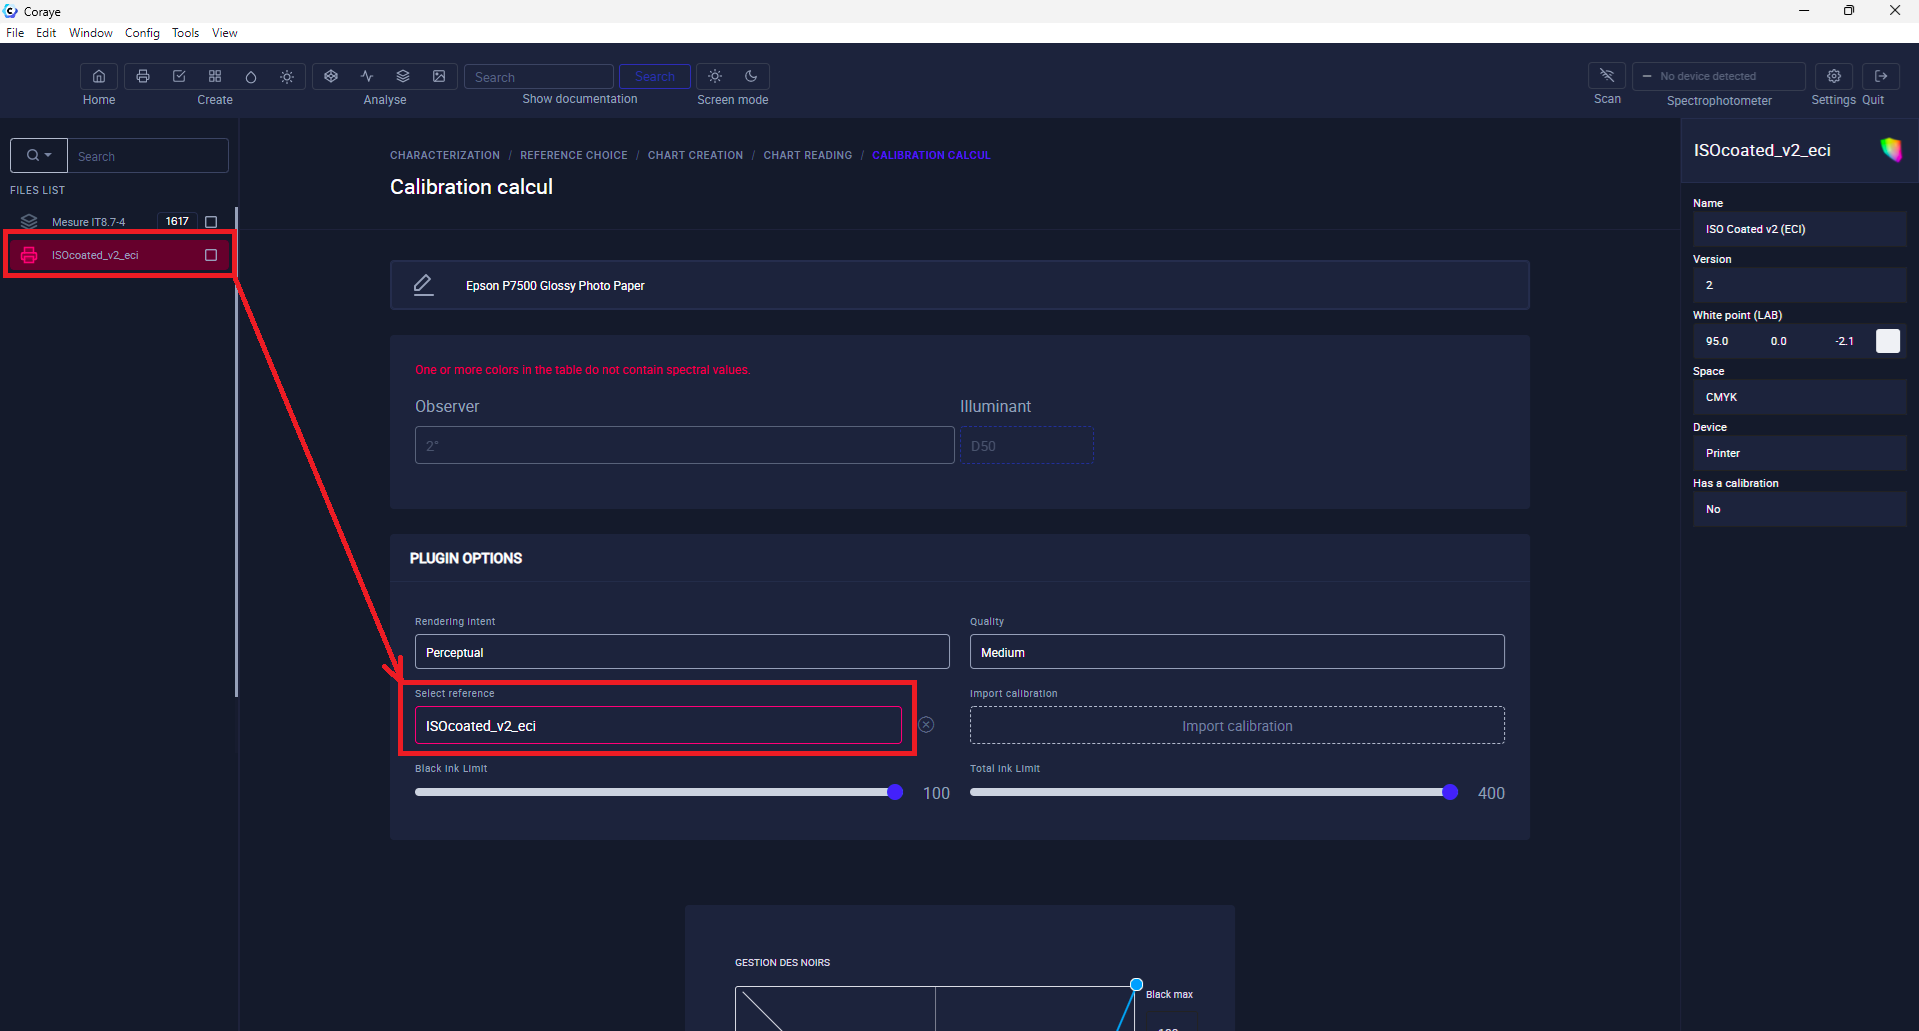
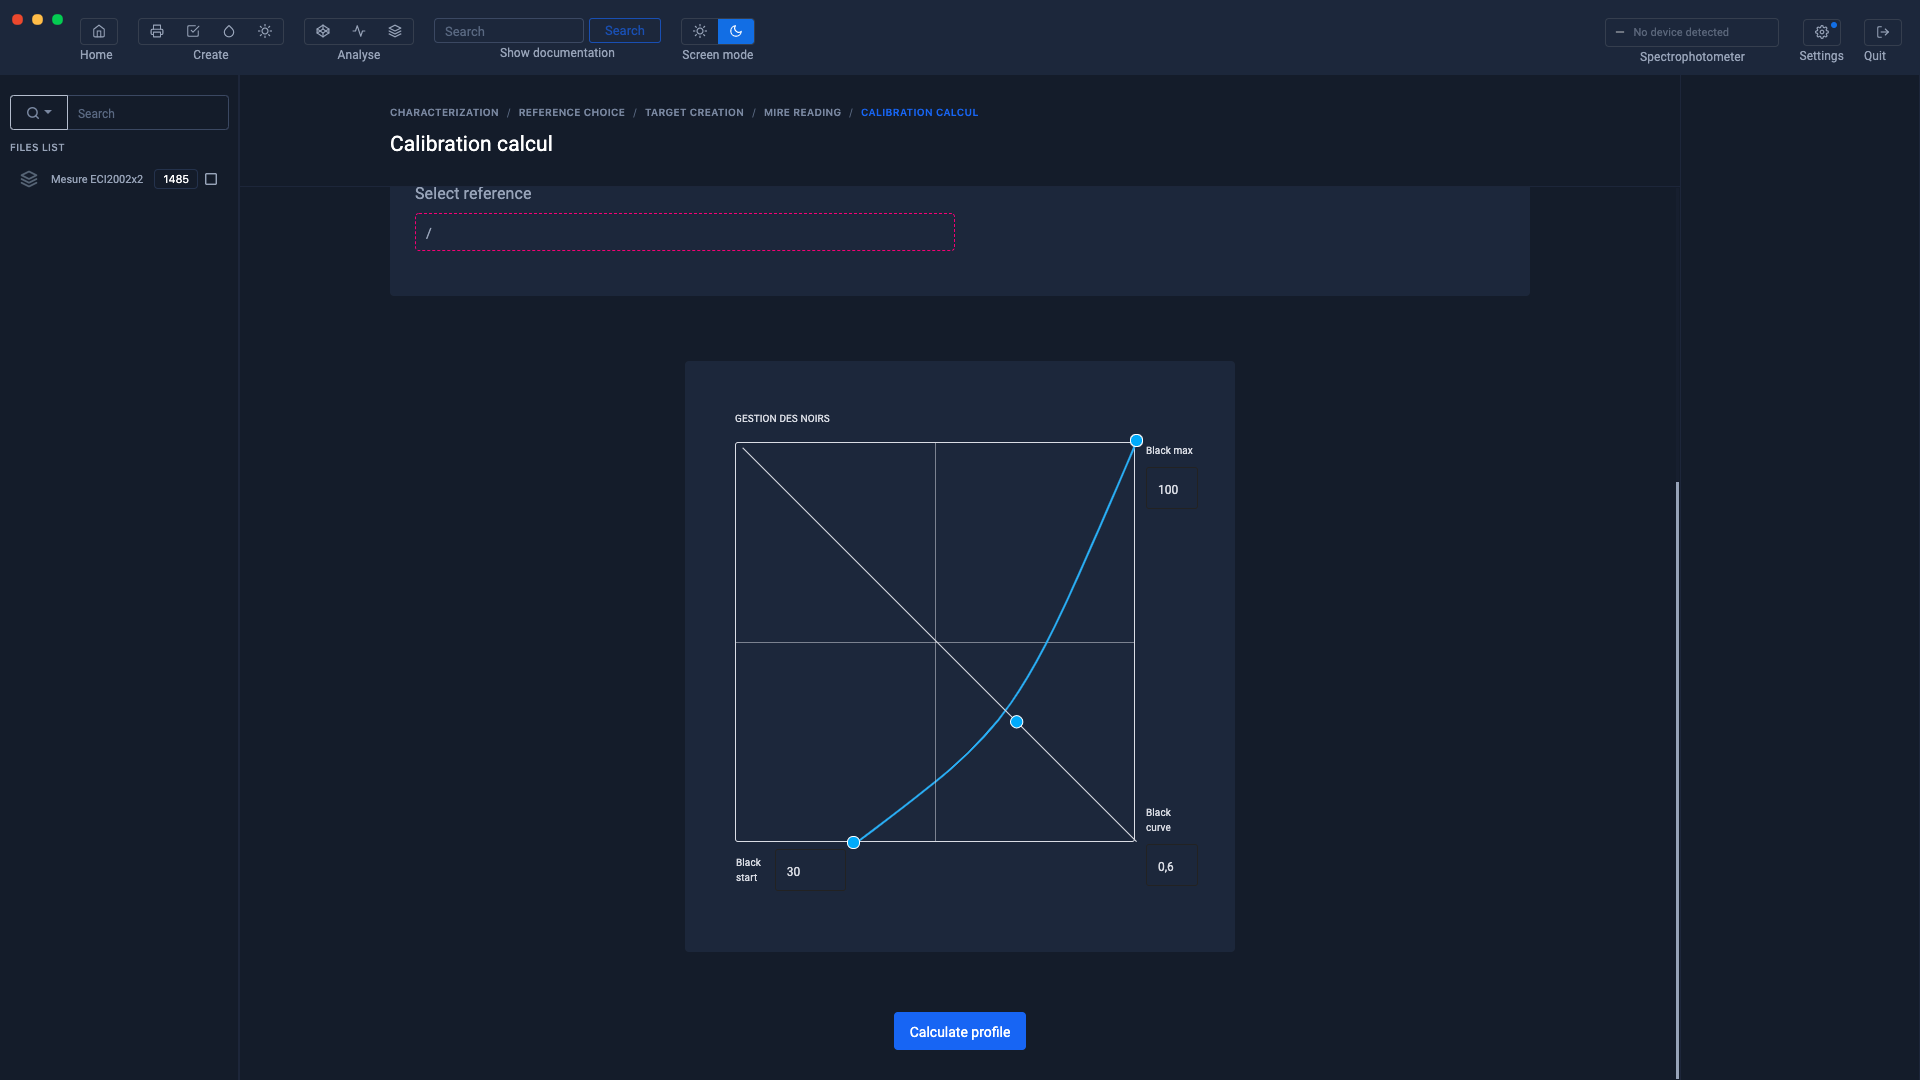
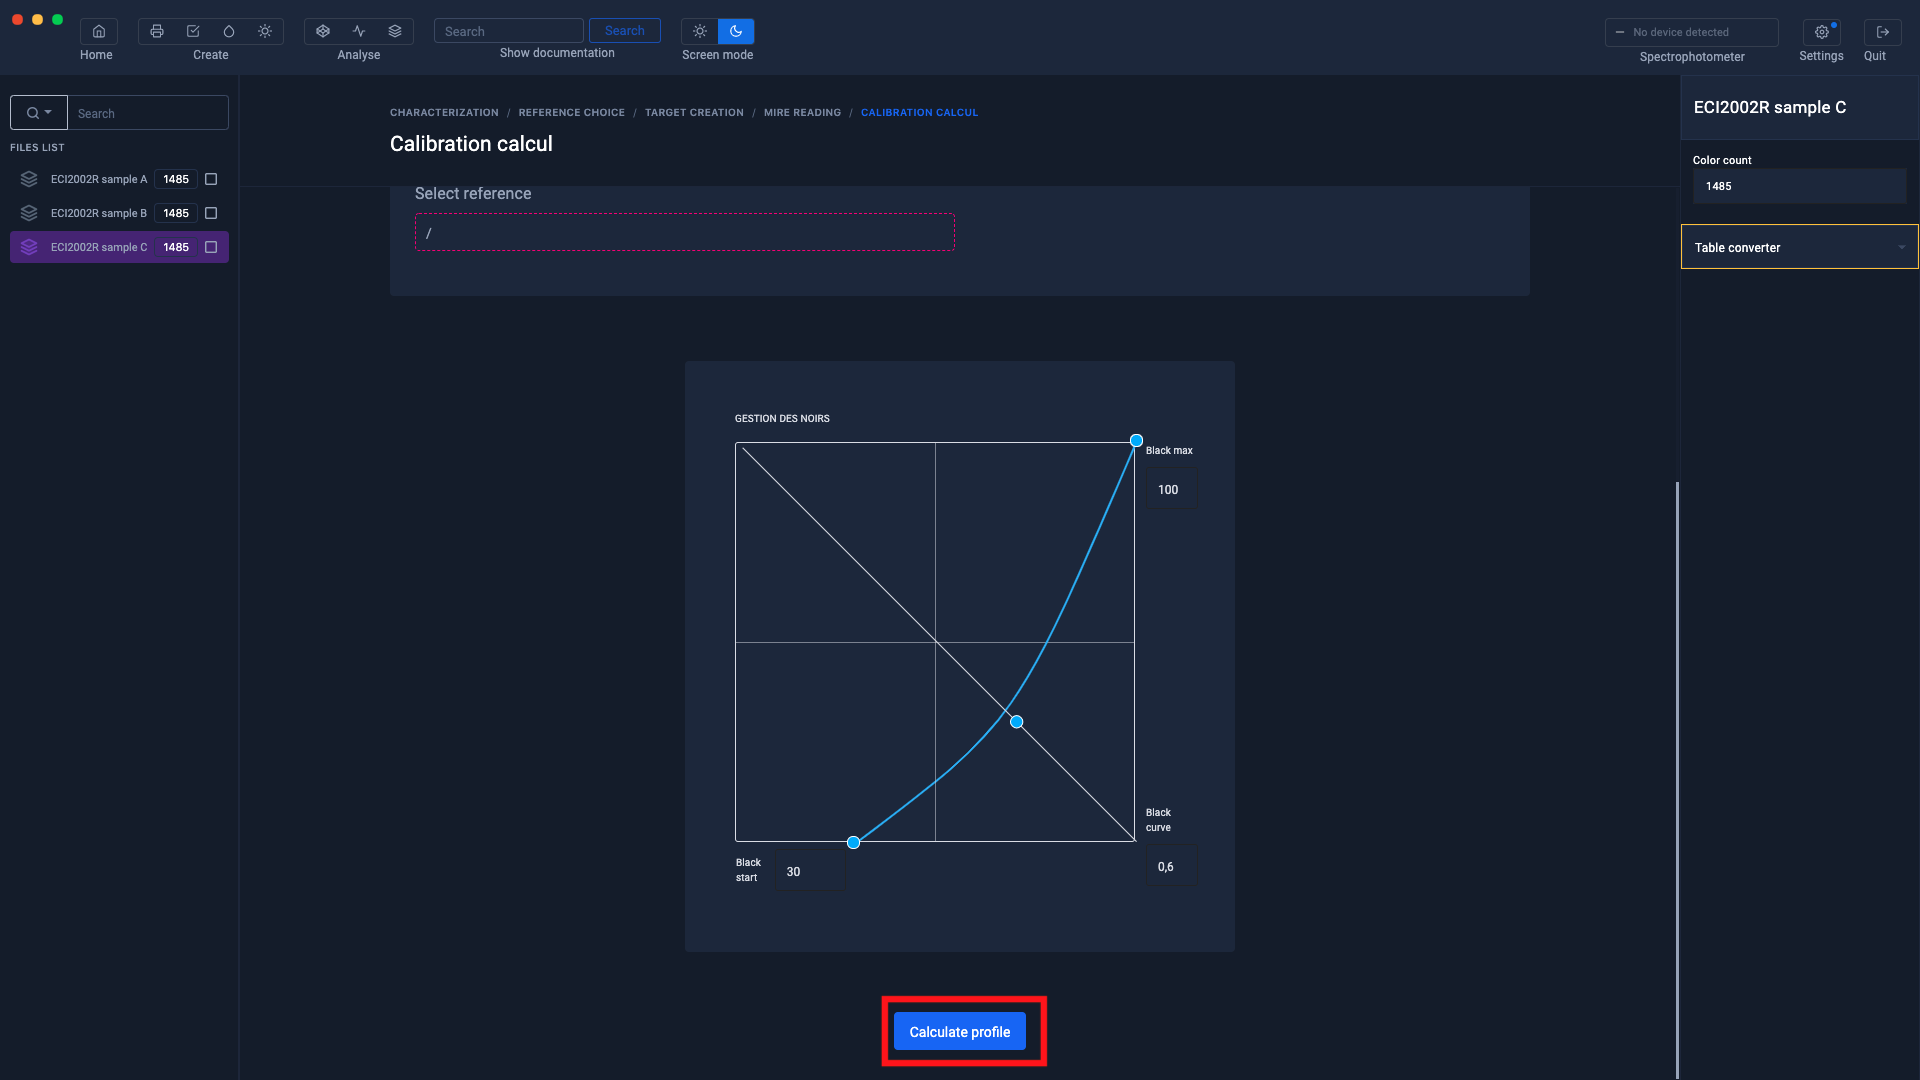
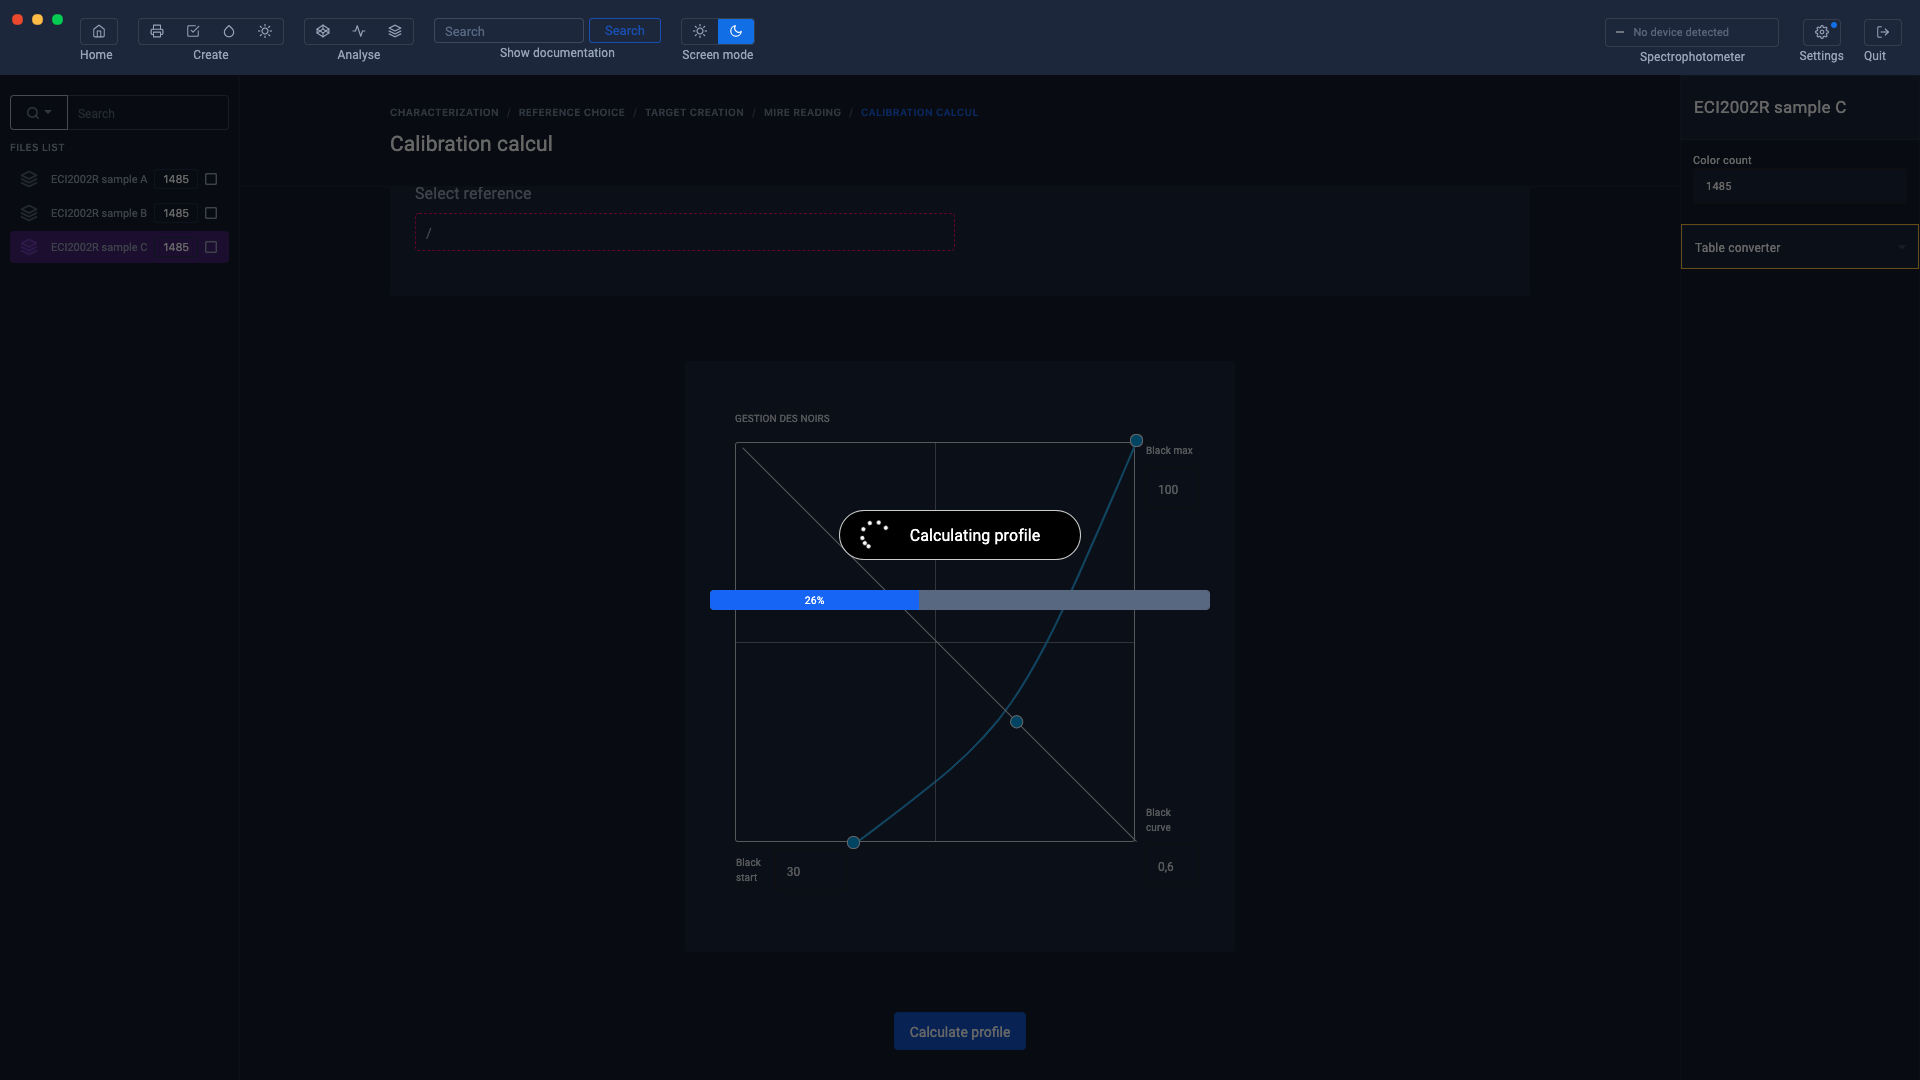
The management of the black ink for the calculation of the CMYK profiles, is done, quite simply, by moving the points of the graph.
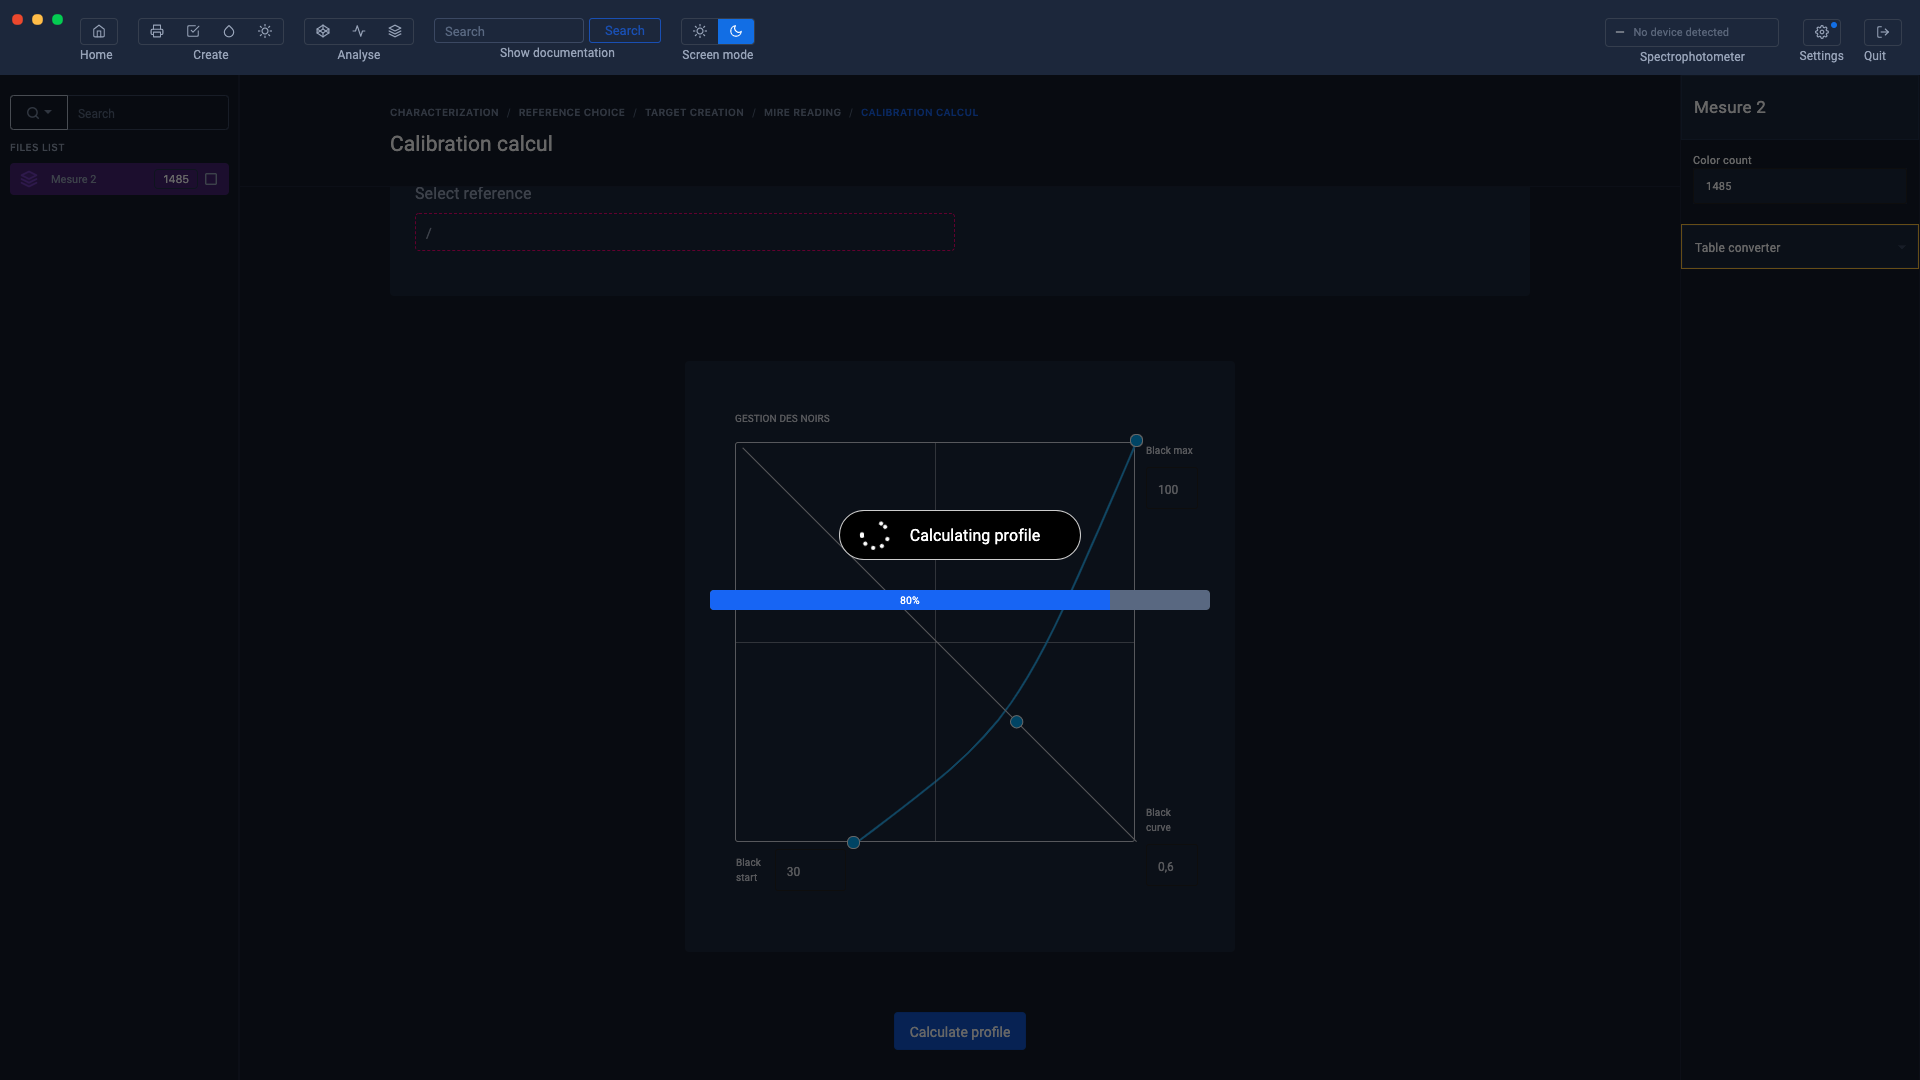
When the parameters are defined, click on the " Calculate profile " button
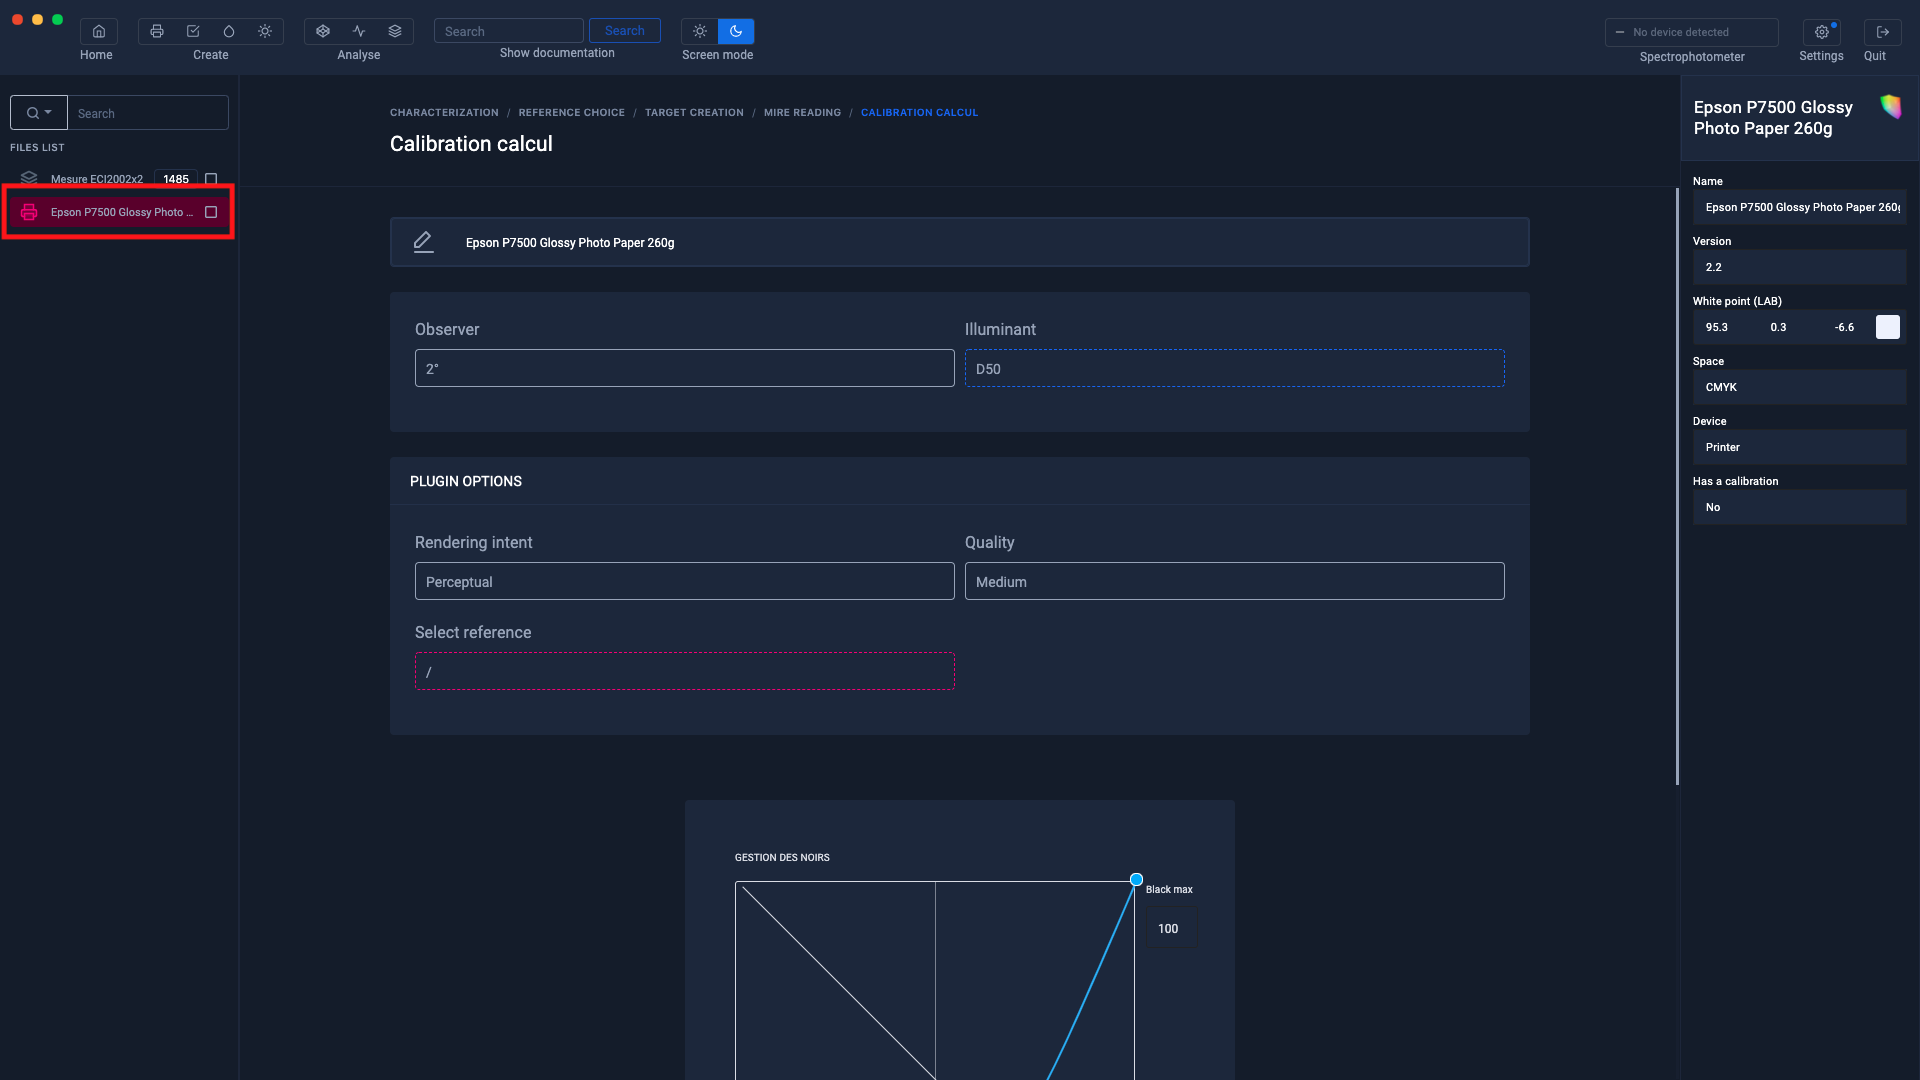
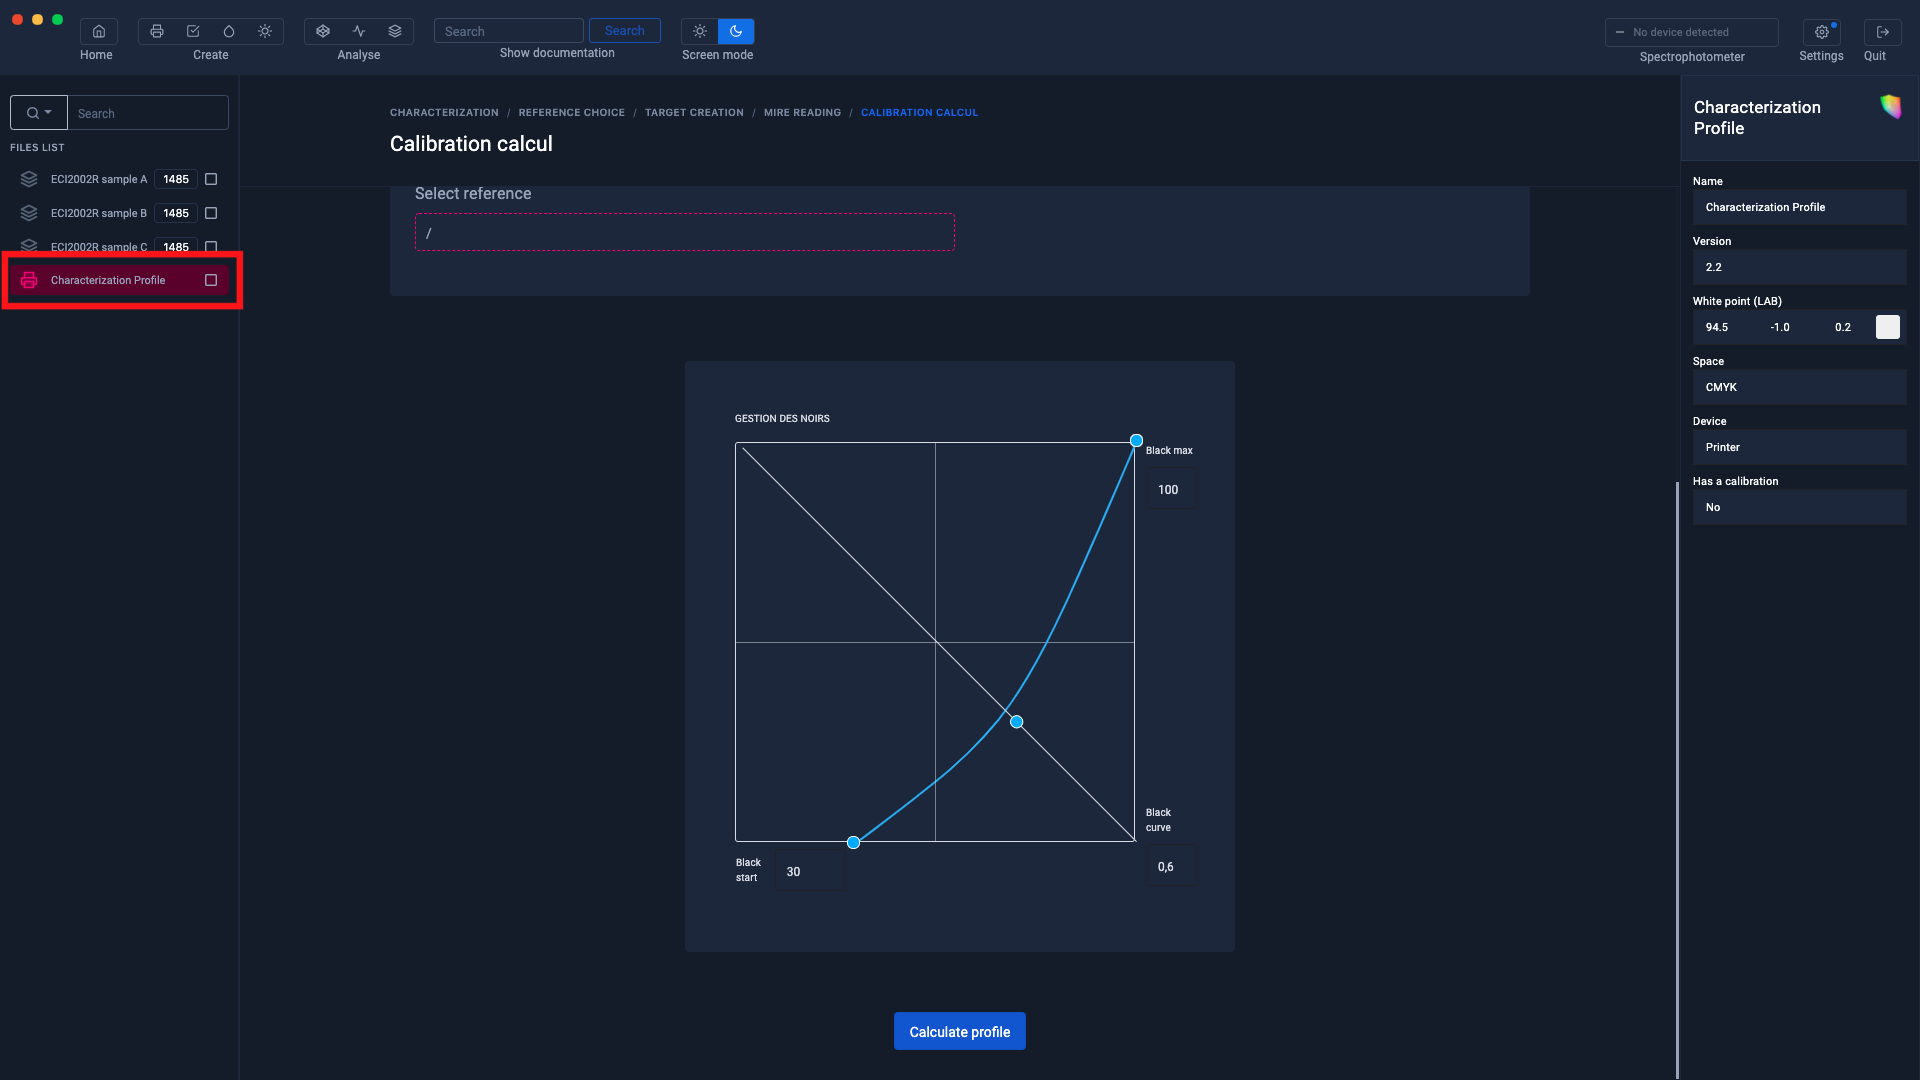
The profile is calculated
Once the profile has been calculated, it appears in the left column.
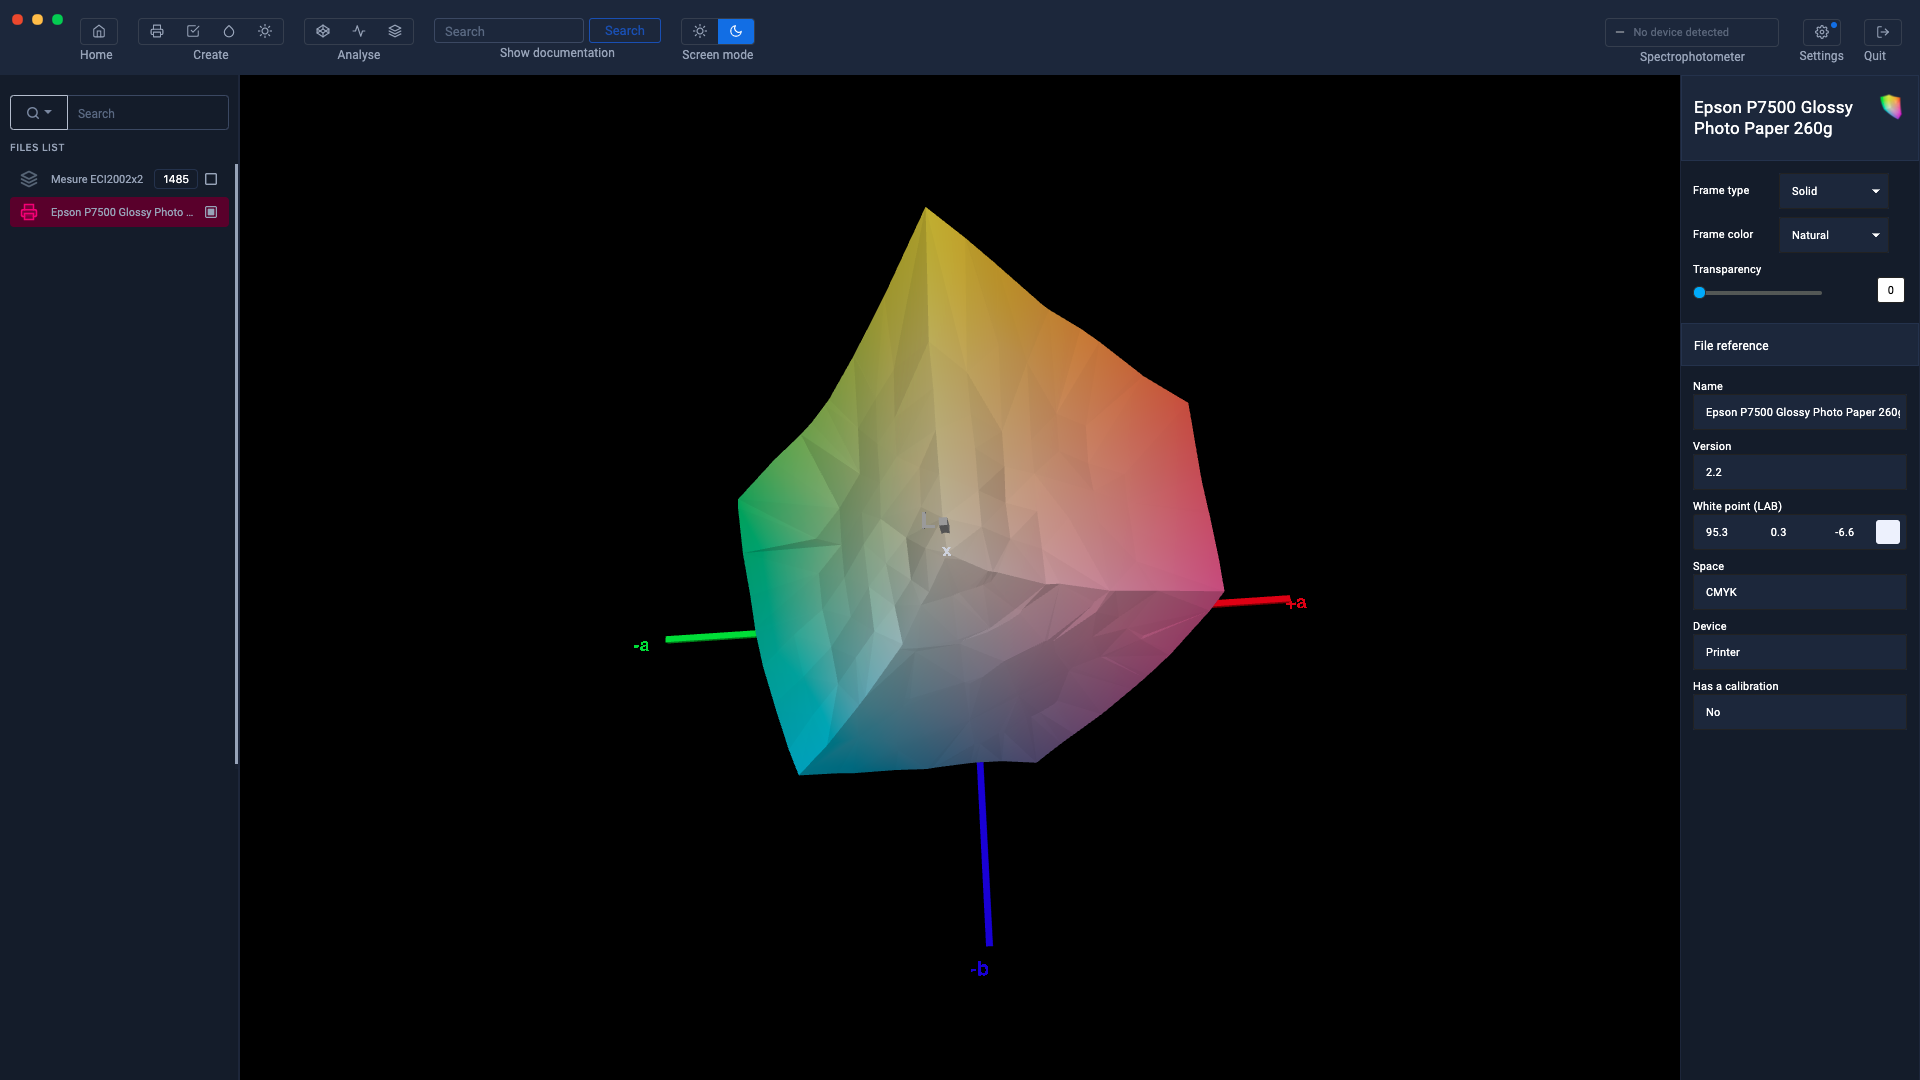
In order to check the consistency of the profile, it is recommended to display it in the Gamut Viewer
You can also print a test image to assess your impression. You can download a test image here:
Don't forget to save your profile

Create a profile from a calibration
(On going redaction)
This tutorial explains how to create a custom profile with a calibration step.
Printer drivers and some RIPs do not correctly optimize the amount of ink deposited on the paper.
Create a calibration
Let's start by clicking on the " Printer " button to start the procedure.
We will now start by creating the calibration (.cal)
Print an RGB test pattern
Do not neglect the printing stages of the test charts! Be meticulous.
This tutorial explains how to print the ranges using your printer driver, without going through a RIP or Photoshop.
Before you start ...
These notes will help you on the one hand to configure your image editing / printing application and on the other hand your printer, to print the resolution test charts required to create your profile.
In addition to this document, you should have all the TIFF images created with Coraye's Print Profiler.
Before printing the test charts, make sure your printer is configured correctly.
Use the printer maintenance utility to make sure that all nozzles are functioning properly and that they are aligned properly.
Remember that the purpose of a printer profile is to optimize print quality for a printer by using a combination of print settings, ink type, and paper type.
If you use different papers, you should use a unique profile for each.
It is essential that you print the test charts having deactivated any color manager, both in your image processing software but also in your printer.
Follow this procedure carefully, referring to the user manuals and corresponding help files if you are not using the same software and hardware as described here.
In the following instructions, the text in bold italics represents the wording that you should see on your computer.
First method : Printing directly from Coraye's RGB Profiler module
Once you have selected or created your target, click on the Export icon located below the target, then select "Export PDF".
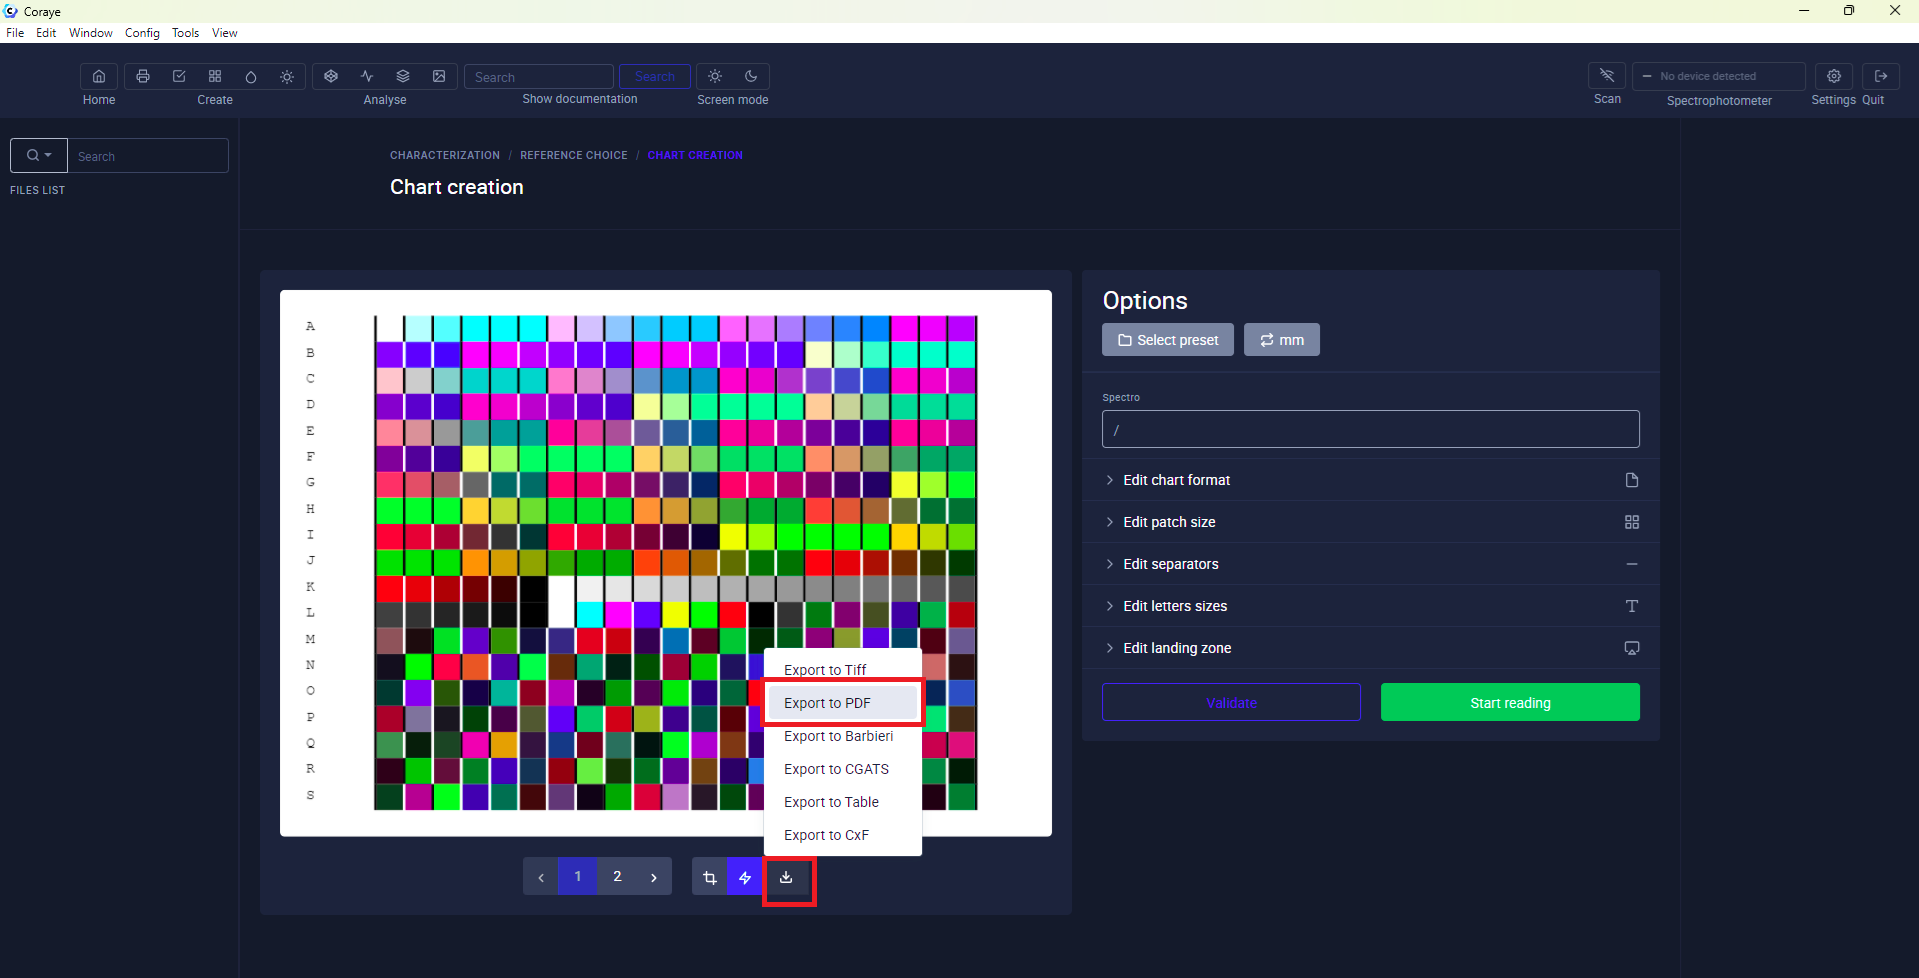
At this stage, if you have configured your printer correctly, you can send your test pattern directly to it.
(See recommendations)
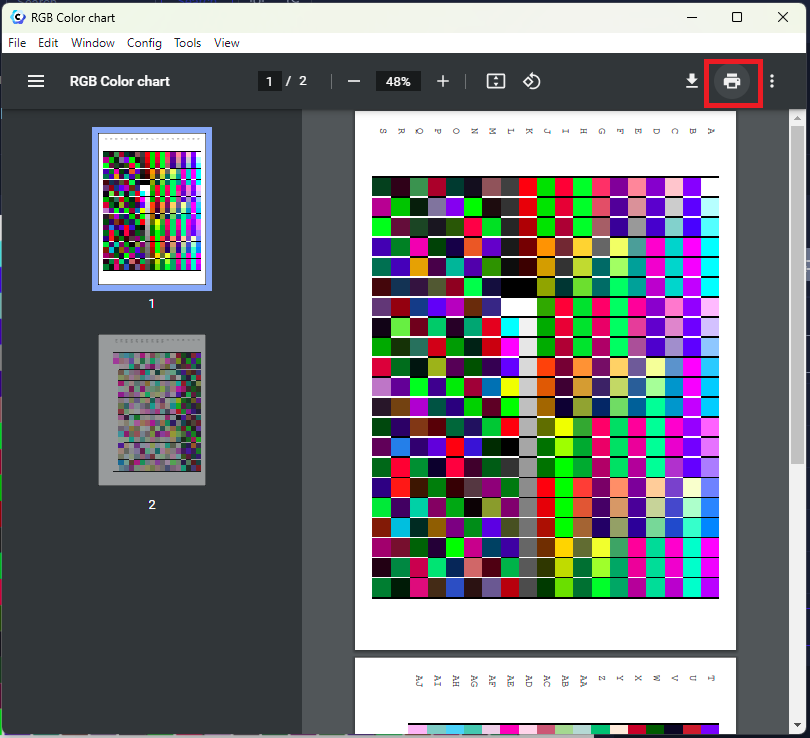
 Exemple driver Epson SC-P7500
Second method : Adobe Color Printing Utility (ACPU)
We now recommend using ACPU for printing target files if, for example, Coraye is not installed on the computer that drives the printer.
This small application can be downloaded from the Adobe website
https://helpx.adobe.com/fr/photoshop/kb/no-color-management-option-missing.html
The download is a small ZIP file (56 KB) containing the program and instructions.
Versions are available for both PC and Mac platforms.
After the files are extracted, it is more convenient to drag the “Adobe Color Printer Utility.exe” file to the desktop.
You may find it convenient to drag the target * .tif and files to the desktop as well.
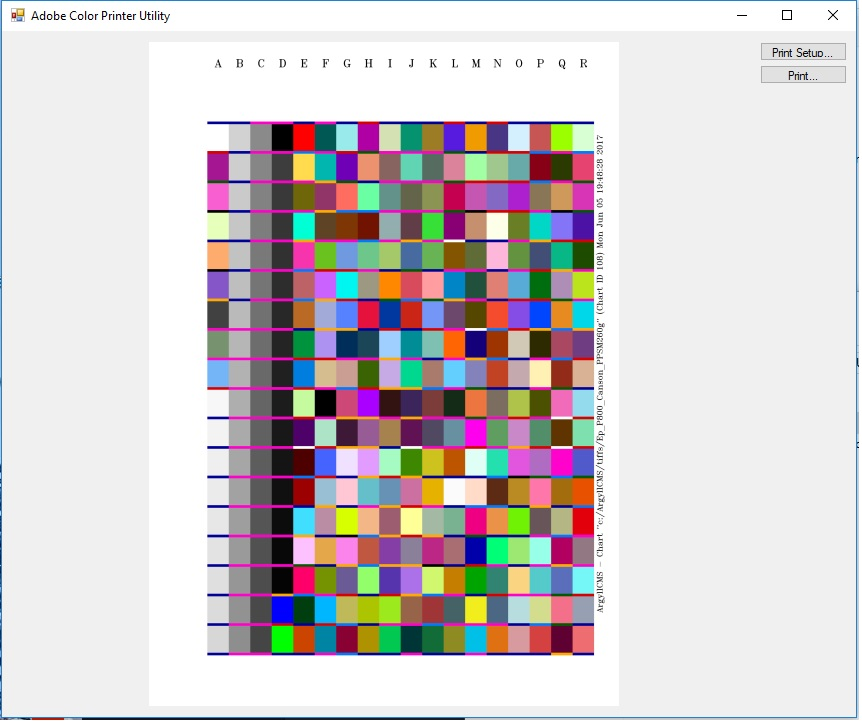
To run ACPU, simply double-click on the desktop icon.
This will open a file selection dialog where you can select one of the target files.
The selected file will appear in the ACPU window as below.
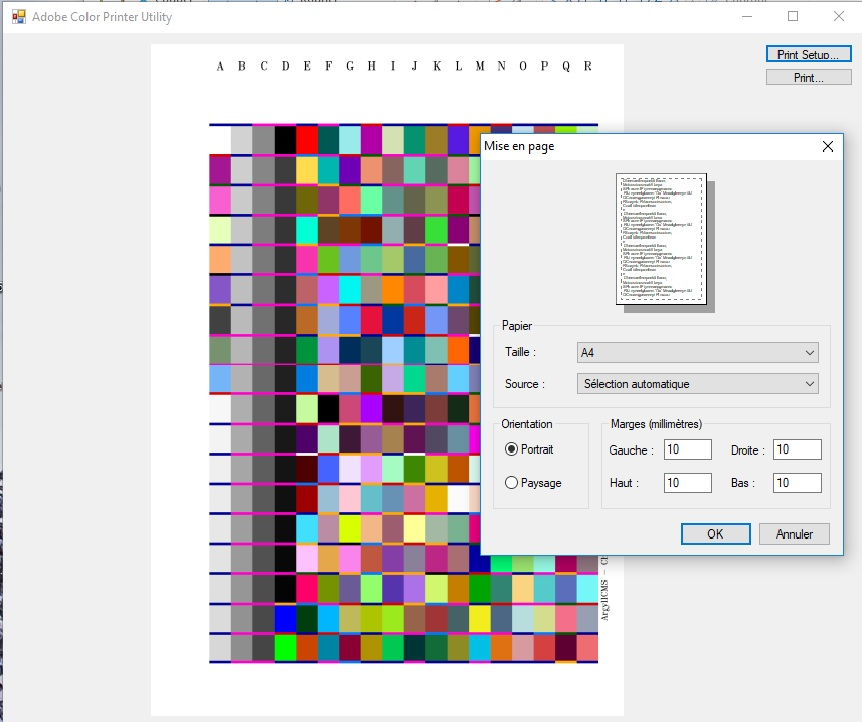
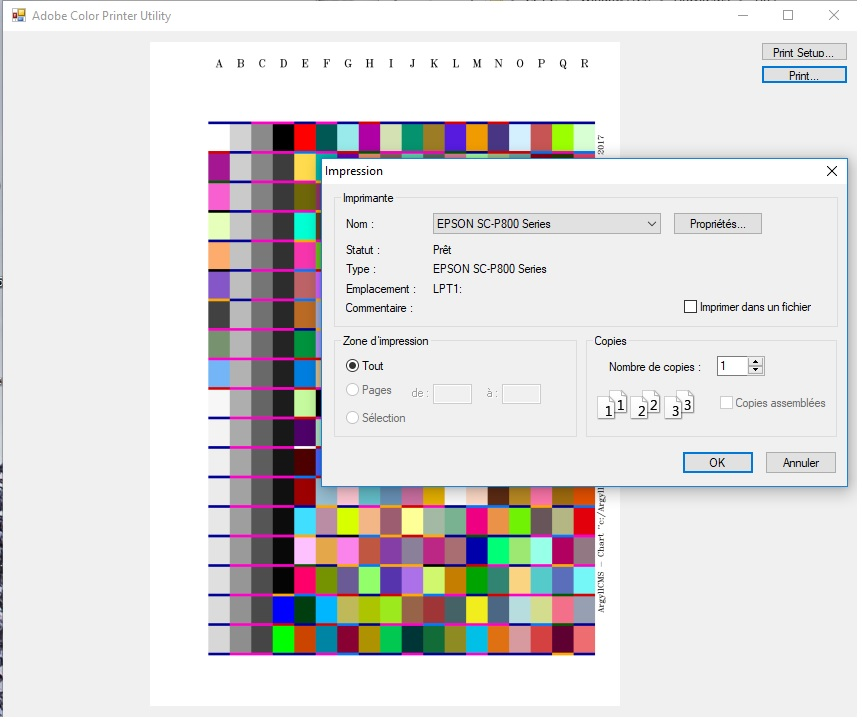
Click " Print, " select your printer from the drop-down list, then click " Properties " to access the printer setup dialog box.
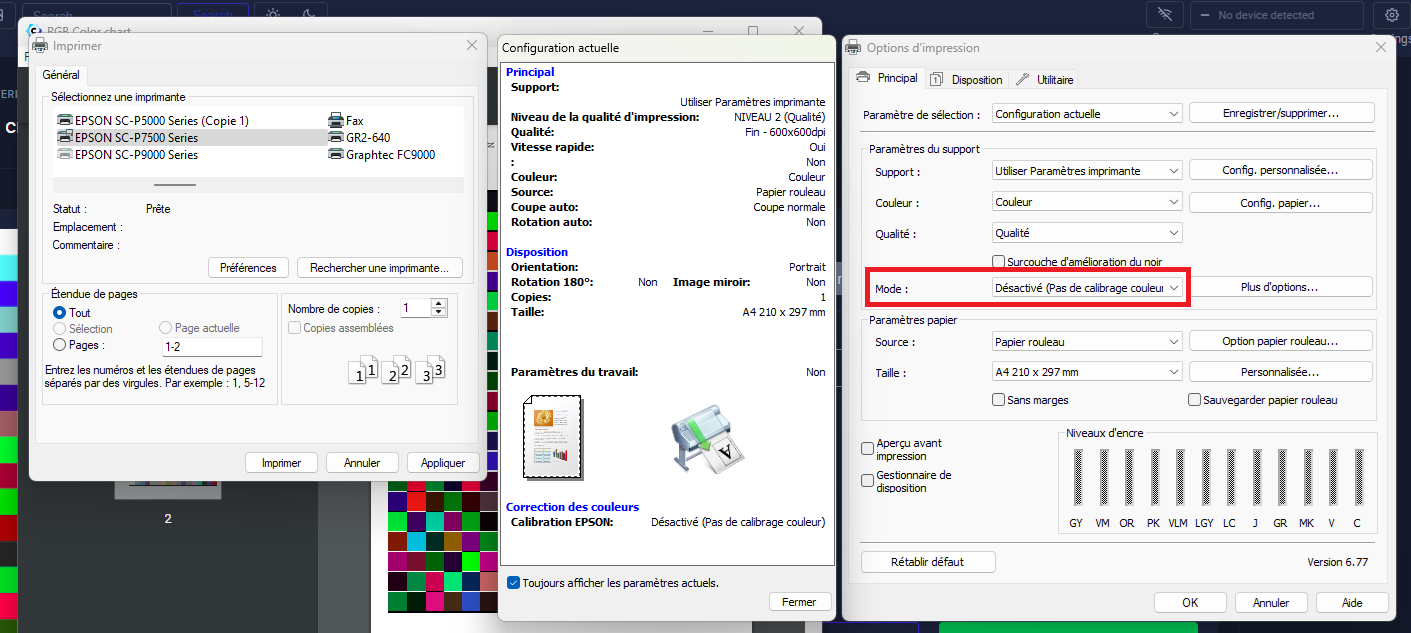
Recommendations
When you get to the printer setup window, follow the instructions below to turn off color management.
Once the printer is configured, you will return to the “ Print ” window as above.
Just click " Print " and your target should print.
After you print the first sheet of the target, follow the same procedure to print the second sheet.
It will be necessary to configure the printer again because ACPU does not “remember” the printer settings from print to print.
The first step in printer setup is to choose the correct paper type and printer resolution in the printer driver. These depend on the type of paper you are using. Remember that the profile is only valid for this paper, printed with the settings you have chosen. If you don't know how to print your pattern, I suggest you visit the paper manufacturer's website, for information on setting up your printing.
- Canson
- Hahnemuehle
- Tecco
- Ilford
- Rauch
- Awagami
It is essential to disable all color management in the printer settings. You will find it in the Epson control panel below by clicking on the Advanced button which will give you another set of options. In this second window, you can select the appropriate paper and resolution.
It is preferable to save the settings with a descriptive name so that they can be easily found the next time you print.
These are the settings you will use each time you print using your custom profile with this paper.
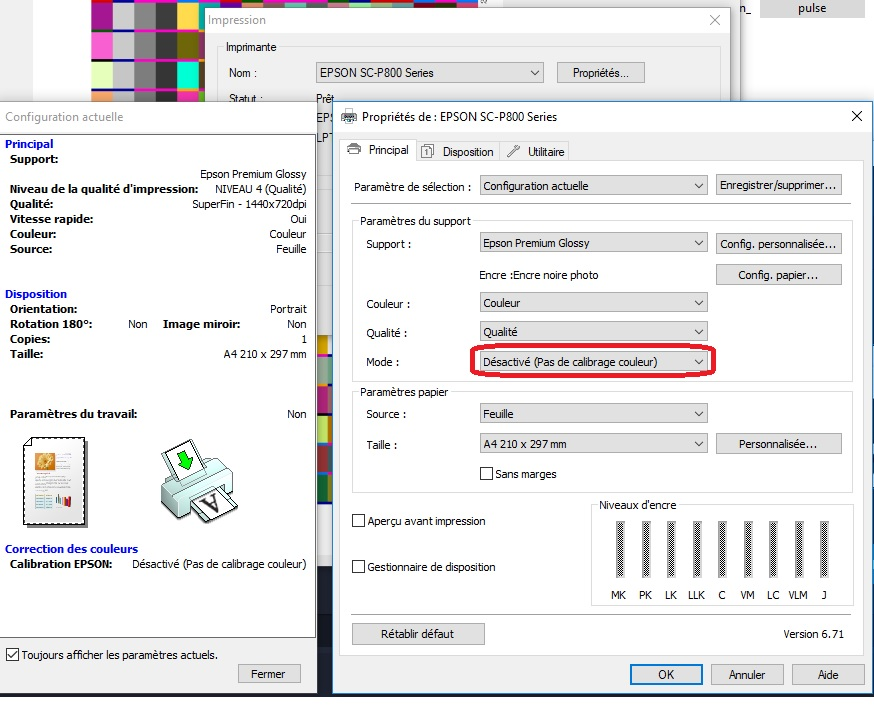
Do not forget to deactivate the color management to print the test chart
Other print drivers will be different, but the goal is the same: to disable color management or settings in the printer driver. Sometimes the required parameters are a little less obvious. For example, in the Canon driver shown below, you will need to select Manual in the Color Adjustment area.
ACPU will make sure that the file itself is not color managed, but it is up to you to turn off color management in the printer driver.
An example of printing charts on a Canon Pro 1100 printer is also explained on the excellent website www.guide-gestion-des-couleurs.com by Arnaud Frich:
https://www.guide-gestion-des-couleurs.com/tutoriel-logiciel-coraye-profiles-rvb-cmjn.html
After printing the test charts
During this time, be careful not to scratch the surface or damage it in any way.
Even papers that claim to be "instant-dry" can be vulnerable on the first print, and any smudging on the test patterns can significantly affect profile accuracy.
The printouts should be looked at carefully, as they indicate the capabilities of your printer / ink / paper combination.
It is important to keep in mind that printer profiling cannot increase the gamut of colors that you can print.
This will ensure that the colors you can print are reproduced accurately, that the transitions between colors are smooth, and that the grays are truly gray.
All marking should be done near the edges of the prints, outside the black border.
Do not mark targets or apply adhesive labels to the reverse side of the printed area.
Create an icc profile from an average of measured charts
Creating a characterization profile from measurements taken on a sample of several test charts is necessary to characterize an unstable printer or press.
In this tutorial, we will create a characterization profile from a sample of 3 CMYK test charts of the ECI2002R type.
This profile will be carried out in 4 steps:
- Printing of the test charts
- Take and measure the 3 test targets
- Compare the measurements of the 3 test targets in order to check the quality of these and check for any measurement errors.
- Take the average of the 3 measurements then start the profile calculation.
Printing of charters
In the profile creation module, click on " Create a characterization " then on " CMJN "
Select the " ECI2002R " charter by clicking on the button located under the charter.

When the chart is displayed, export the test chart in Tiff or Pdf format in order to print it.
When the test charts have been printed, click on the " Start measurement " button
Select the spectrophotometer options then click on the " I'm ready " button

Put the spectrophotometer in its calibration position

Start the calibration by clicking on the " Start calibration " button
When the calibration is complete, perform the chart measurement.
Measure charters
When the chart is completely measured, click on the " Export measurement " button located to the left of the "Measurement completed" button
This will be added to the files in the left column.
Do not click on the "Measure completed" button until you have read all the charts.

When the measurement is saved, click on the trash can icon to perform the measurement for the next chart.
Compare measurements
When all the measurements have been saved, it is advisable to check their quality to detect any faults in the ranges (damaged ranges or measurement errors for example).
To find out more, see the chapter: Compare and edit chart measurements
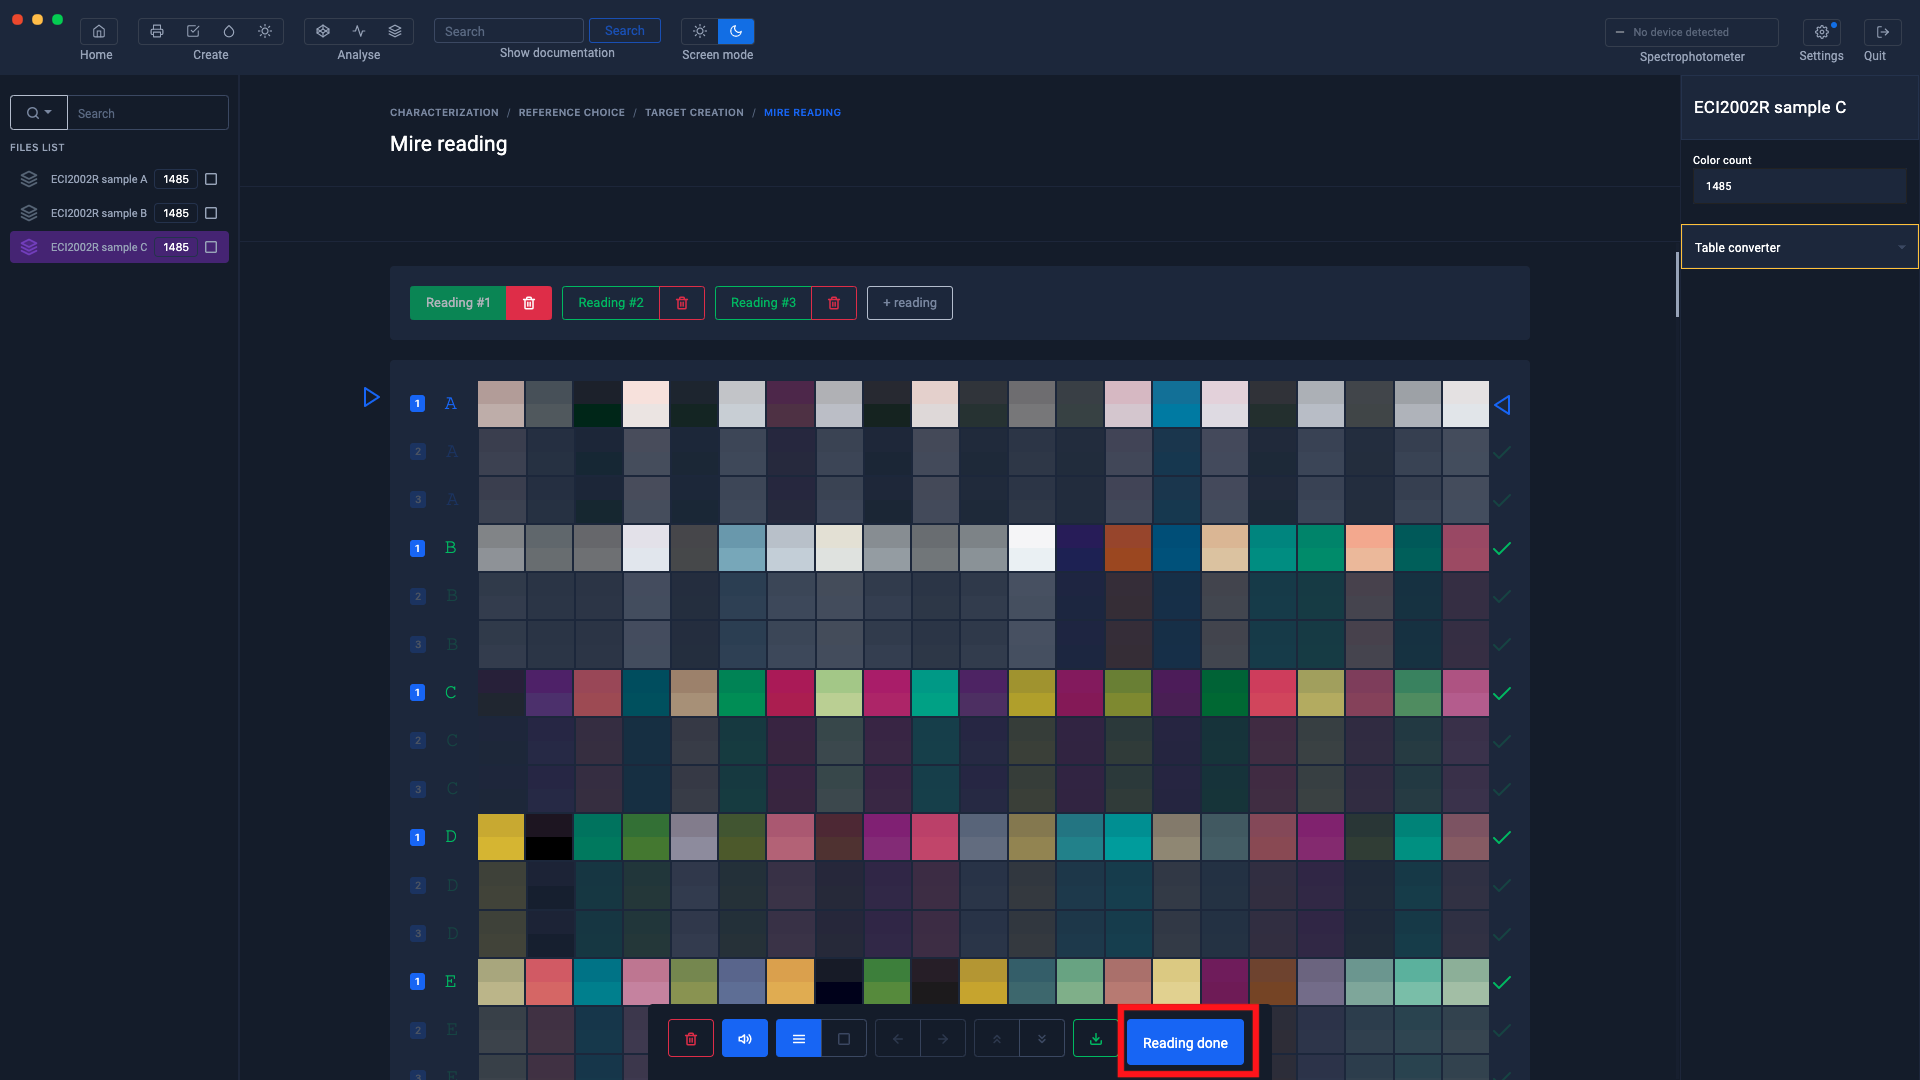
Average measurements
Use the measurements from the charts carried out previously.
The measurements are displayed as a color table in the left column
New "Reading #" buttons will appear as well as measurement lines.

Drag the color tables (corresponding to the measurements of the ranges) onto these buttons.

Then click on the " Measurement completed " button
Choose a name for your icc profile
Once the profile parameters have been defined, click on the " Calculate profile " button
Profile calculation
Once calculated, the profile will appear in the left column
A Preview in the Gamut Viewer will allow you to visually control the quality of your profile
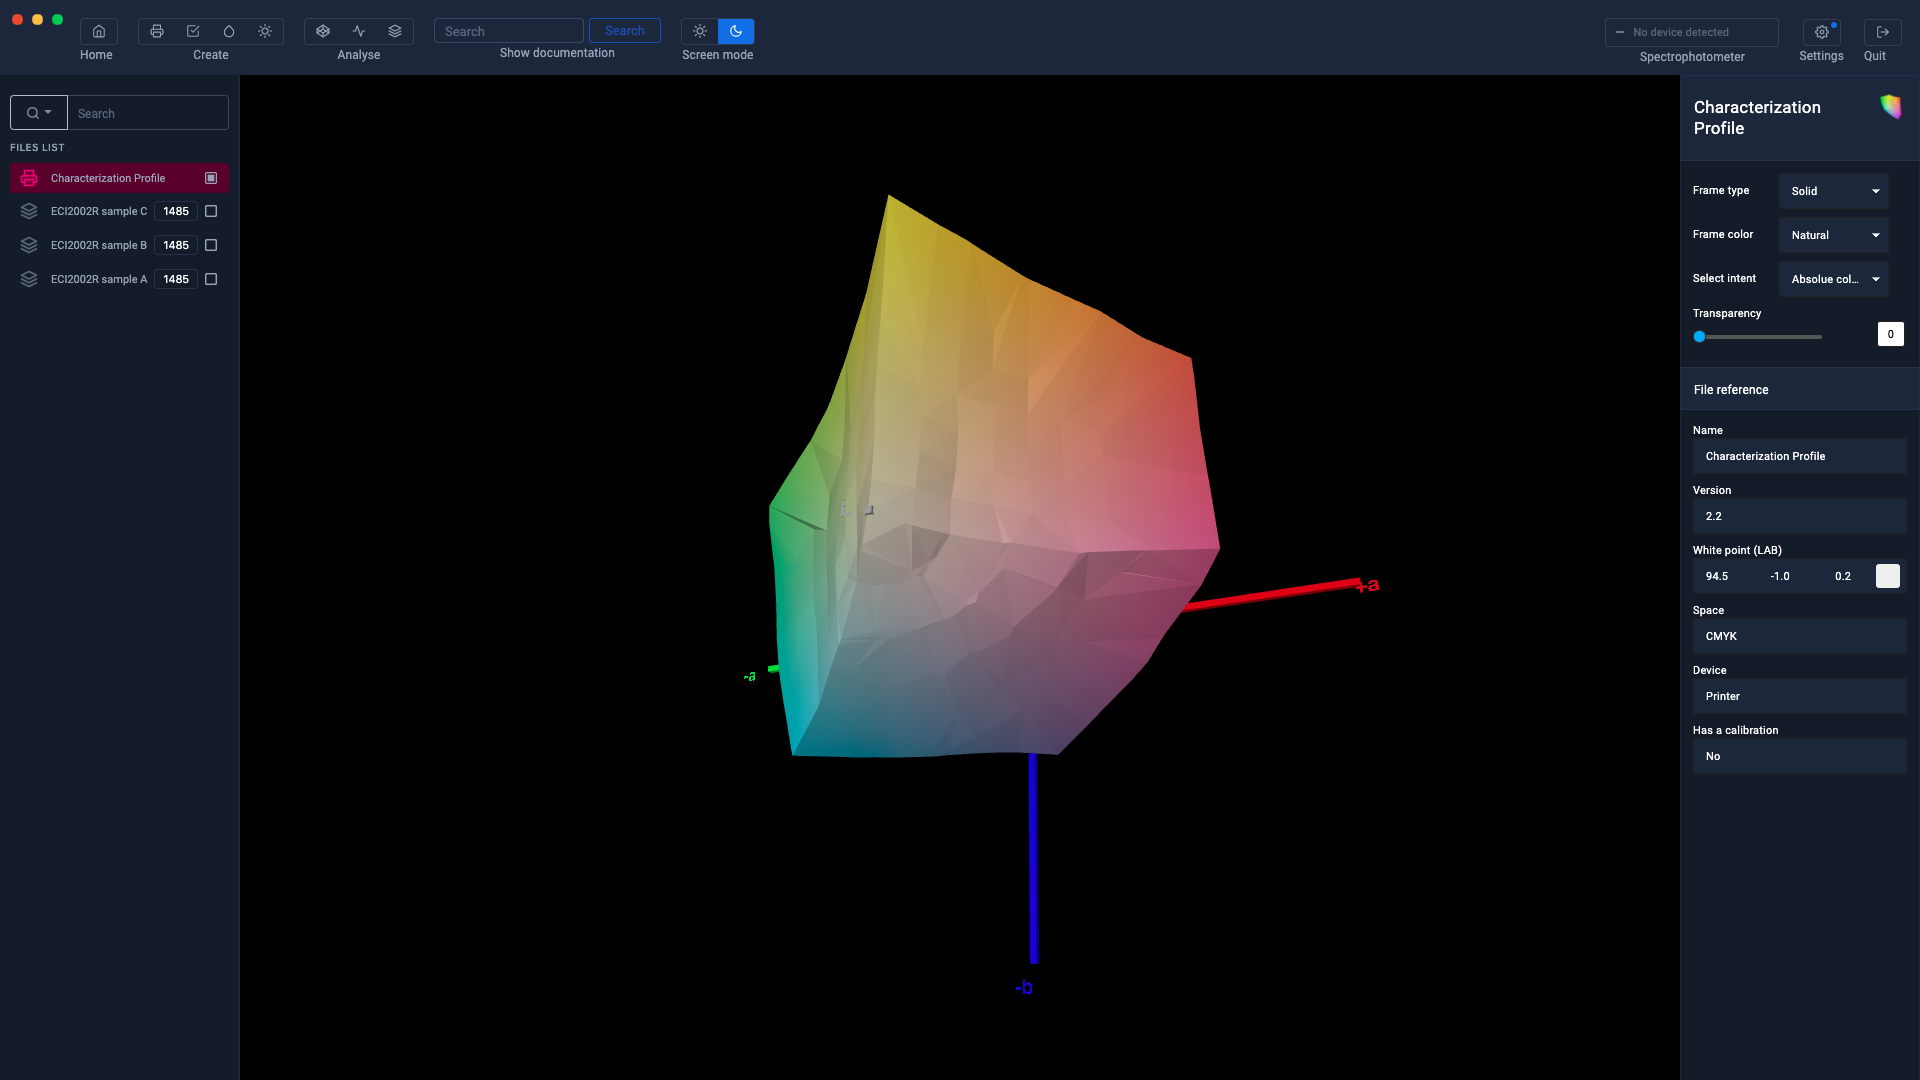
For more information, see the chapter: Gamut Viewer
Customization of charters
If the standard pattern format does not suit you, Coraye allows you to customize your chart to suit your needs.
The settings for customizing charts are located to the right of the Staff Preview.
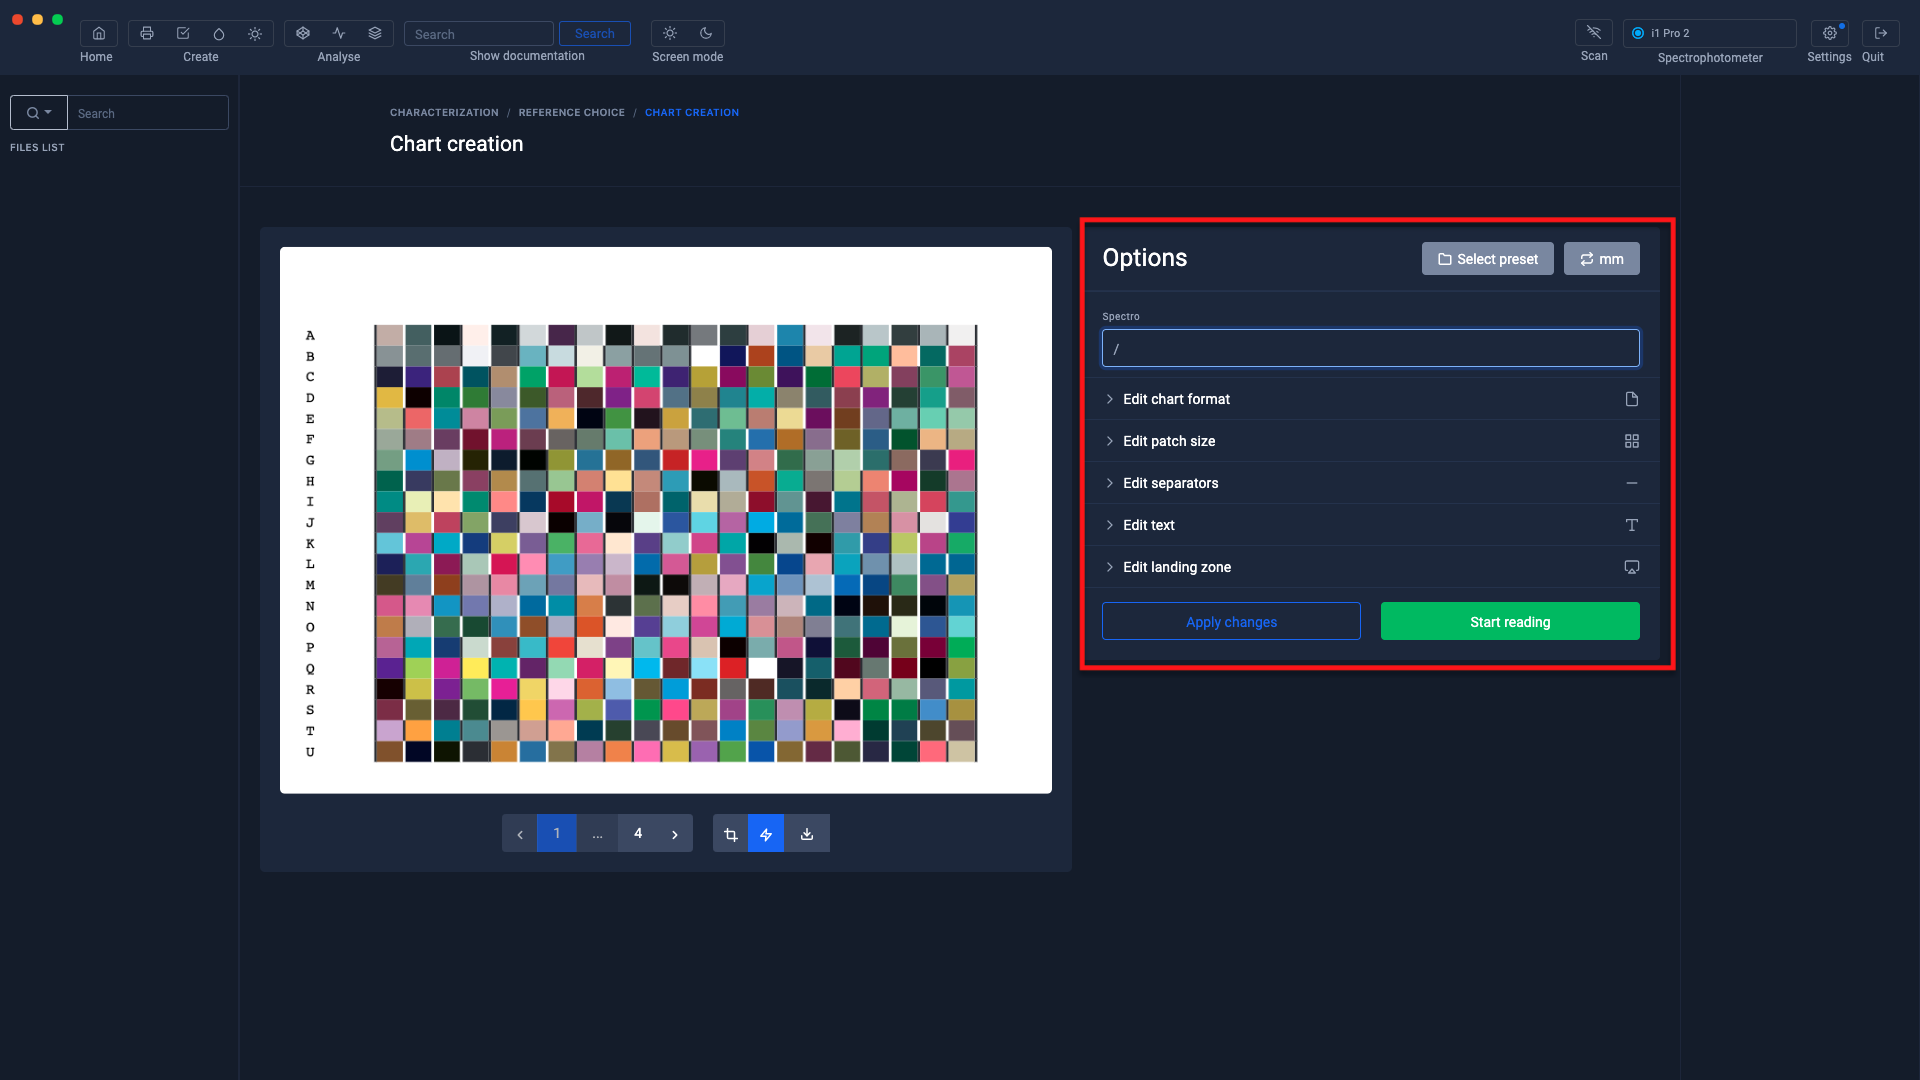
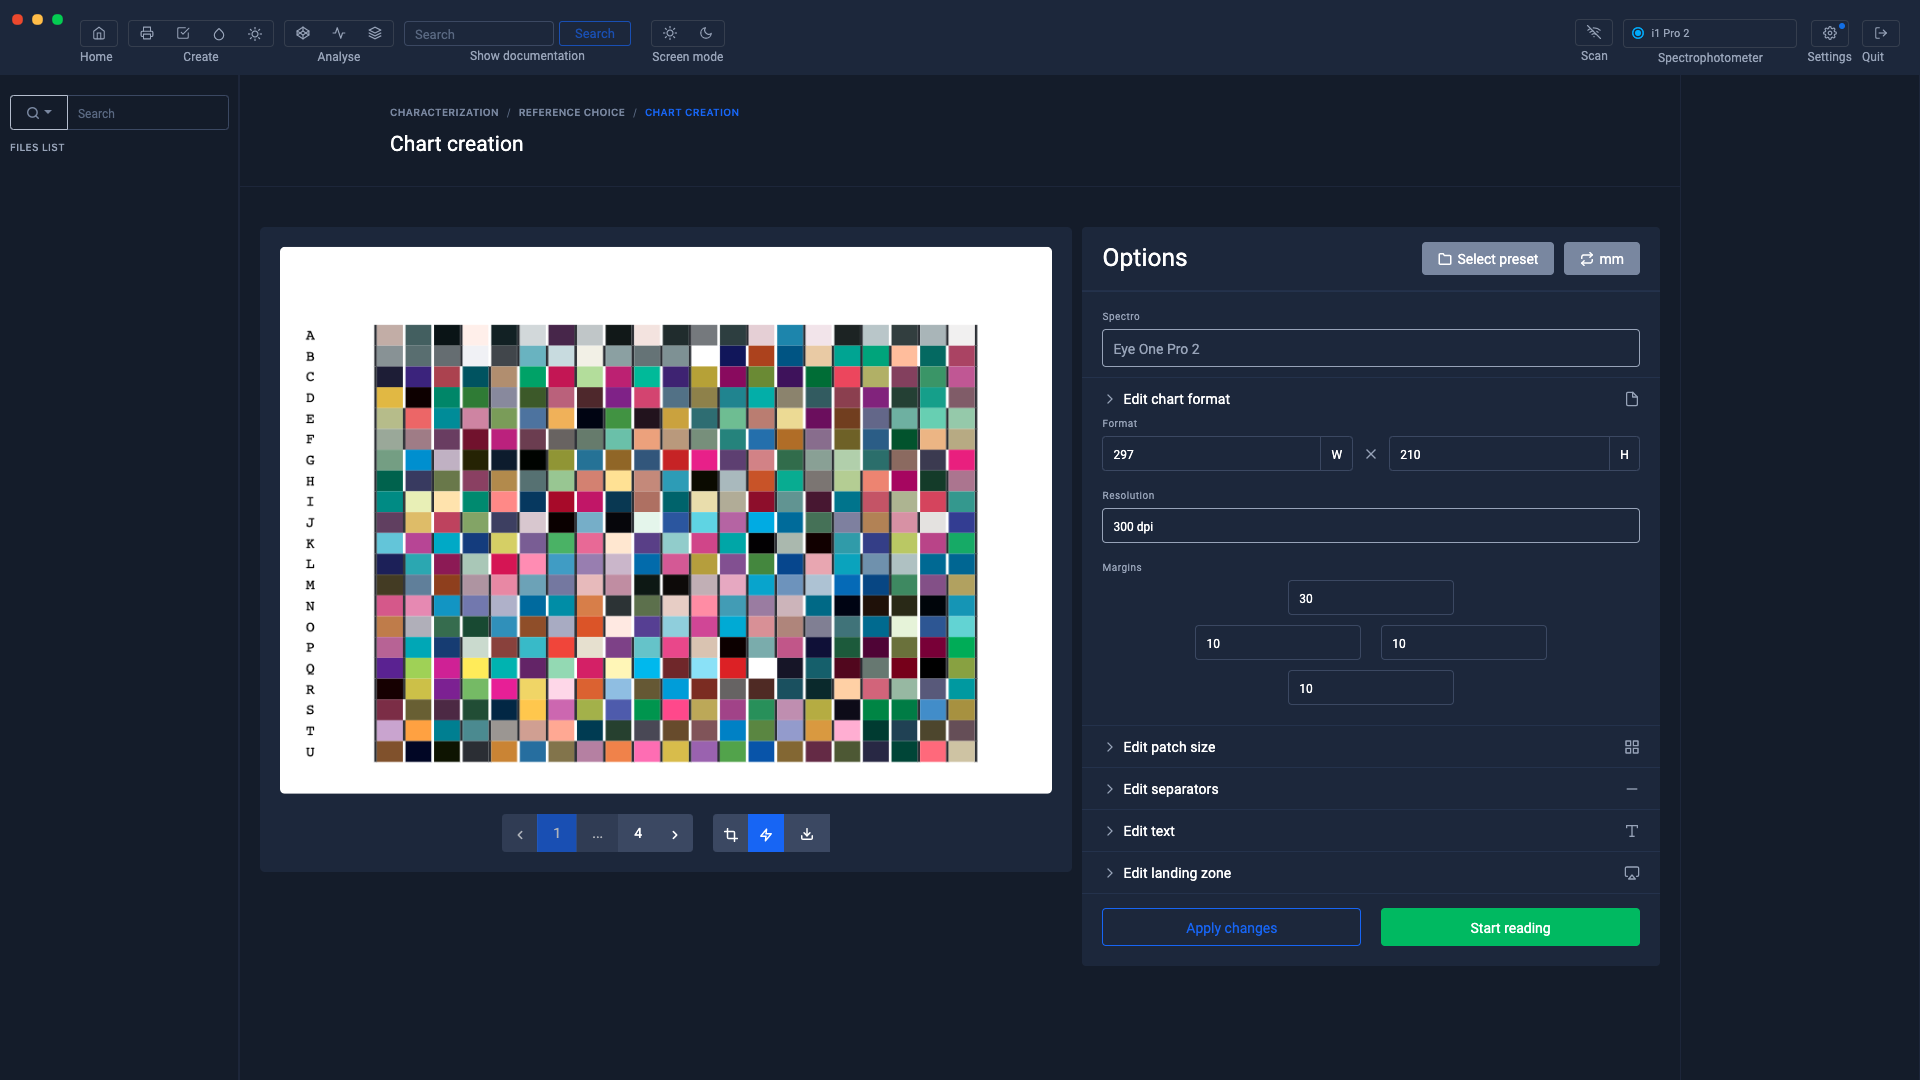
Edit the pattern format:

Depending on the instruments installed (plugins) in Coraye, pre-settings are proposed depending on the selected spectrophotometer.
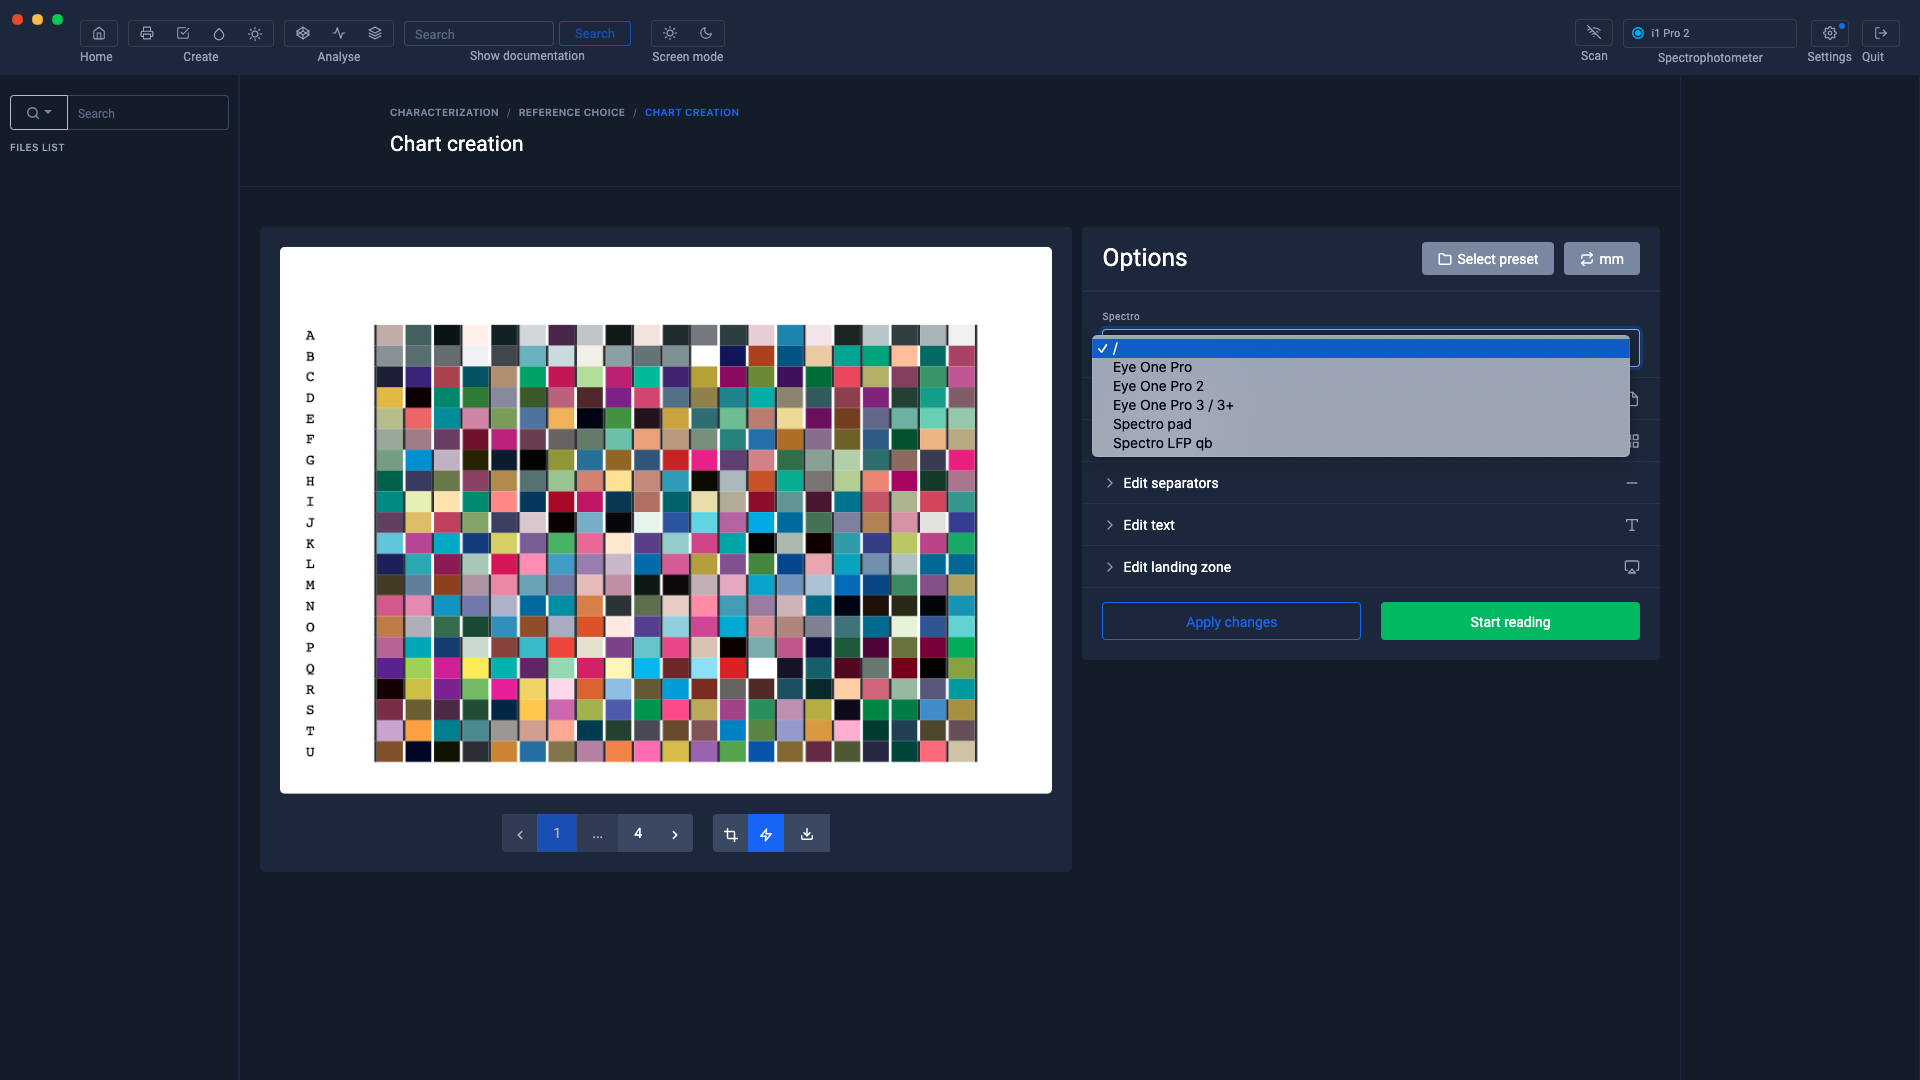
The default settings can be changed depending on the media sizes.
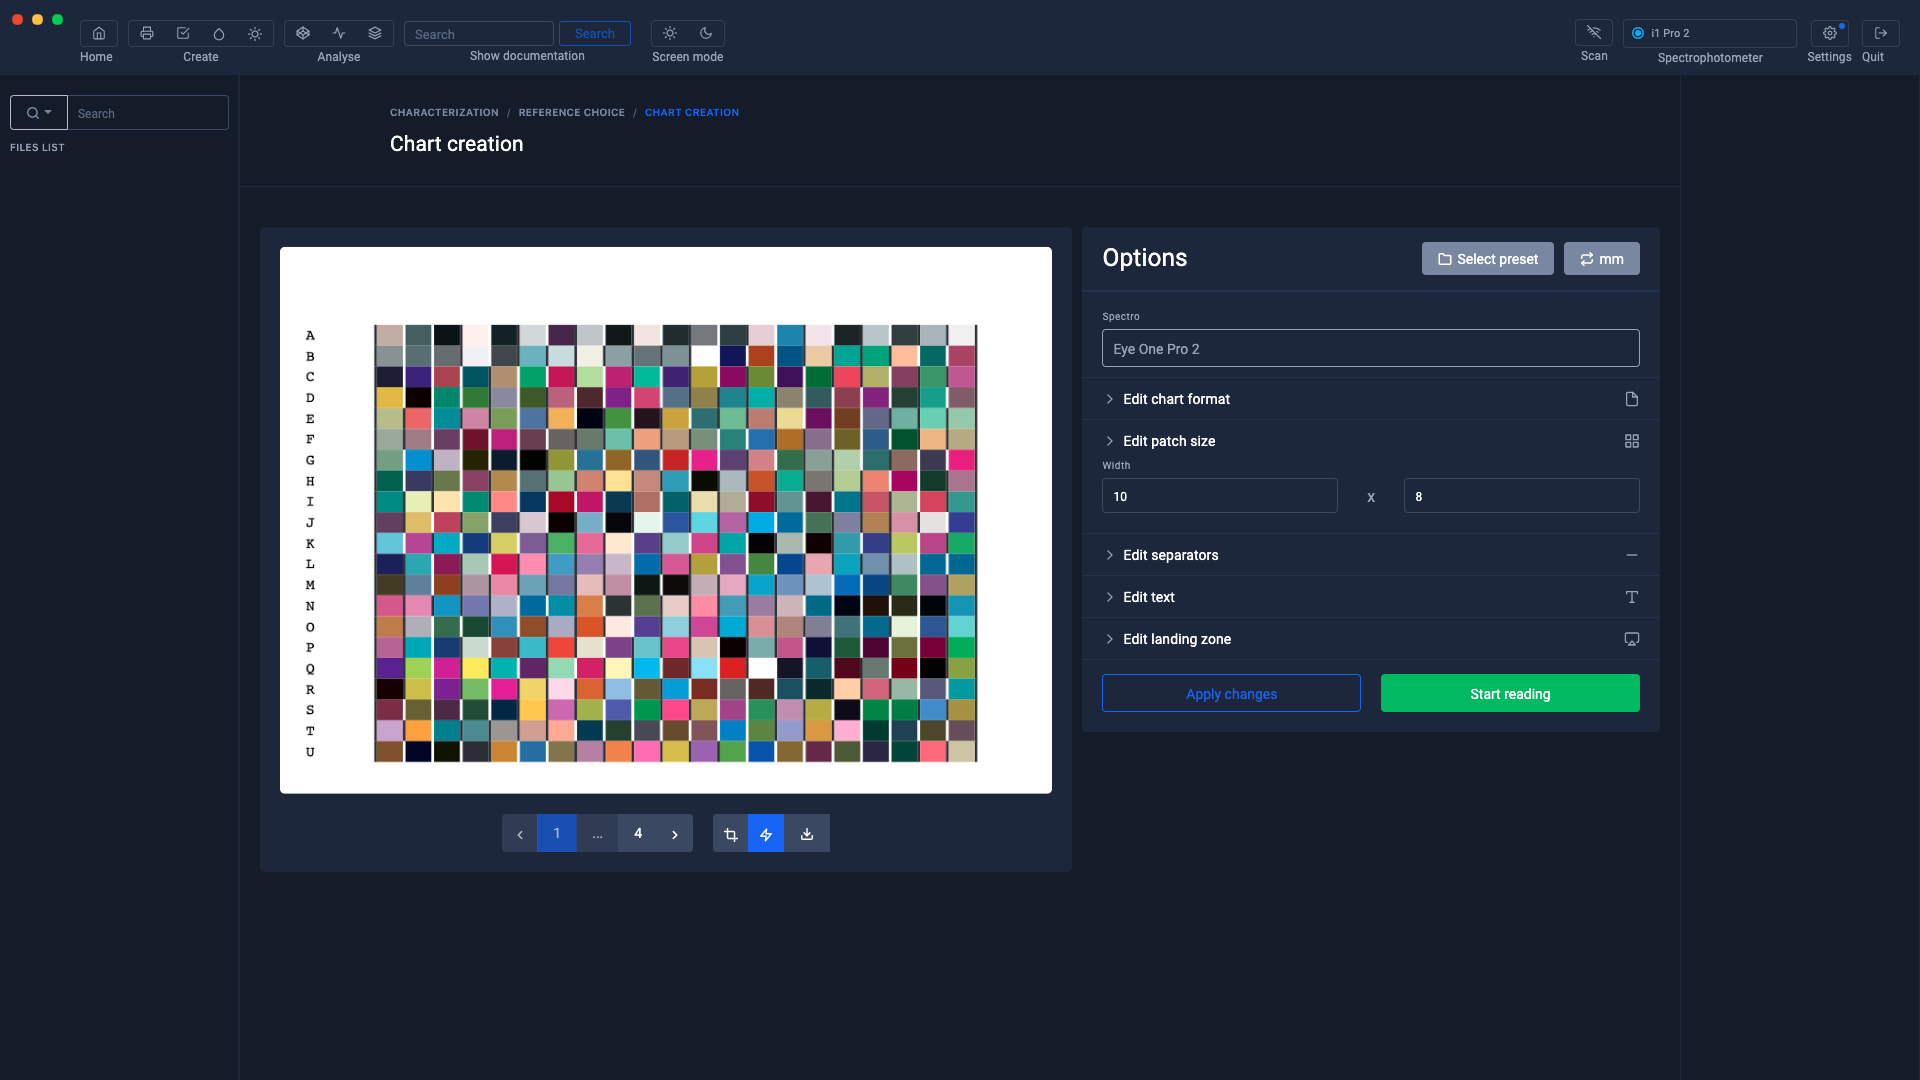
Edit the size of the patches
The sizes of the patches can be modified to optimize the ranges.
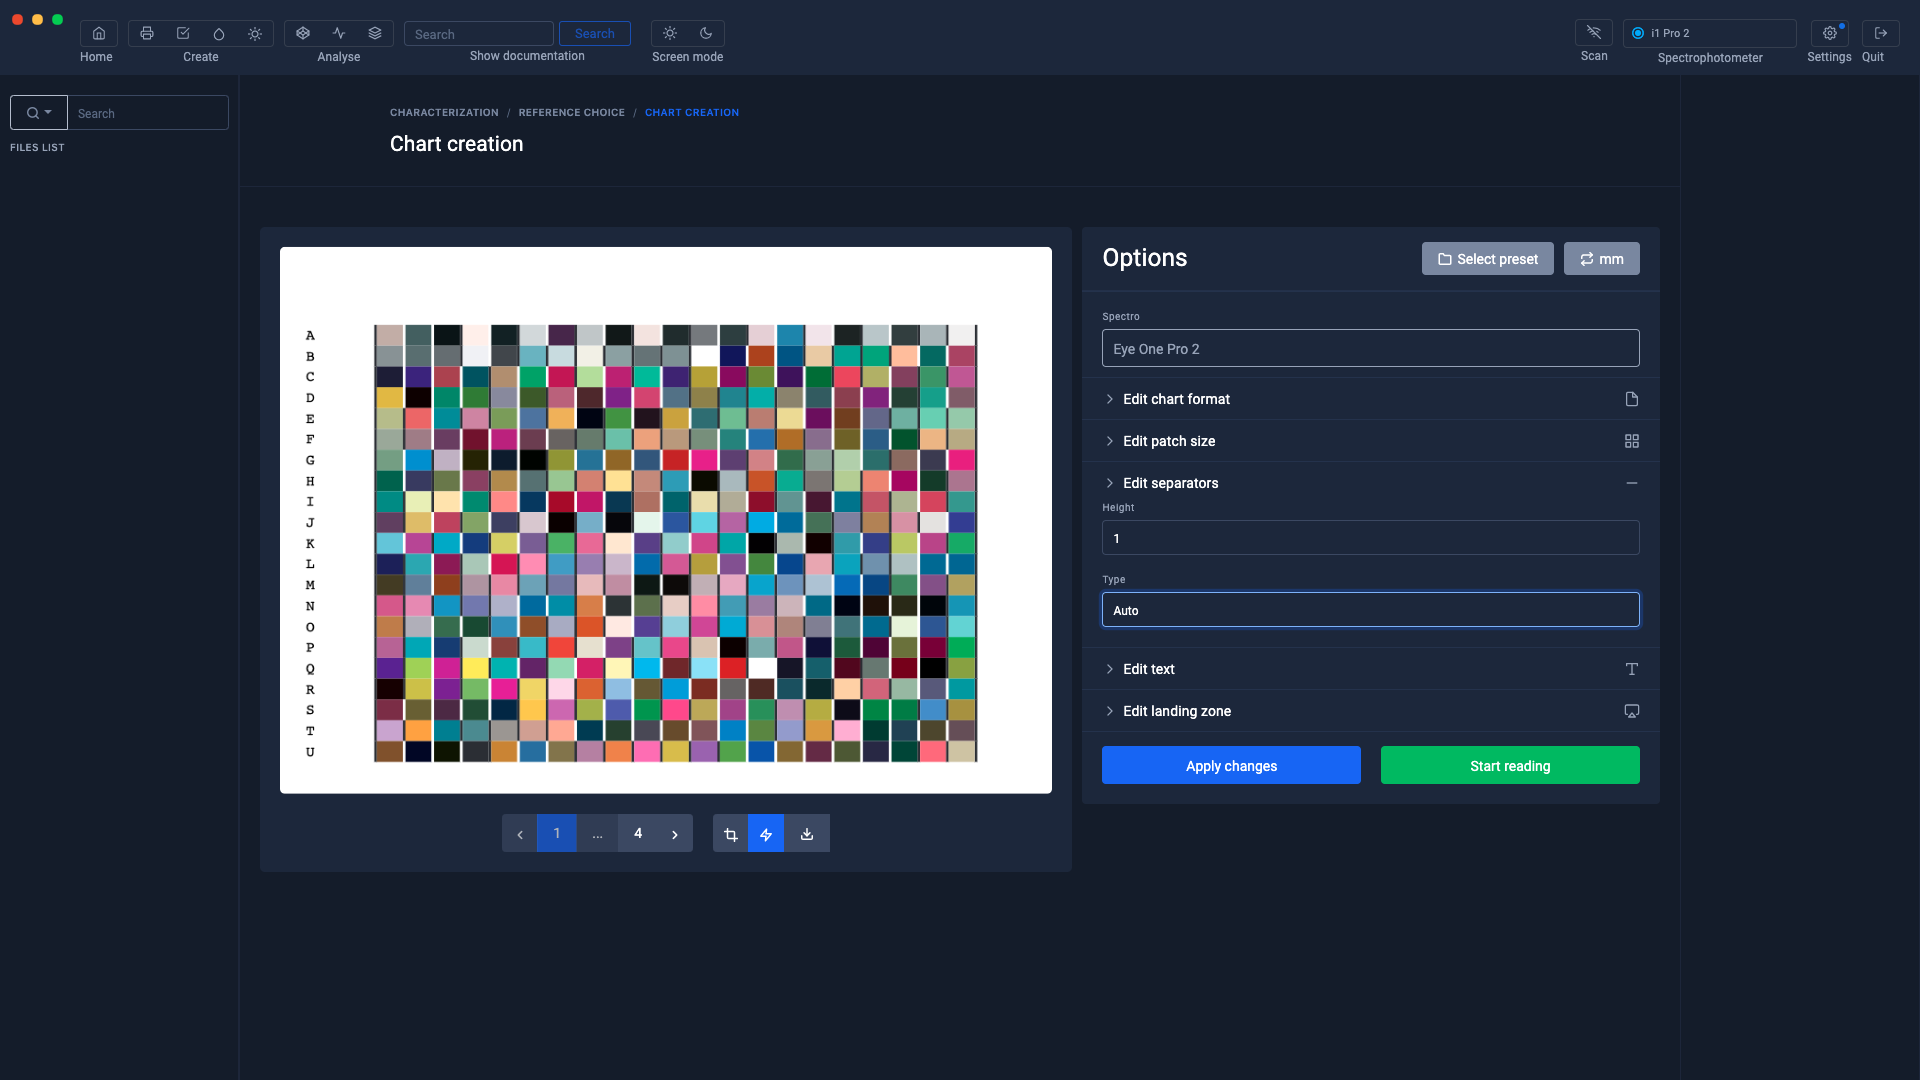
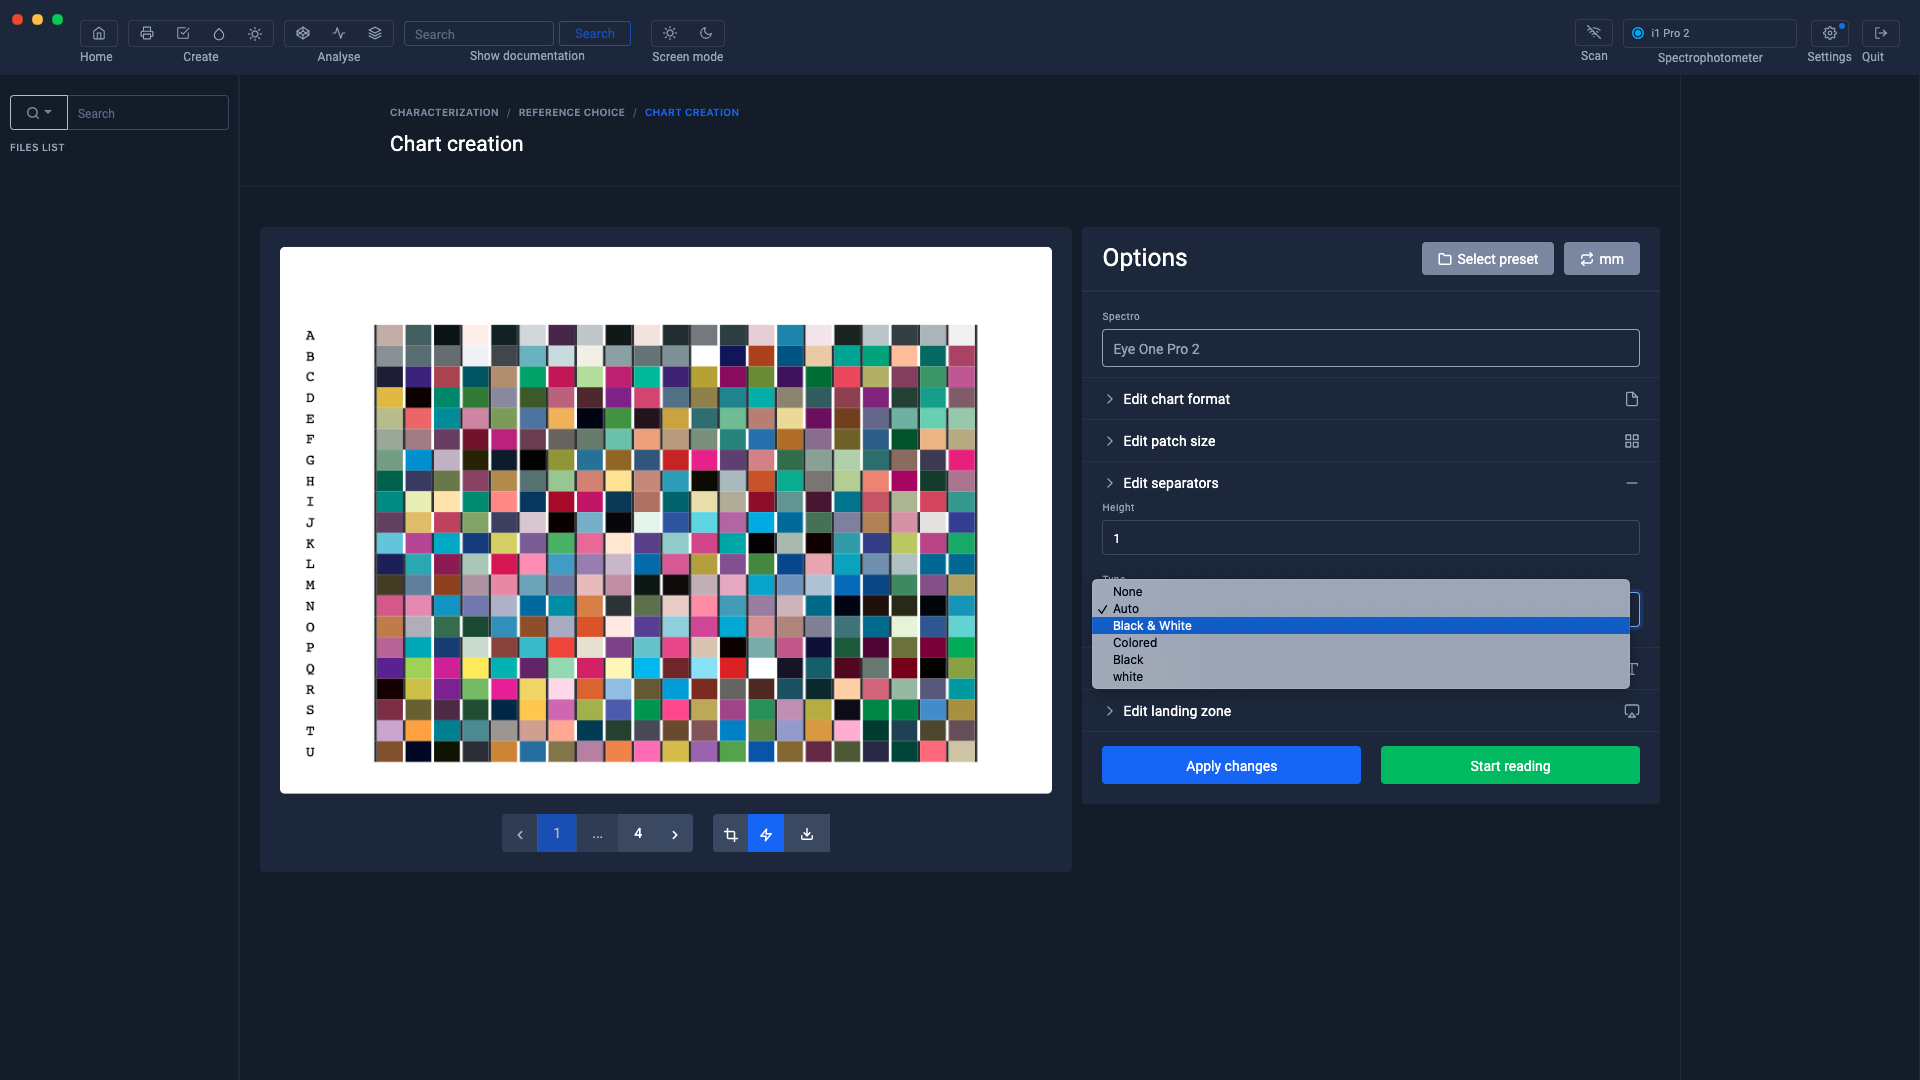
Edit separators
If your spectrophotometer cannot differentiate the patches of the test pattern, you can choose different separators
-
Without separator
-
Auto
-
Black and white
-
Color (Cyan, Magenta, Yellow)
-
Black
-
Whites
Edit text
Parameter to modify the size of the letters corresponding to the lines.

Edit stop zones
The stop zone corresponds to the space between the letters and the first column of the staff.

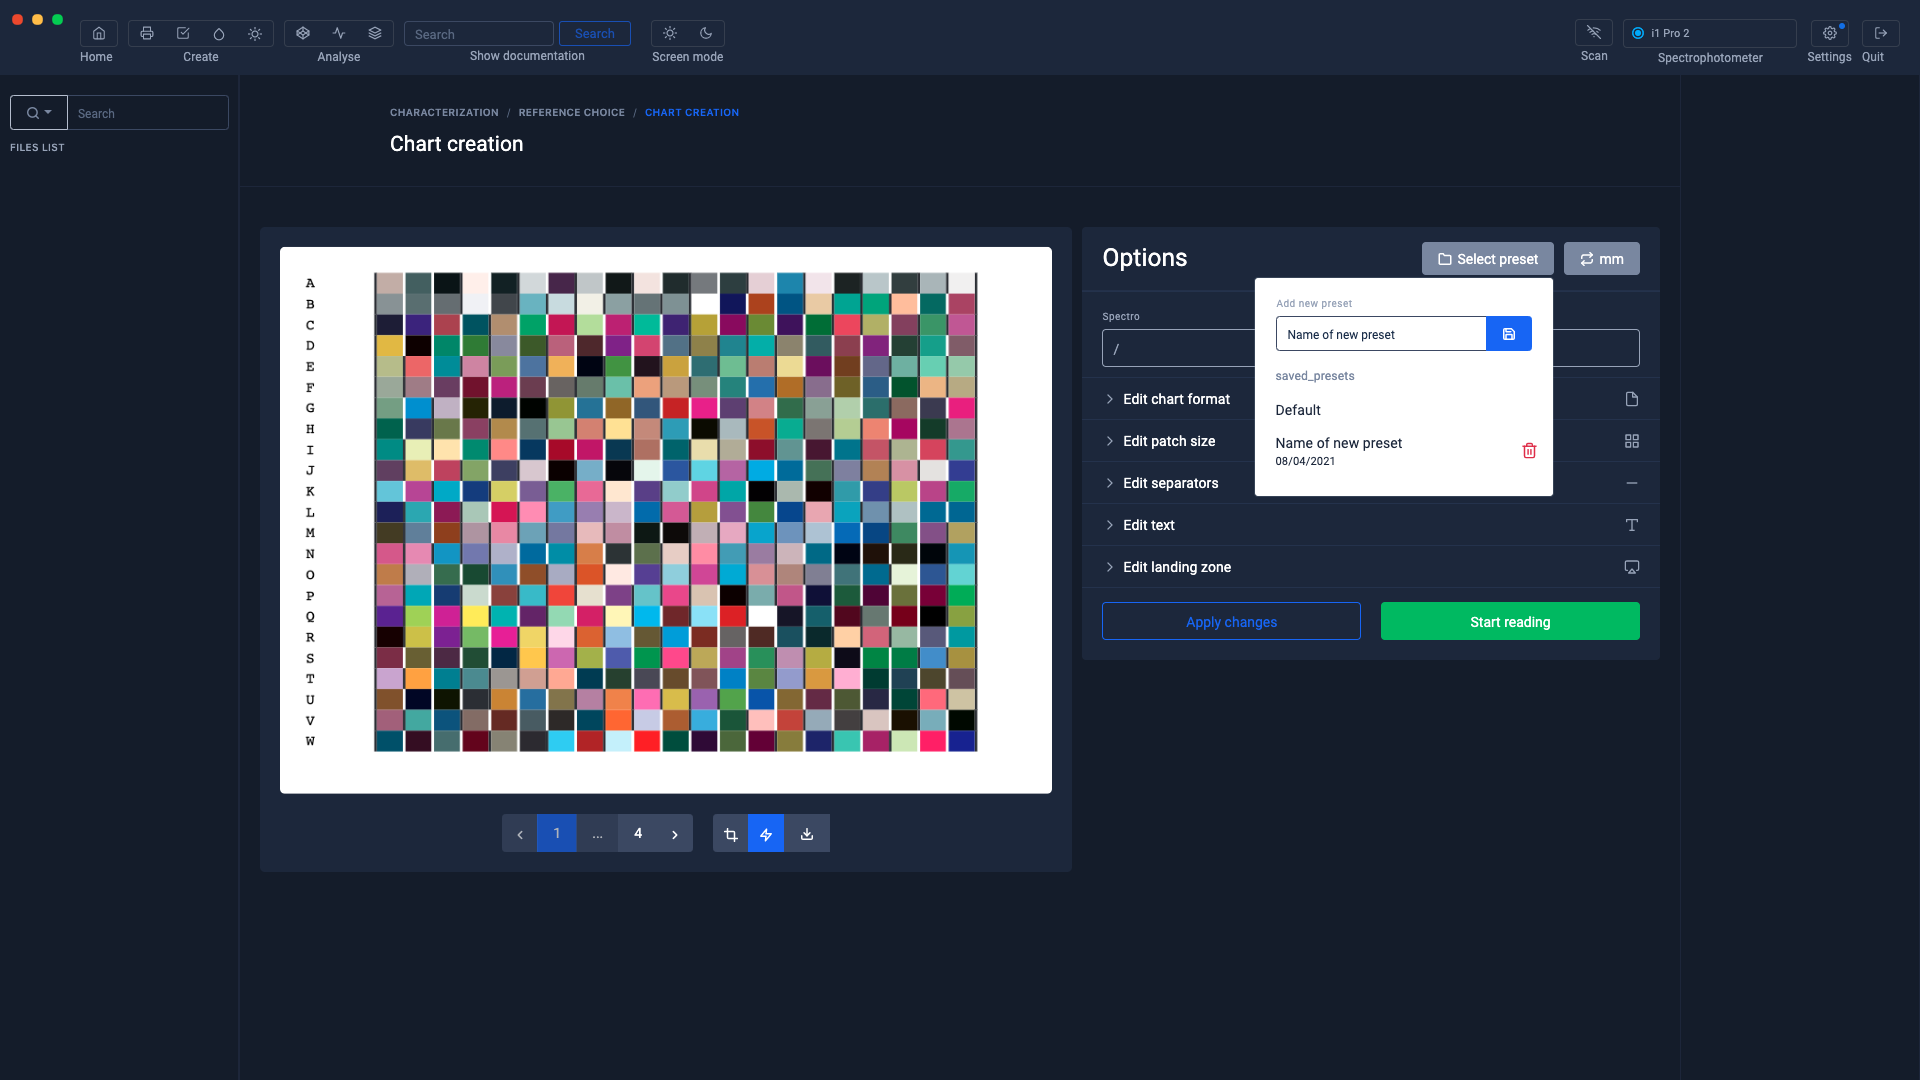
Save presets
If you want to reuse the pattern format for later measurement or because you regularly use a media format to create your profiles, it may be useful to save your pattern format.
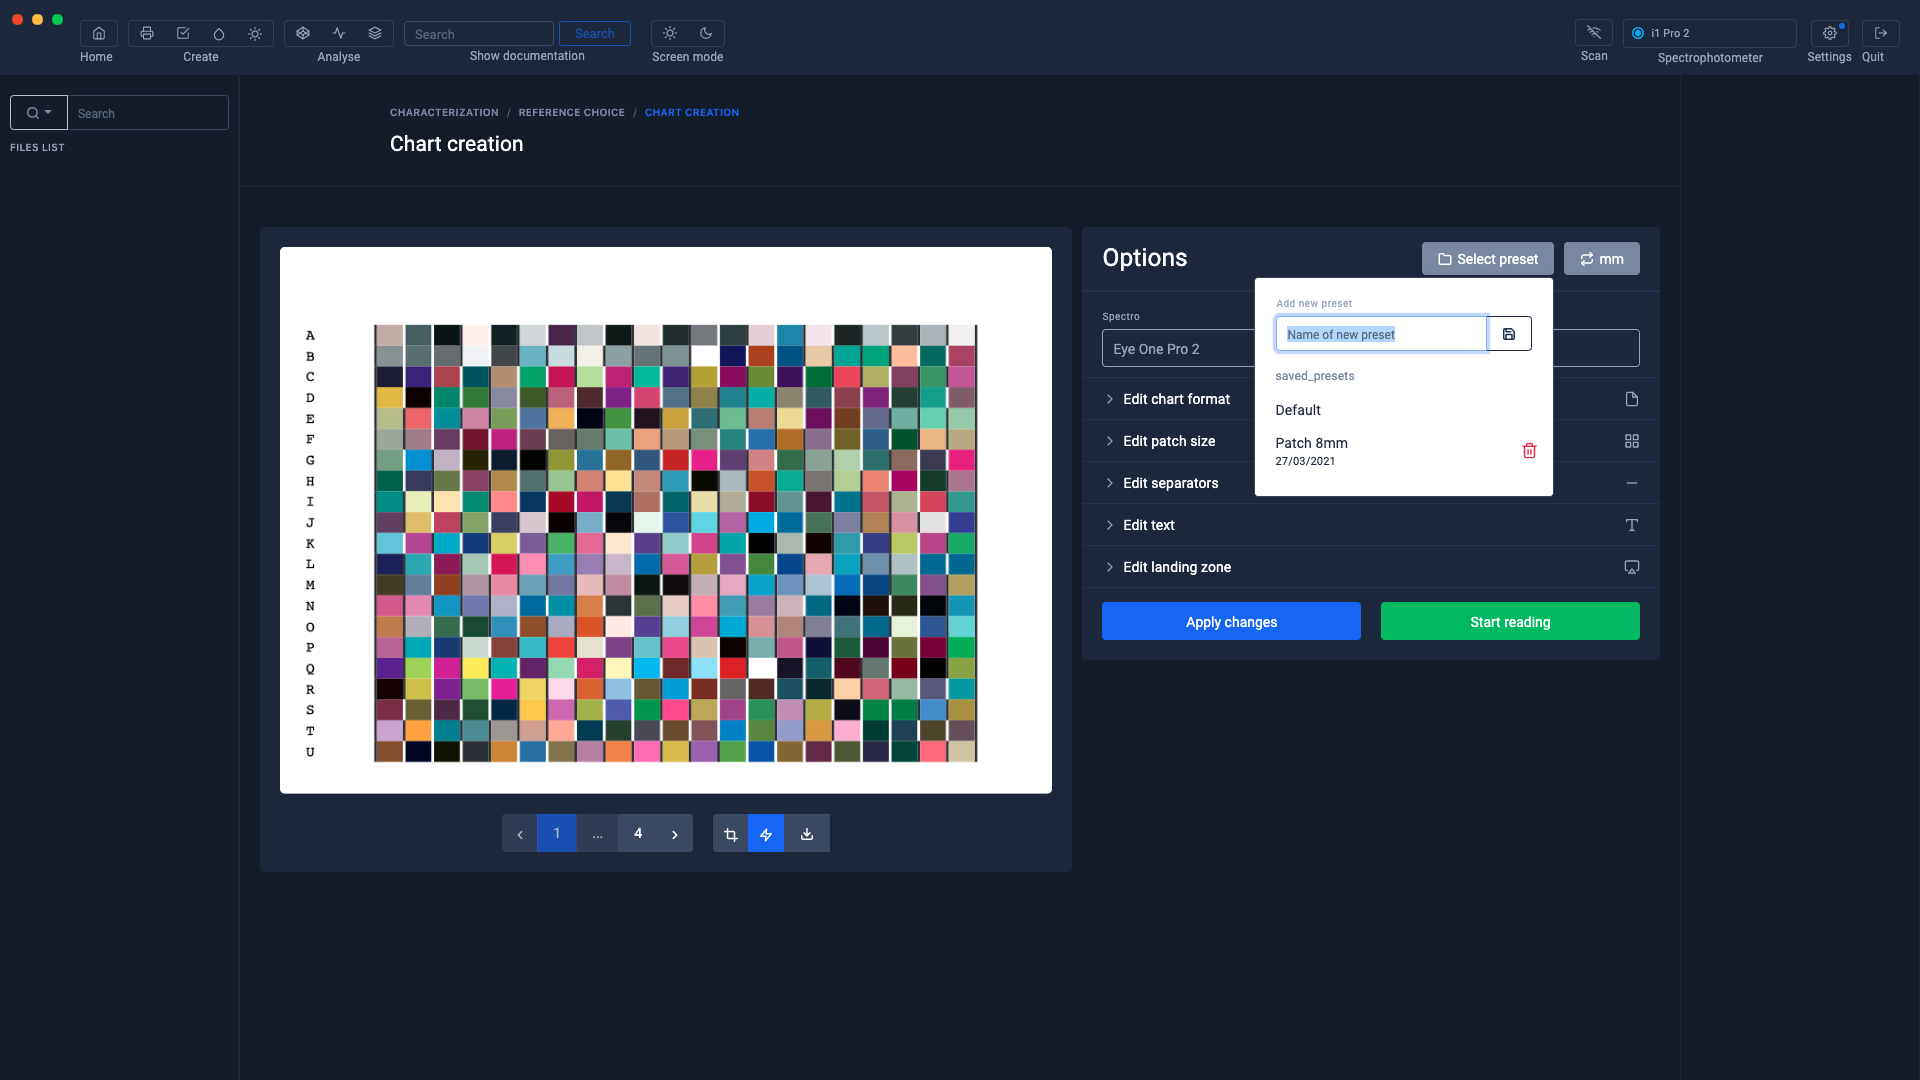
Once the preset is saved, you just have to select it when you load your test pattern. This will be formatted according to the settings you have defined.
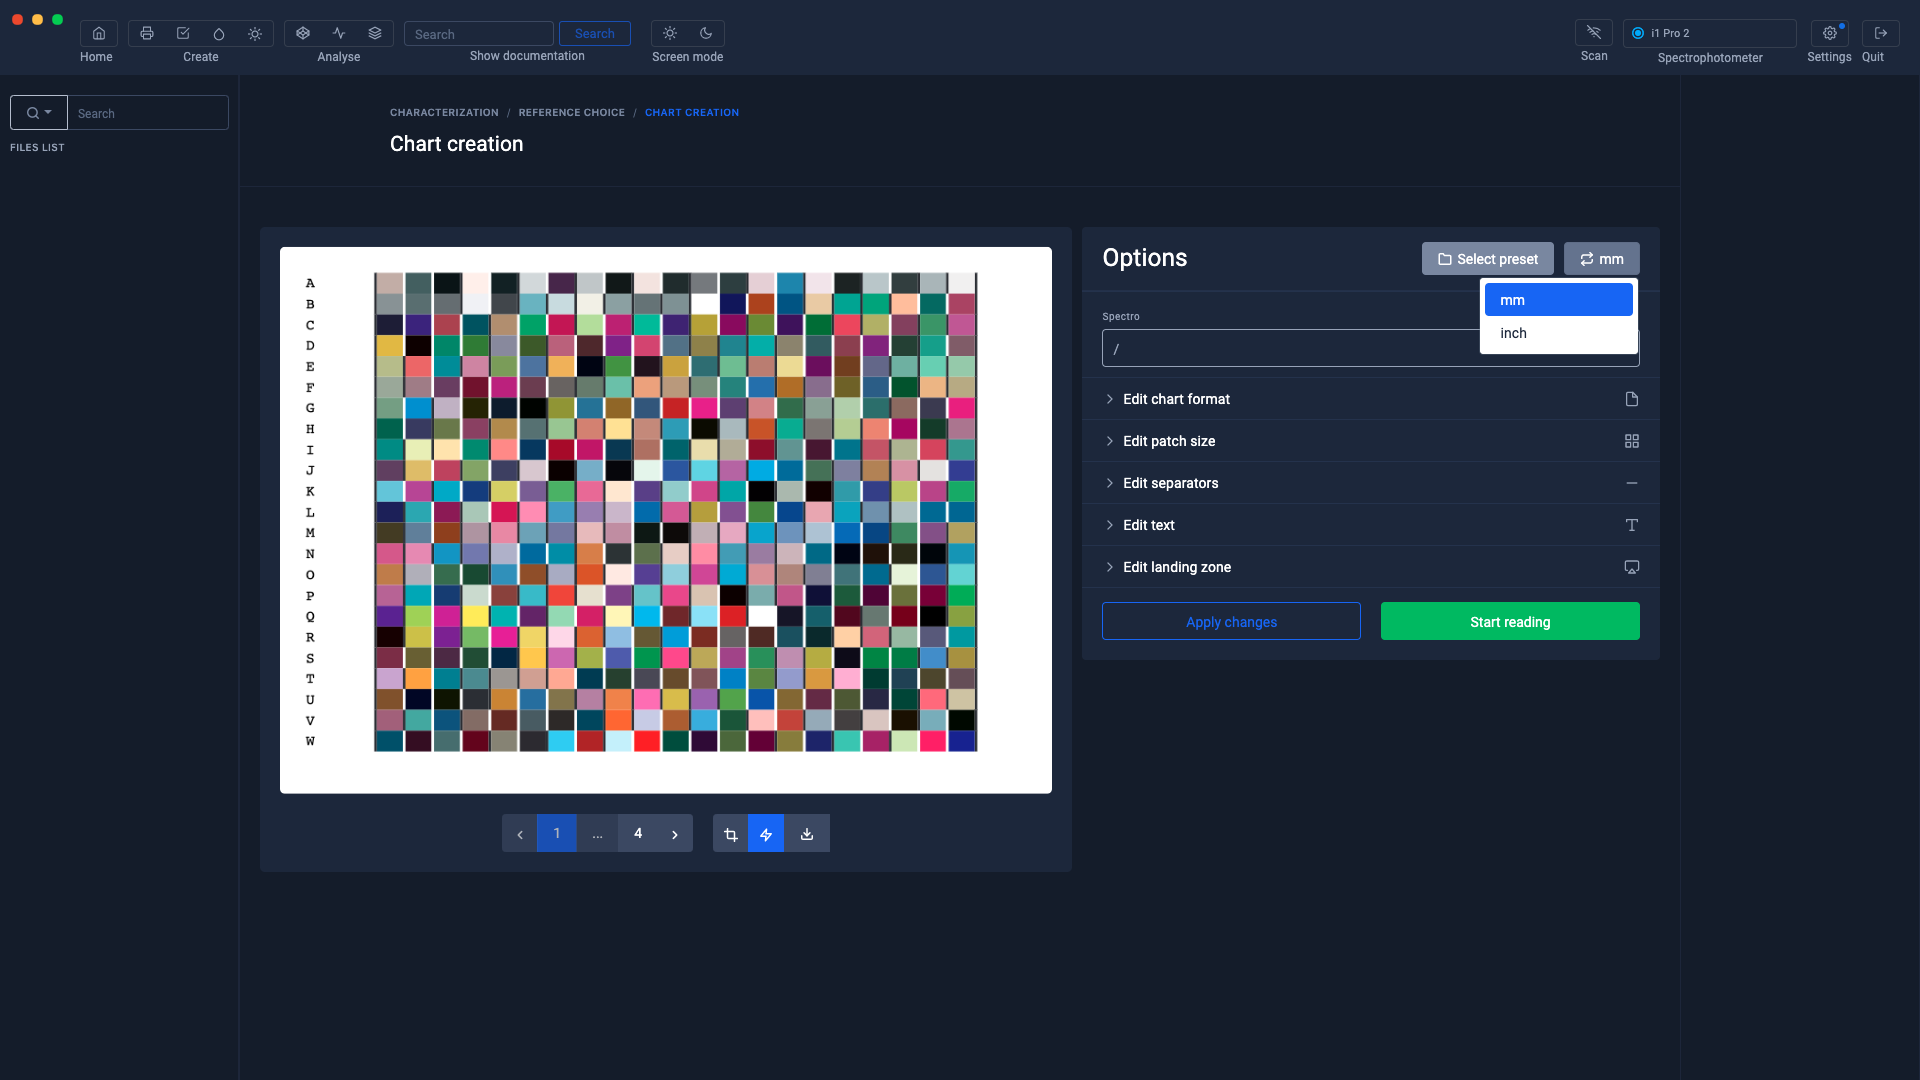
Millimeter / Inches selection
Do you prefer measurements in inches? no problem...
Apply the changes
The "Validate" button must be selected to apply the new settings.
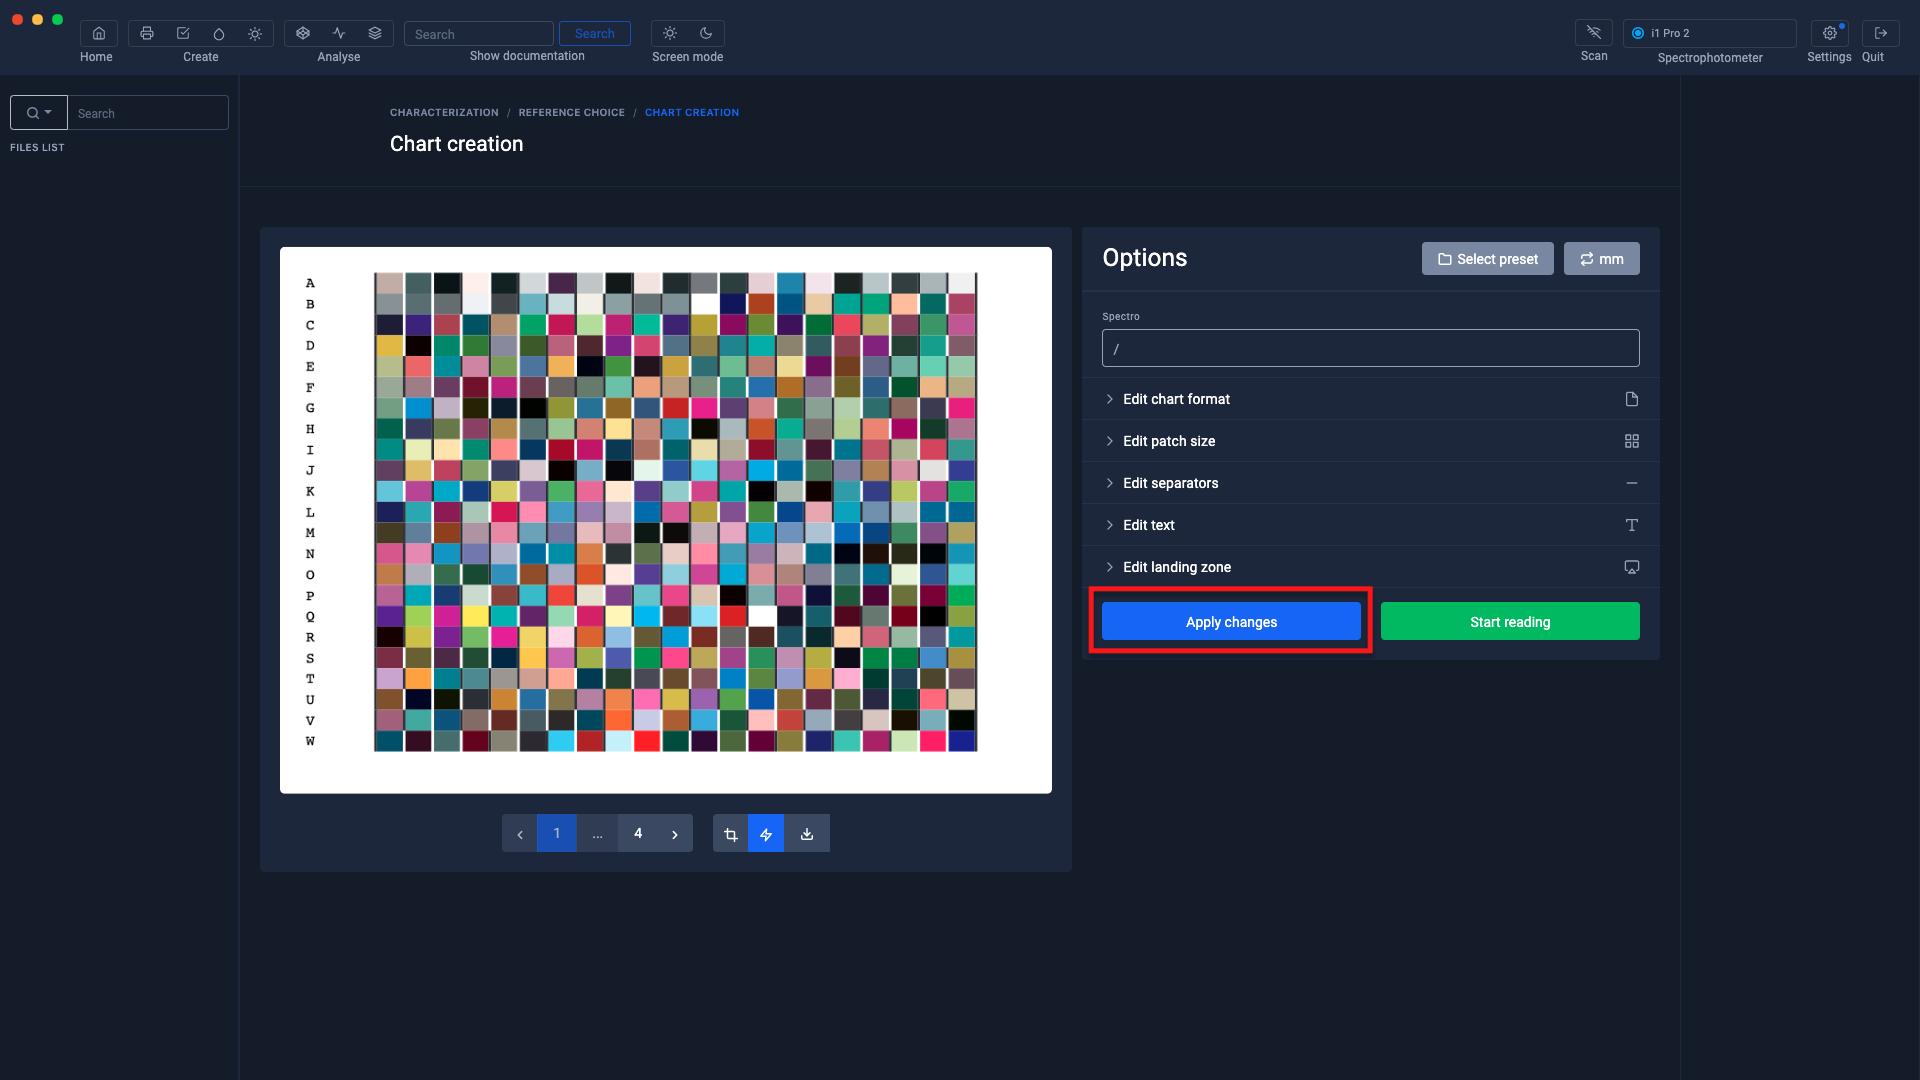
Once your test chart will be adjusted according to your needs, don't forget to save it in Tiff or pdf format in order to print it and then measure it.
To find out more, see the chapter: Creating a profile from a standard test pattern
Importing a measurement file made with the XRite I1 Profiler software
If you use an XRite spectrophotometer (I1 Pro, I1 Pro 2, I1 Pro 3 & 3+ or an IO table) that does not have the licenses to calculate the profiles, you still have the option of using the XRite I1 software Profiler to create and then measure RGB or CMYK ranges.
Once the measurement of the range has been carried out, all you have to do is export the measurement file in Coraye to calculate it in our CMYK Profiler or RGB Profiler modules.

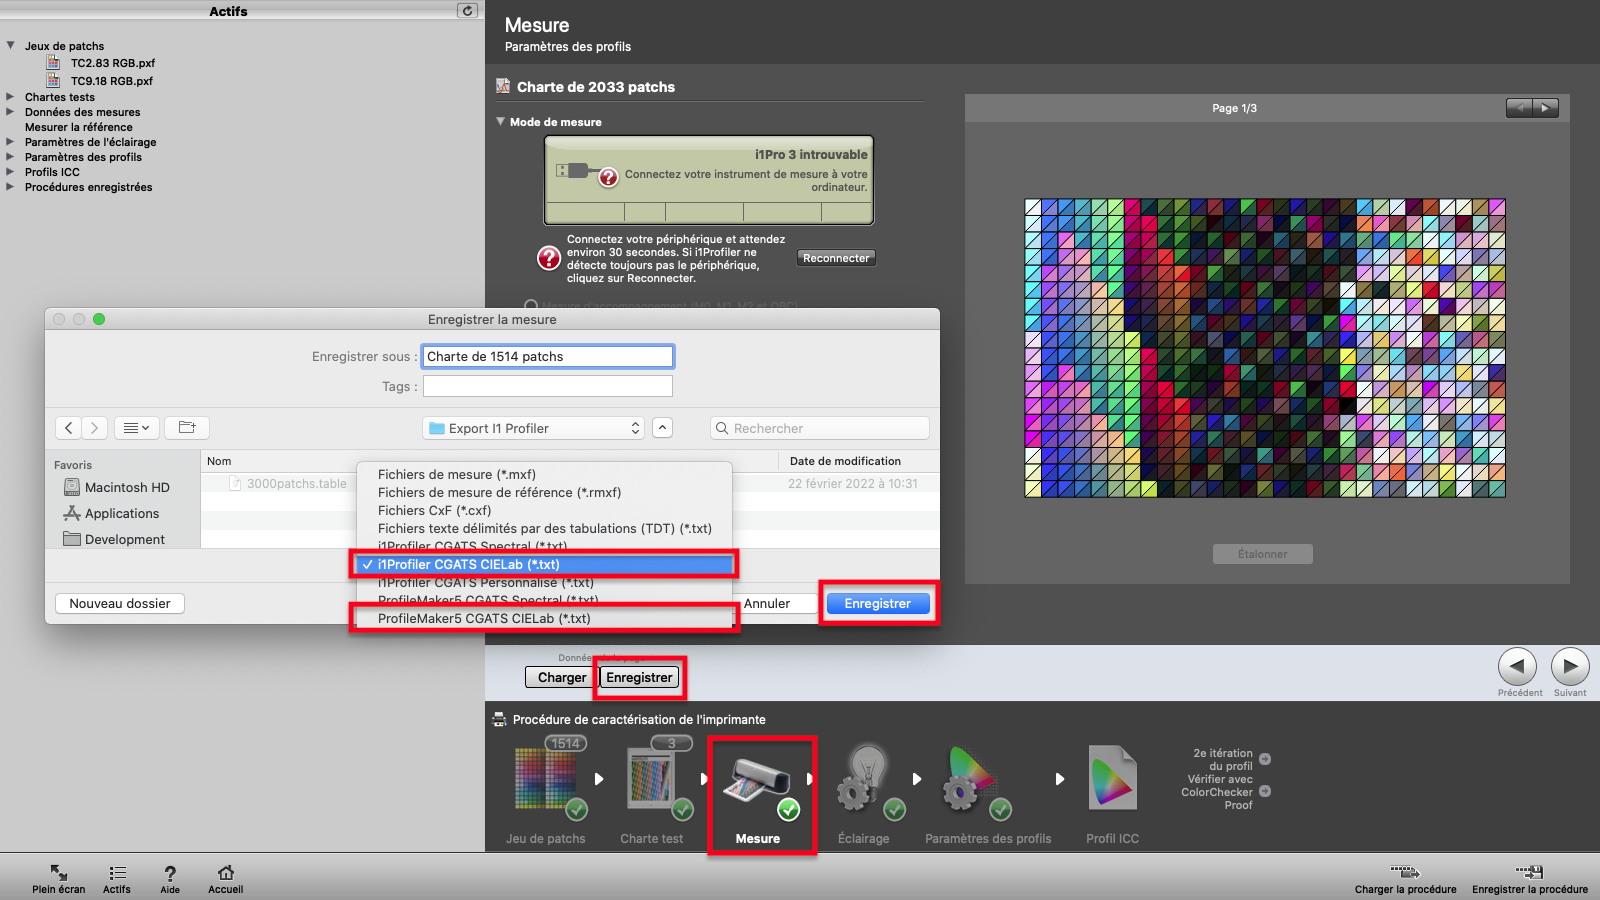
Export of the measurement file in CGATS CIELab.txt format
In the XRite I1 Profiler software, when you have finished measuring the gamut for creating an RGB or CMYK profile, save your file containing the measurements.
To be compatible with the Coraye software, the files must be saved, in the folder of your choice, in the formats:
- I1 Profiler CGATS CIELab (*.txt)
- ProfileMaker5 CGATS CIELab (*.txt)
Importing the CGATS CIELab file (*.txt) into Coraye
This feature requires that you have the Coraye RGB Profiler and/or CMYK Profiler licenses, depending on the type of RGB or CMYK profile you want to create.
1) Launch the profile creation module, then click on the "Create a characterization" button
2) Choose the profile mode corresponding to the mode in which the staff measurement was performed on the XRite I1 Profiler software.
In our example the target chosen is in RGB mode, so we will select RGB mode.
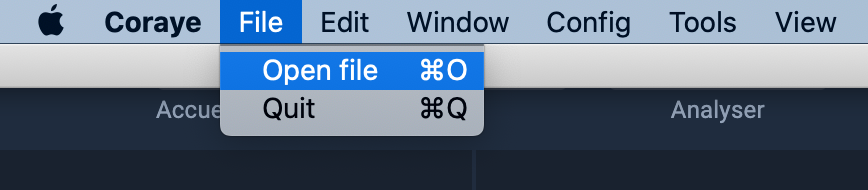
3) Import of the CGATS CIELab file (.txt) made in XRite I1 Profiler.
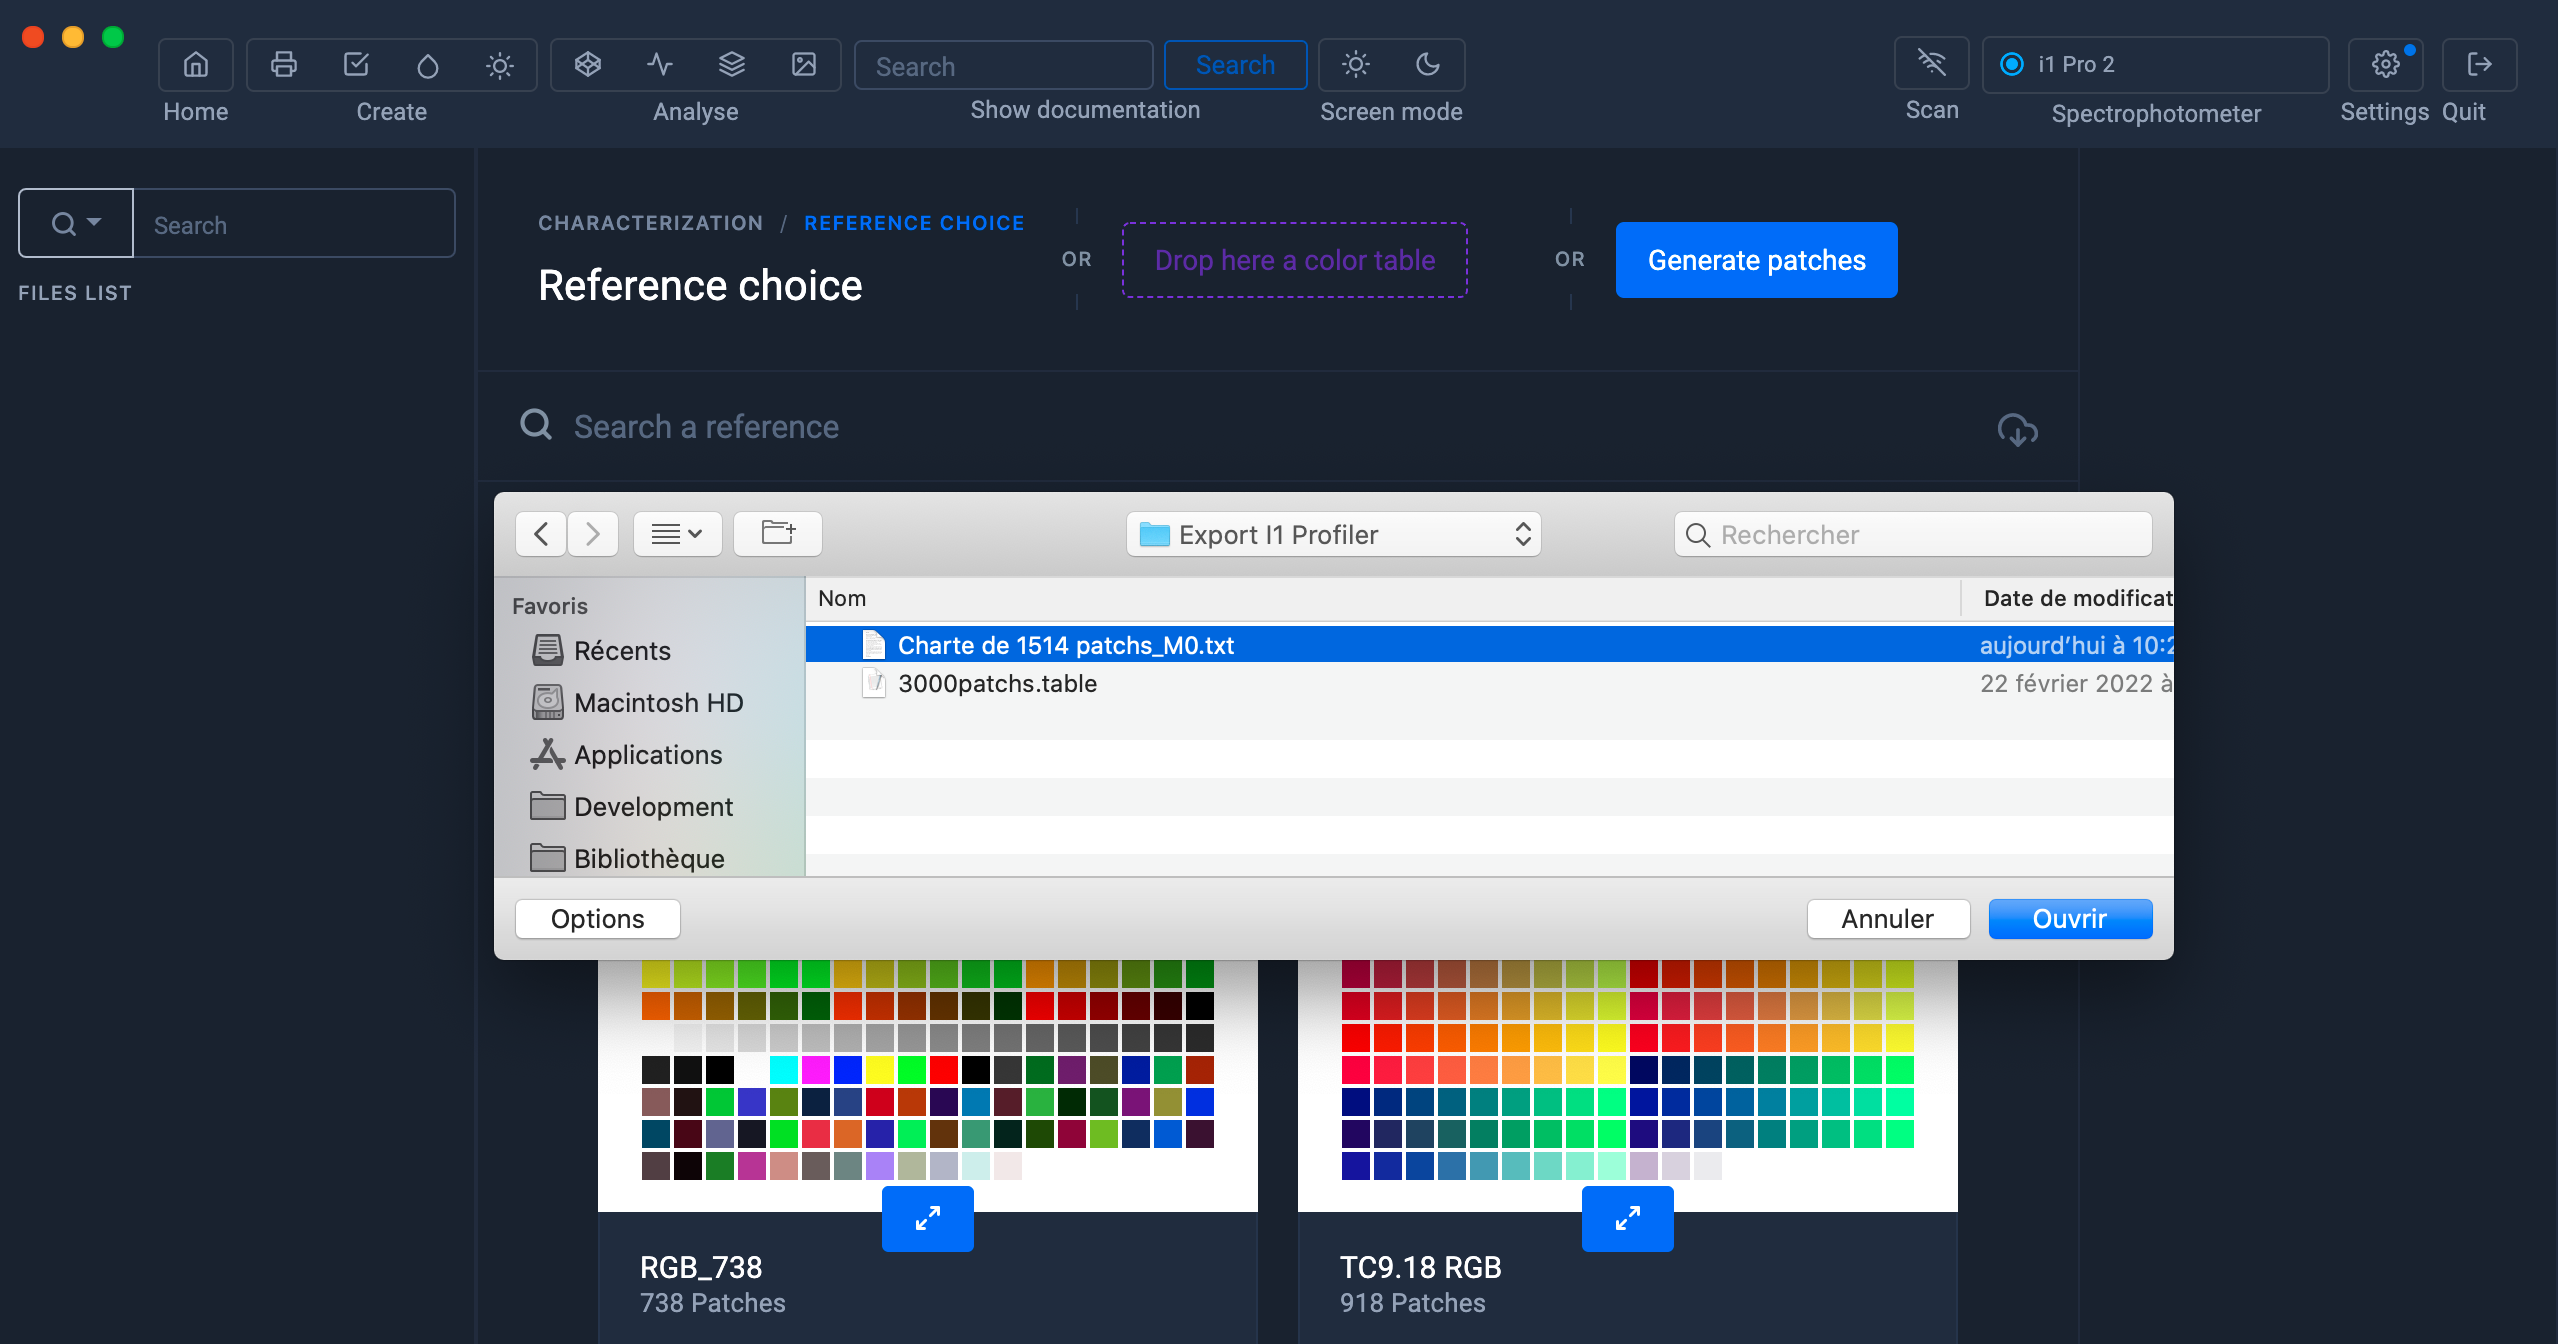
File > Open file
 Then navigate to the folder containing the measurement file, select it then click on the "Open" button to make it appear in the left column.
4) Drag and drop the measurement file into the "Drop here a color table" area
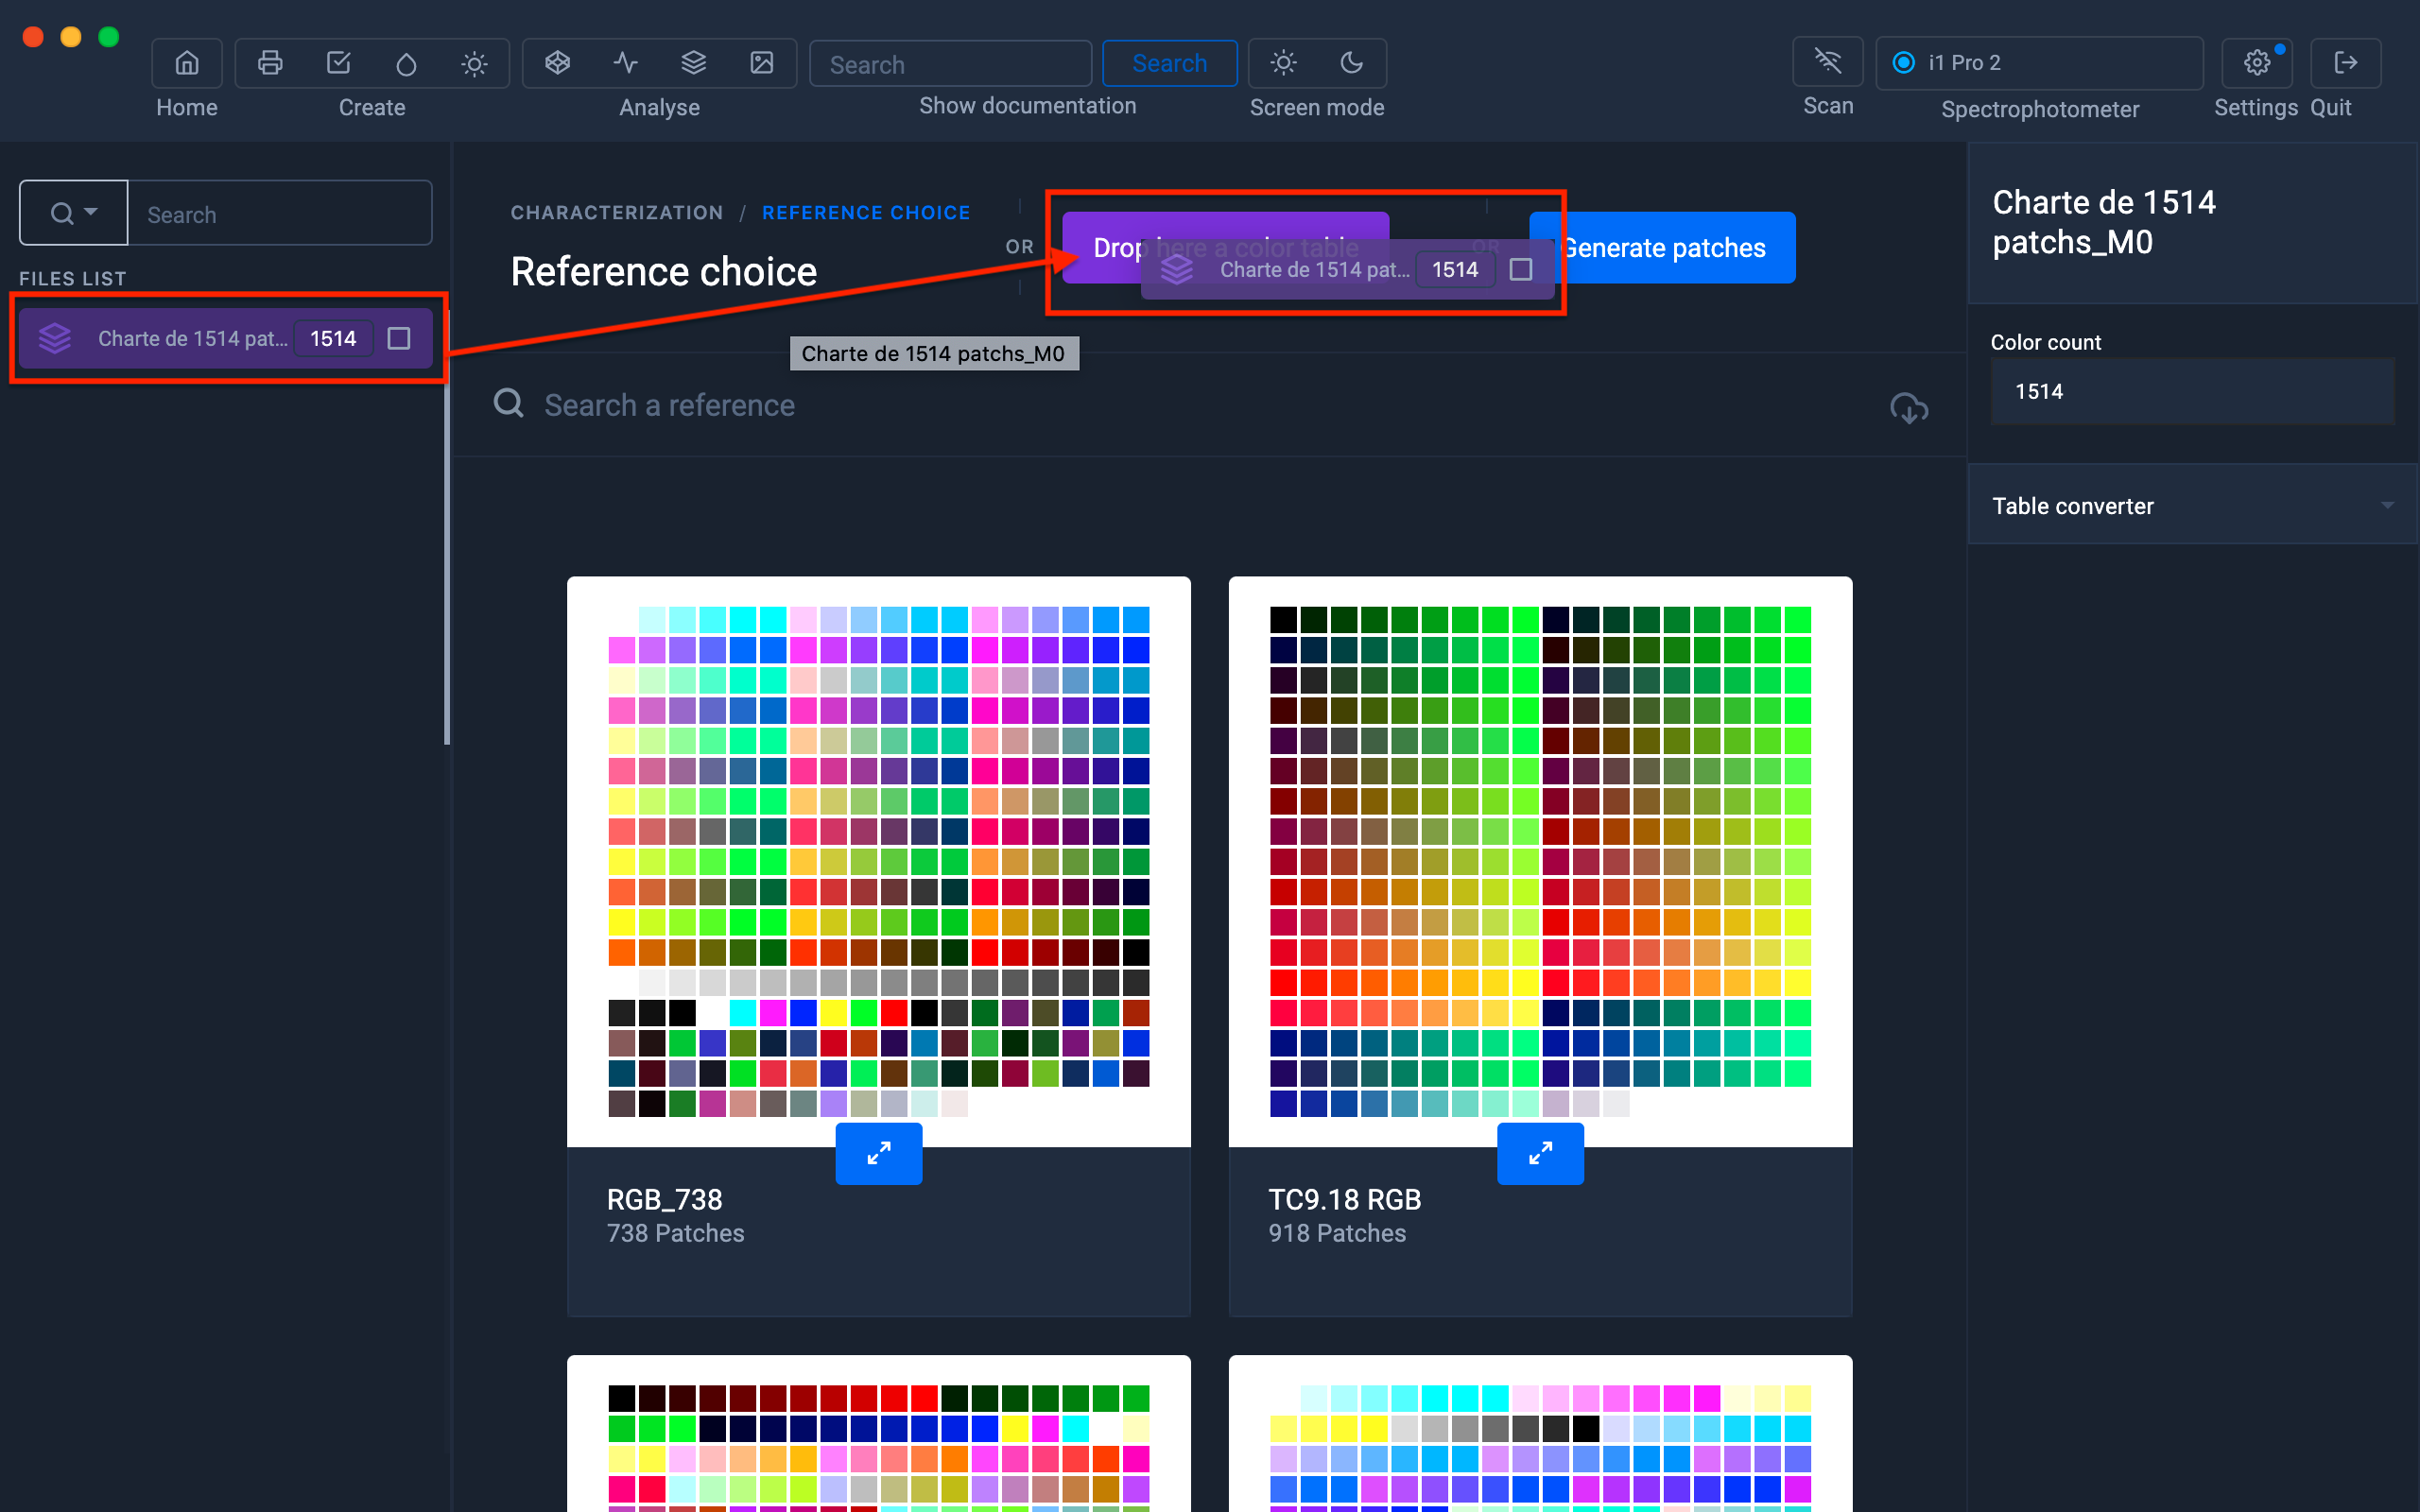
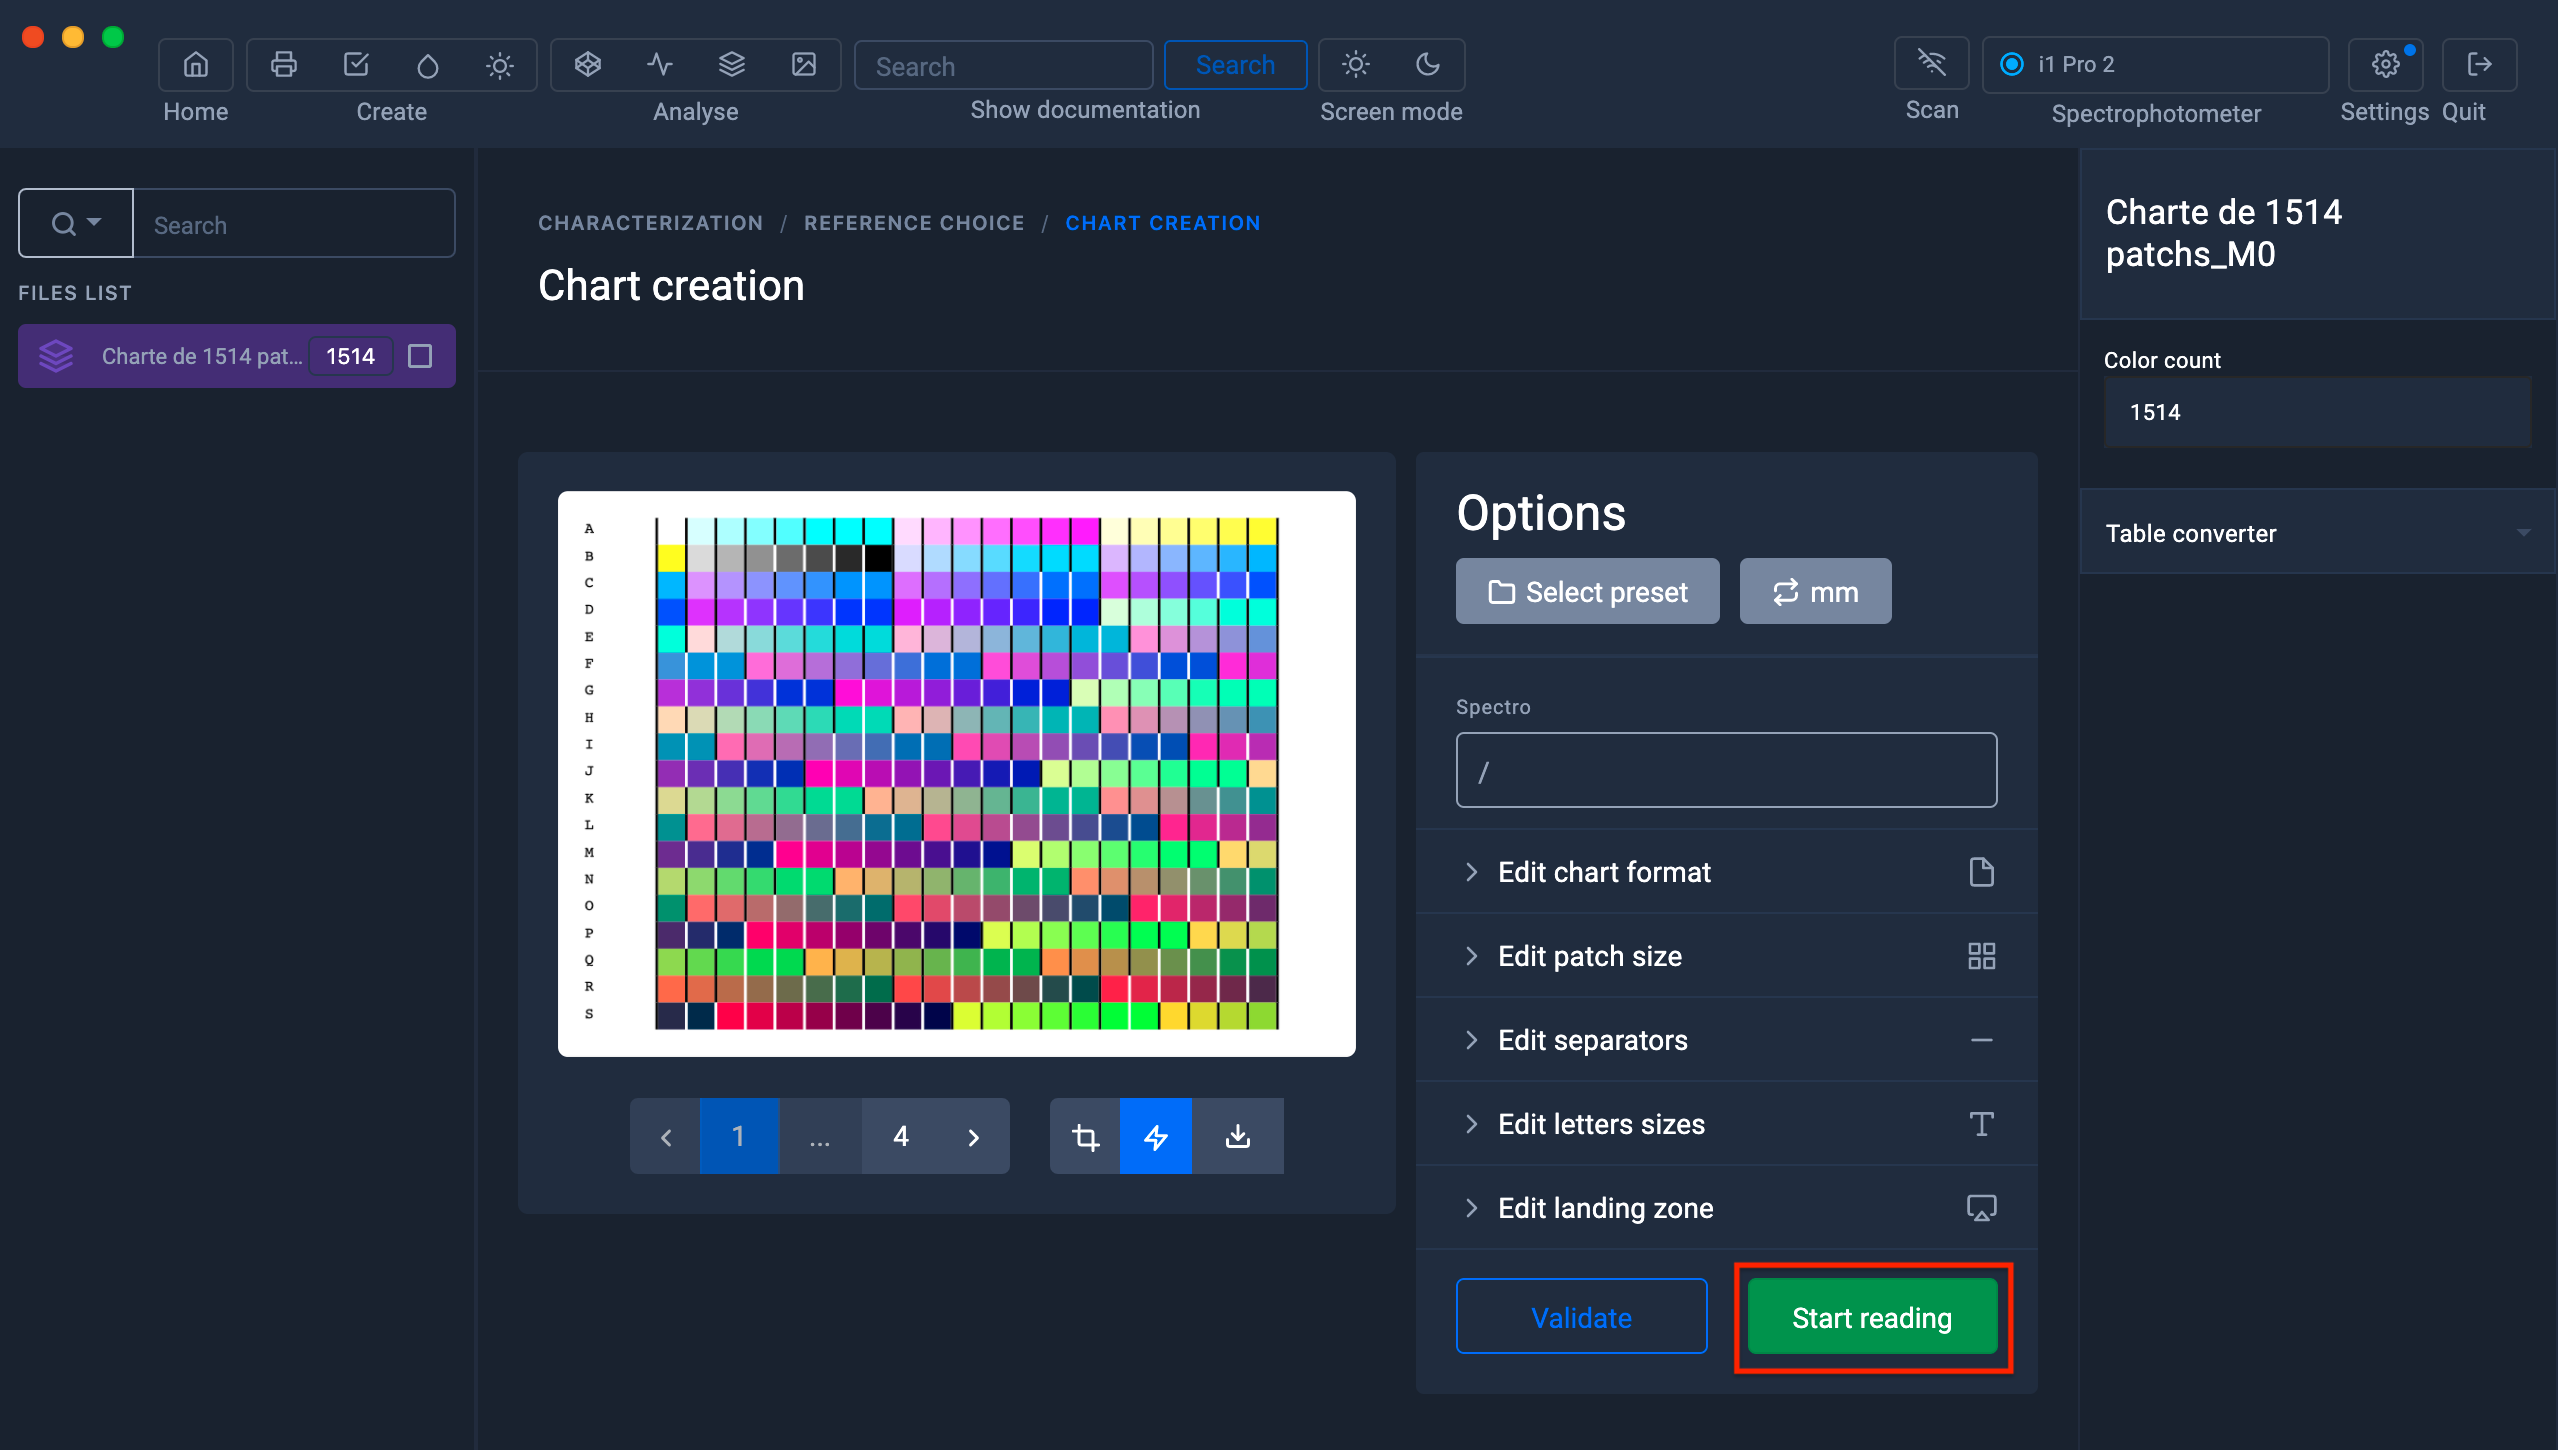
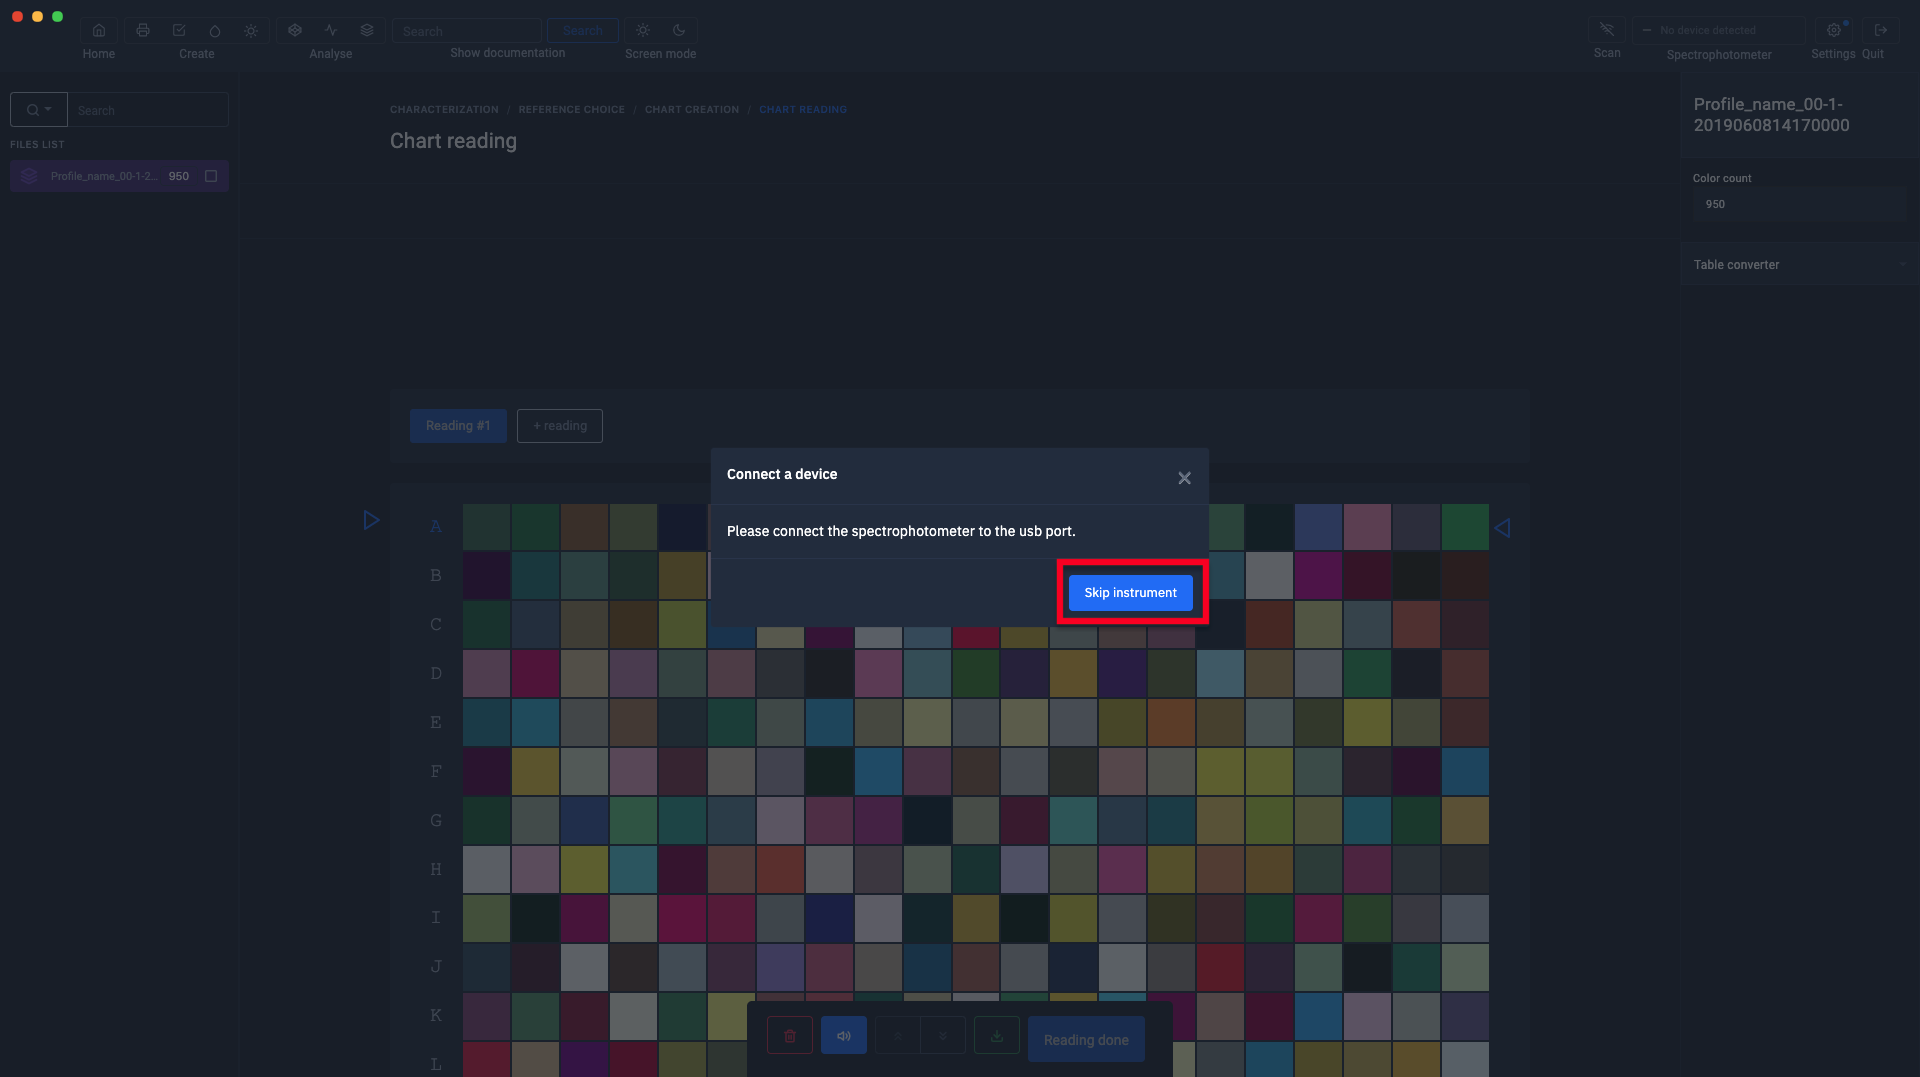
5) A preview of the chart is displayed, then click on the "Start reading" button
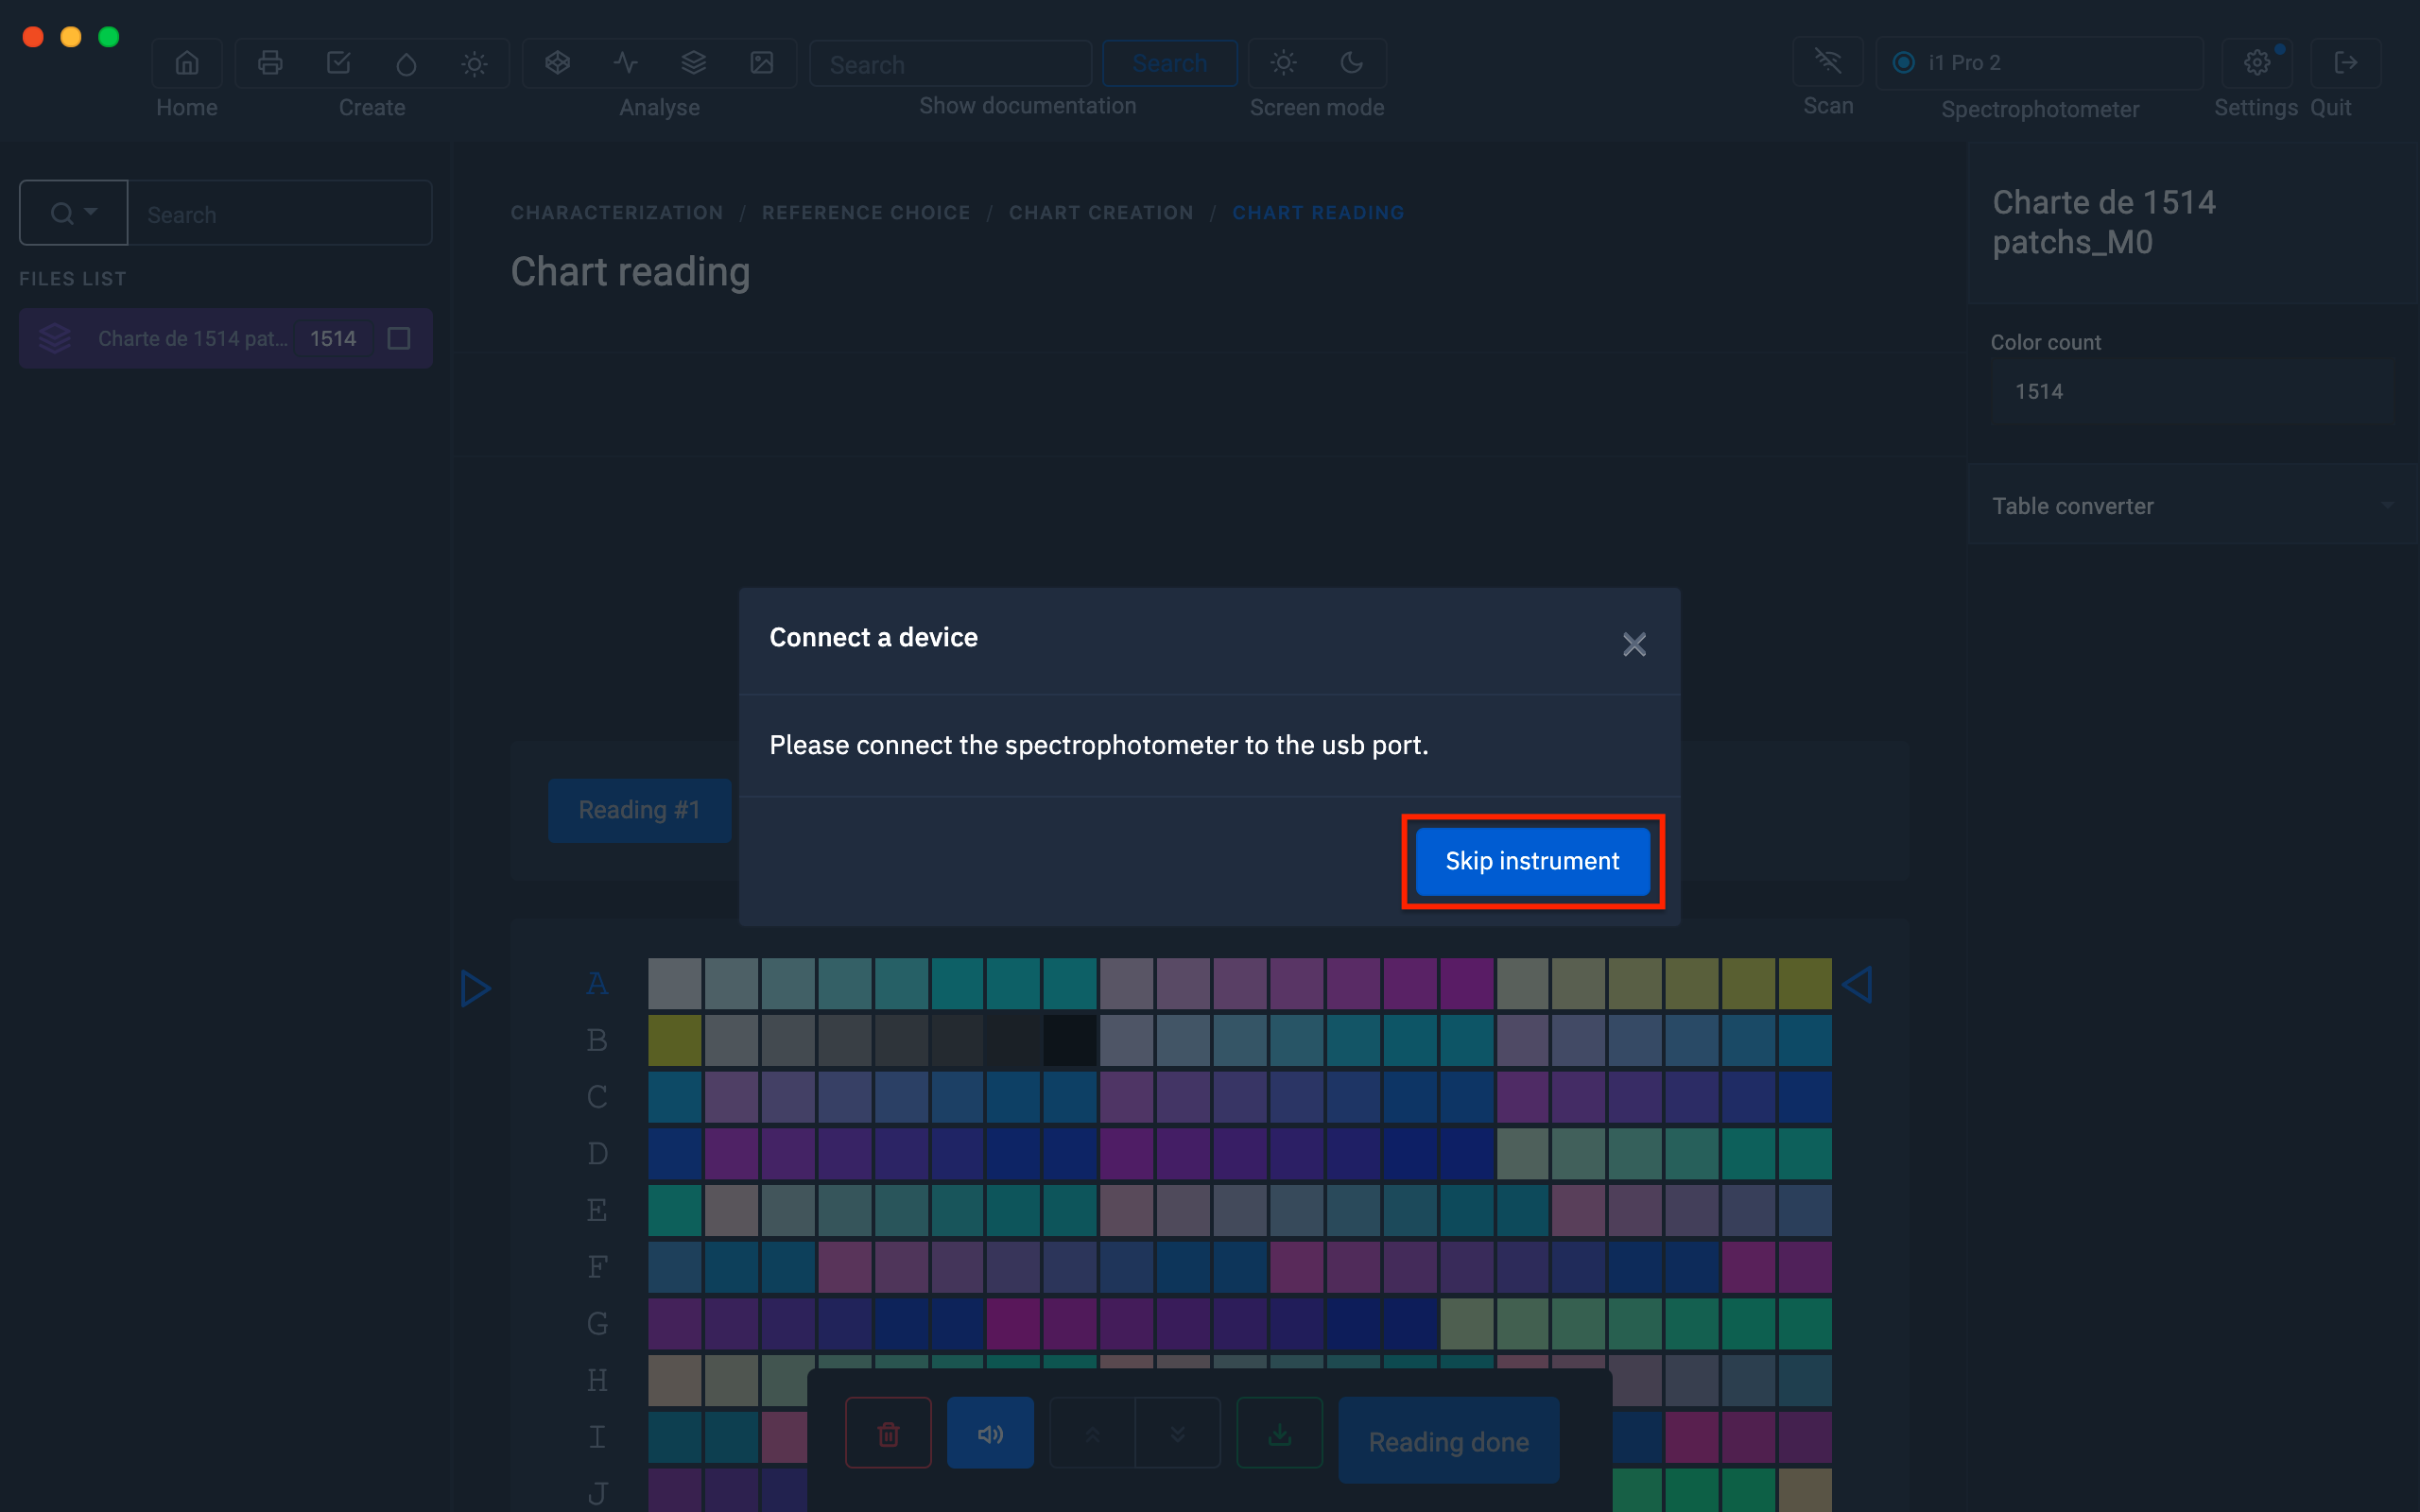
6) Disconnect the spectrophotometer to avoid spectro calibration procedures
Then click on the "Skip instrument" button.
7) When the range measurement window appears, "drag and drop" the file containing the measurements into the range measurement area.
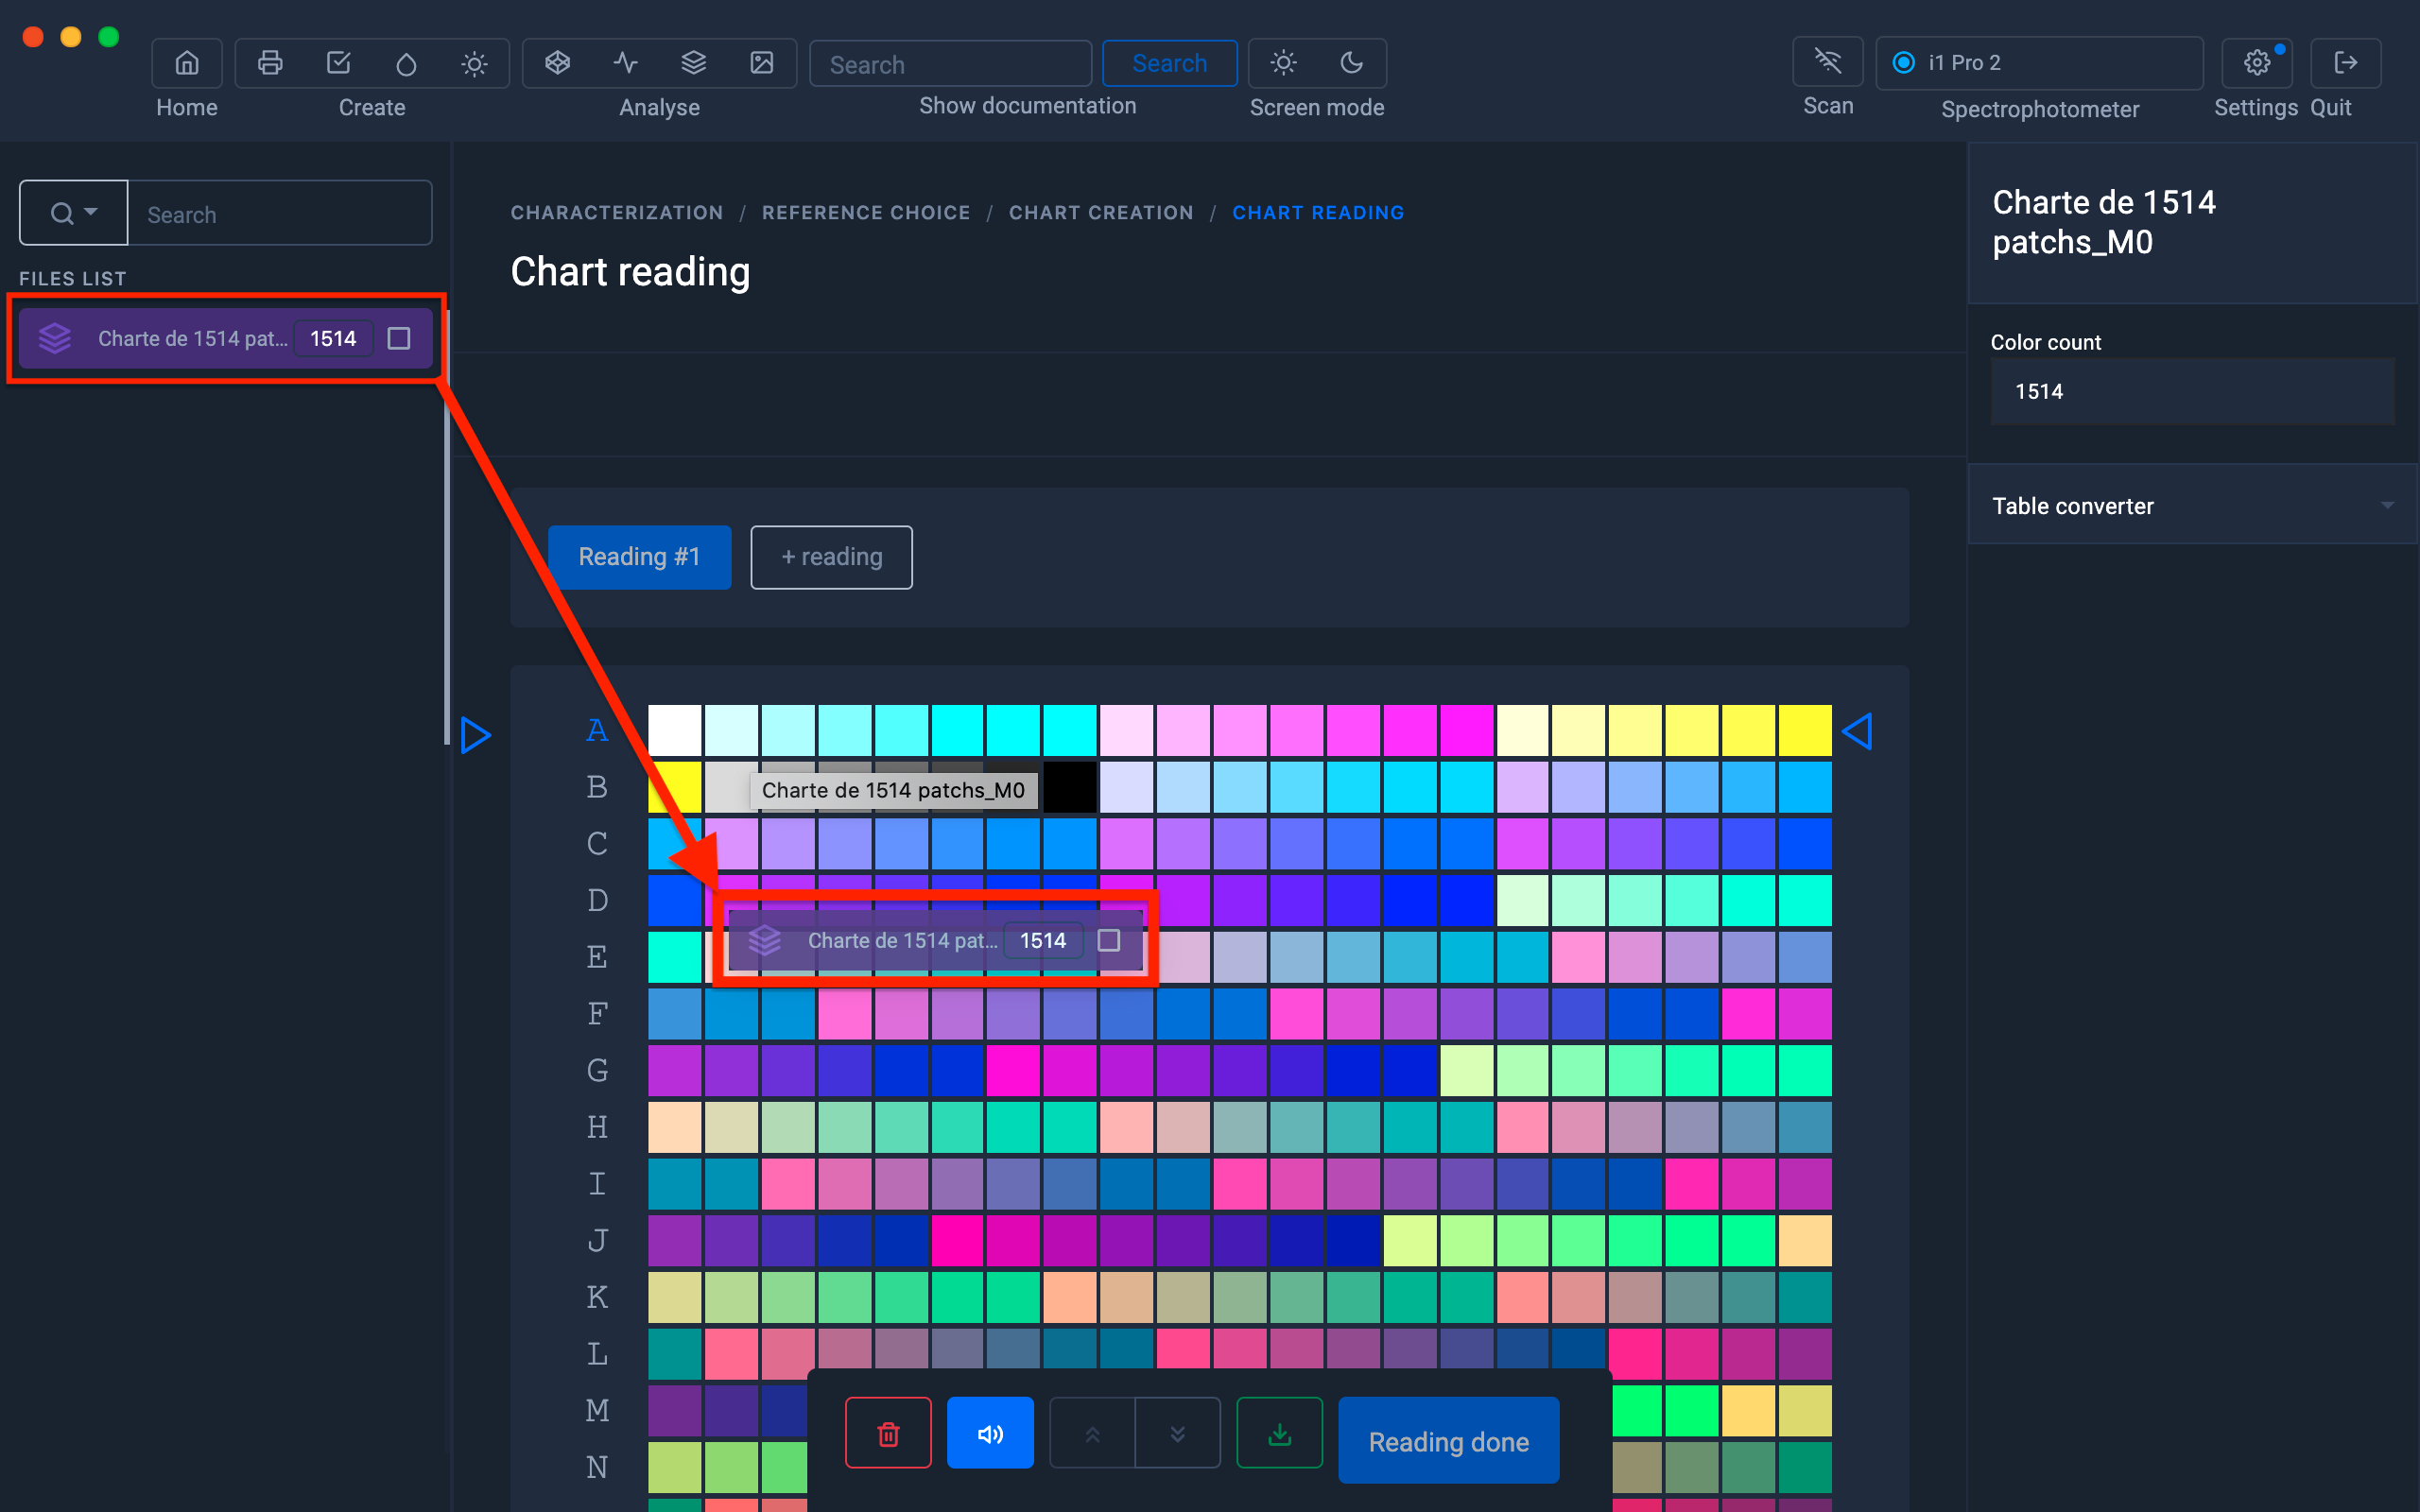
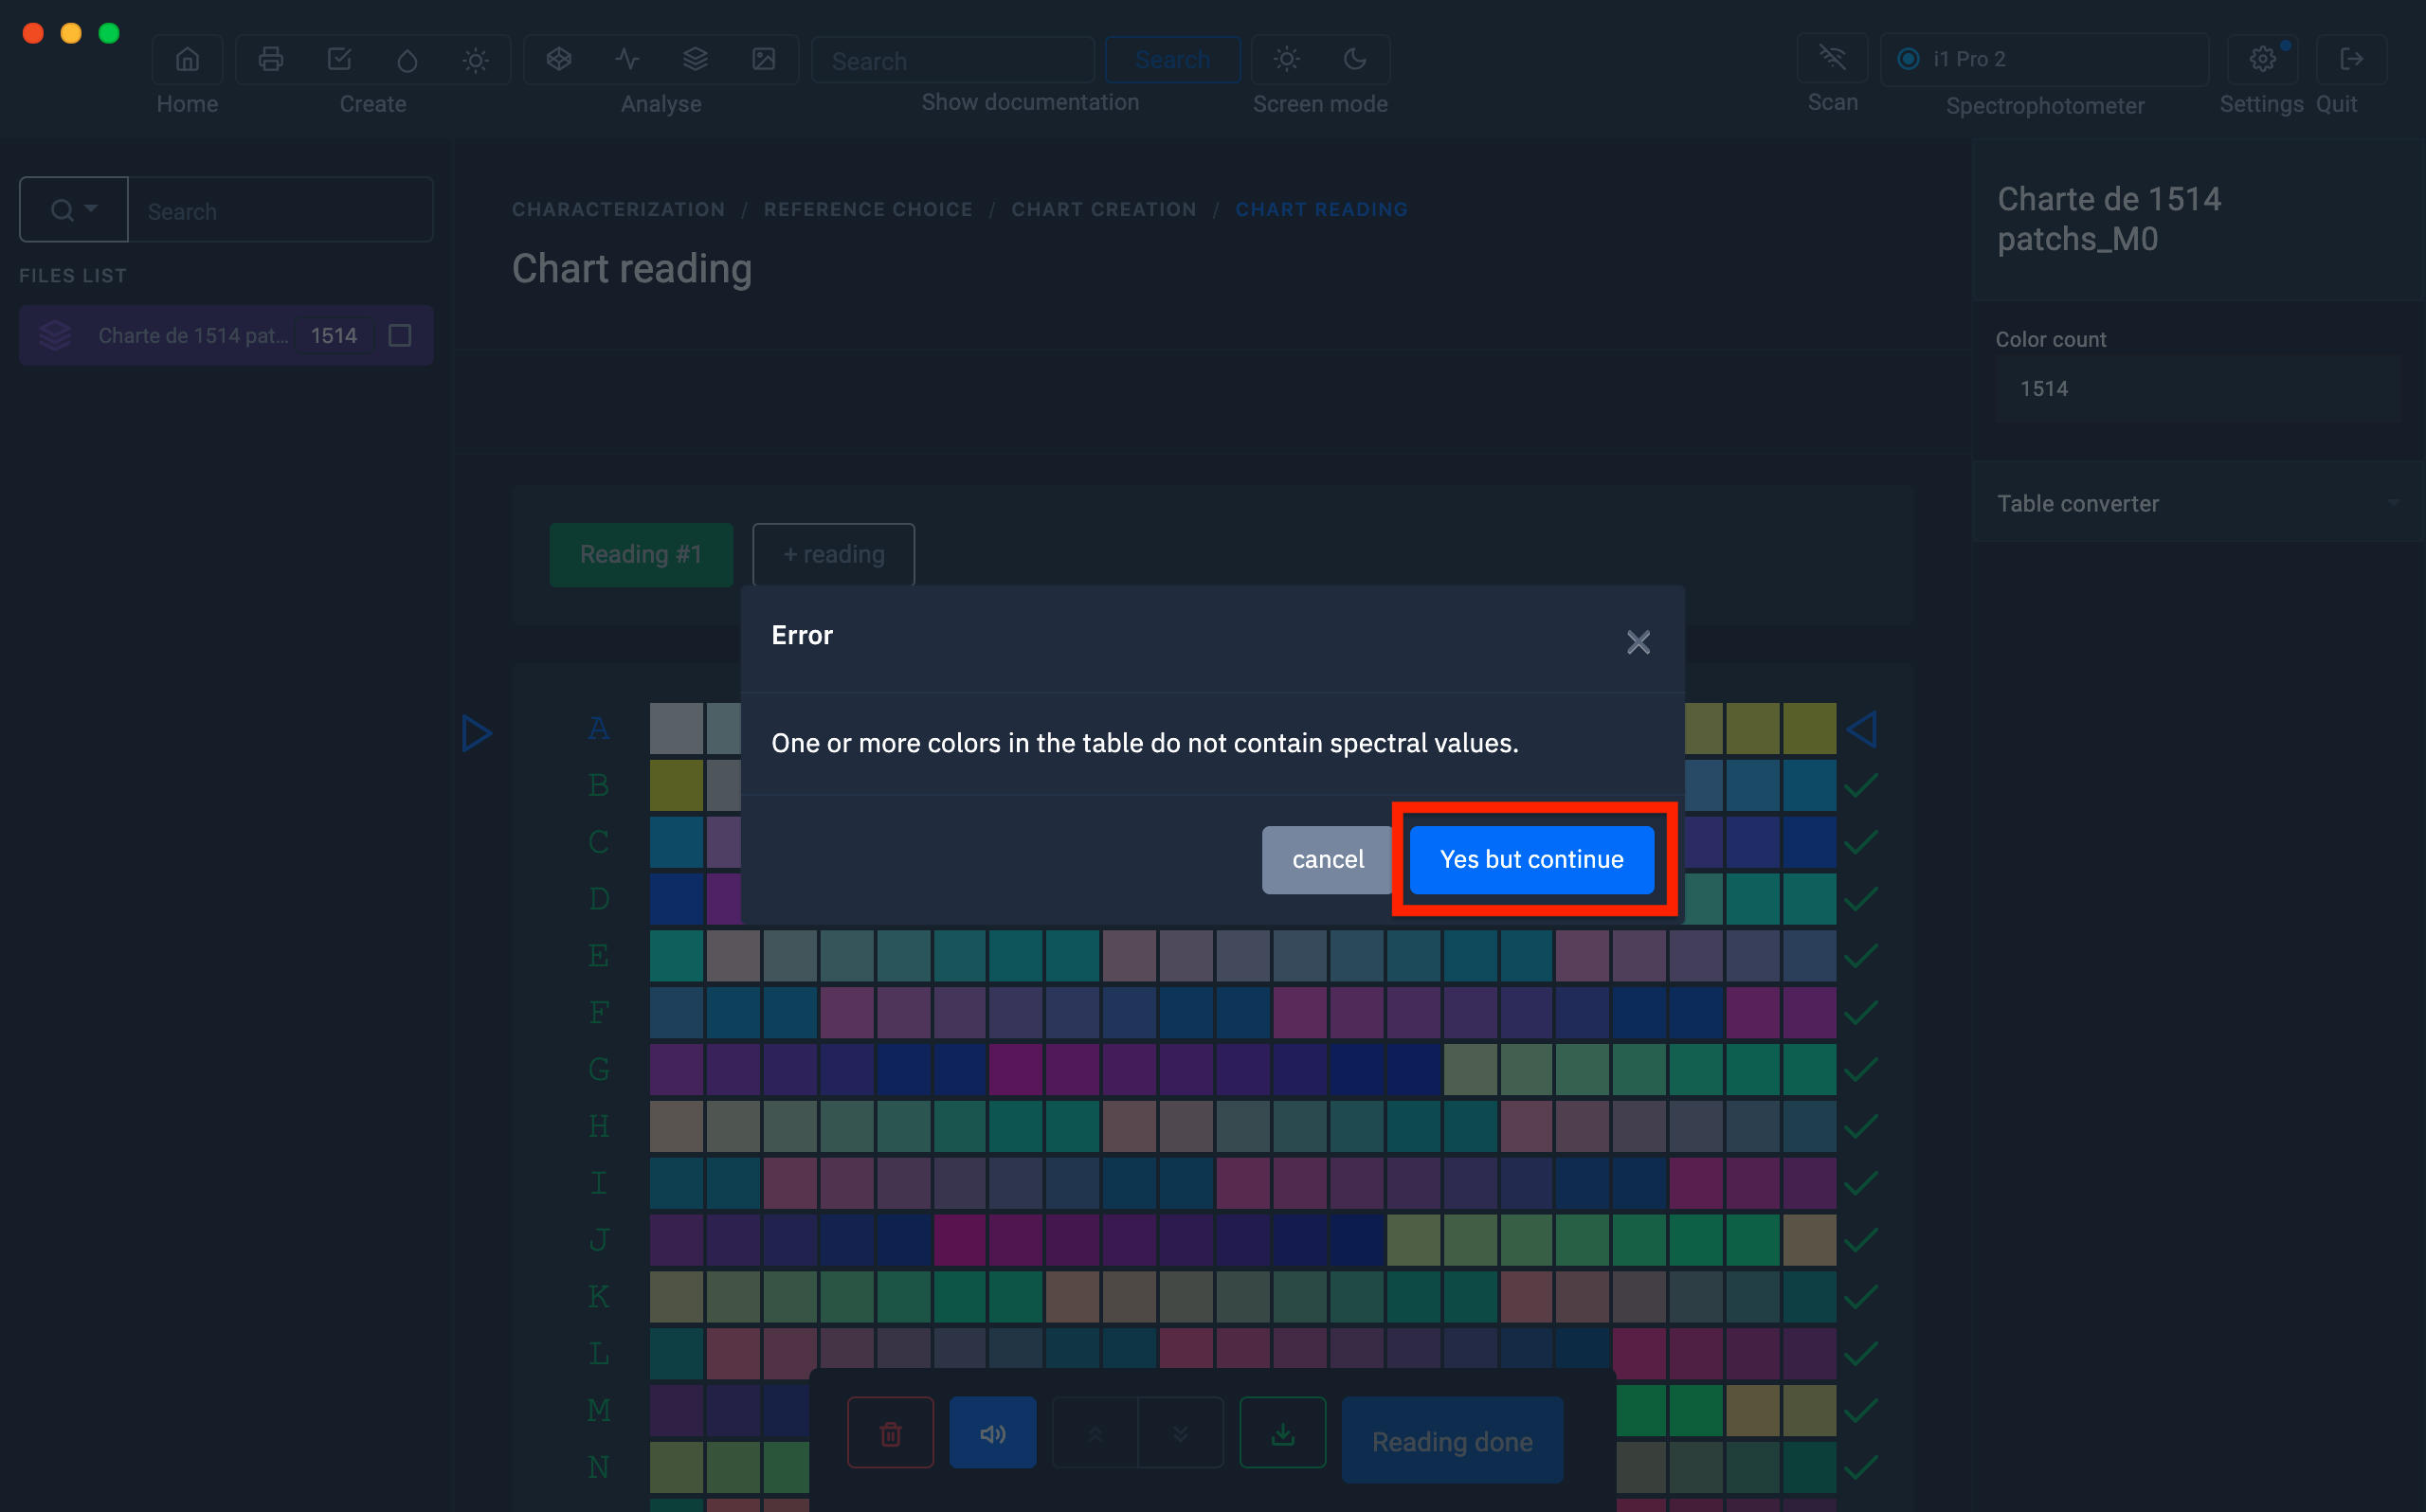
8) A message indicating that the spectral data is not present in the table appears.
Click on the "Yes but continue" button
The spectral values have already been converted to Lab in the I1 Profiler software

Click on the "Yes but continue" button
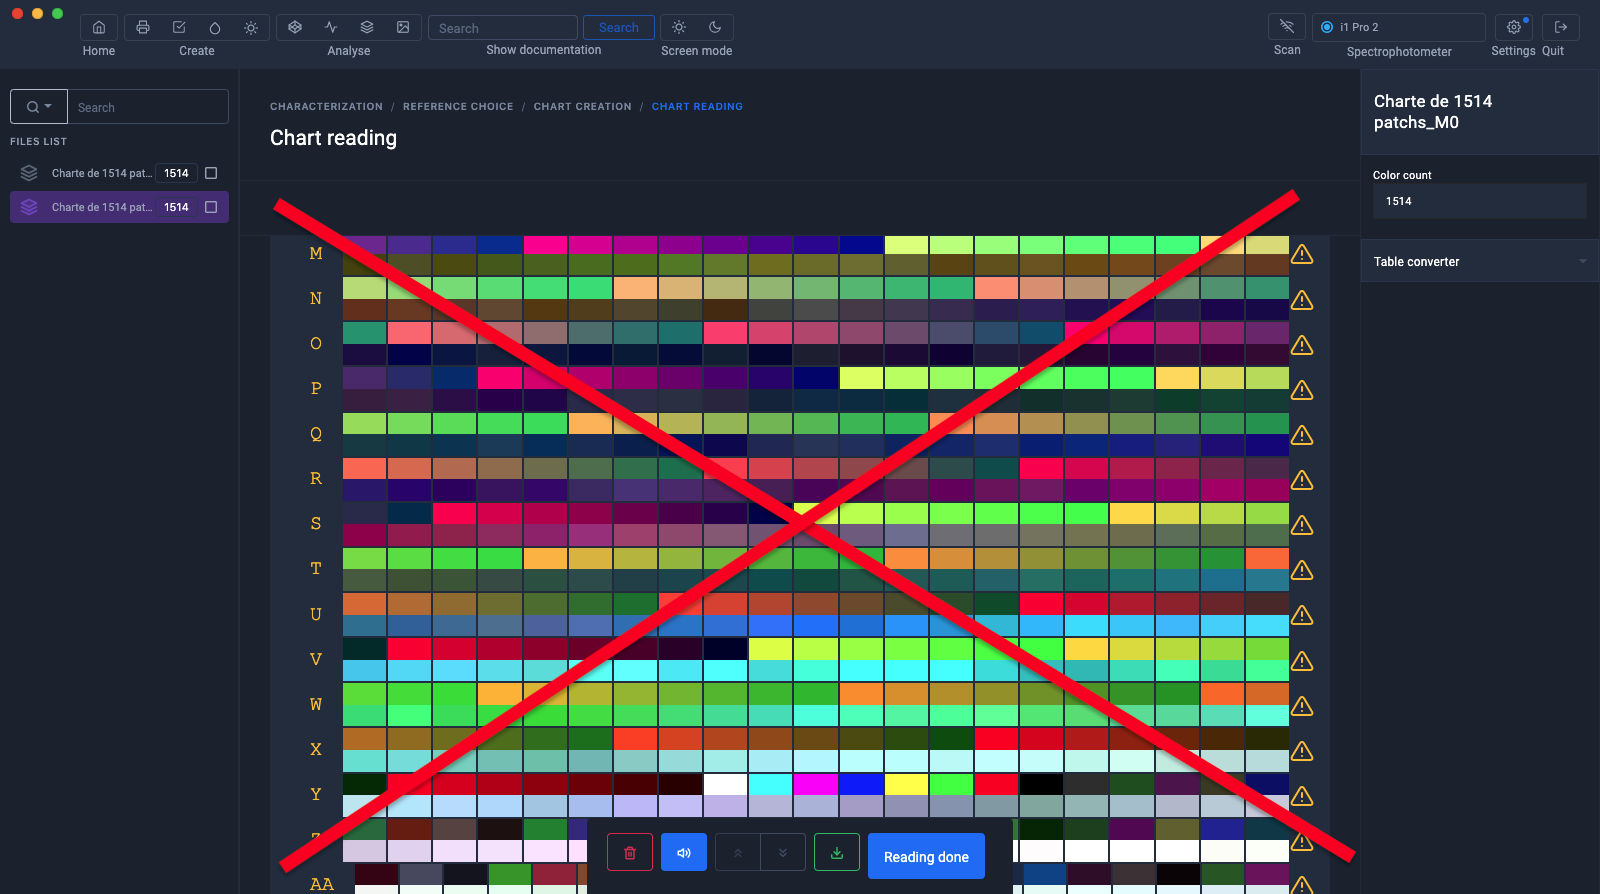
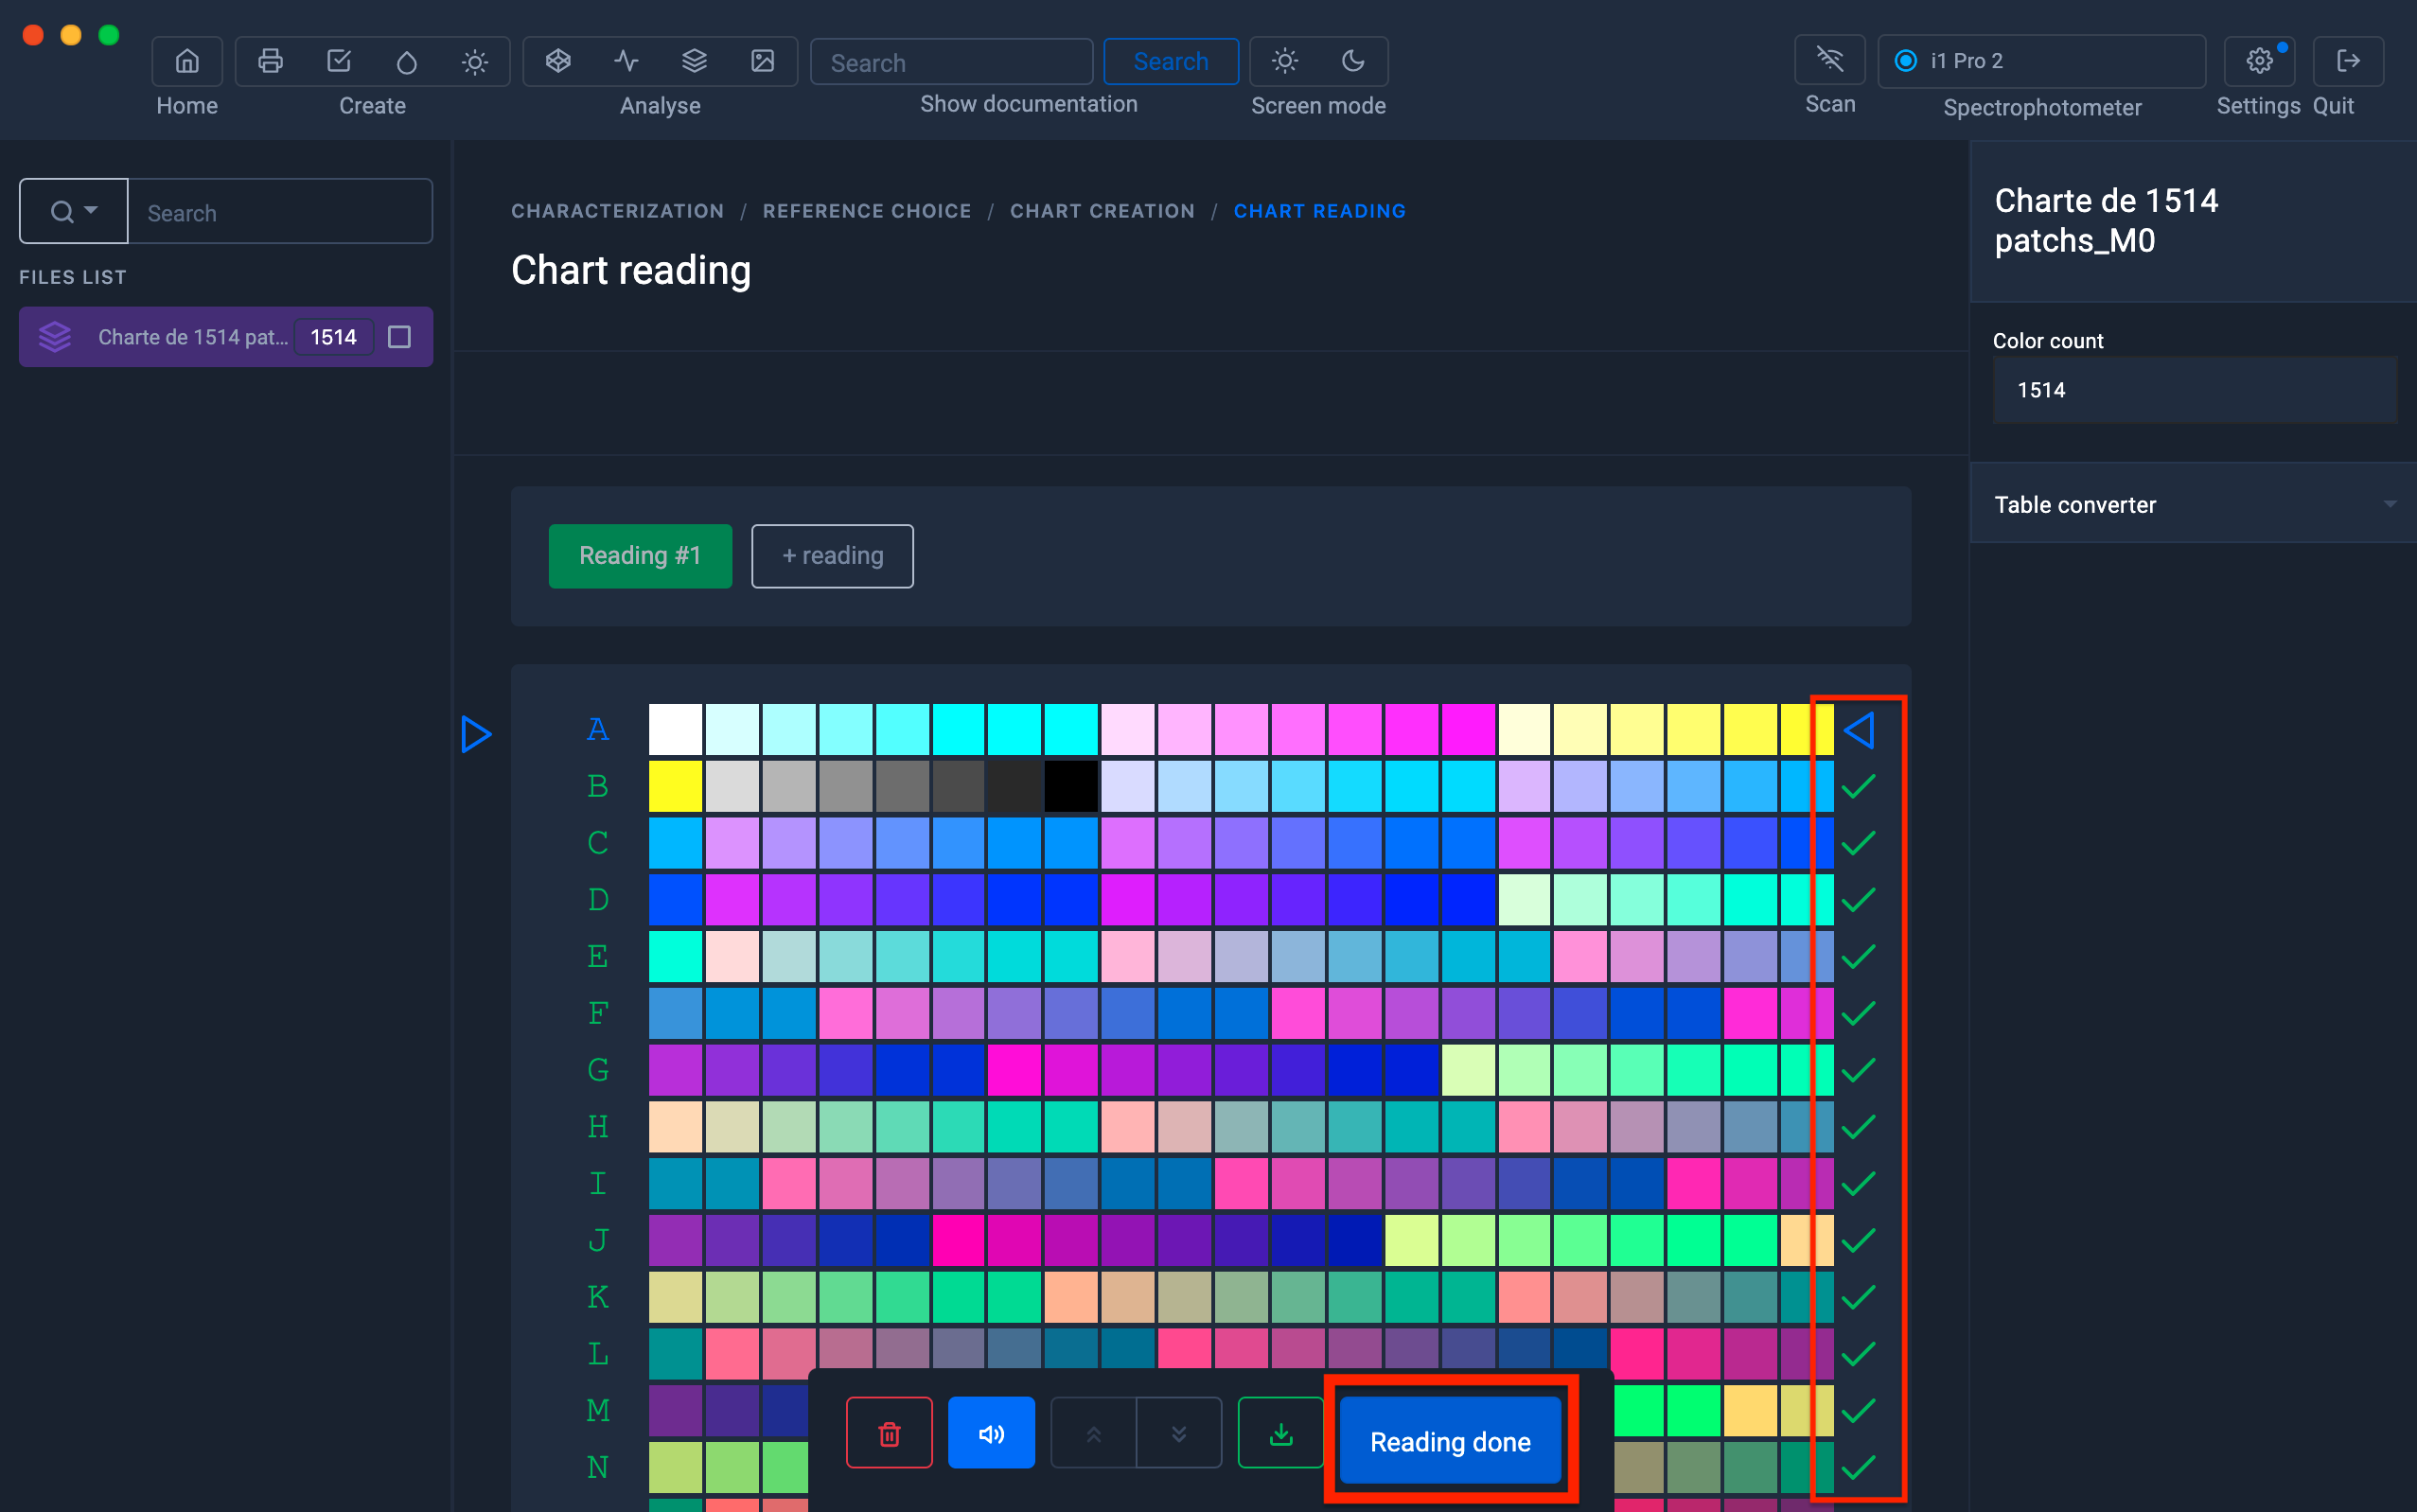
Make sure the values have loaded correctly and the color patches are the same
9) Click on the "Reading done" button to launch the profile calculation procedure
10) Don't forget to name your profile before clicking on the "Calculate profile" button
Learn more about creating a profile: Create a profile from a standard chart
Export of a measurement file made with Coraye to the XRite I1 Profiler software
Just as it is possible to import measurement files from XRite I1 Profiler to Coraye to calculate icc profiles, the converse is also possible.
This means that you can create and measure a chart in Coraye and then calculate the icc profile in I1 Profiler.
1) Export of the measurement file in .table format
This procedure begins at the end of the measurement of the range containing the color patches serving as a reference for the creation of the ICC profile.
To know the previous steps, refer to the chapter "Creating a profile from a standard pattern"
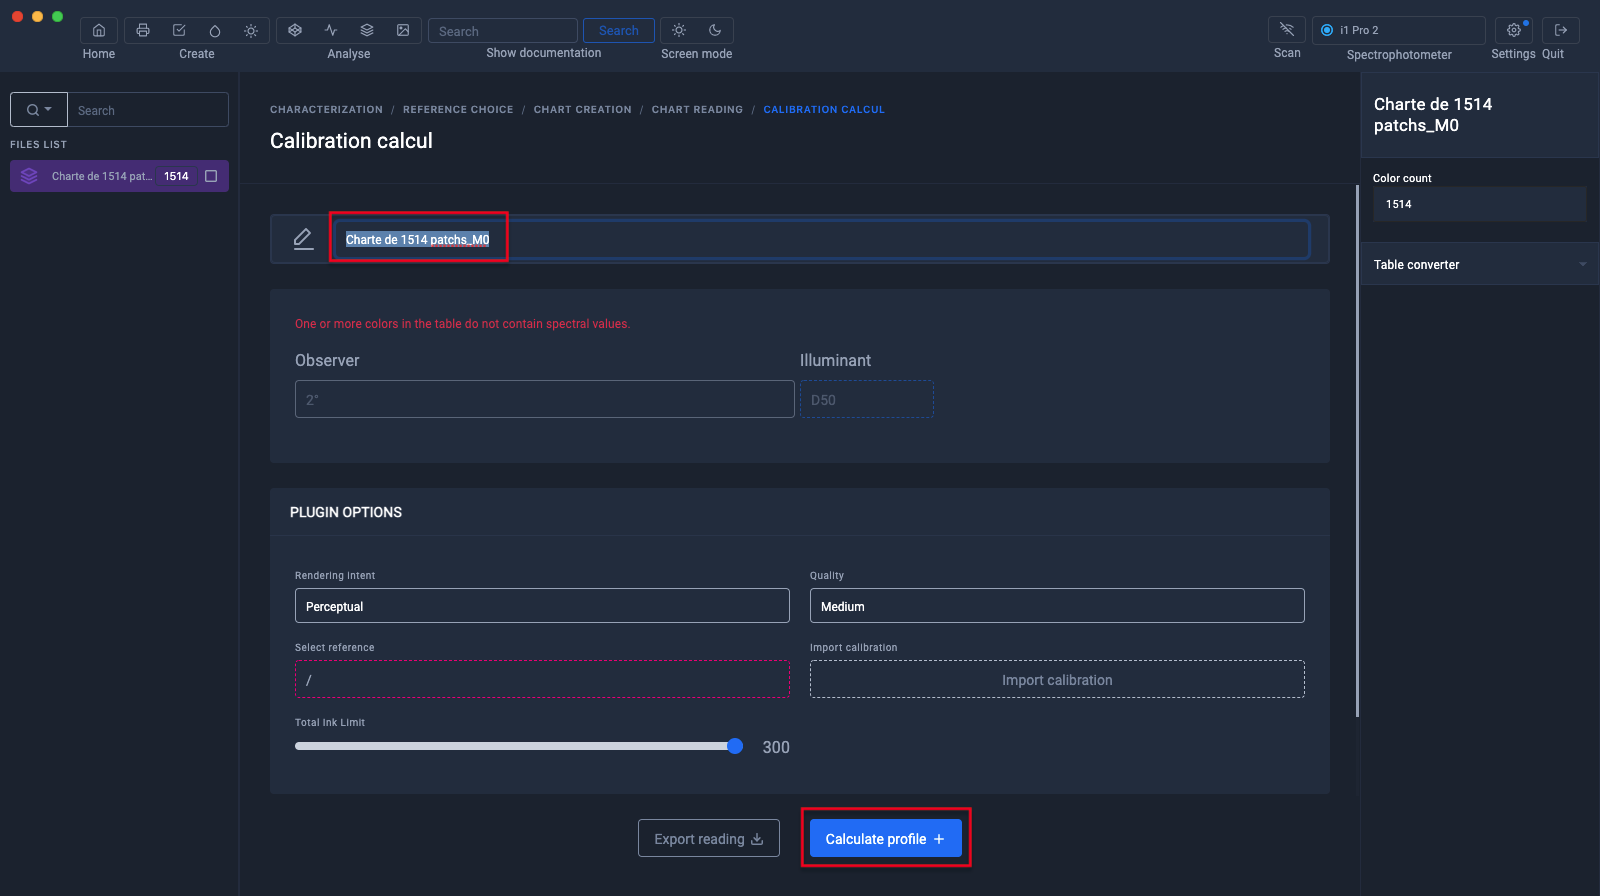
To save the measurement file at the end of the reading of the chart, click on "Export reading"
The file is saved in the left column.
You can rename it to better identify it, for example: P7500 Photo Paper 260gr

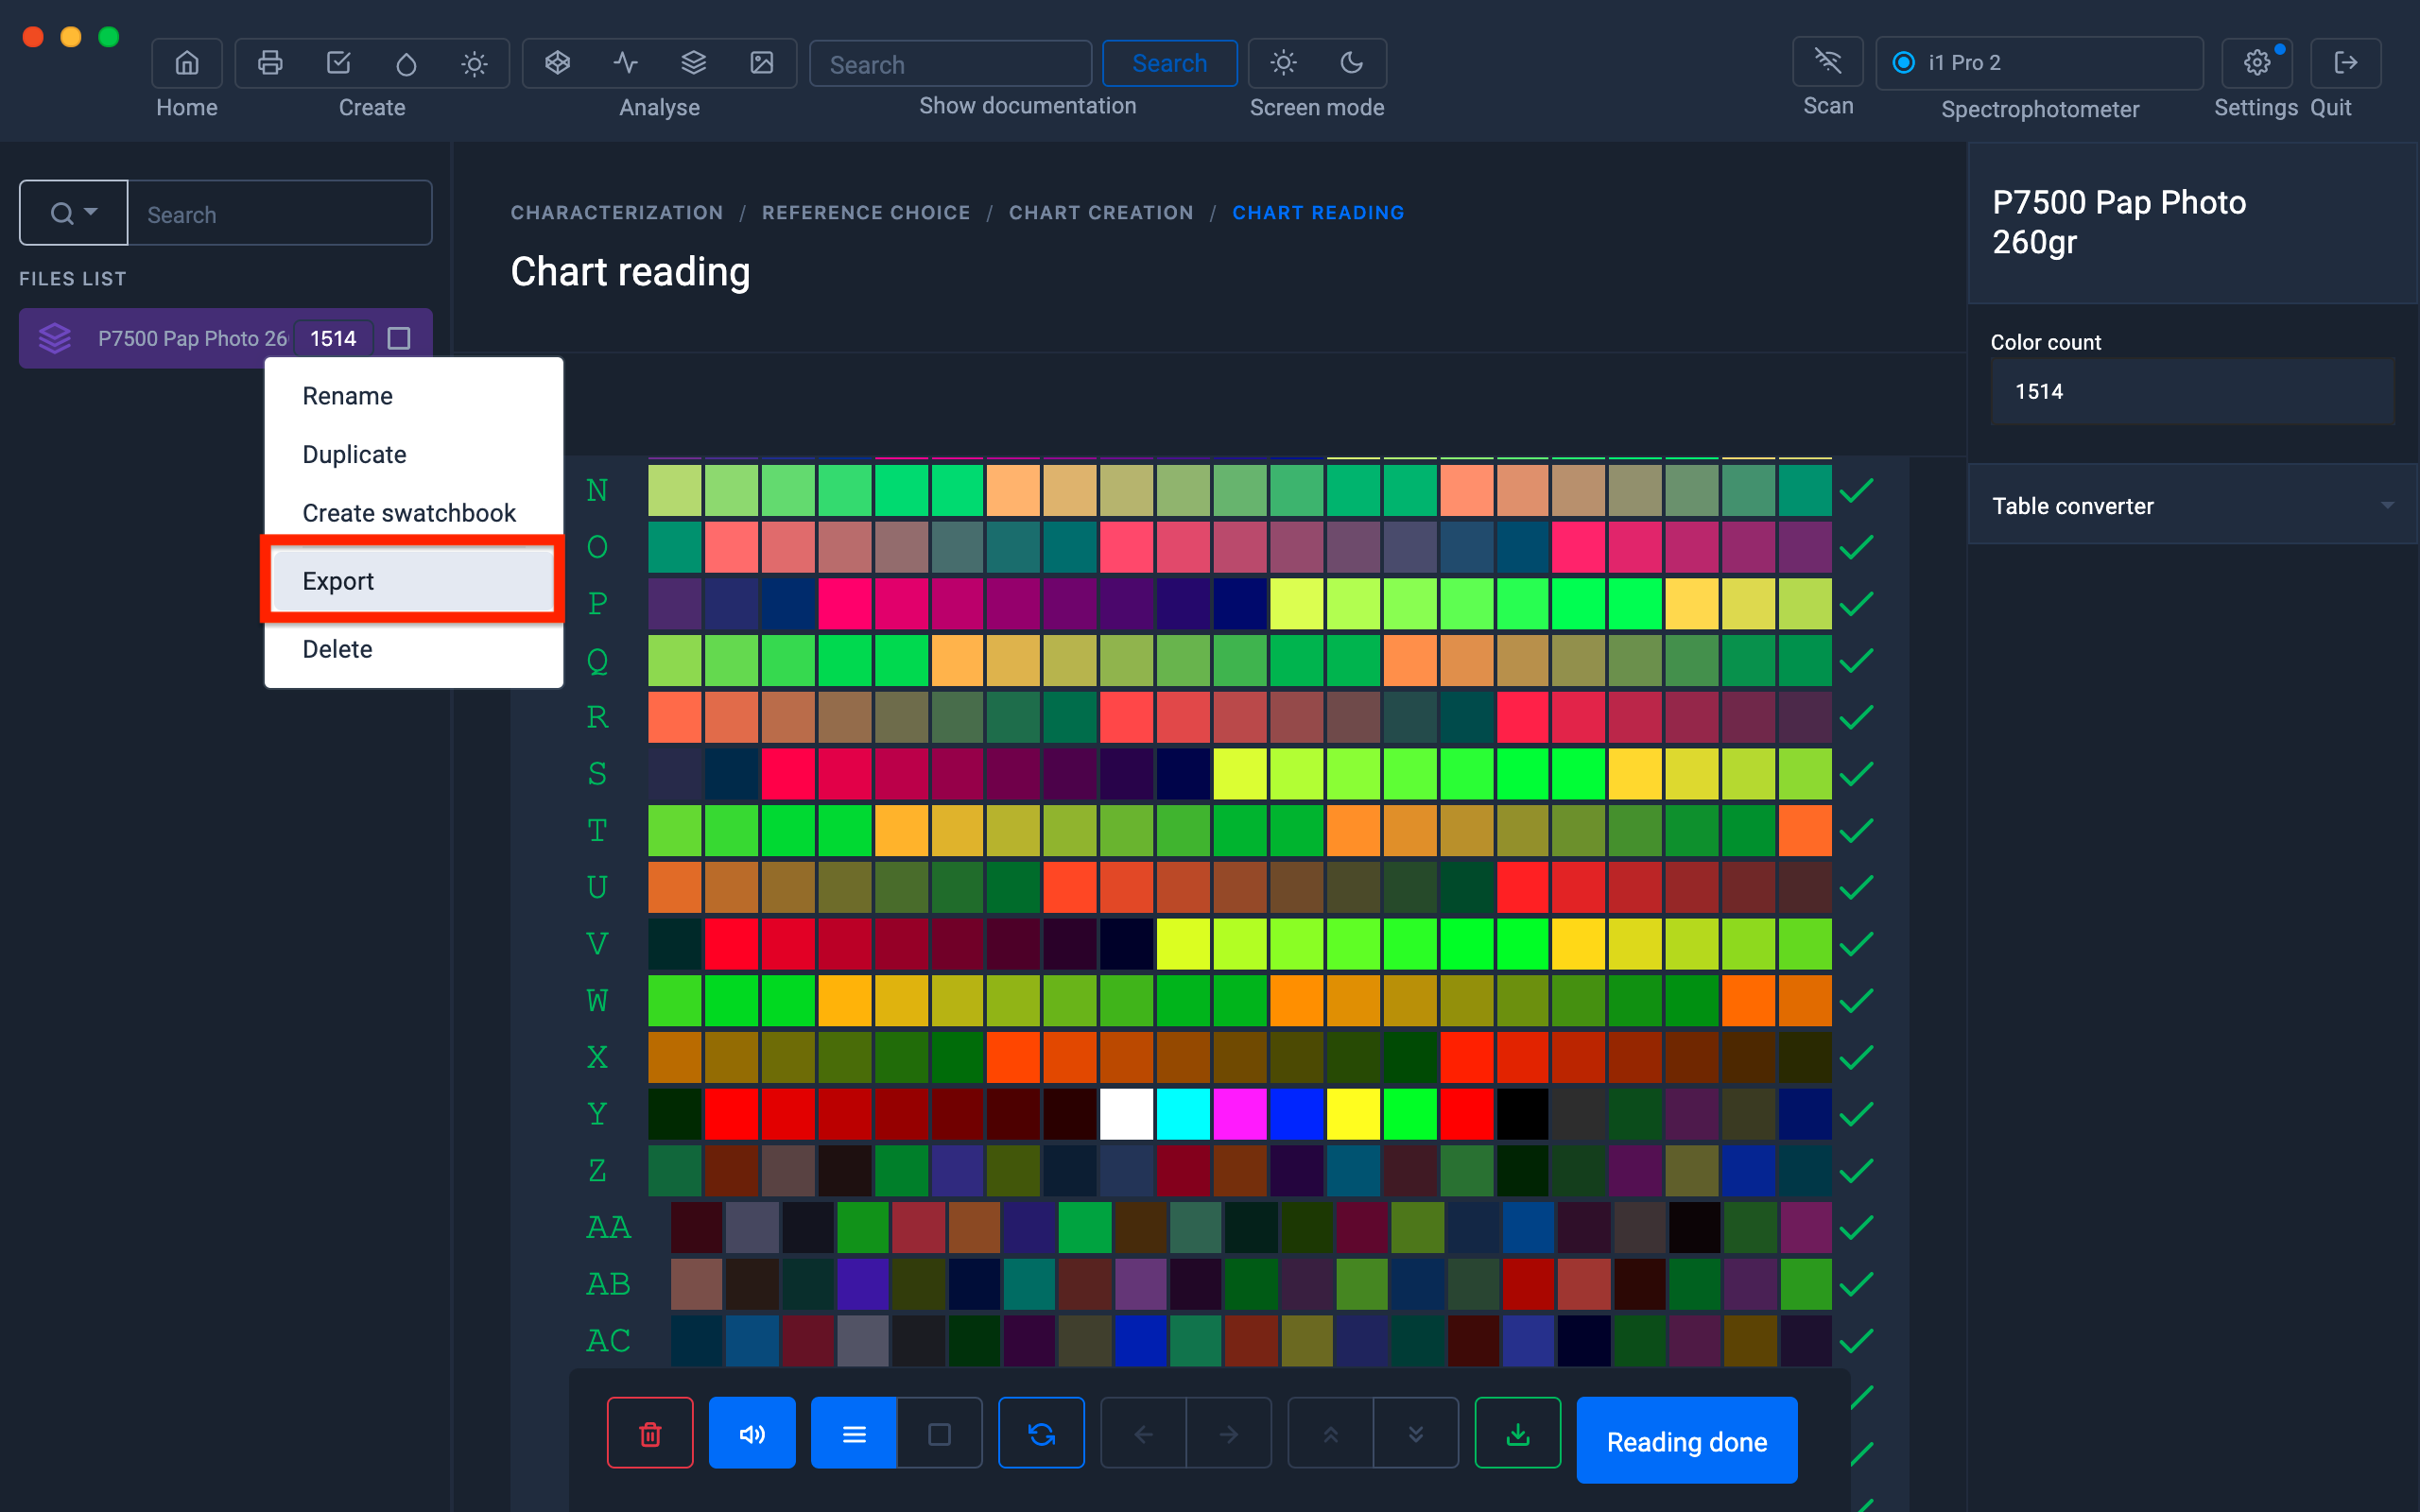
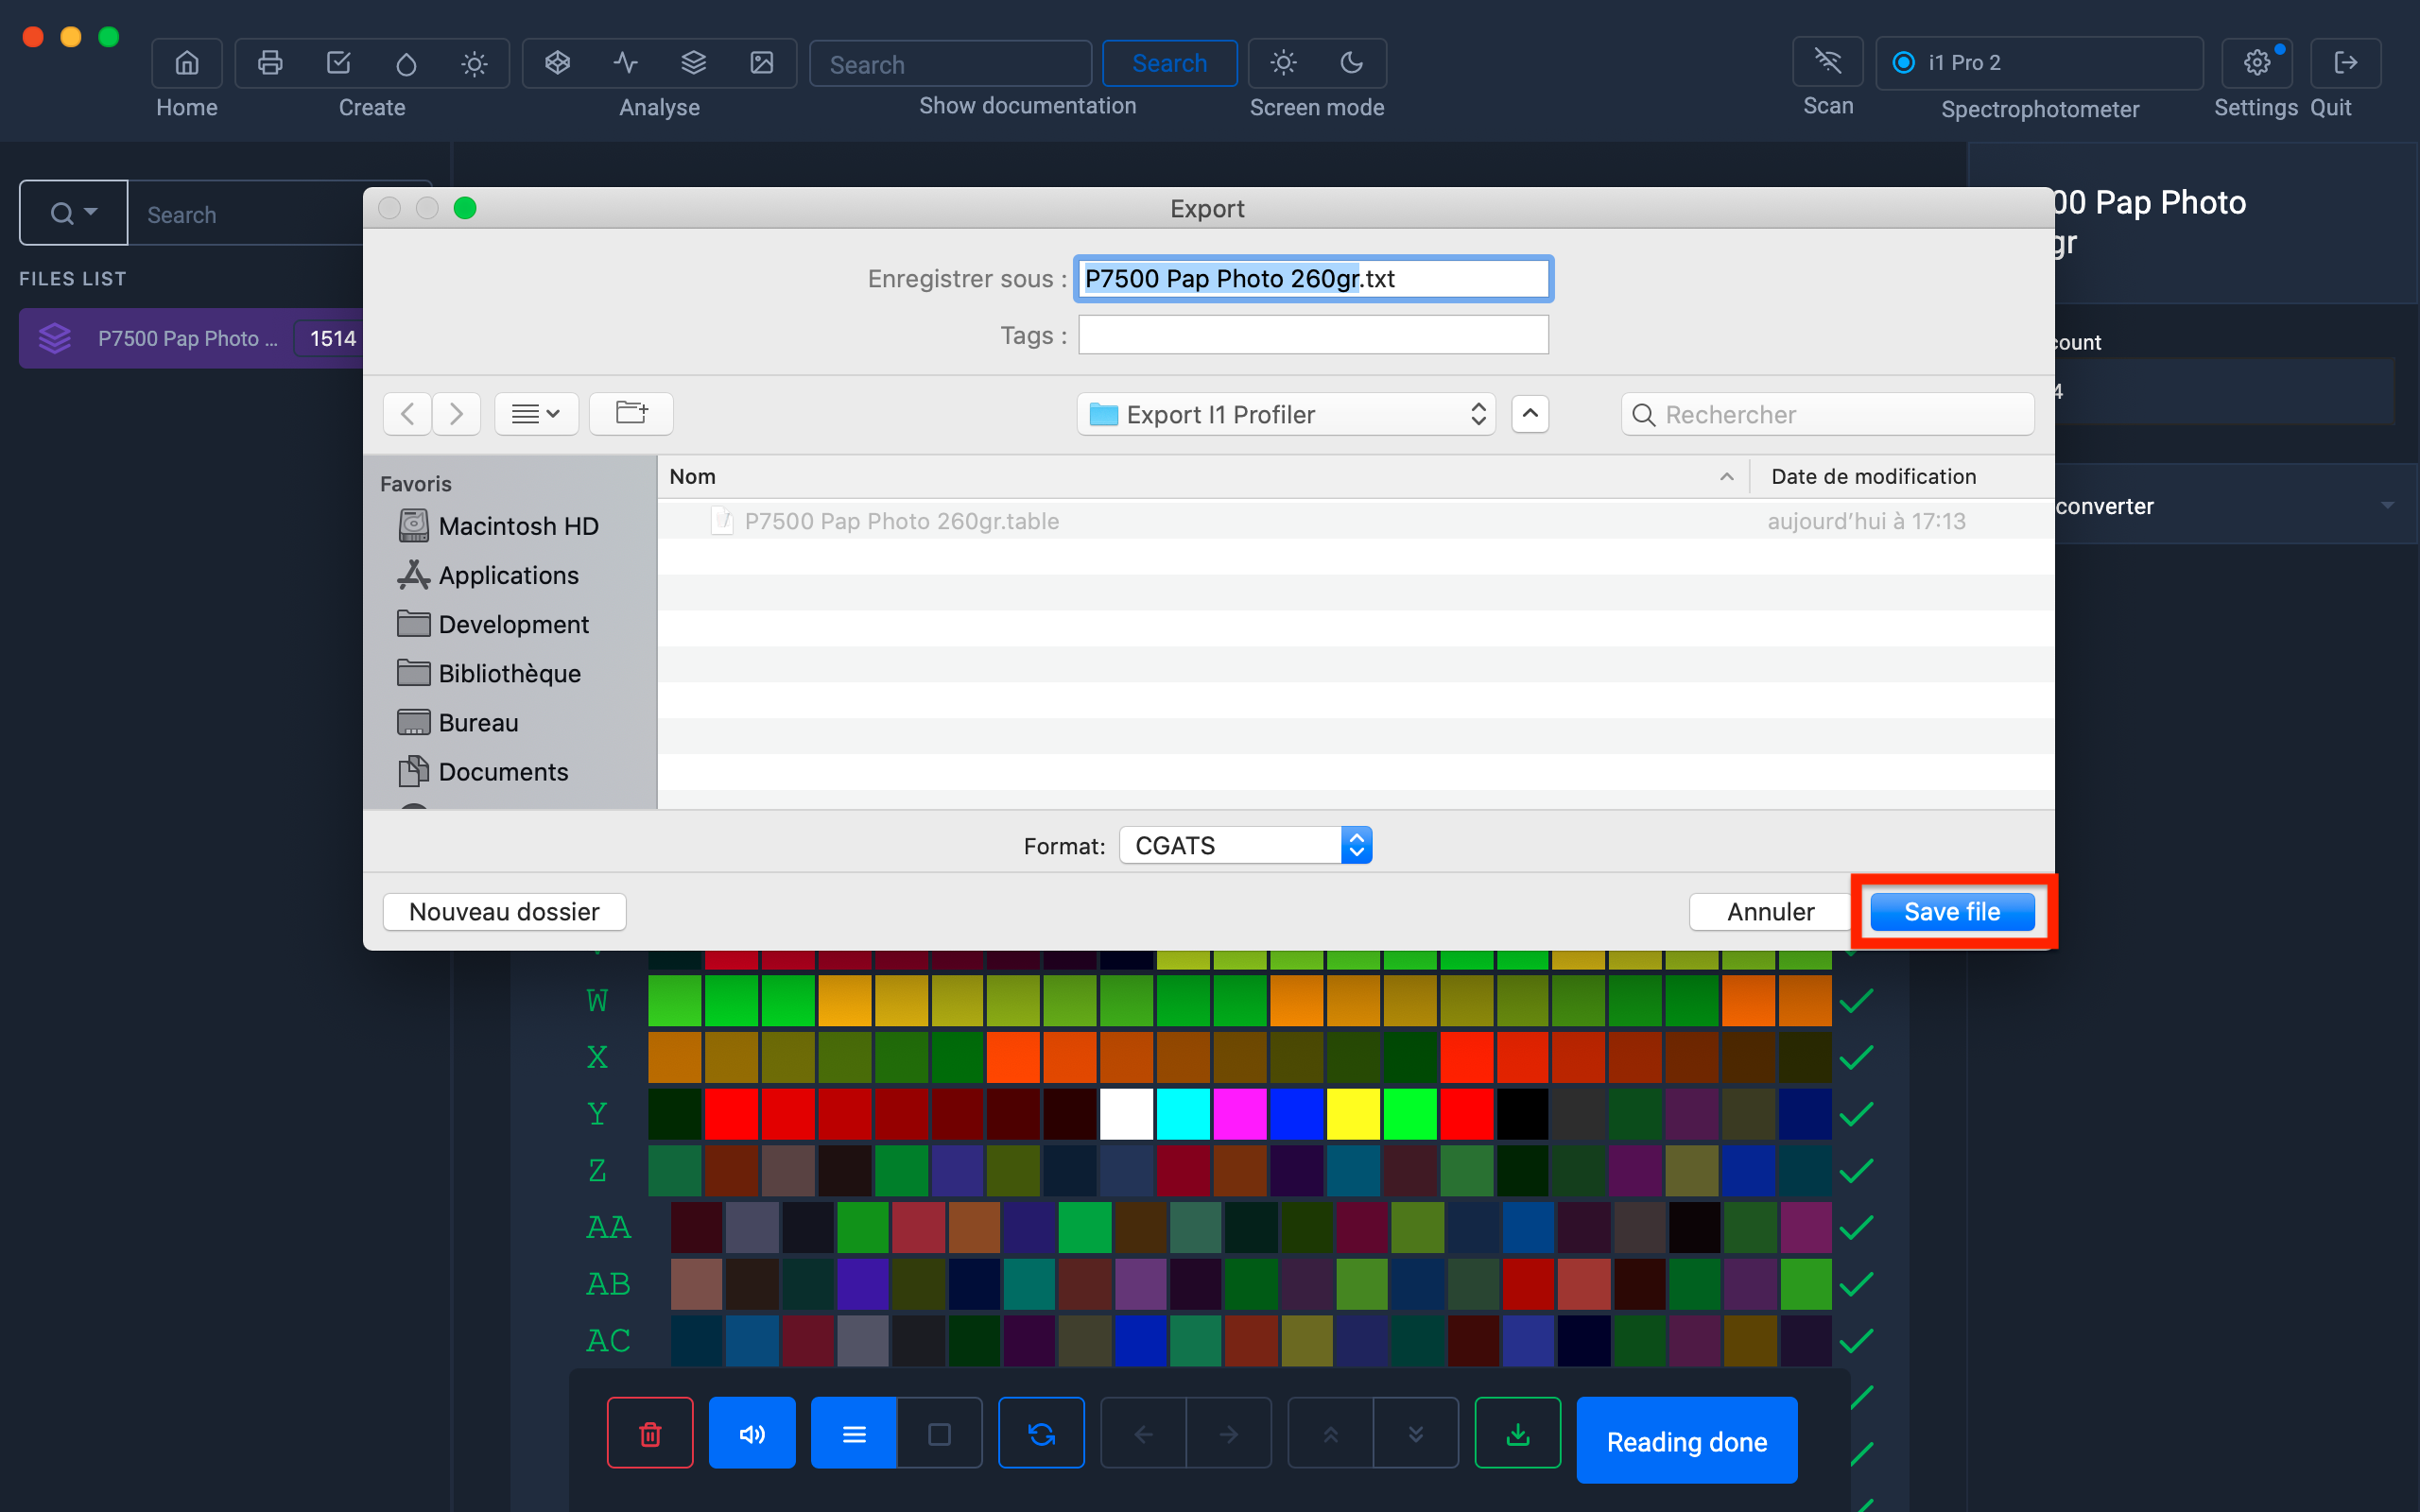
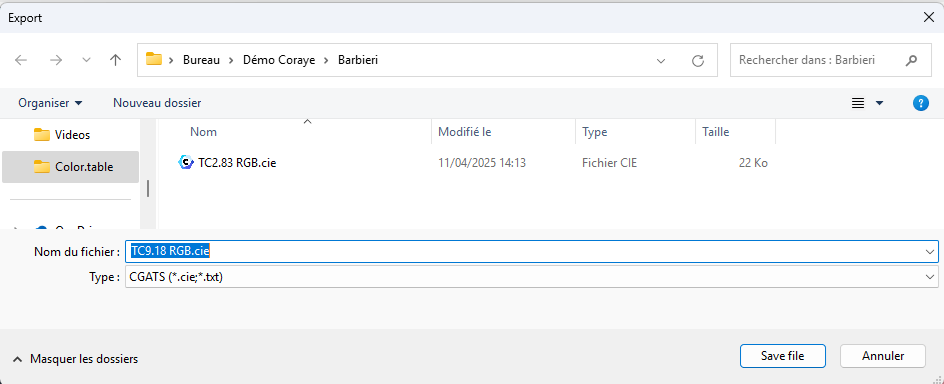
2) Select the .table file in the left column then right click and "Export".
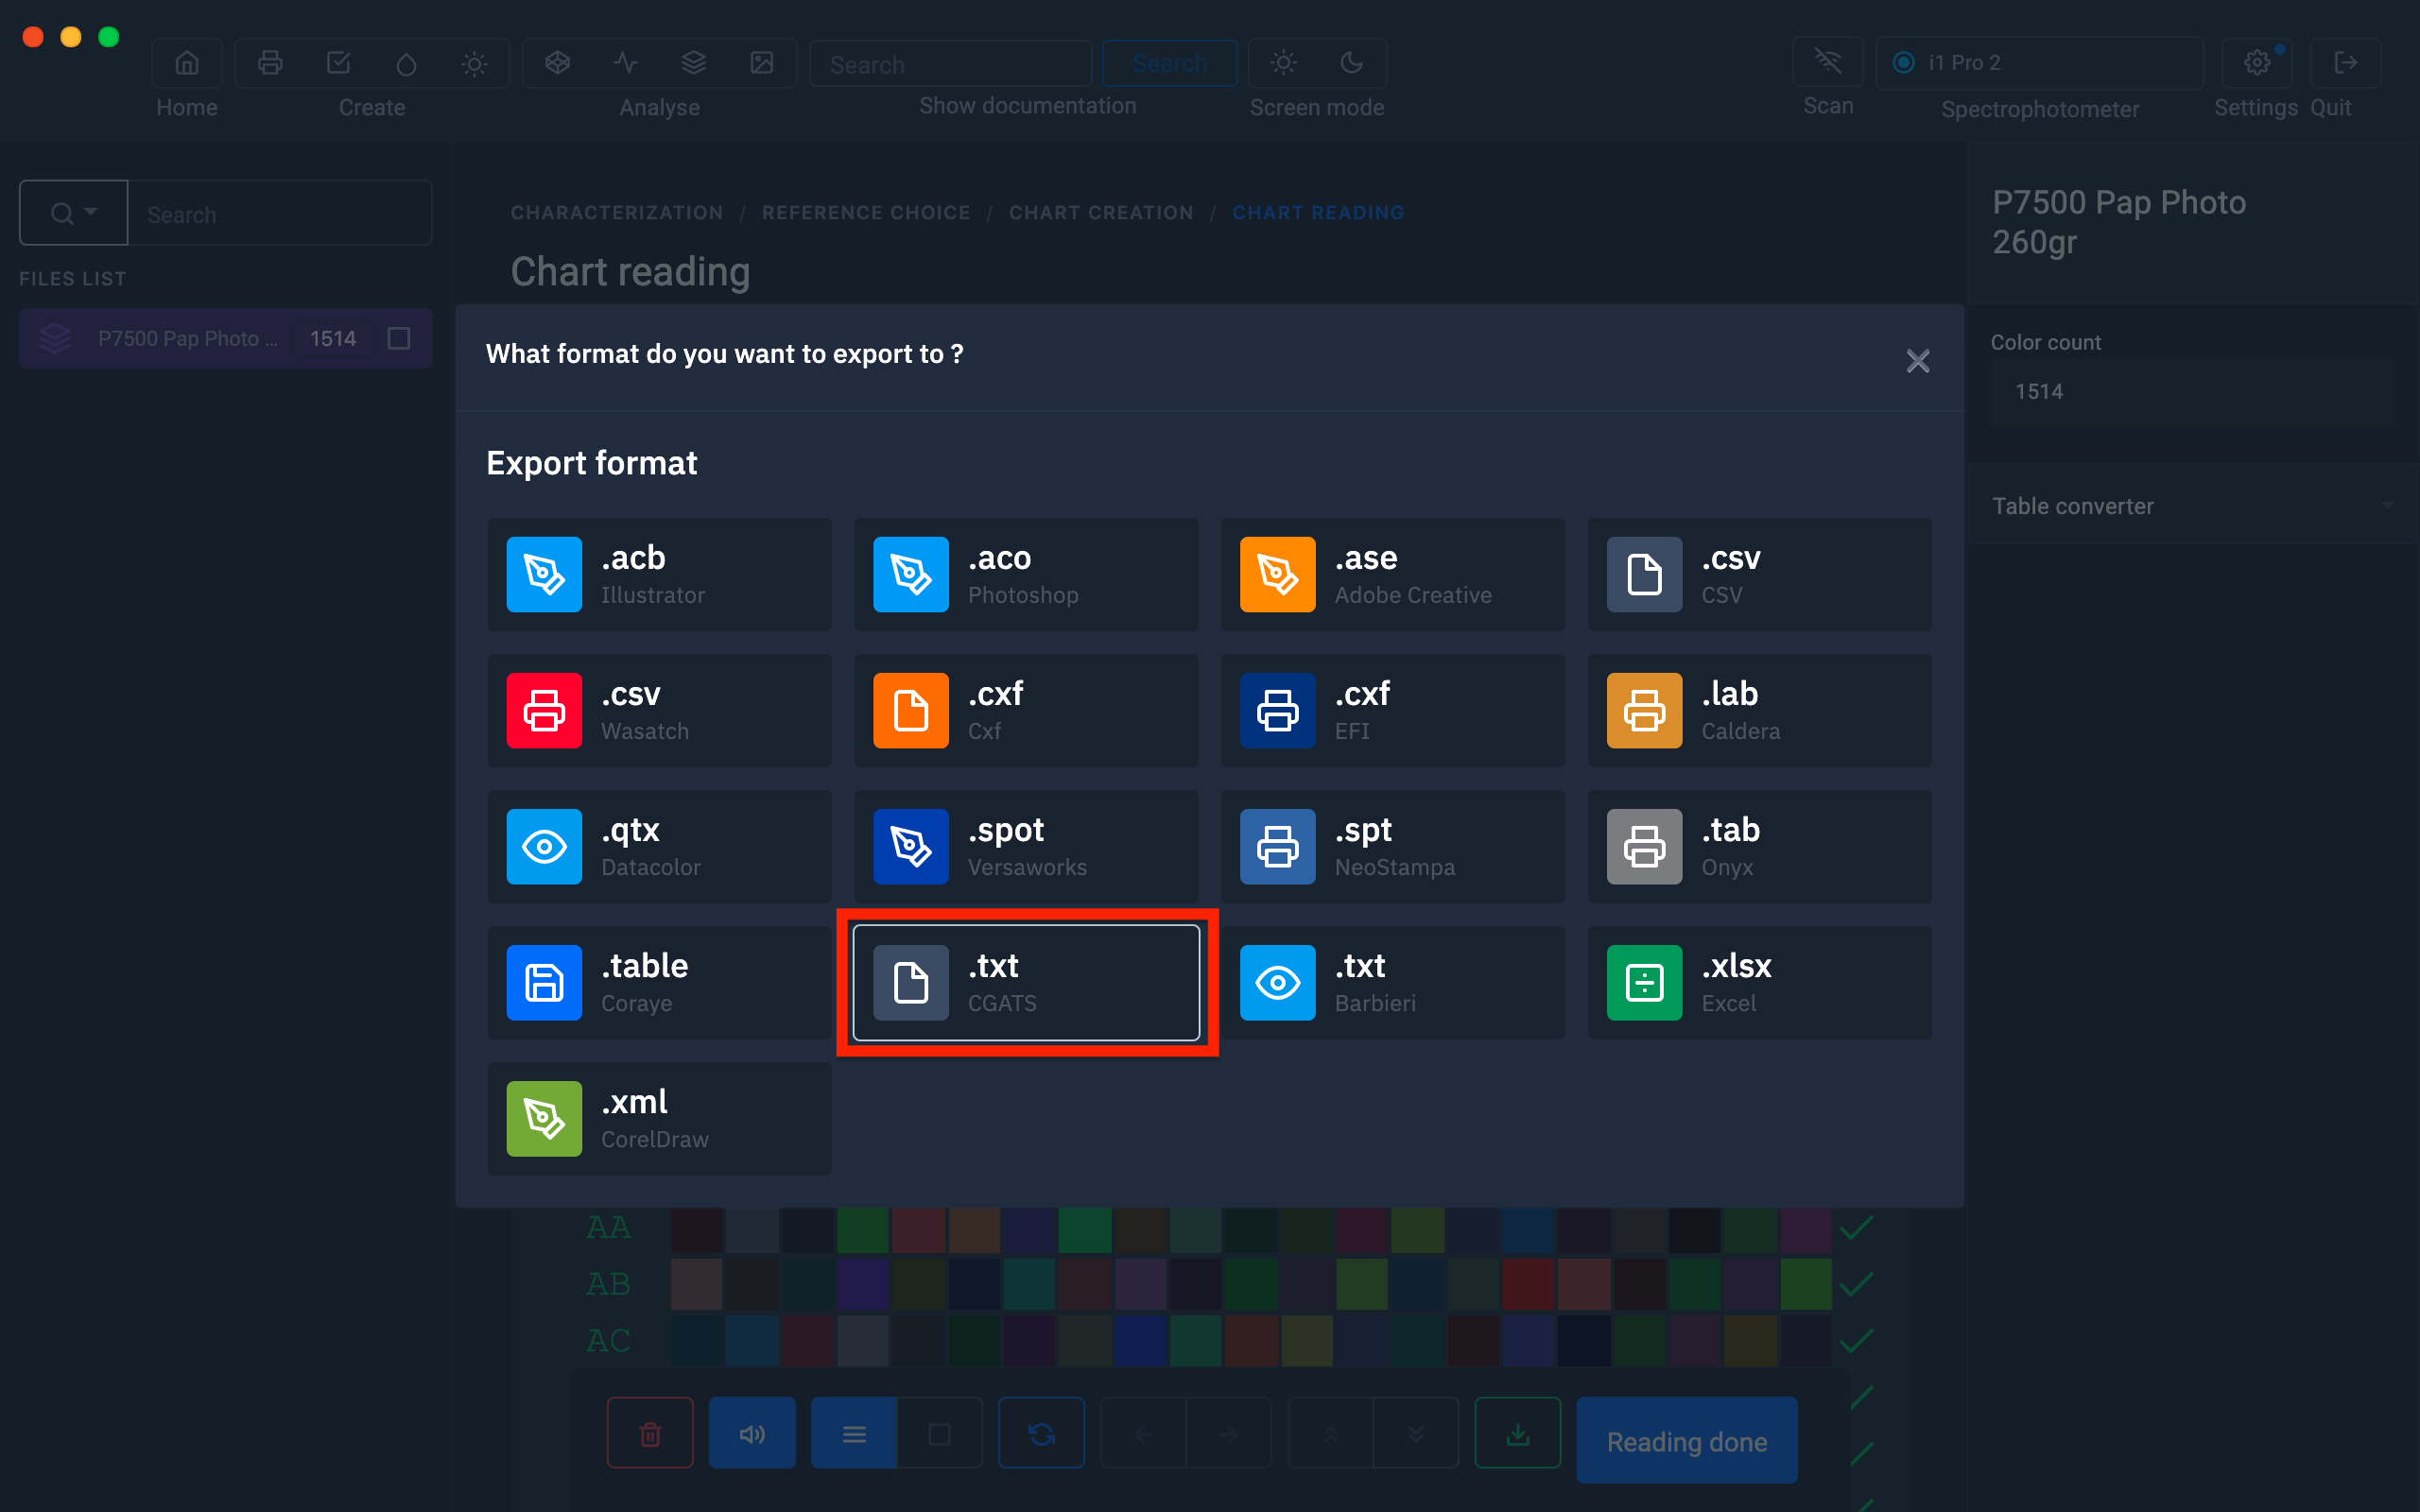
3) Choose .txt format (CGATS)
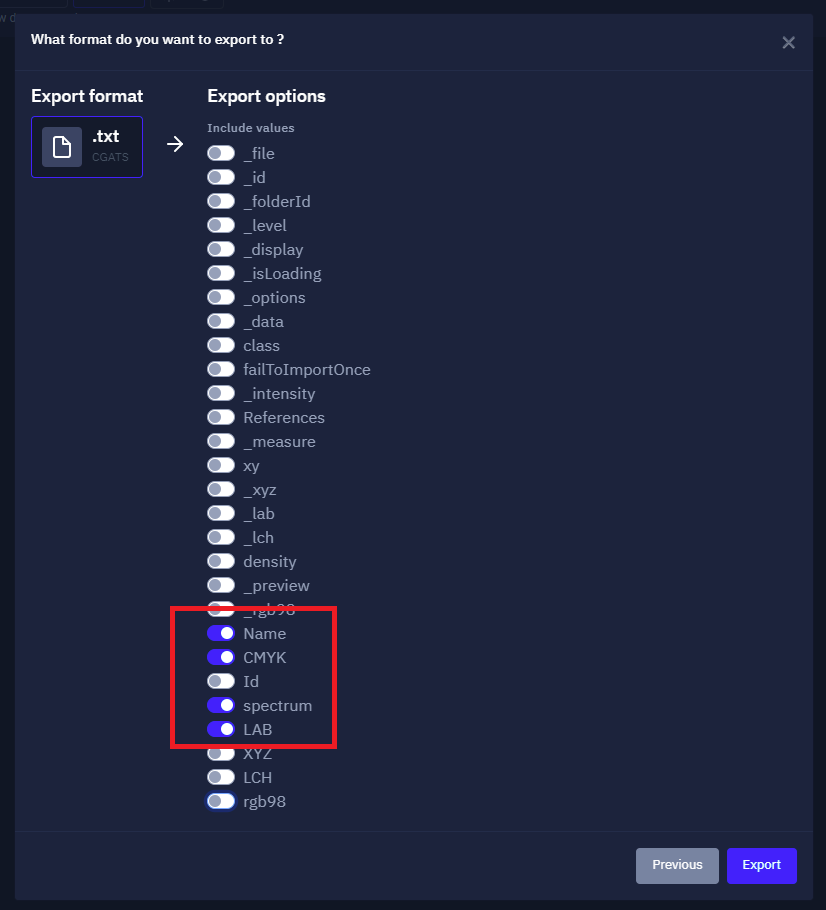
4) Select export options:
-Spectrum
- LAB
- RGB or CMYK depending on the mode
- Name (optional)
I1 Profiler does not support other options
Then click on the "Export" button
5) Save the .txt file (CGATS) so that it is accessible when importing into the I1 Profiler software.
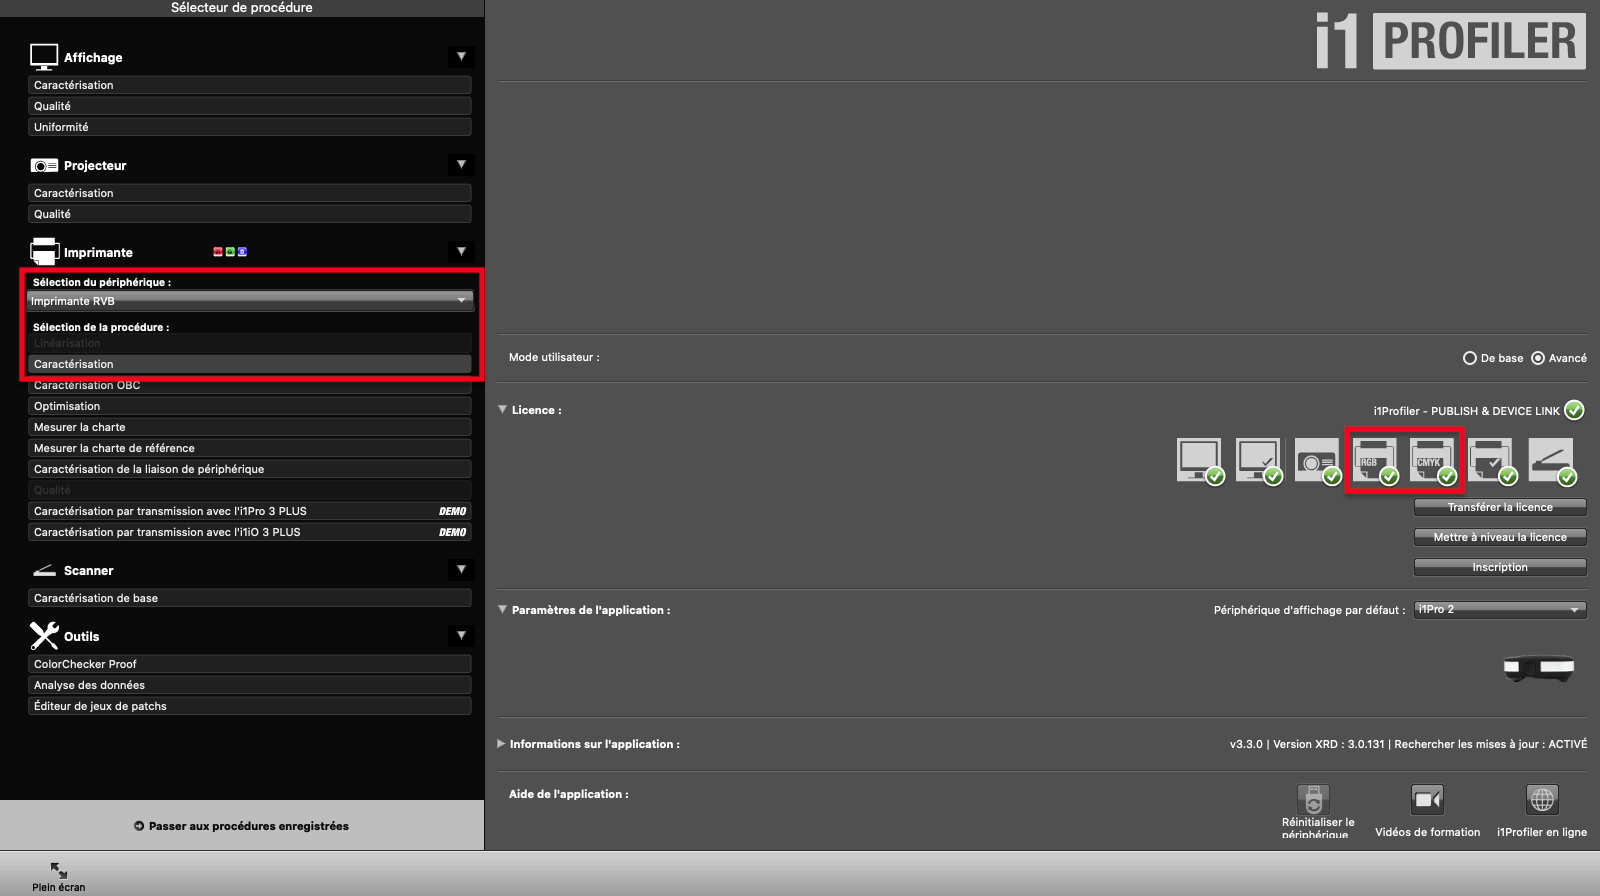
6) Launch the I1 Profiler software
In the "Printer" zone, select "RGB printer" or "CMYK printer" depending on the mode of the ICC profile to be created.
Click on "Characterization"
Make sure that you have the license allowing you to perform the calculation of ICC profiles.
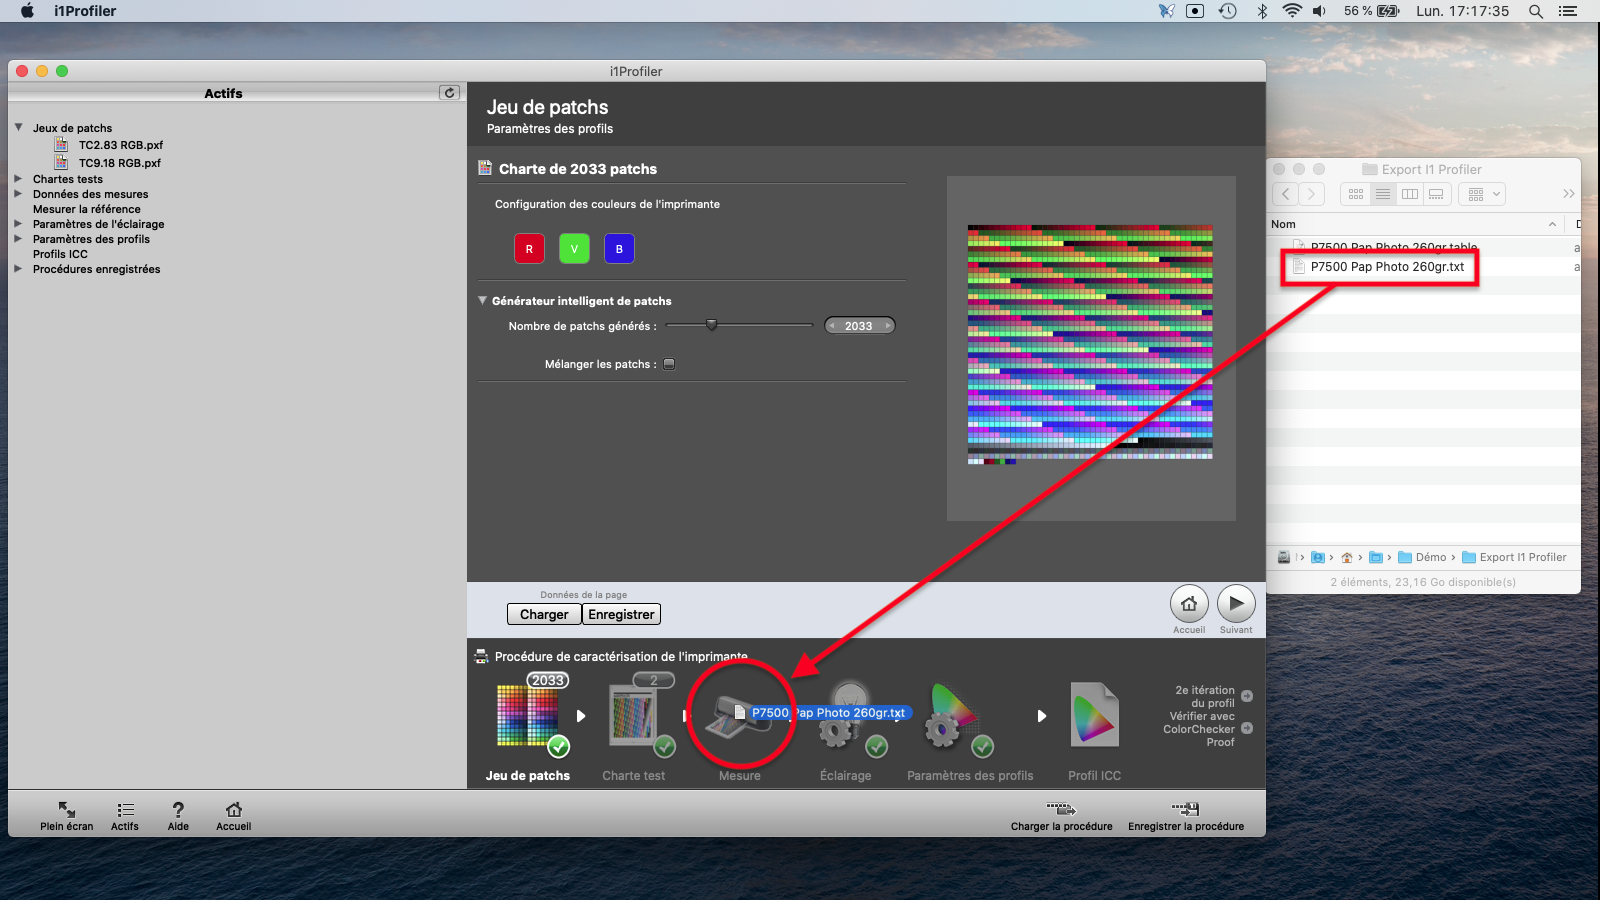
7) Importing the CGATS file into I1 Profiler
Drag and drop the CGATS .txt file onto the "Measurement" icon.
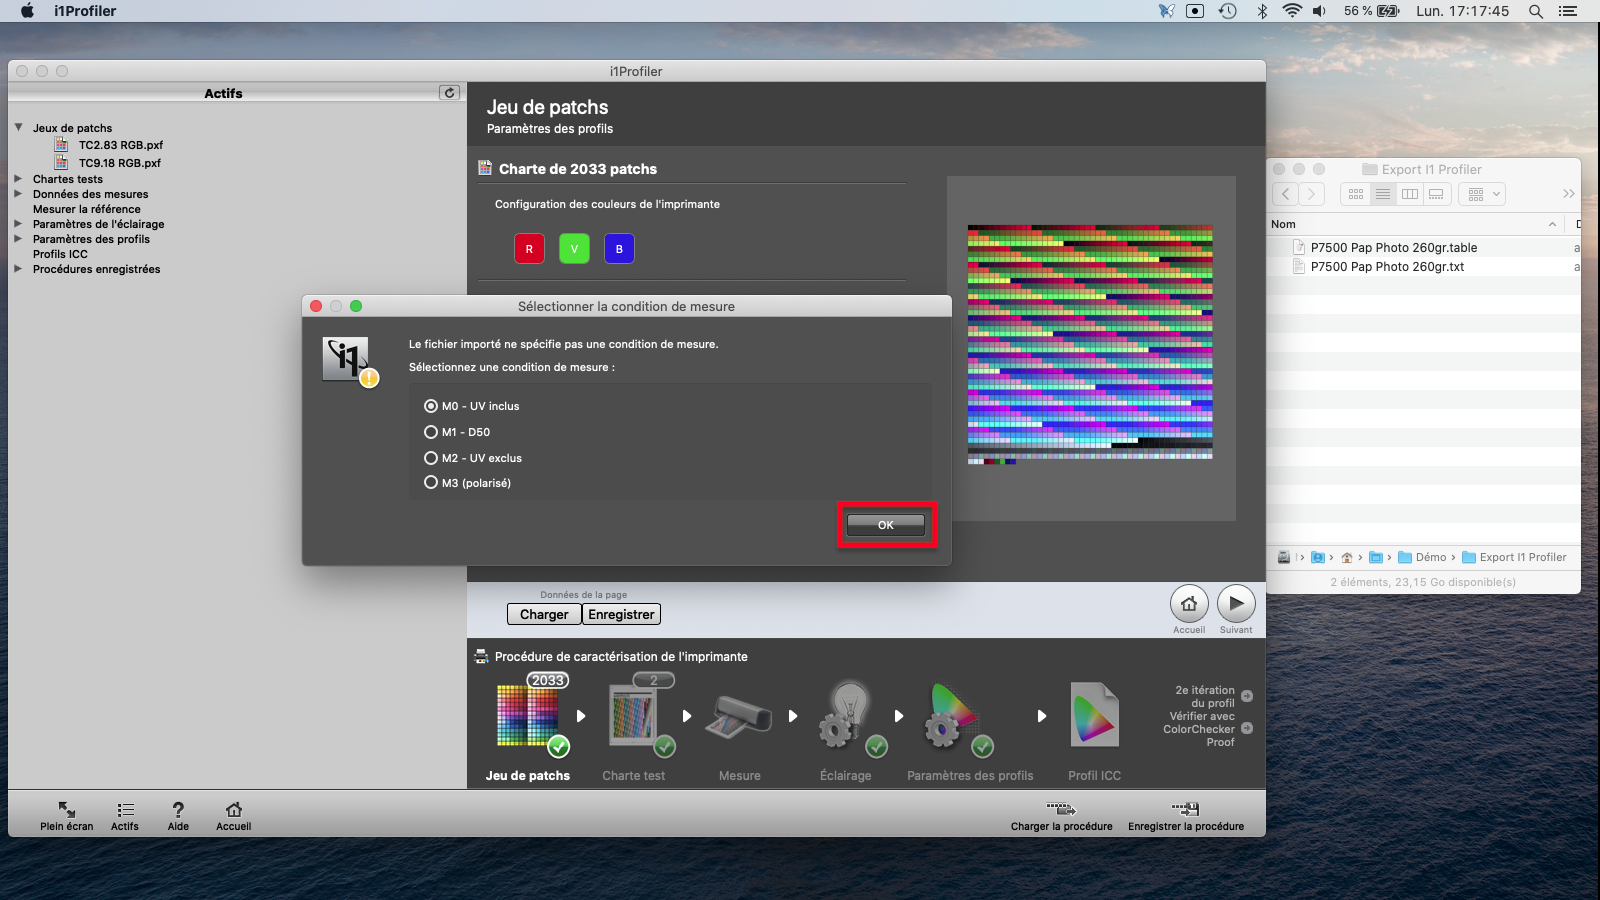
8) Select the reading mode used when measuring the range (Coraye).
Click "Ok" to start importing the measurement data.
9) Change the ICC profile version in "Profiles Settings"
Choose: Version 2

10) Name the ICC profile in the "File name" field
Specify a path if you want to save the profile to a specific location.
Then click on the "Save profile" button

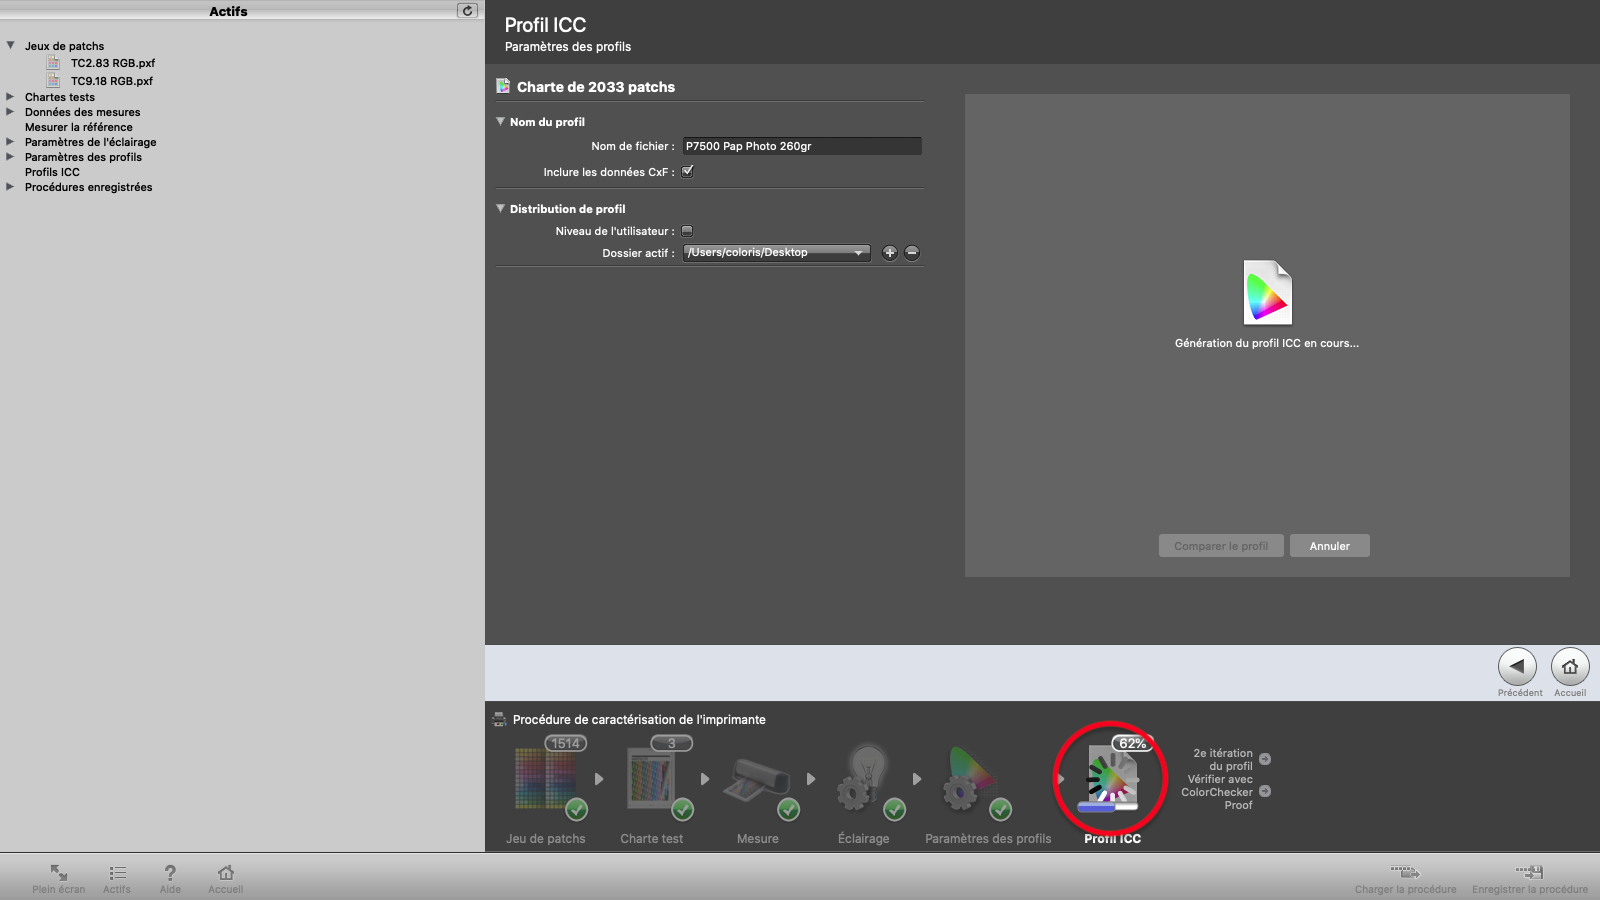
11) Calculation of the profile
The profile creation progress status appears on the "ICC profile" icon.
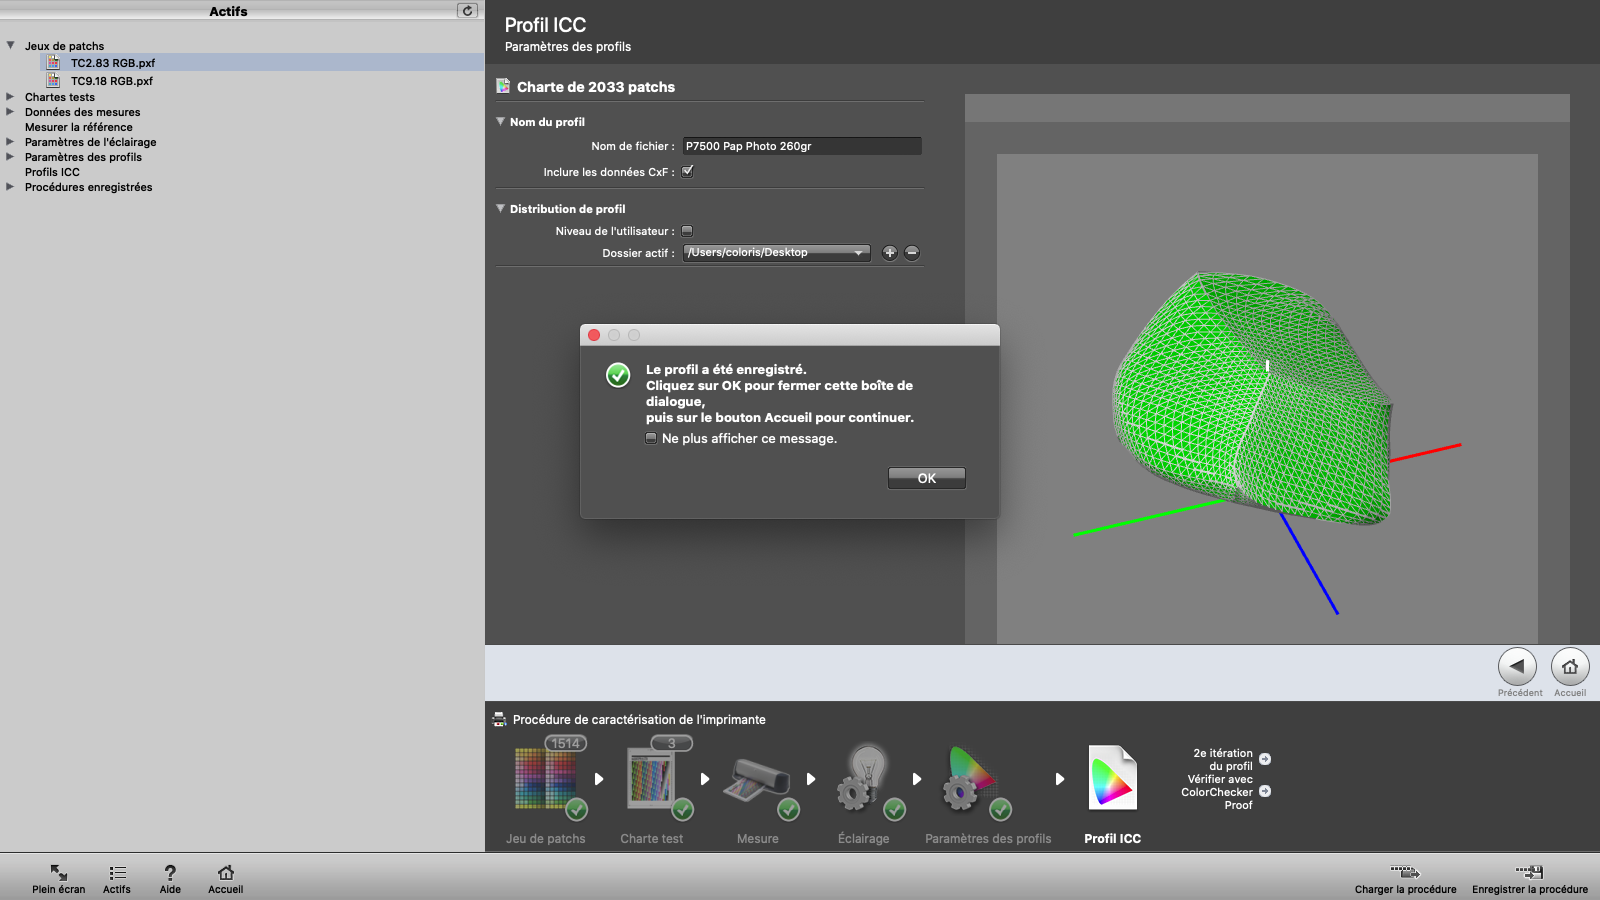
12) End of the procedure
When the calculation is finished, the profile is saved on the computer, a representation of the gamut appears as well as an alert message to signal the end of the operation.
Barbieri Gateway & Chart Generator
Another way to interface with Barbieri spectrophotometers is to exchange files with the Gateway software developed by Barbieri.
The whole process is based on import / export of data via CGATS file format.
Create your target
You do not need to create a new test pattern with "Test Pattern Generator" every time you need to use Gateway. You can still use the same staff. But it would be interesting to create four different targets with their data.
- RGB calibration target
- RGB characterization target
- CMYK calibration target
- CMYK characterization target
With Coraye, create your target by following the process described in “Creating a media profile”.
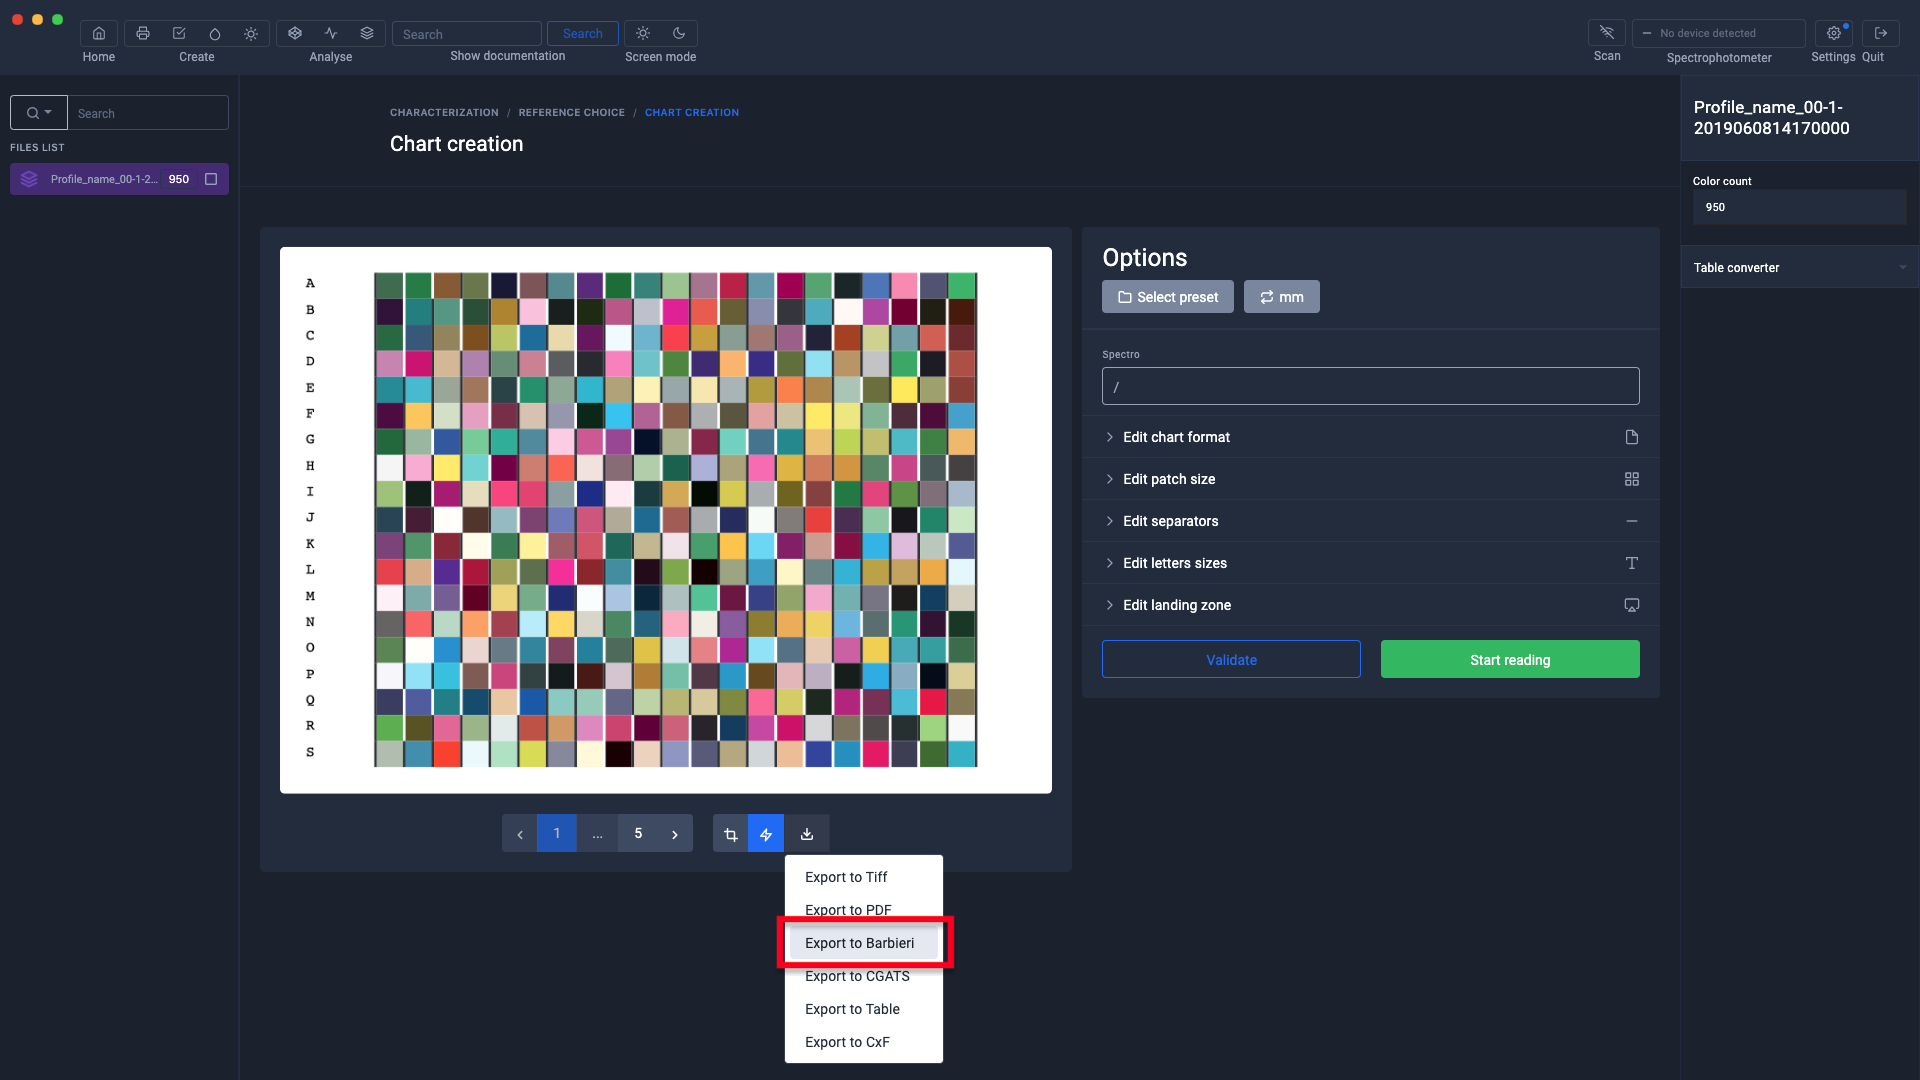
But this time, instead of directly clicking on the "Next" button.
Click on "Export to Barbieri".
To find out more, see the chapter: Creating a profile from a standard test pattern
For more information, see the chapter: Create a profile from a calibration
Save the chart in a folder to import it later into the Barbieri Chart Generator software.
Open the Barbieri Chart Generator app
The Chart Creator application is installed at the same time as the Barbieri Gateway software which you can download from:
https://www.barbierielectronic.com/service-support/#Software_downloads
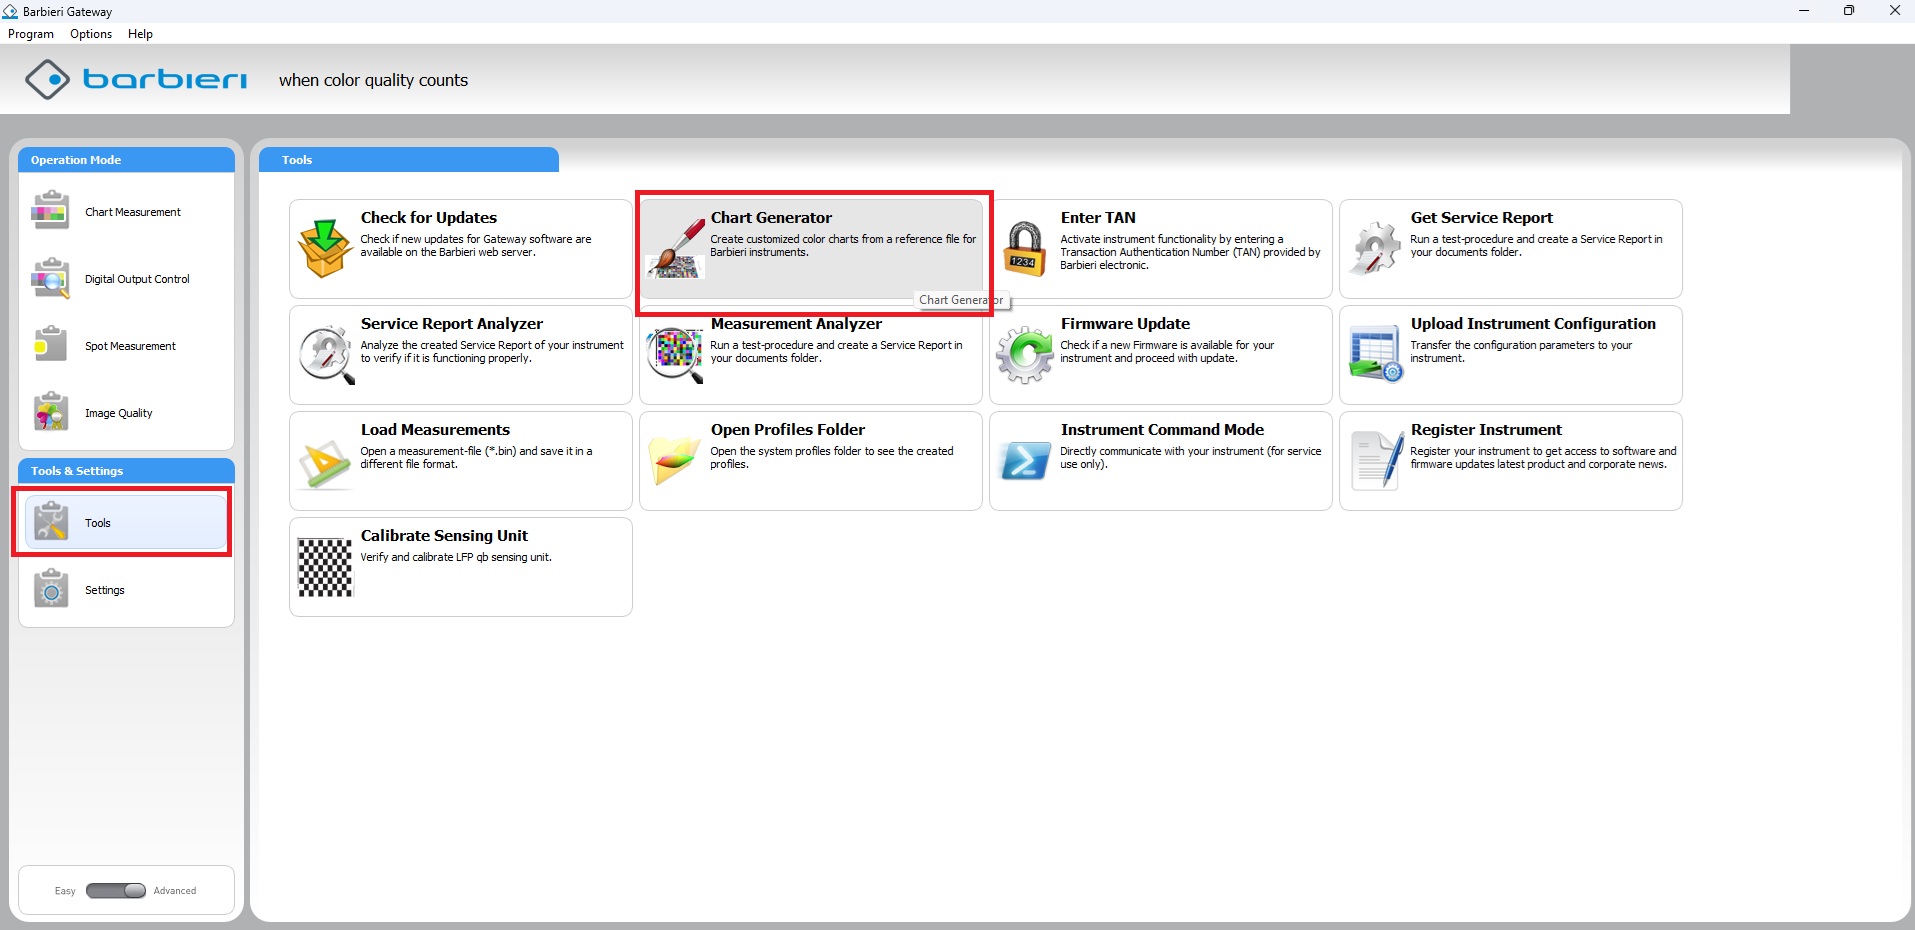
Launch the Chart Generator software.
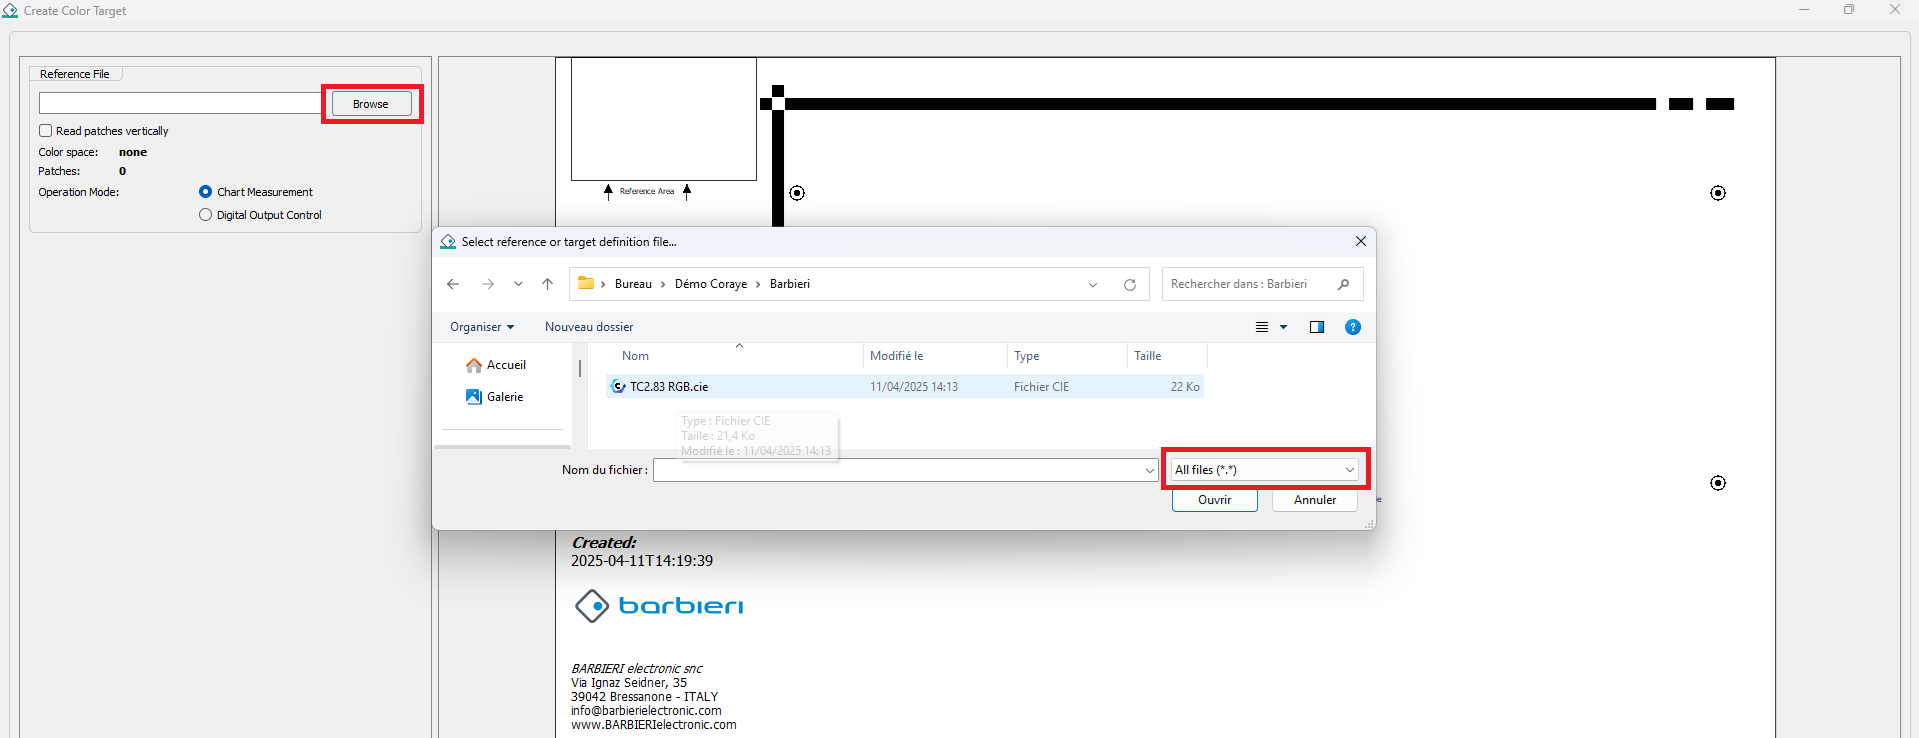
Select "All files" then browse to select the CGATS file created by Coraye.
Select the Barbieri spectrophotometer model and paper size to print the test chart.
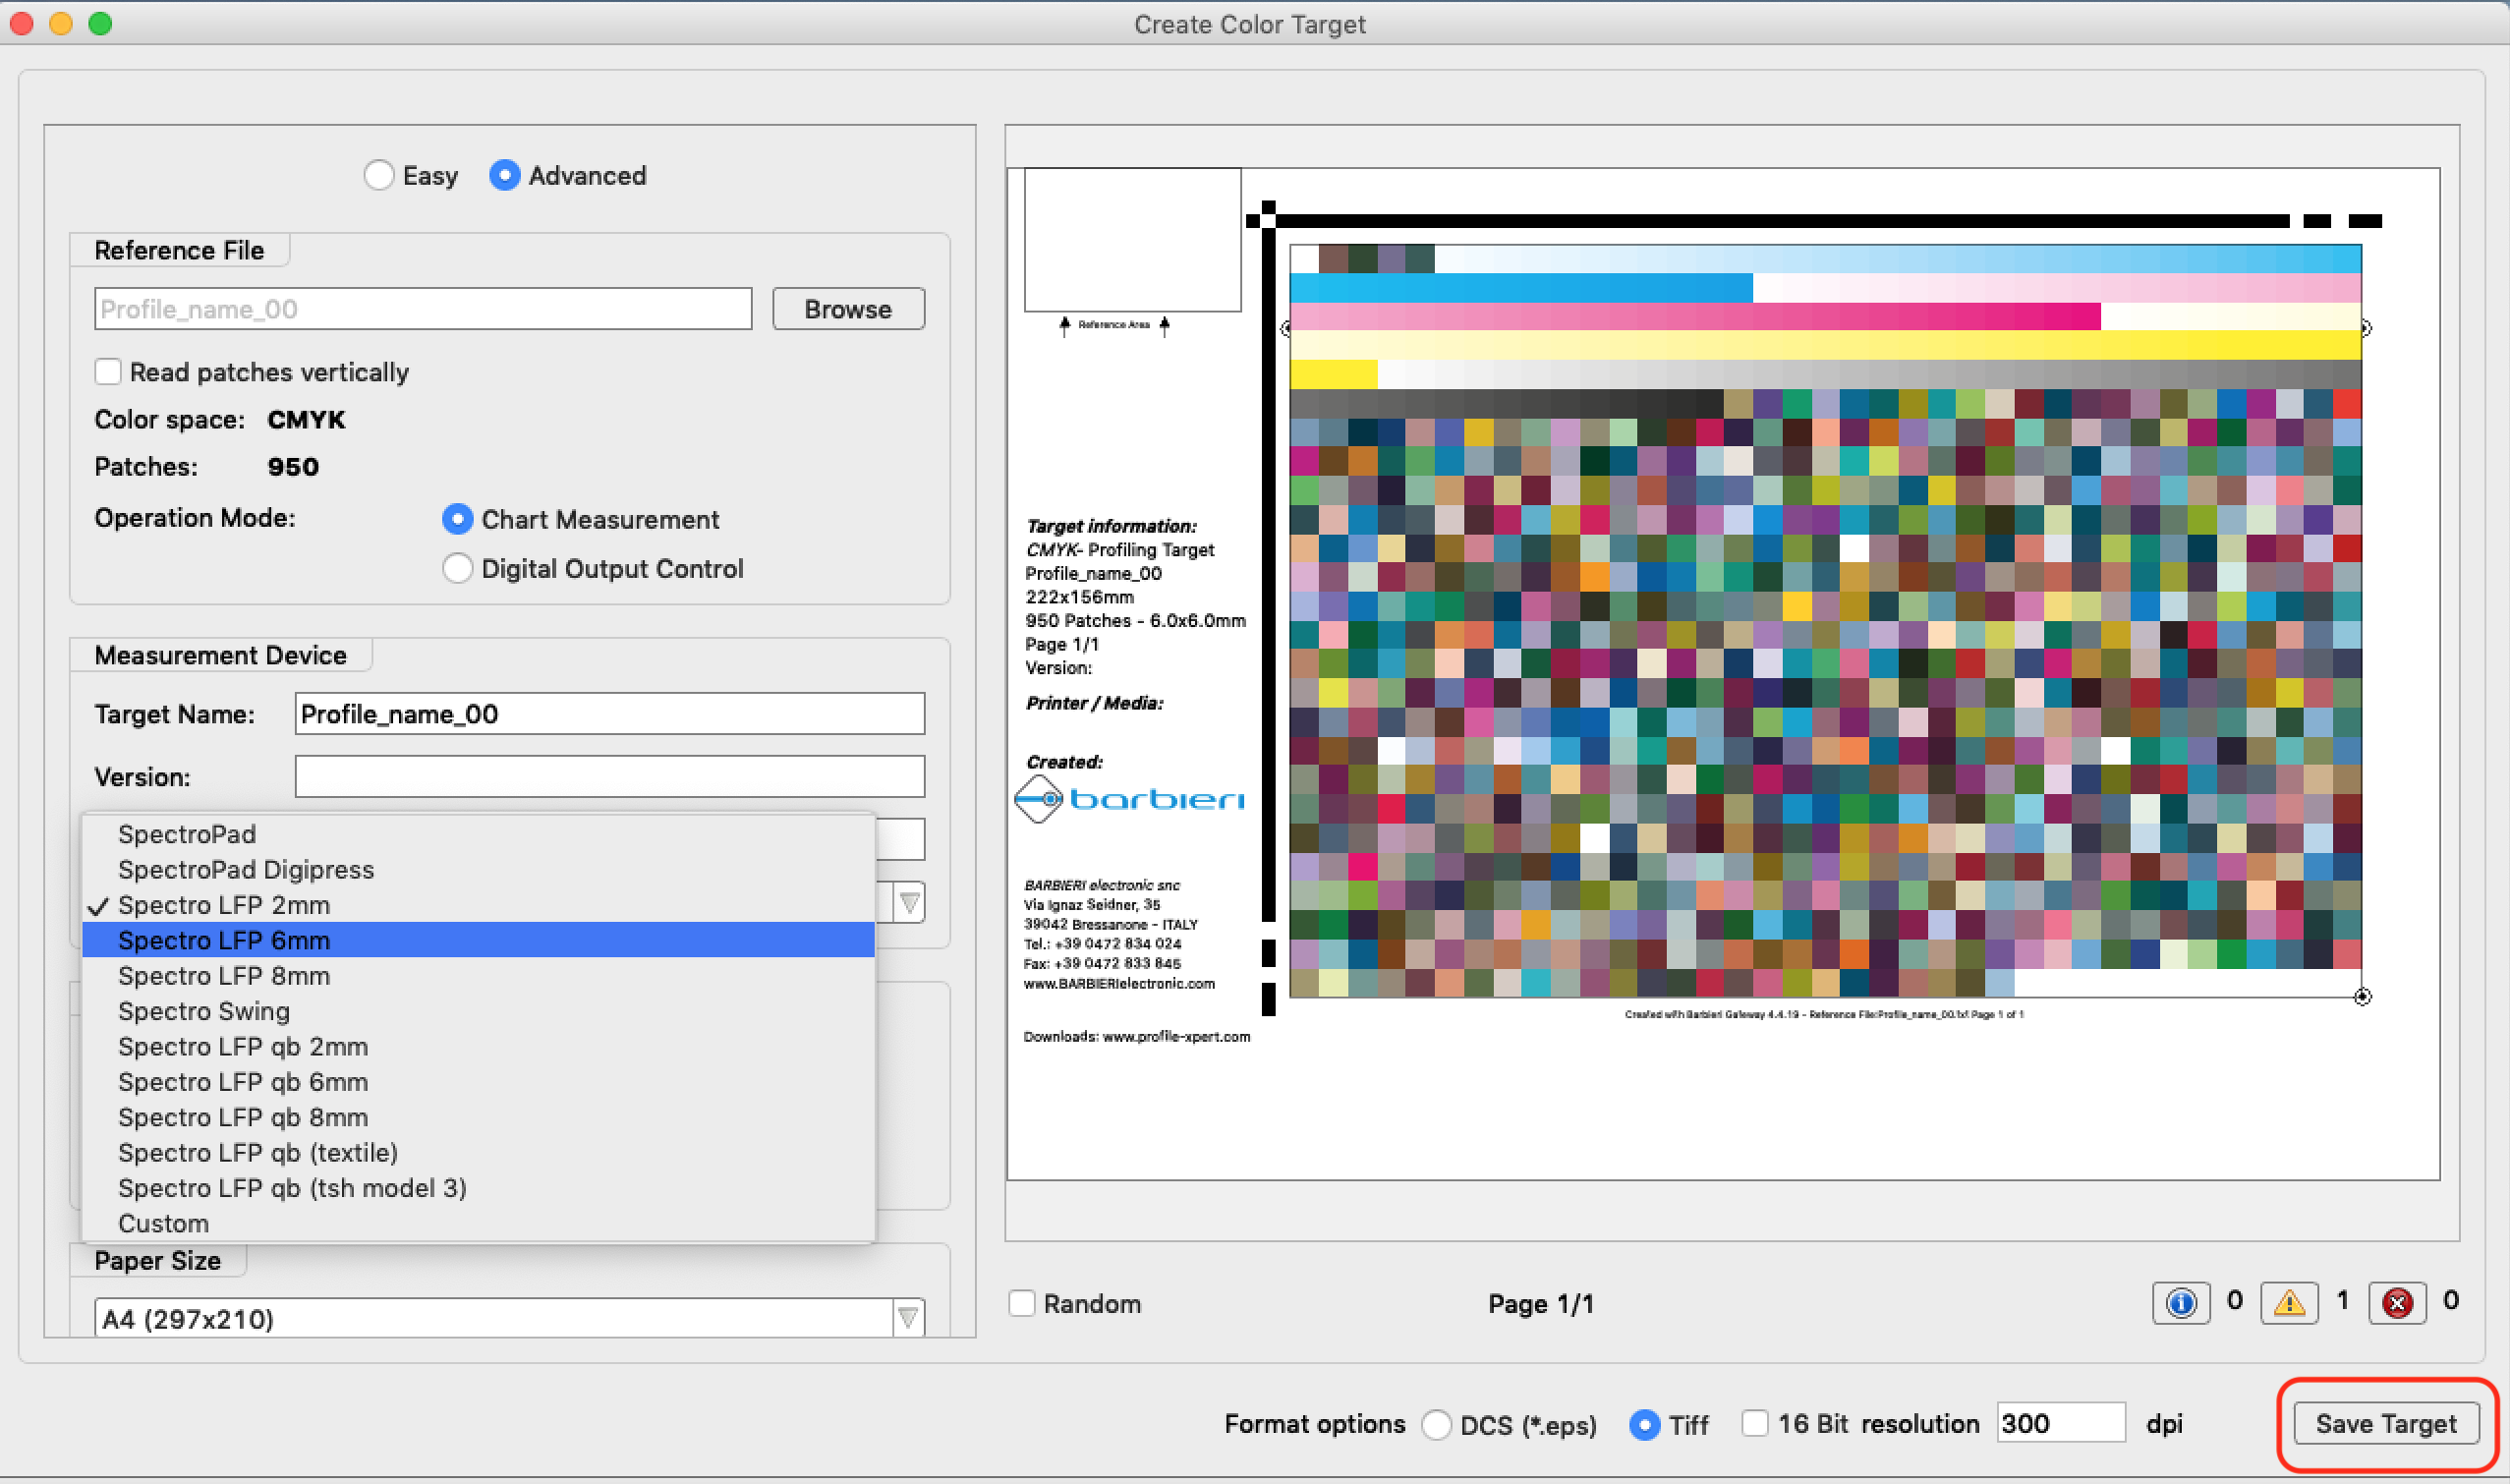
Click on " Save test pattern to create the test pattern and associated data.
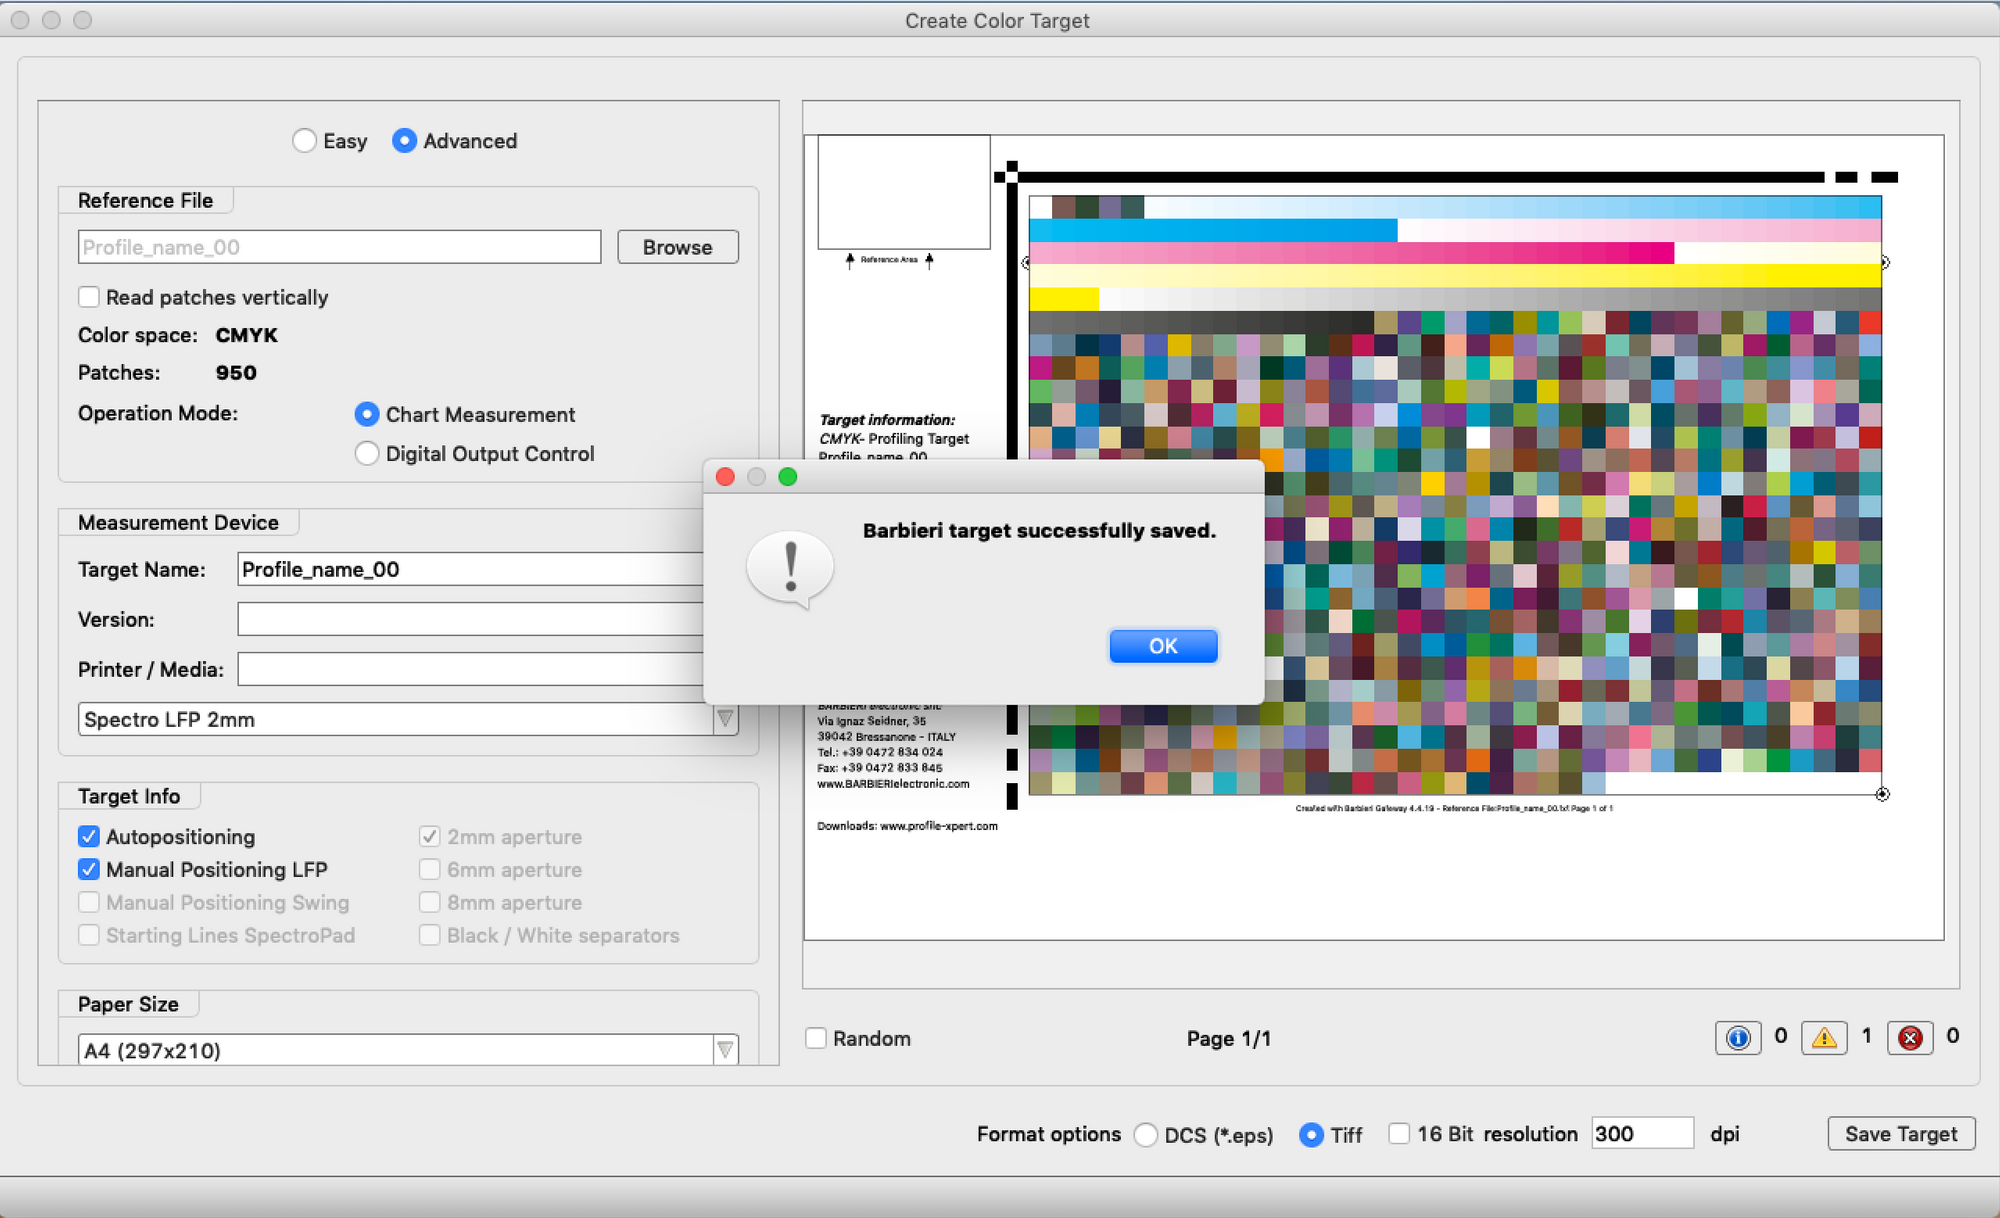
The data and patterns to be printed are stored in the " Pattern " folder. The default path is ../User/.../Documents/Barbieri/Gateway/Chart/Targets/
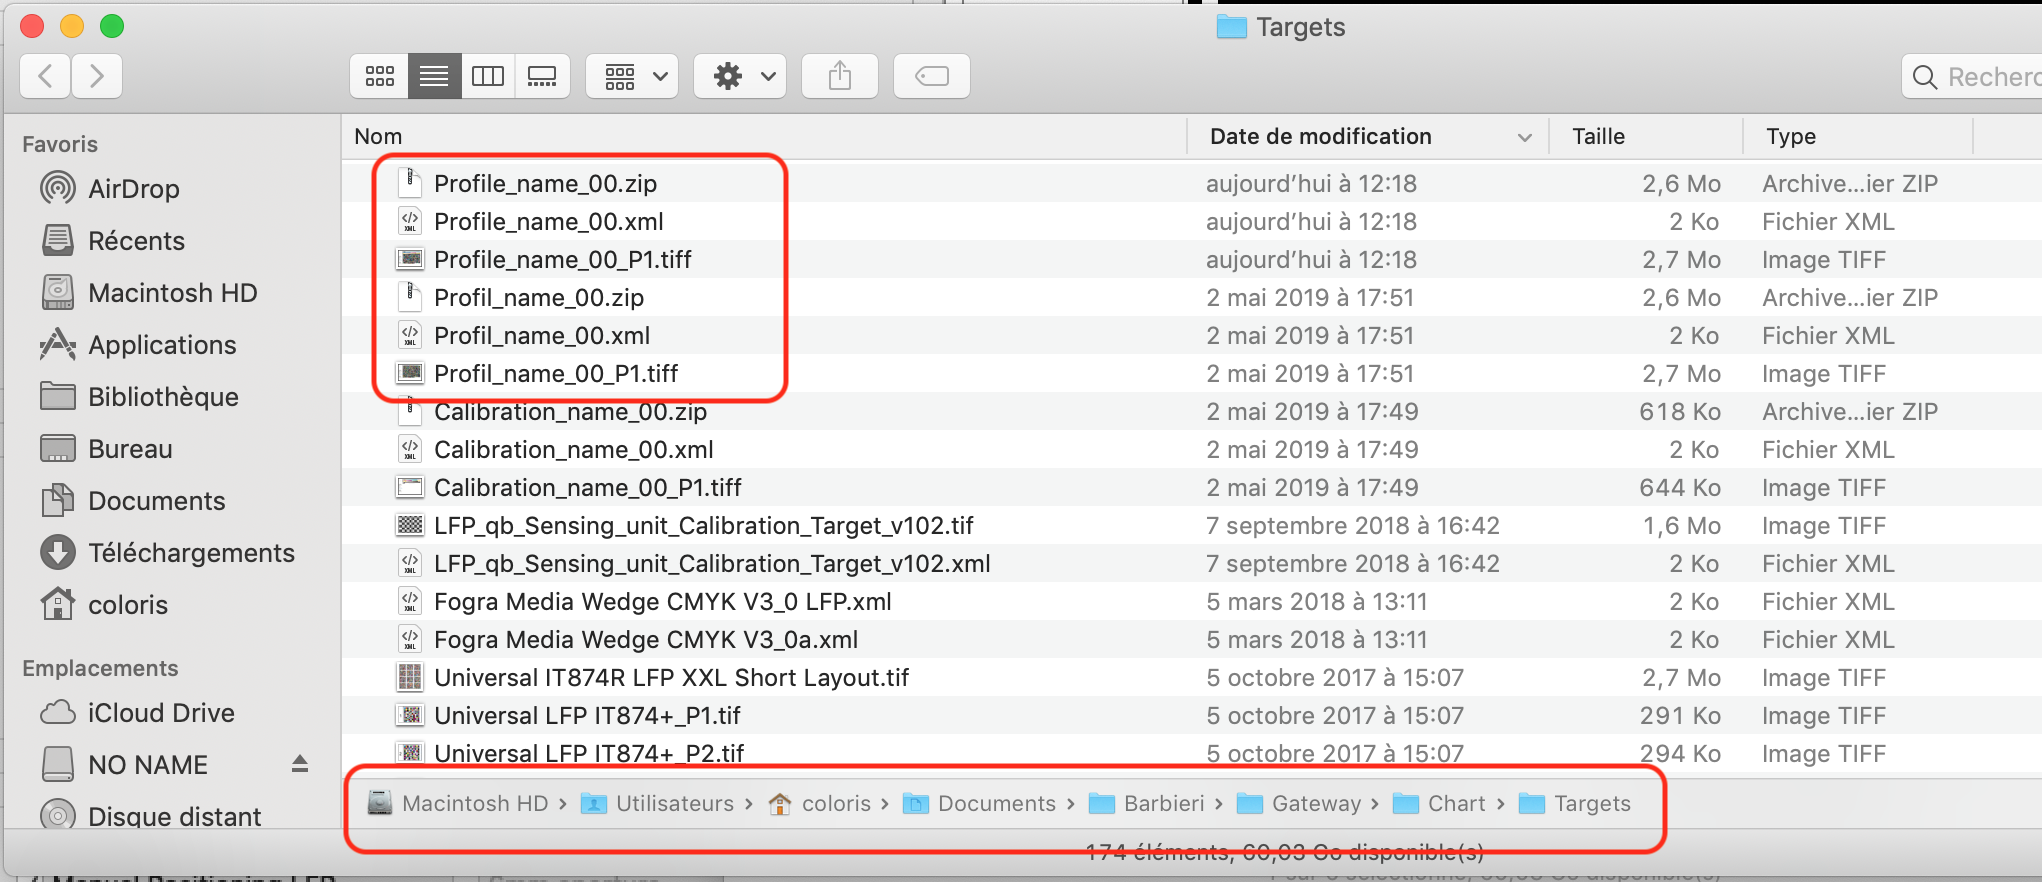
Print the Barbieri charter
The CMYK chart that we have generated is intended for the creation of a CMYK profile which will be used to characterize a printer controlled by a RIP.
Do not forget to deactivate the color management to print this test chart.
Print the test charts (Tiff Format).
Measure the Barbieri chart with the "Gateway" software
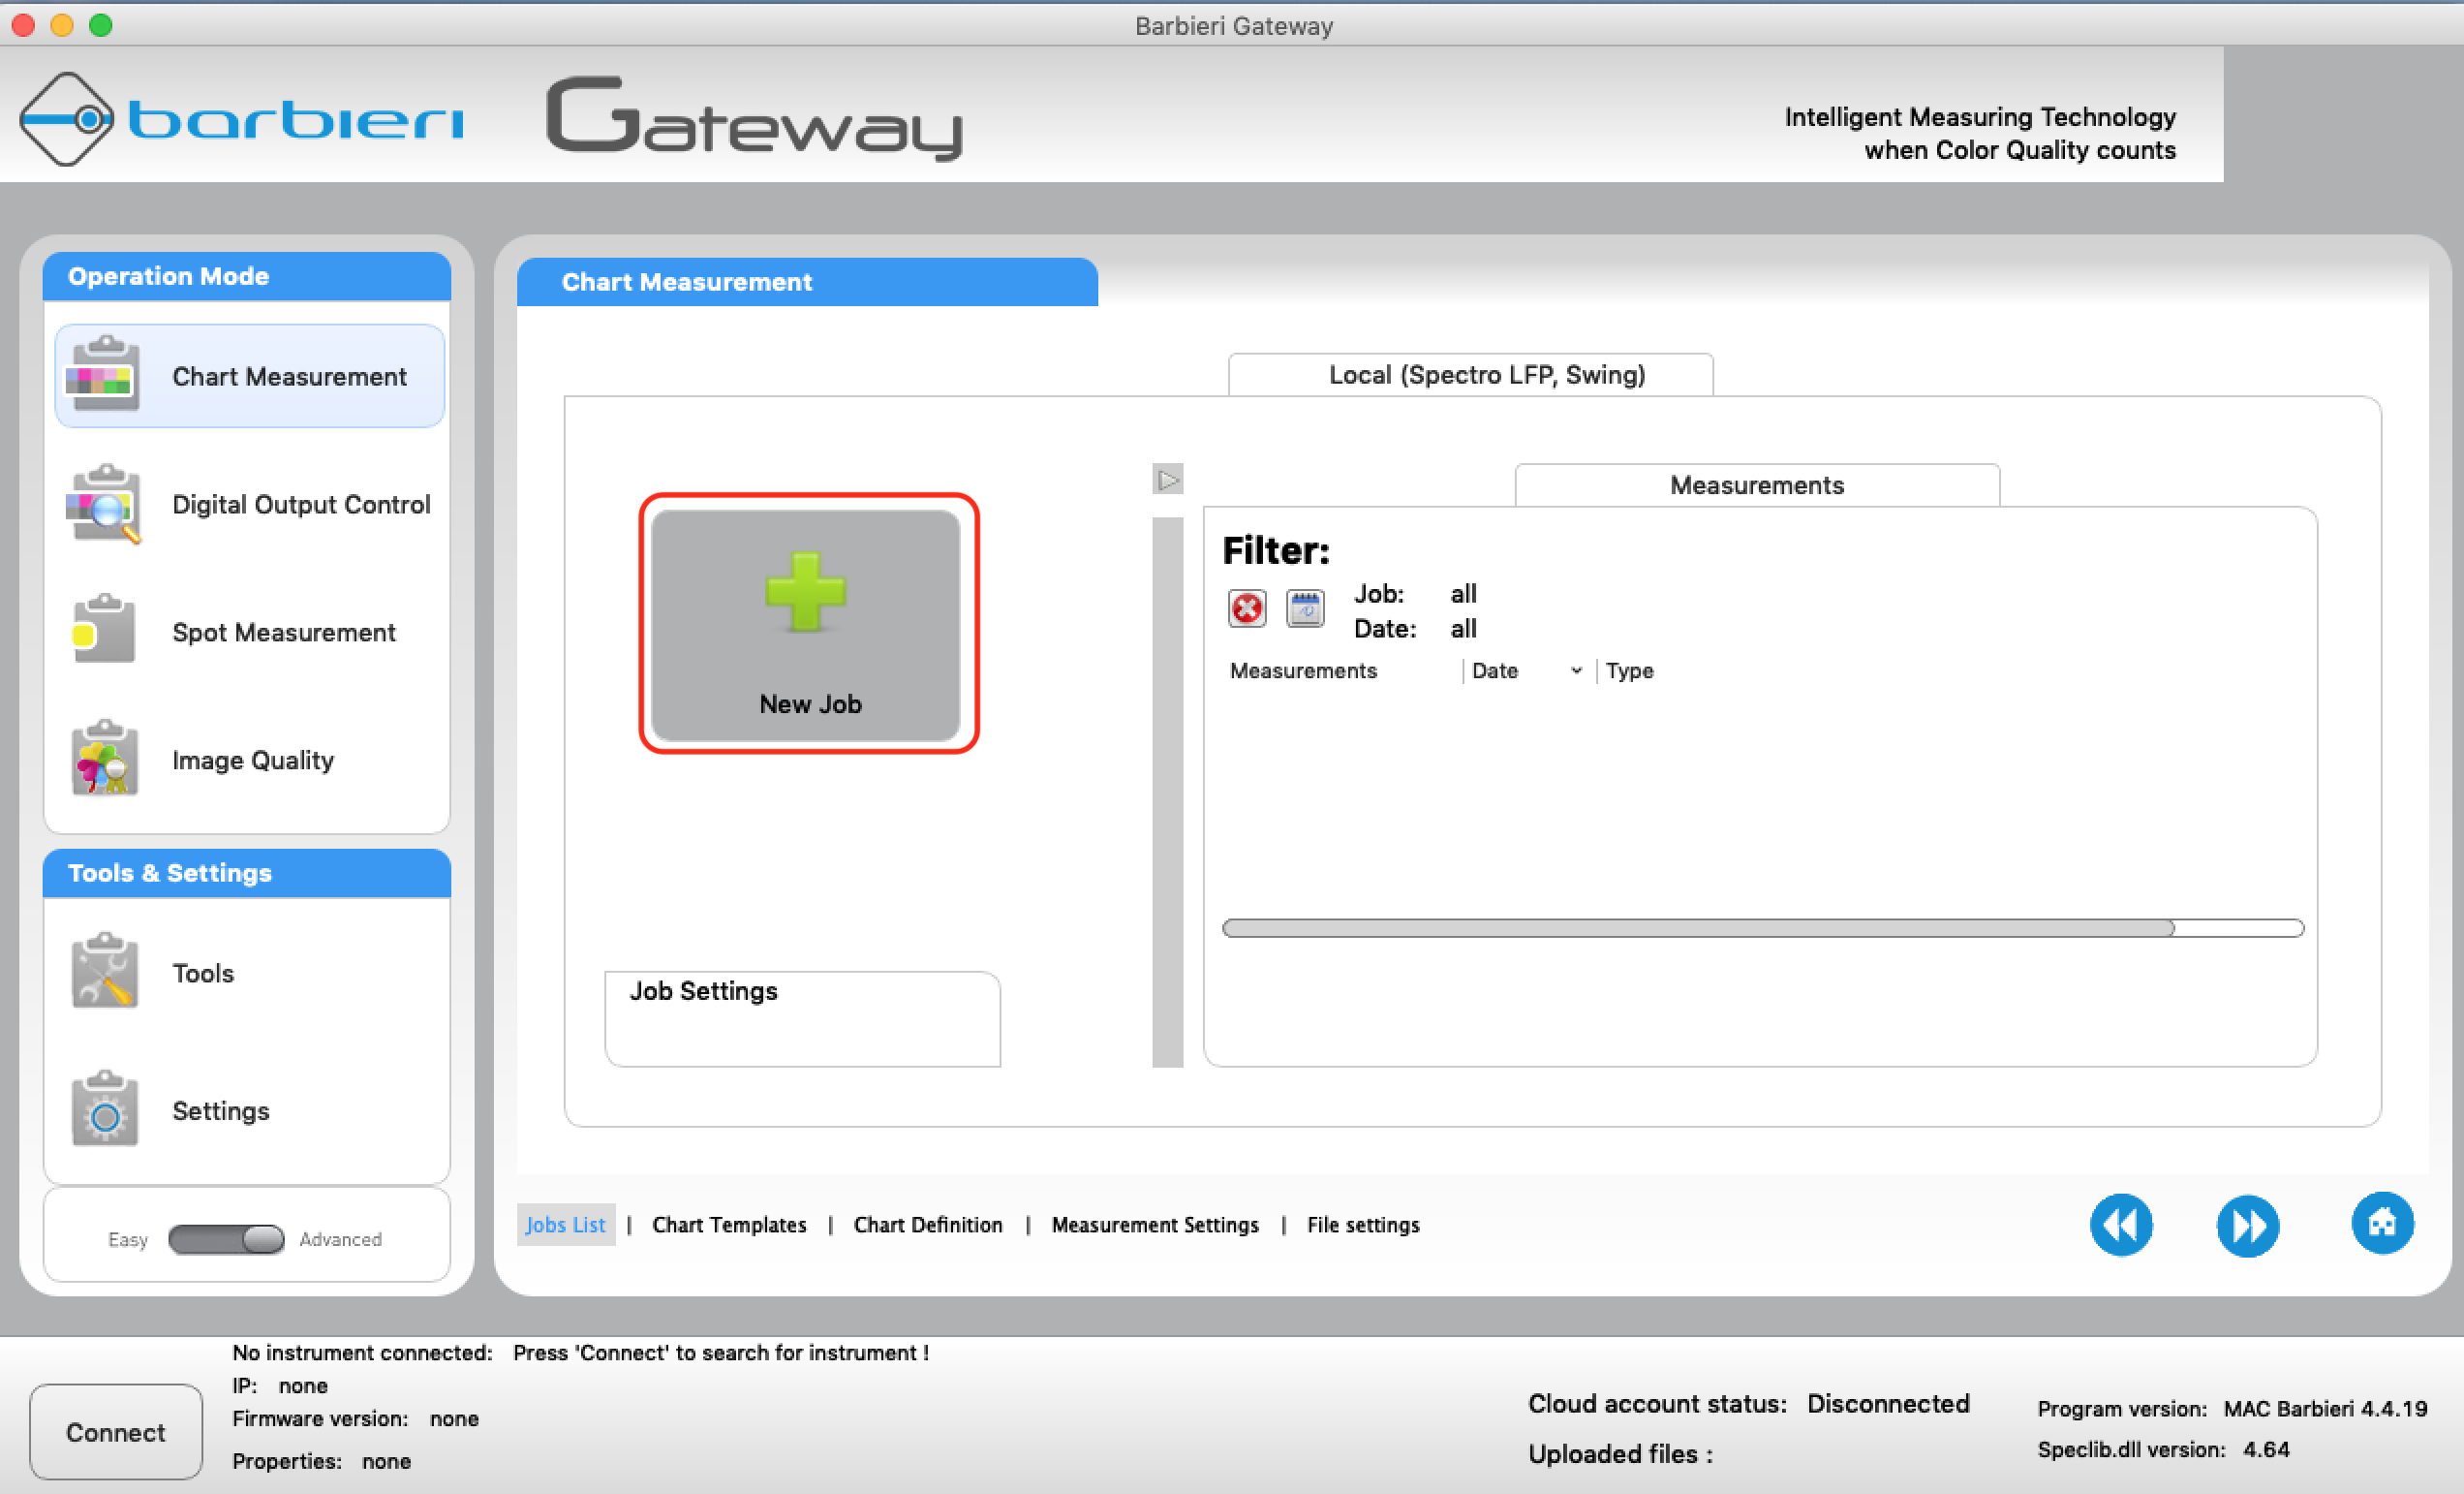
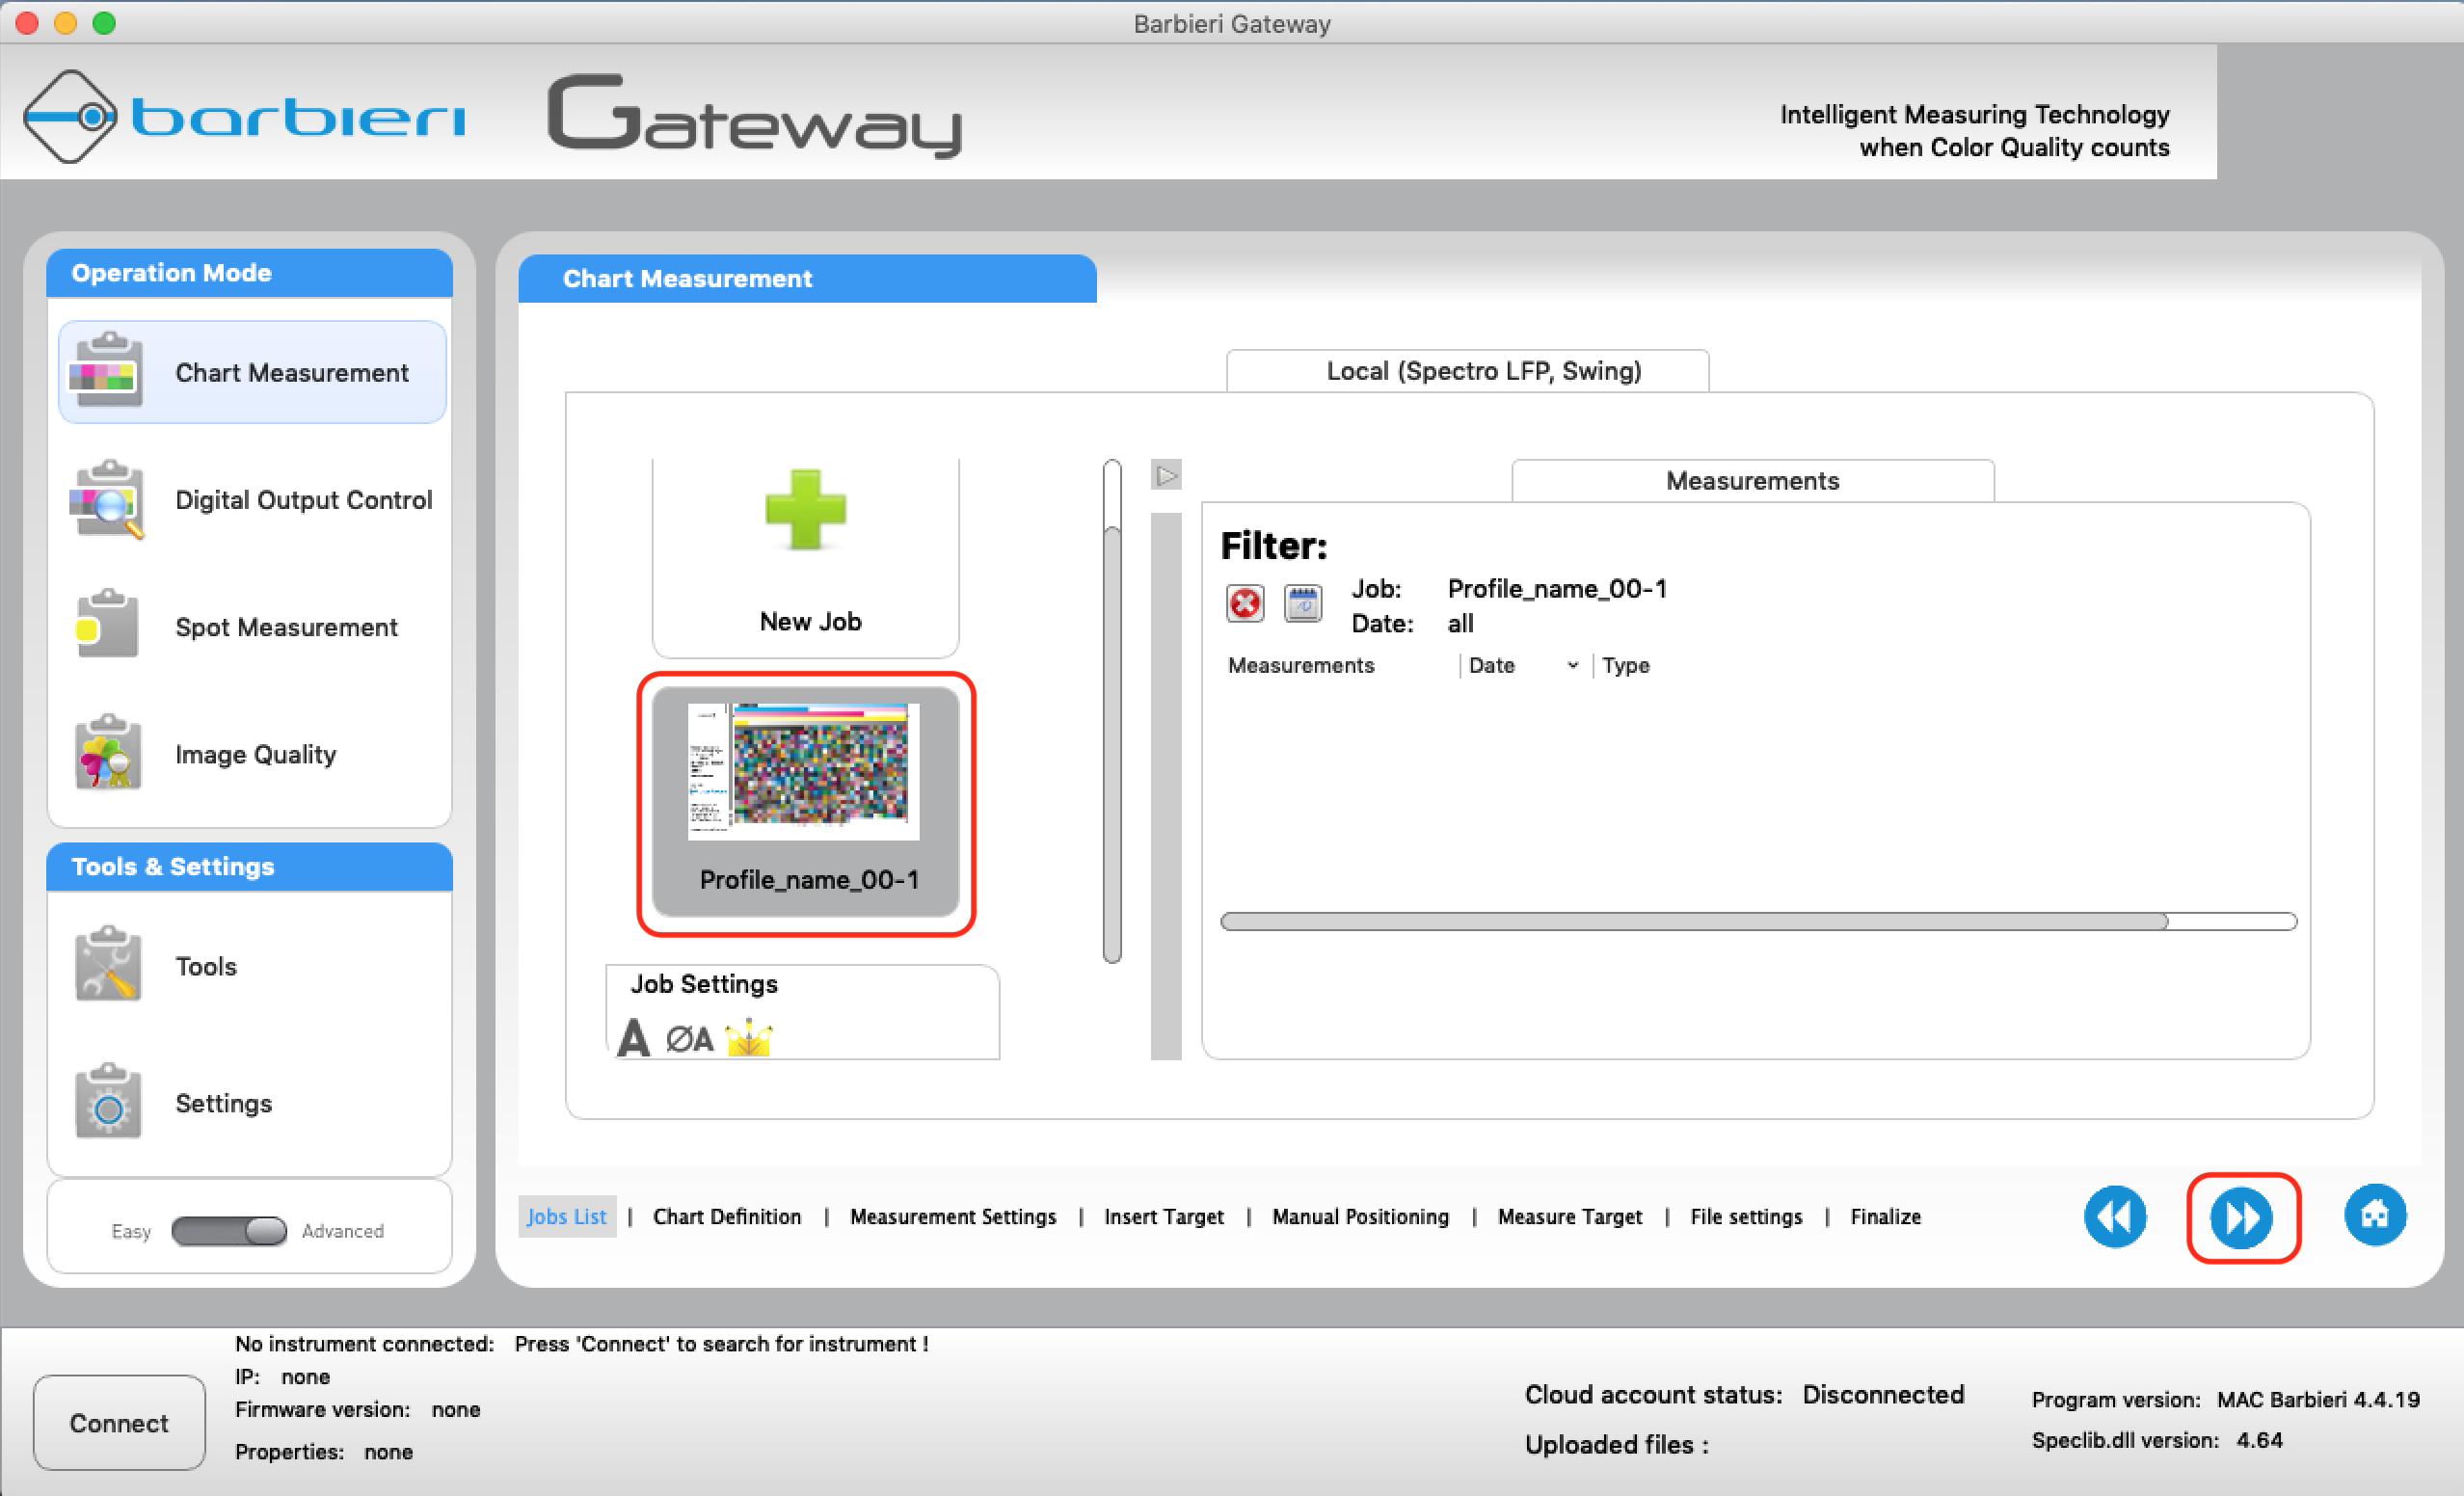
Start the Gateway software and create a new job.
You don't need to create a new "Job" every time you need to use Gateway. You can still use the same job. But it would be interesting to create four different jobs for:
- RGB calibration chart
- RGB characterization chart
- CMYK calibration chart
- CMYK characterization chart
Click on the "Custom" folder
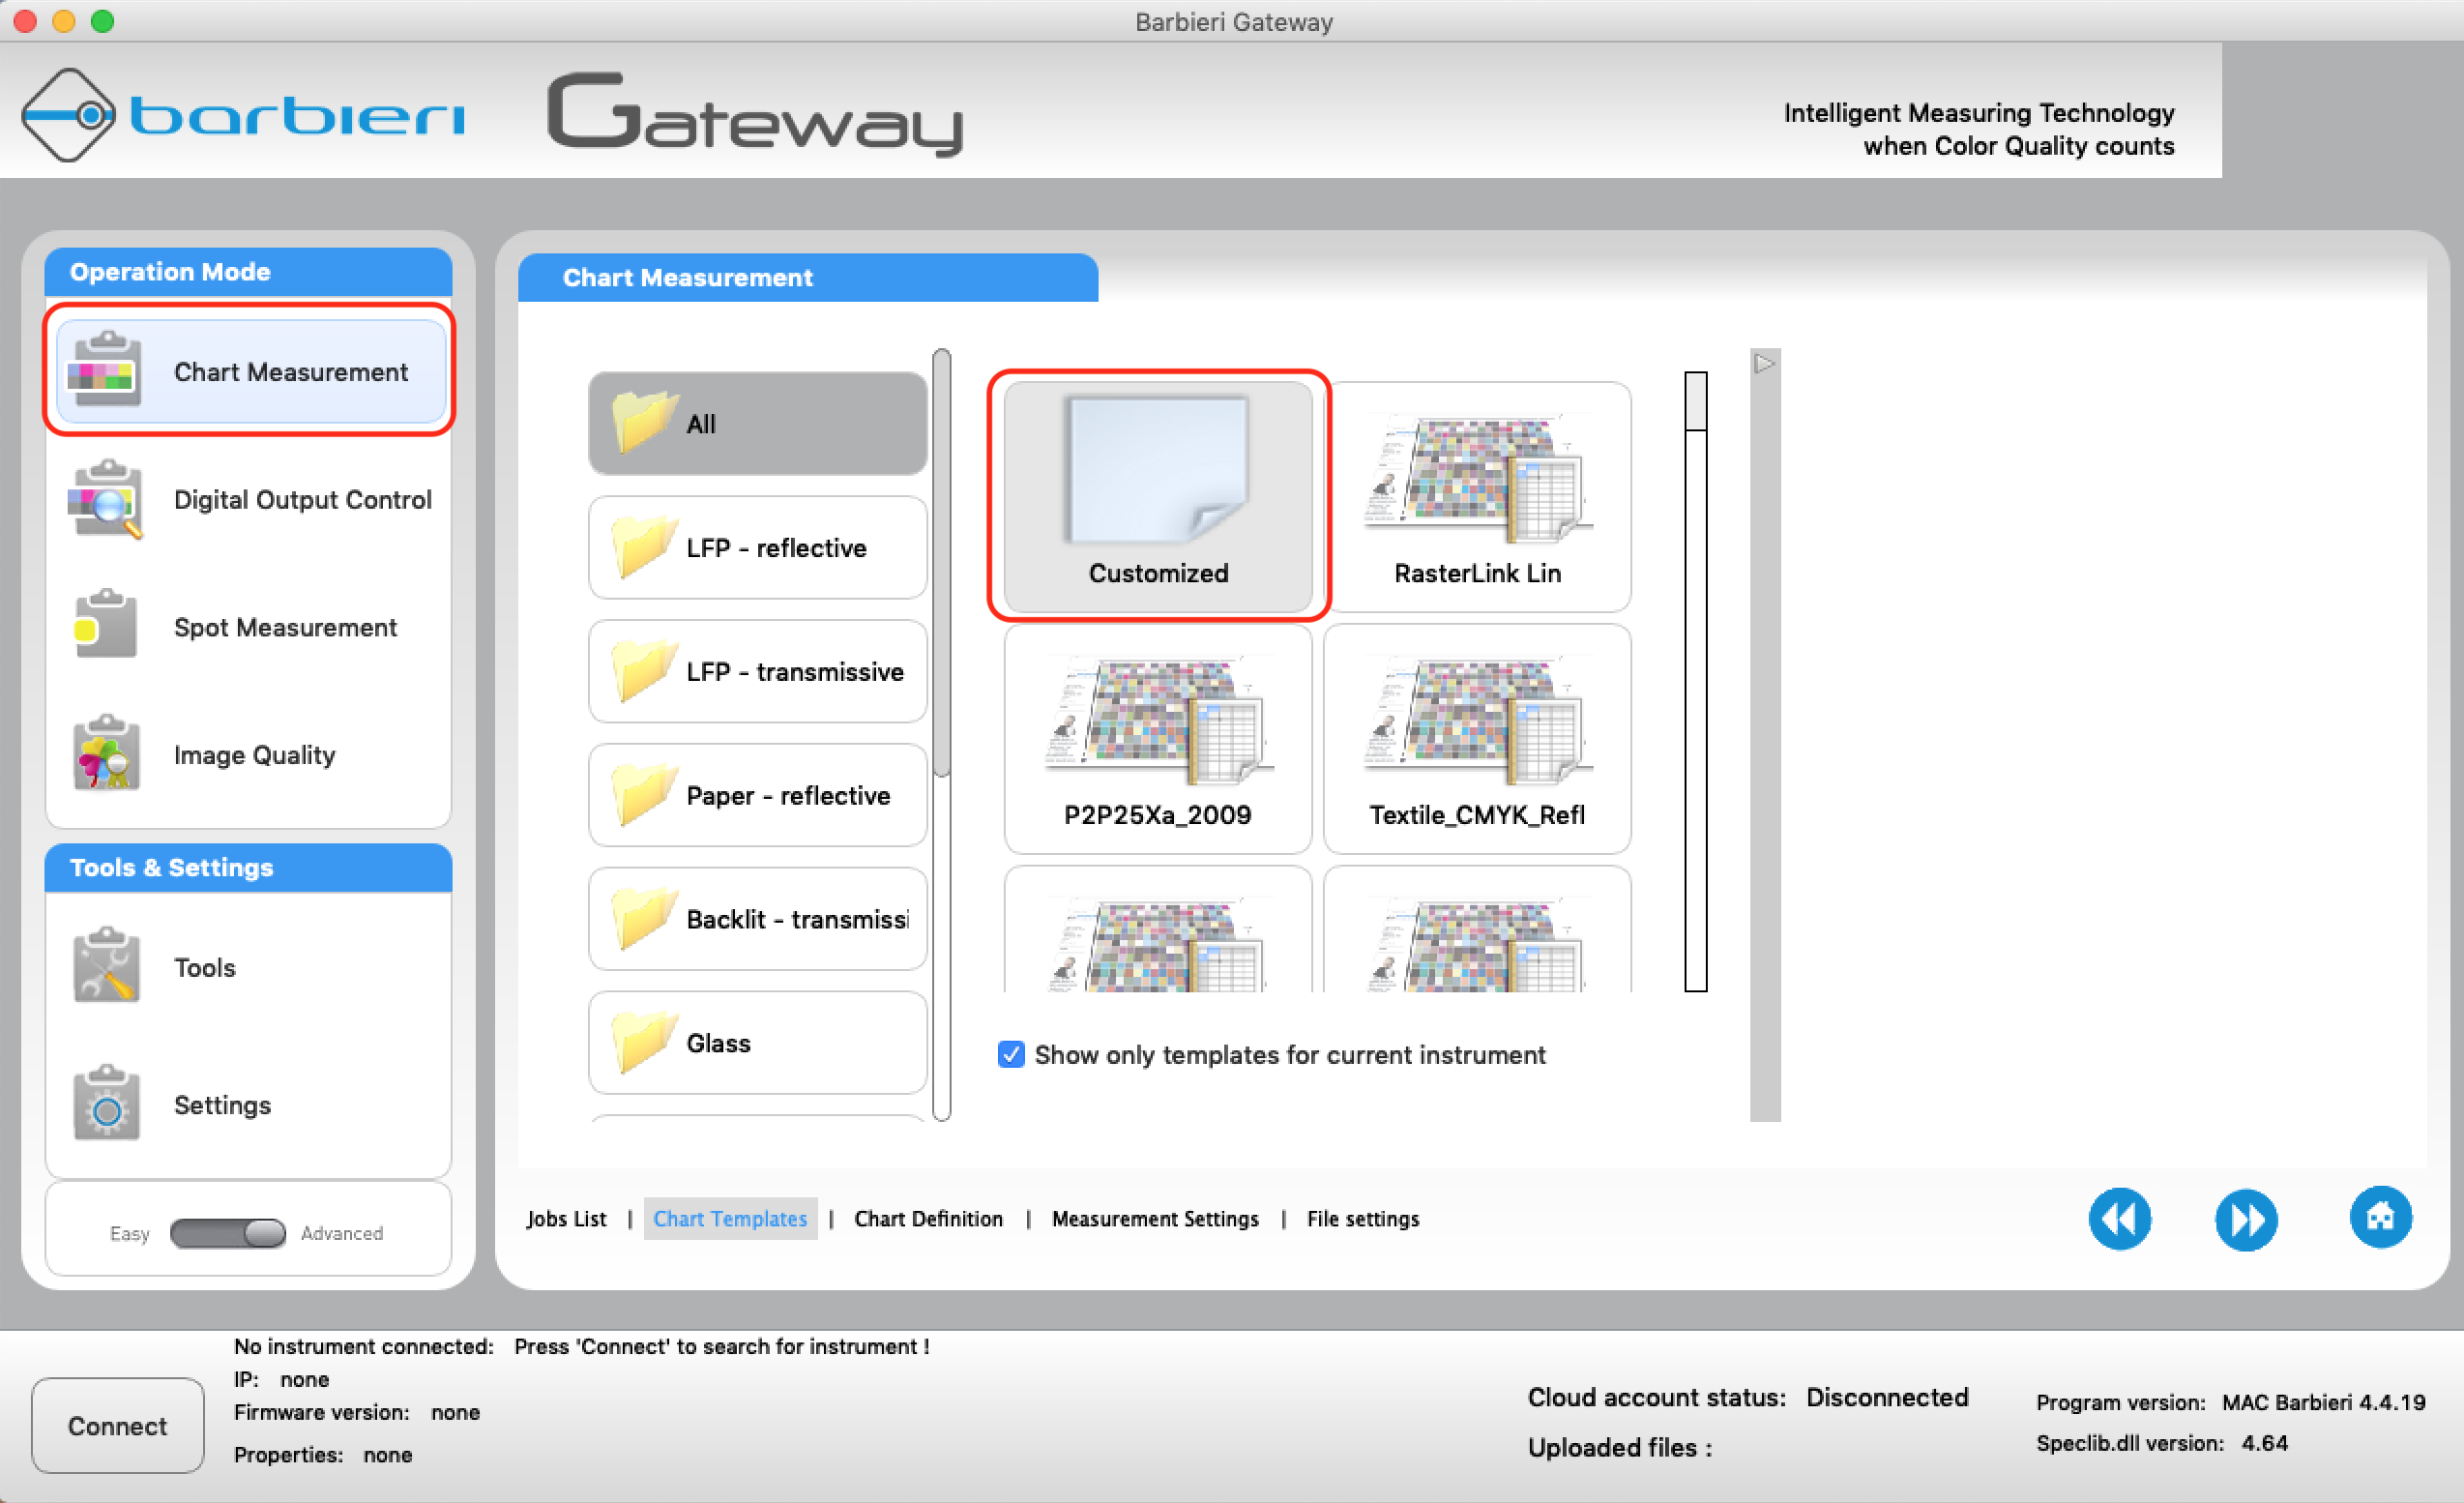
Select the Barbieri target created previously with "Chart Generator".
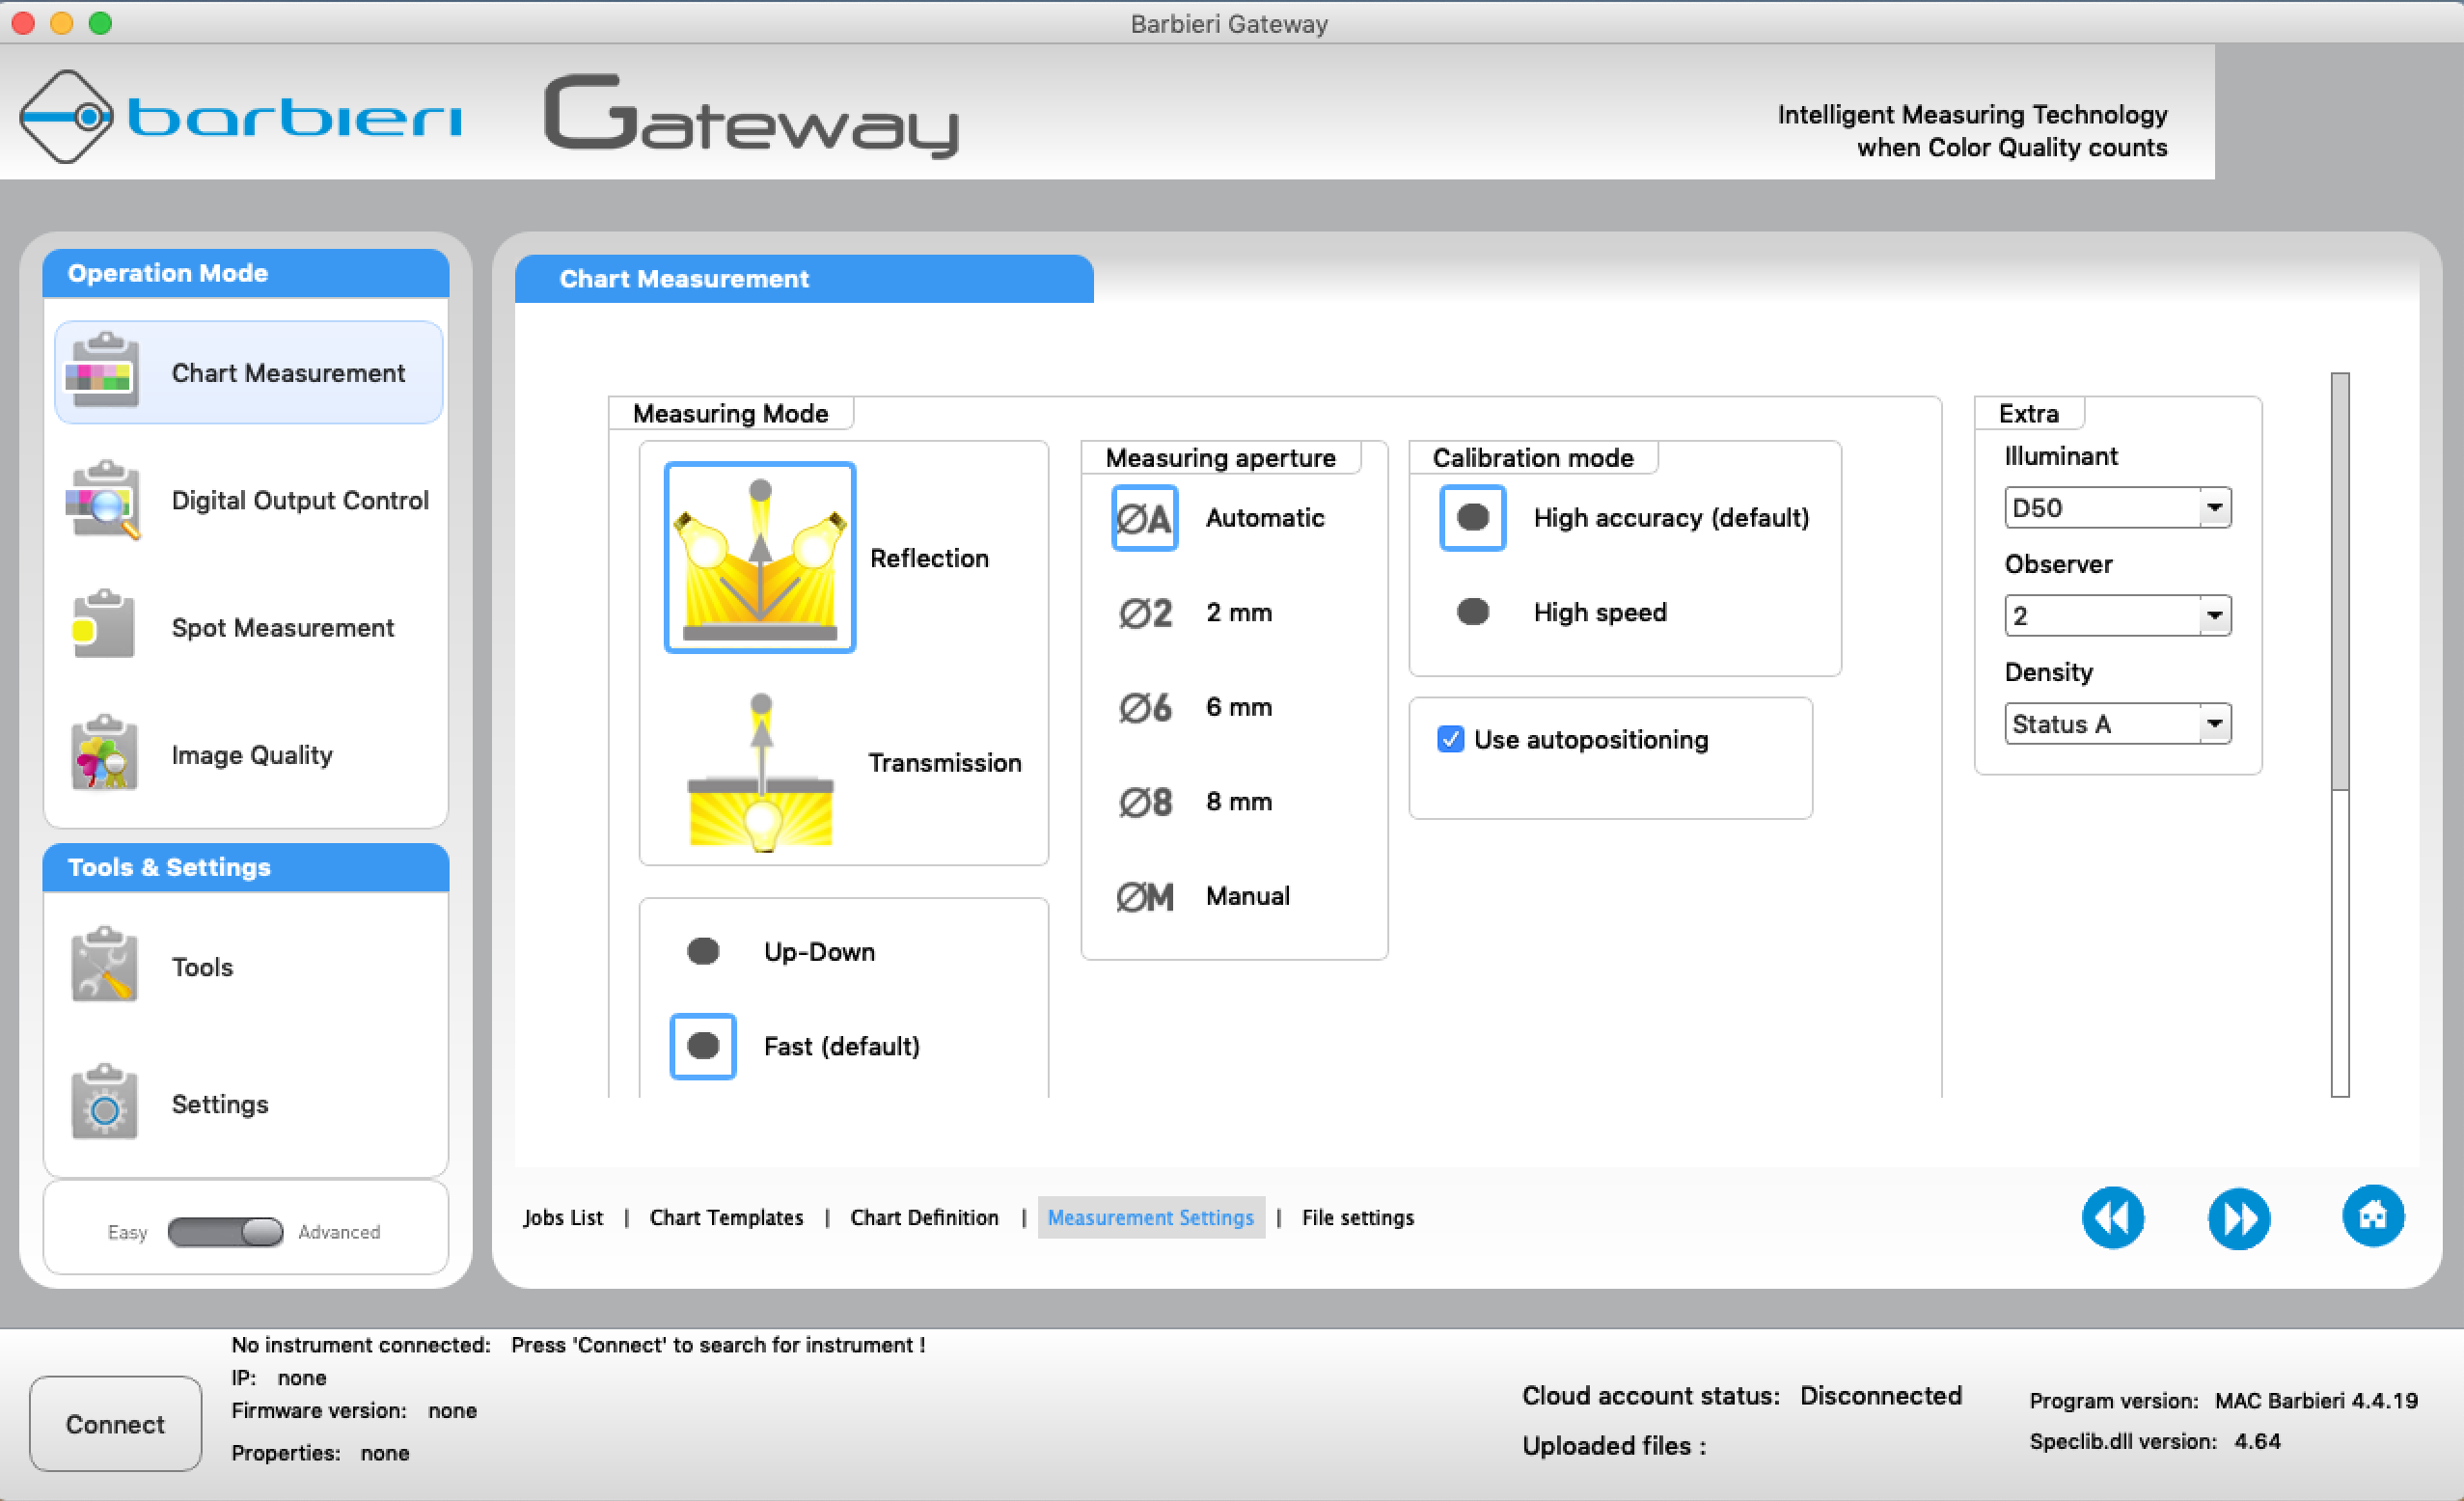
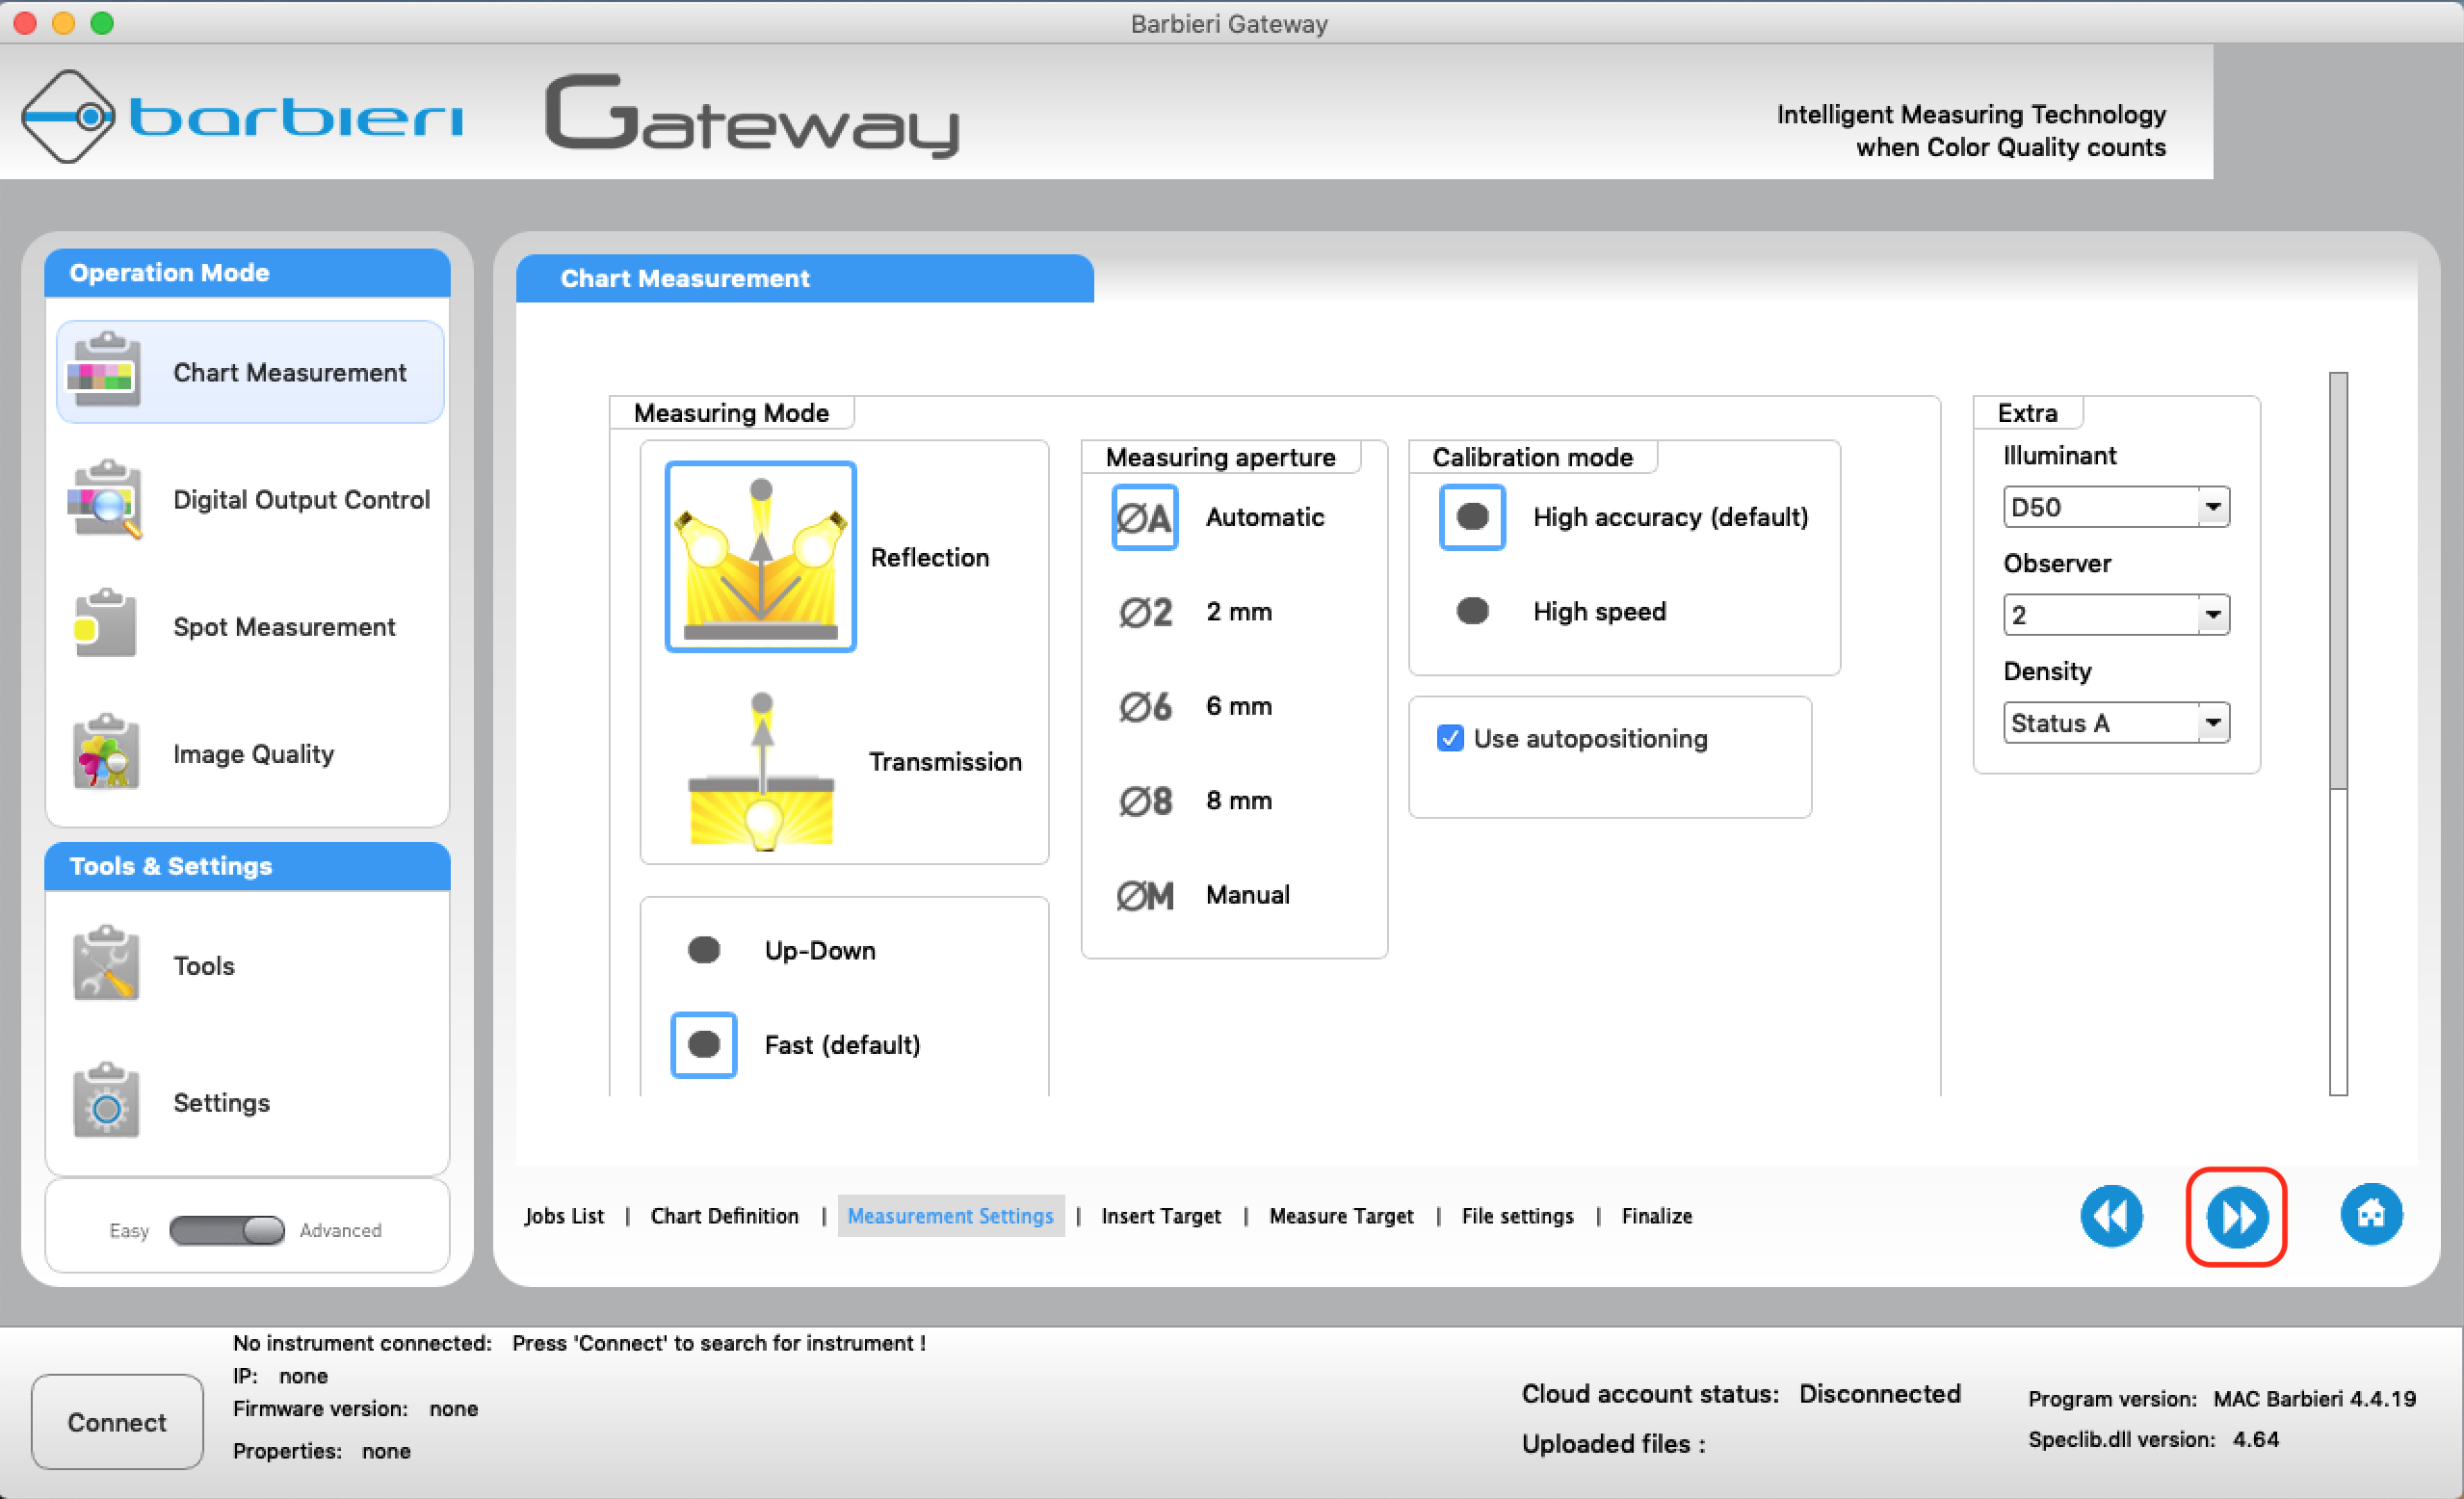
Define the measurement parameters
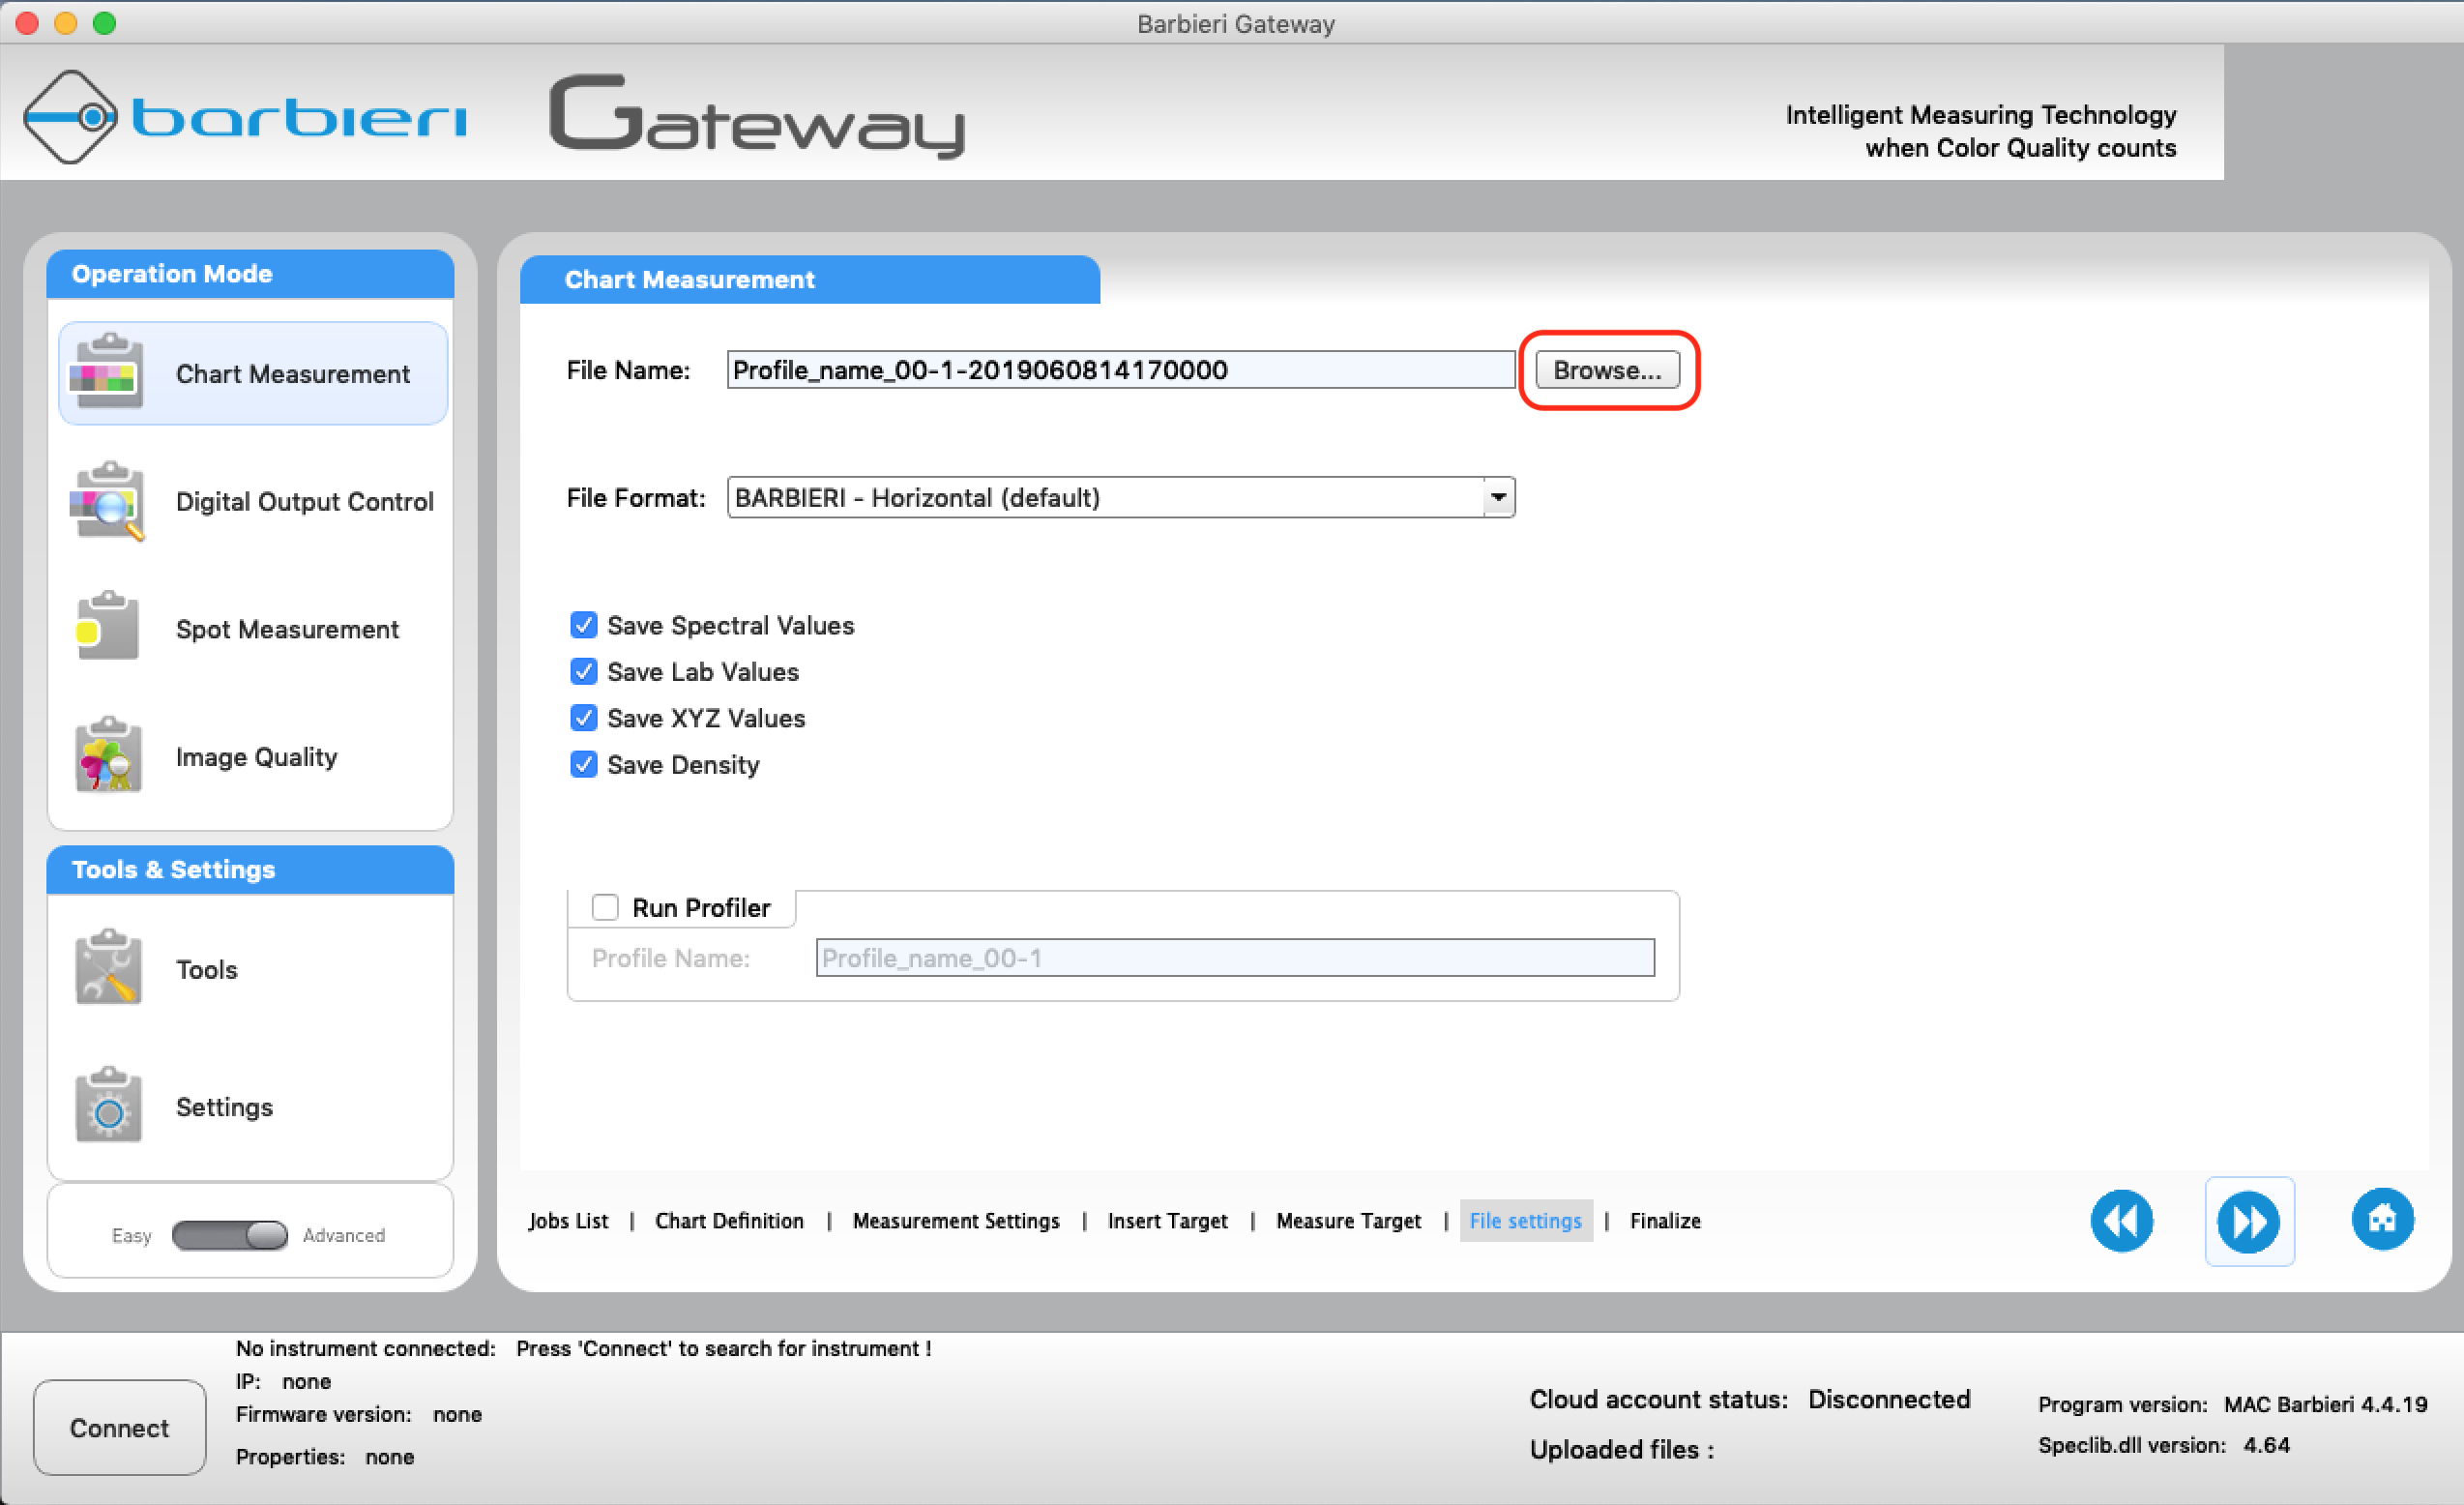
Define the file parameters

Once the job has been created, double-click on it to start the reading procedure.
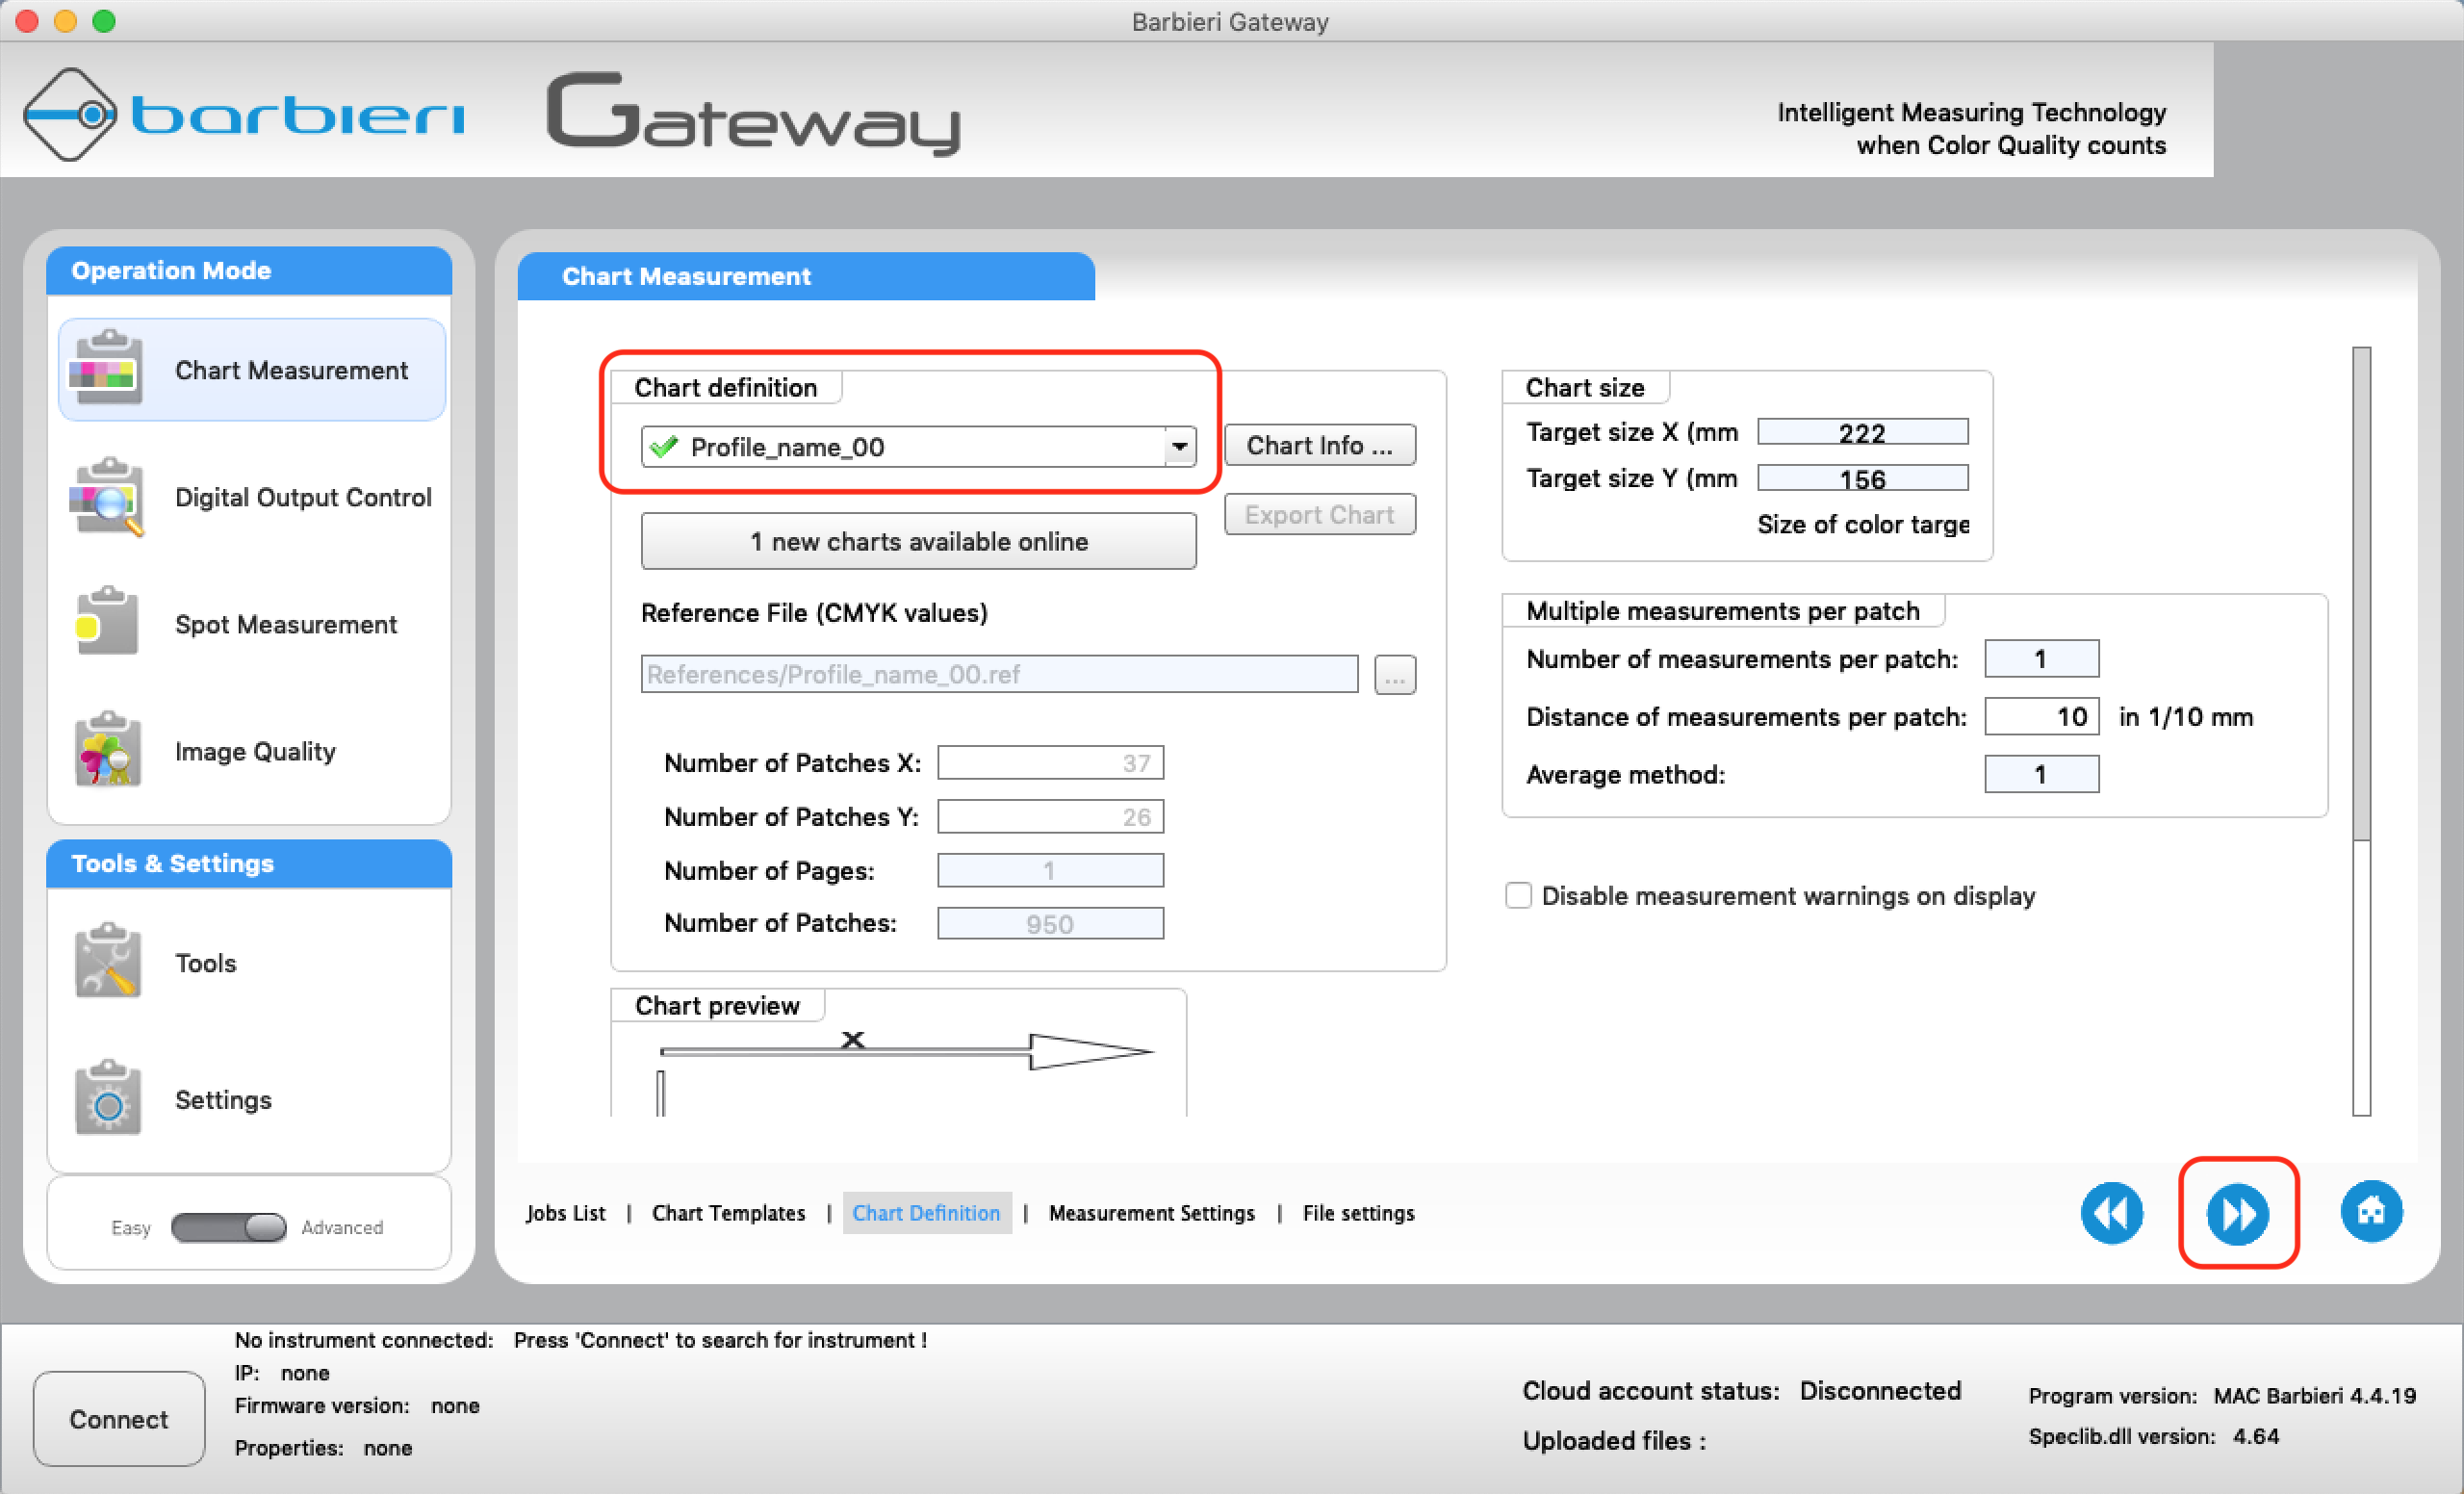
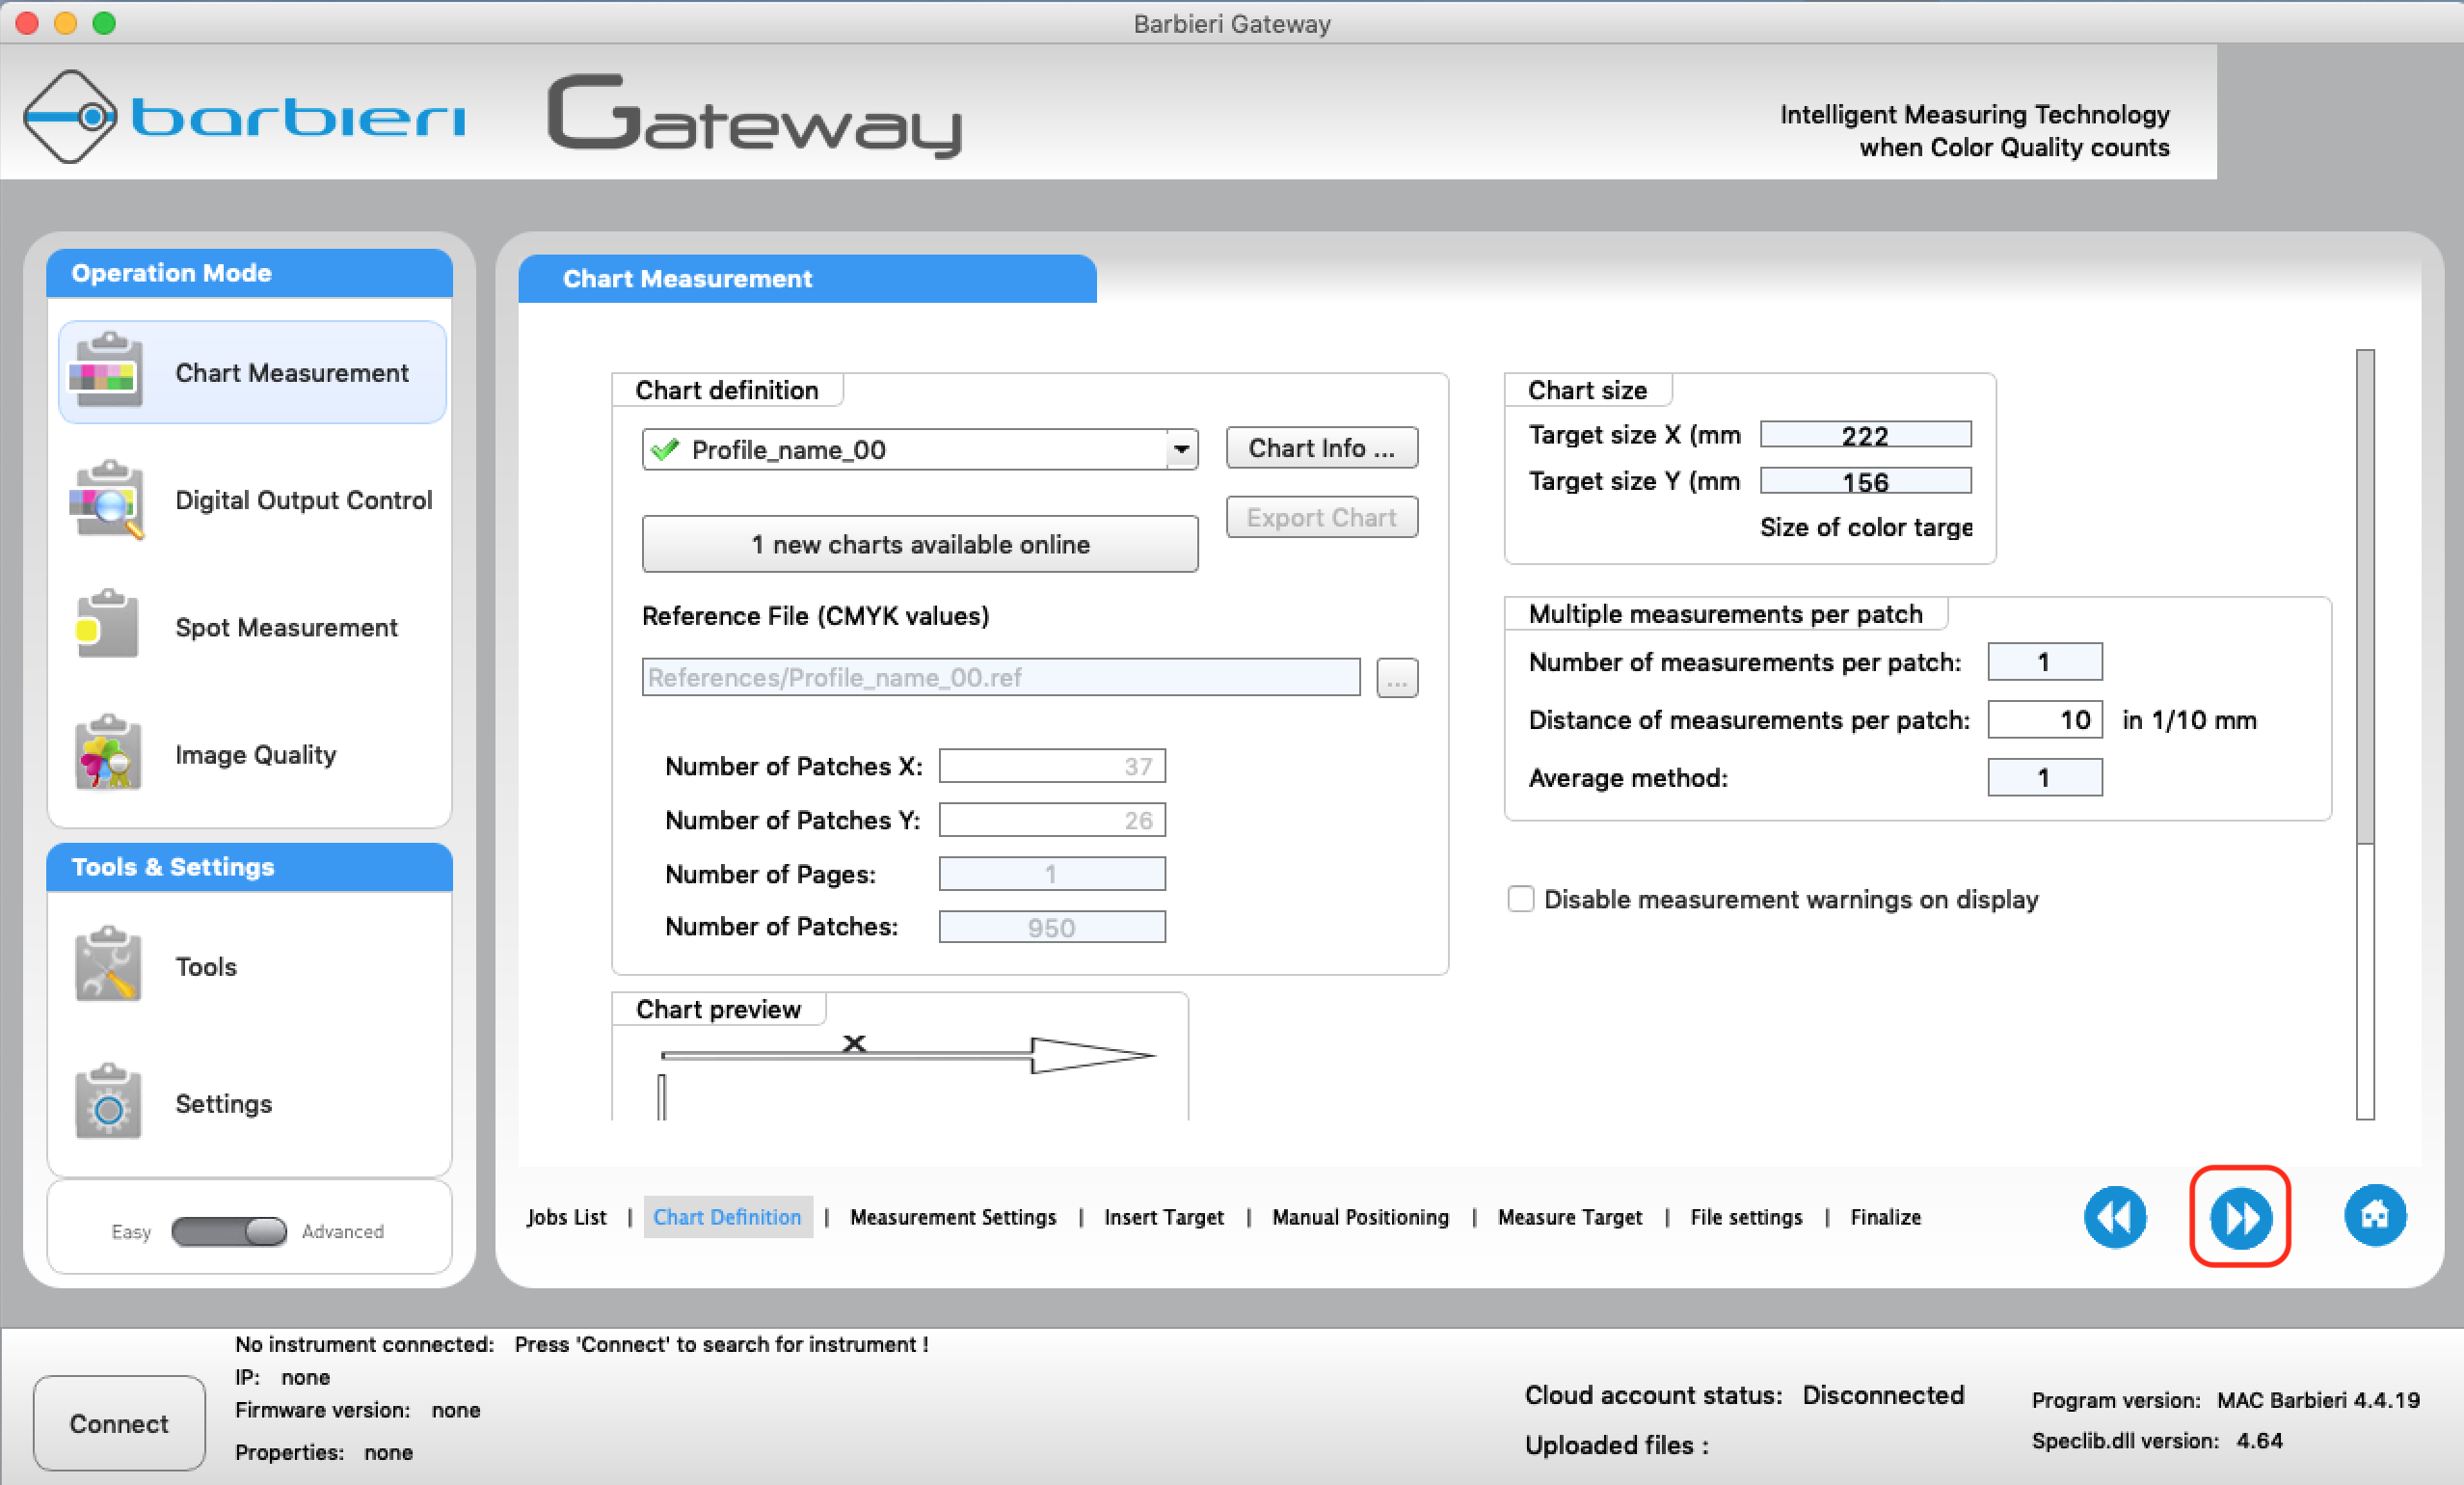
Check the definition of the staff
Check the measurement parameters
Install the holder with the printed staff on the Barbieri spectrophotometer.
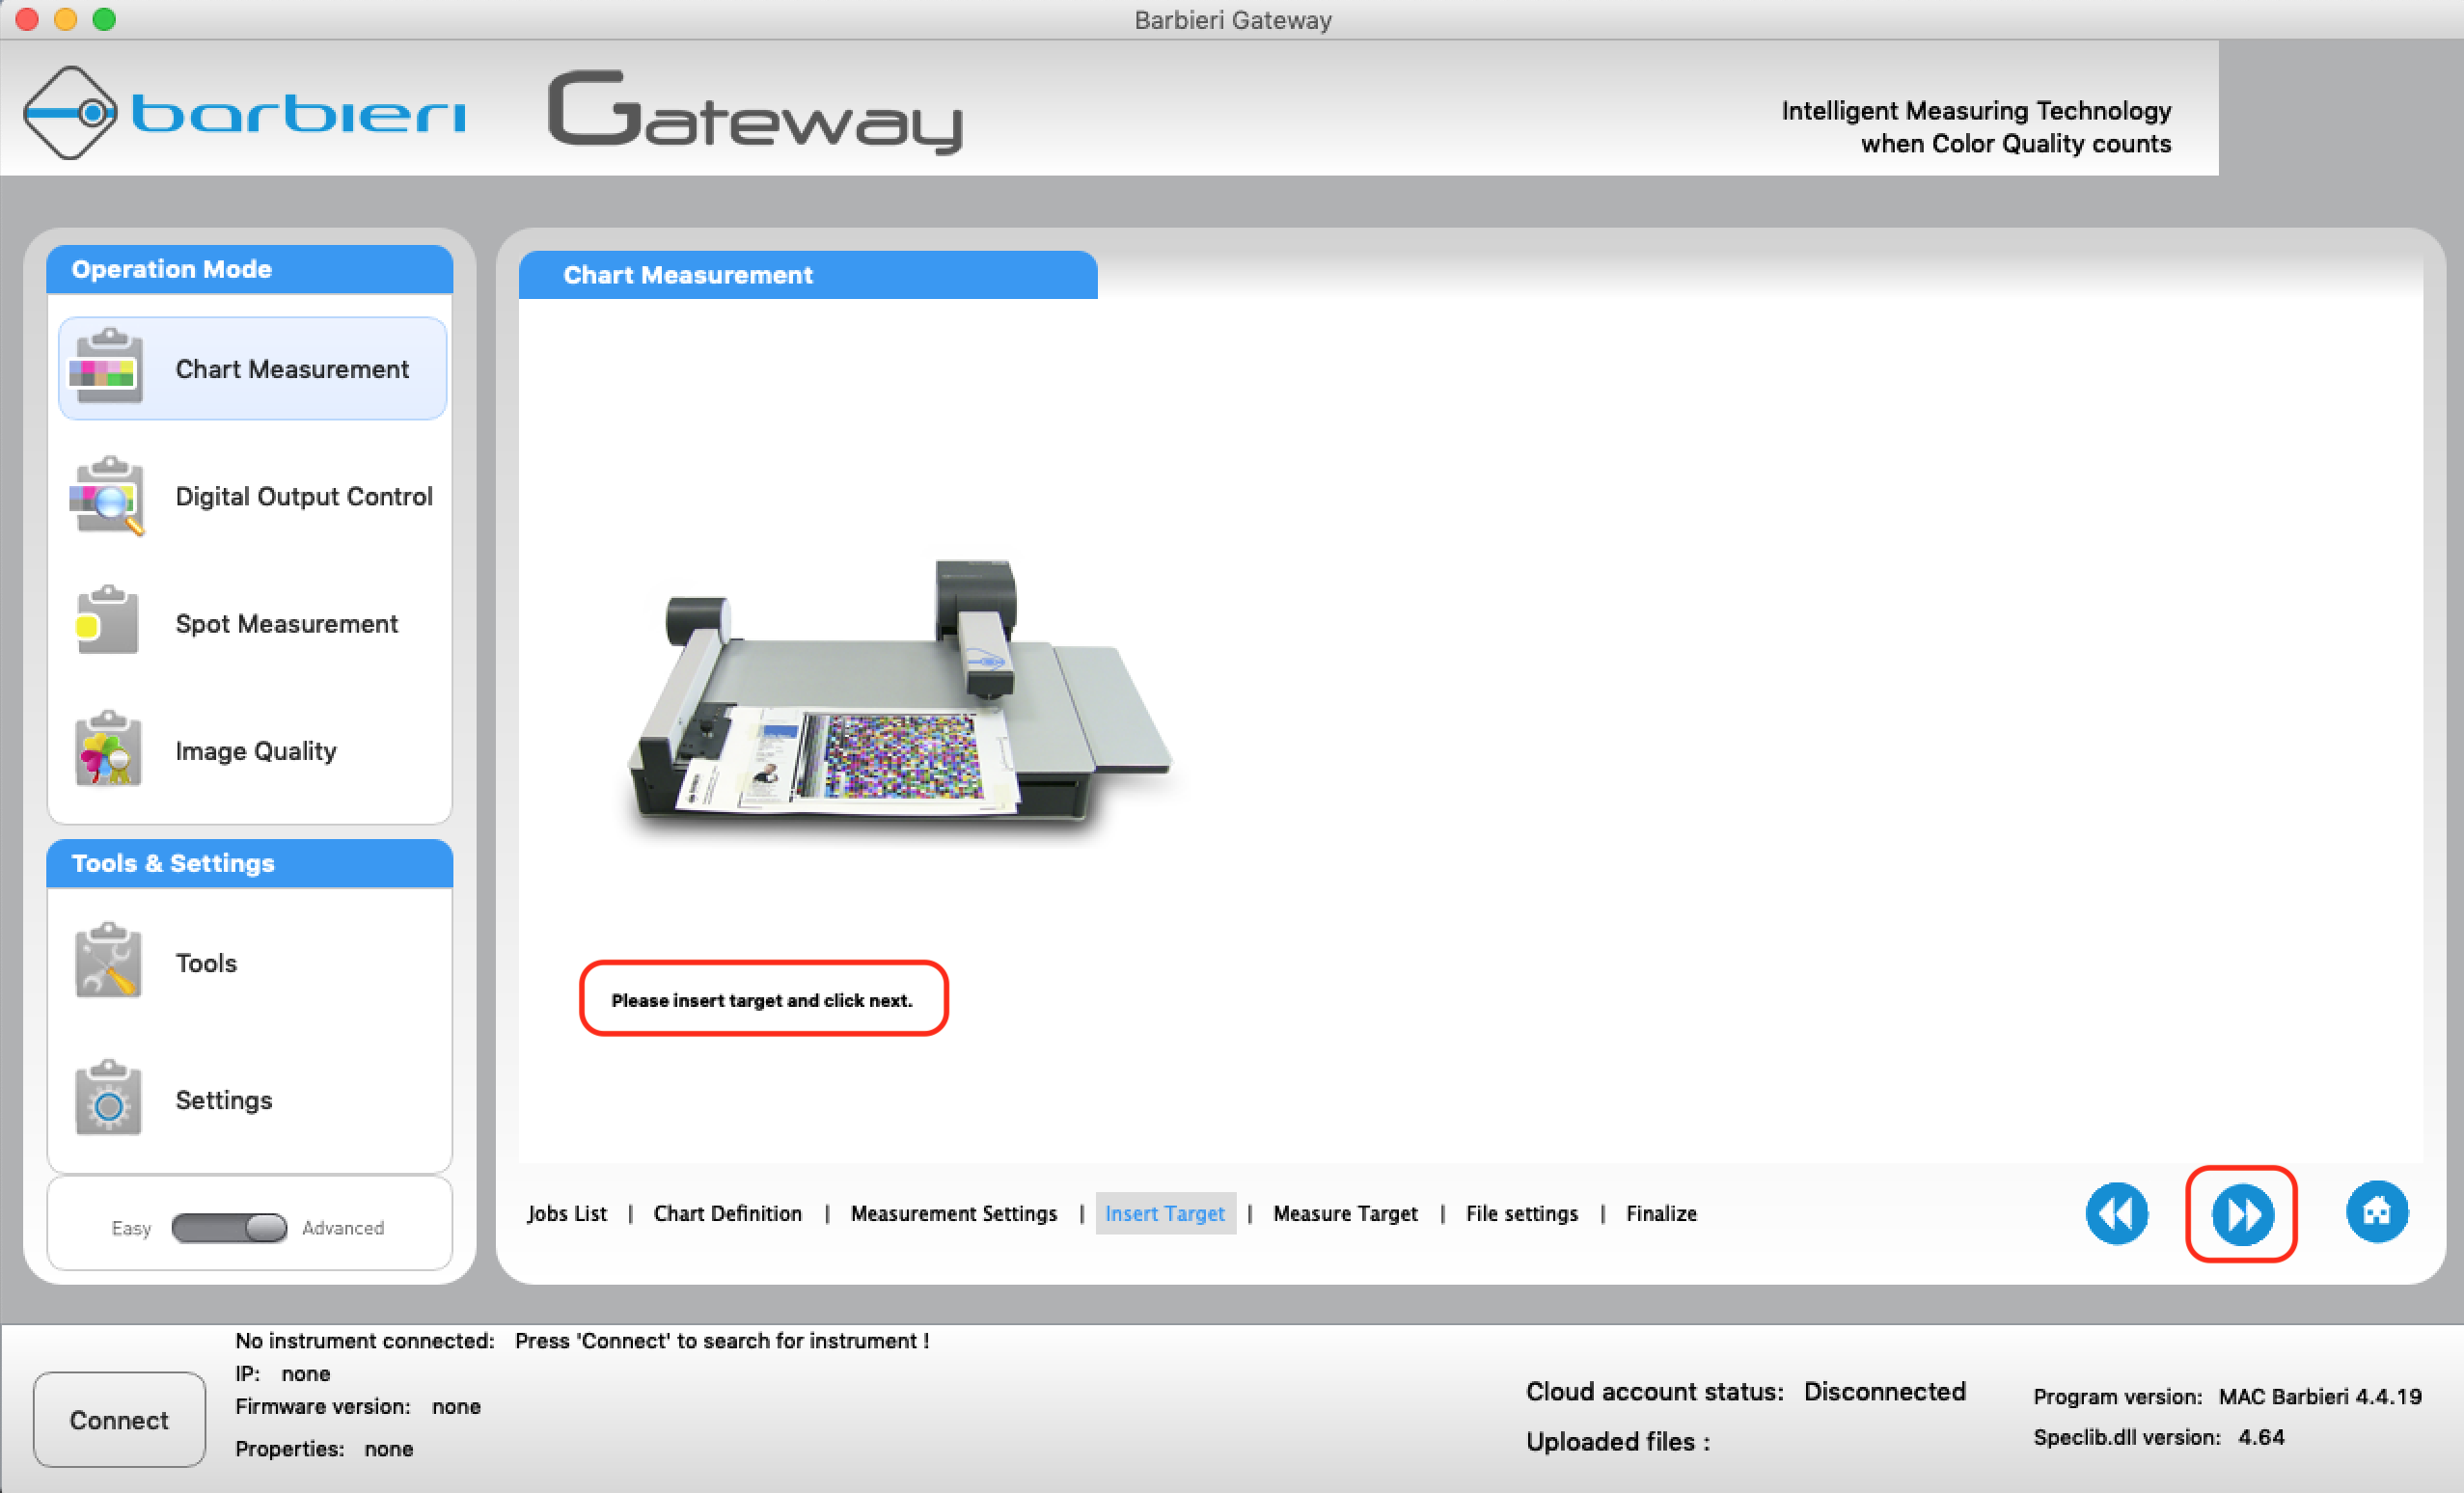
Click on "Start" to start the measurement.
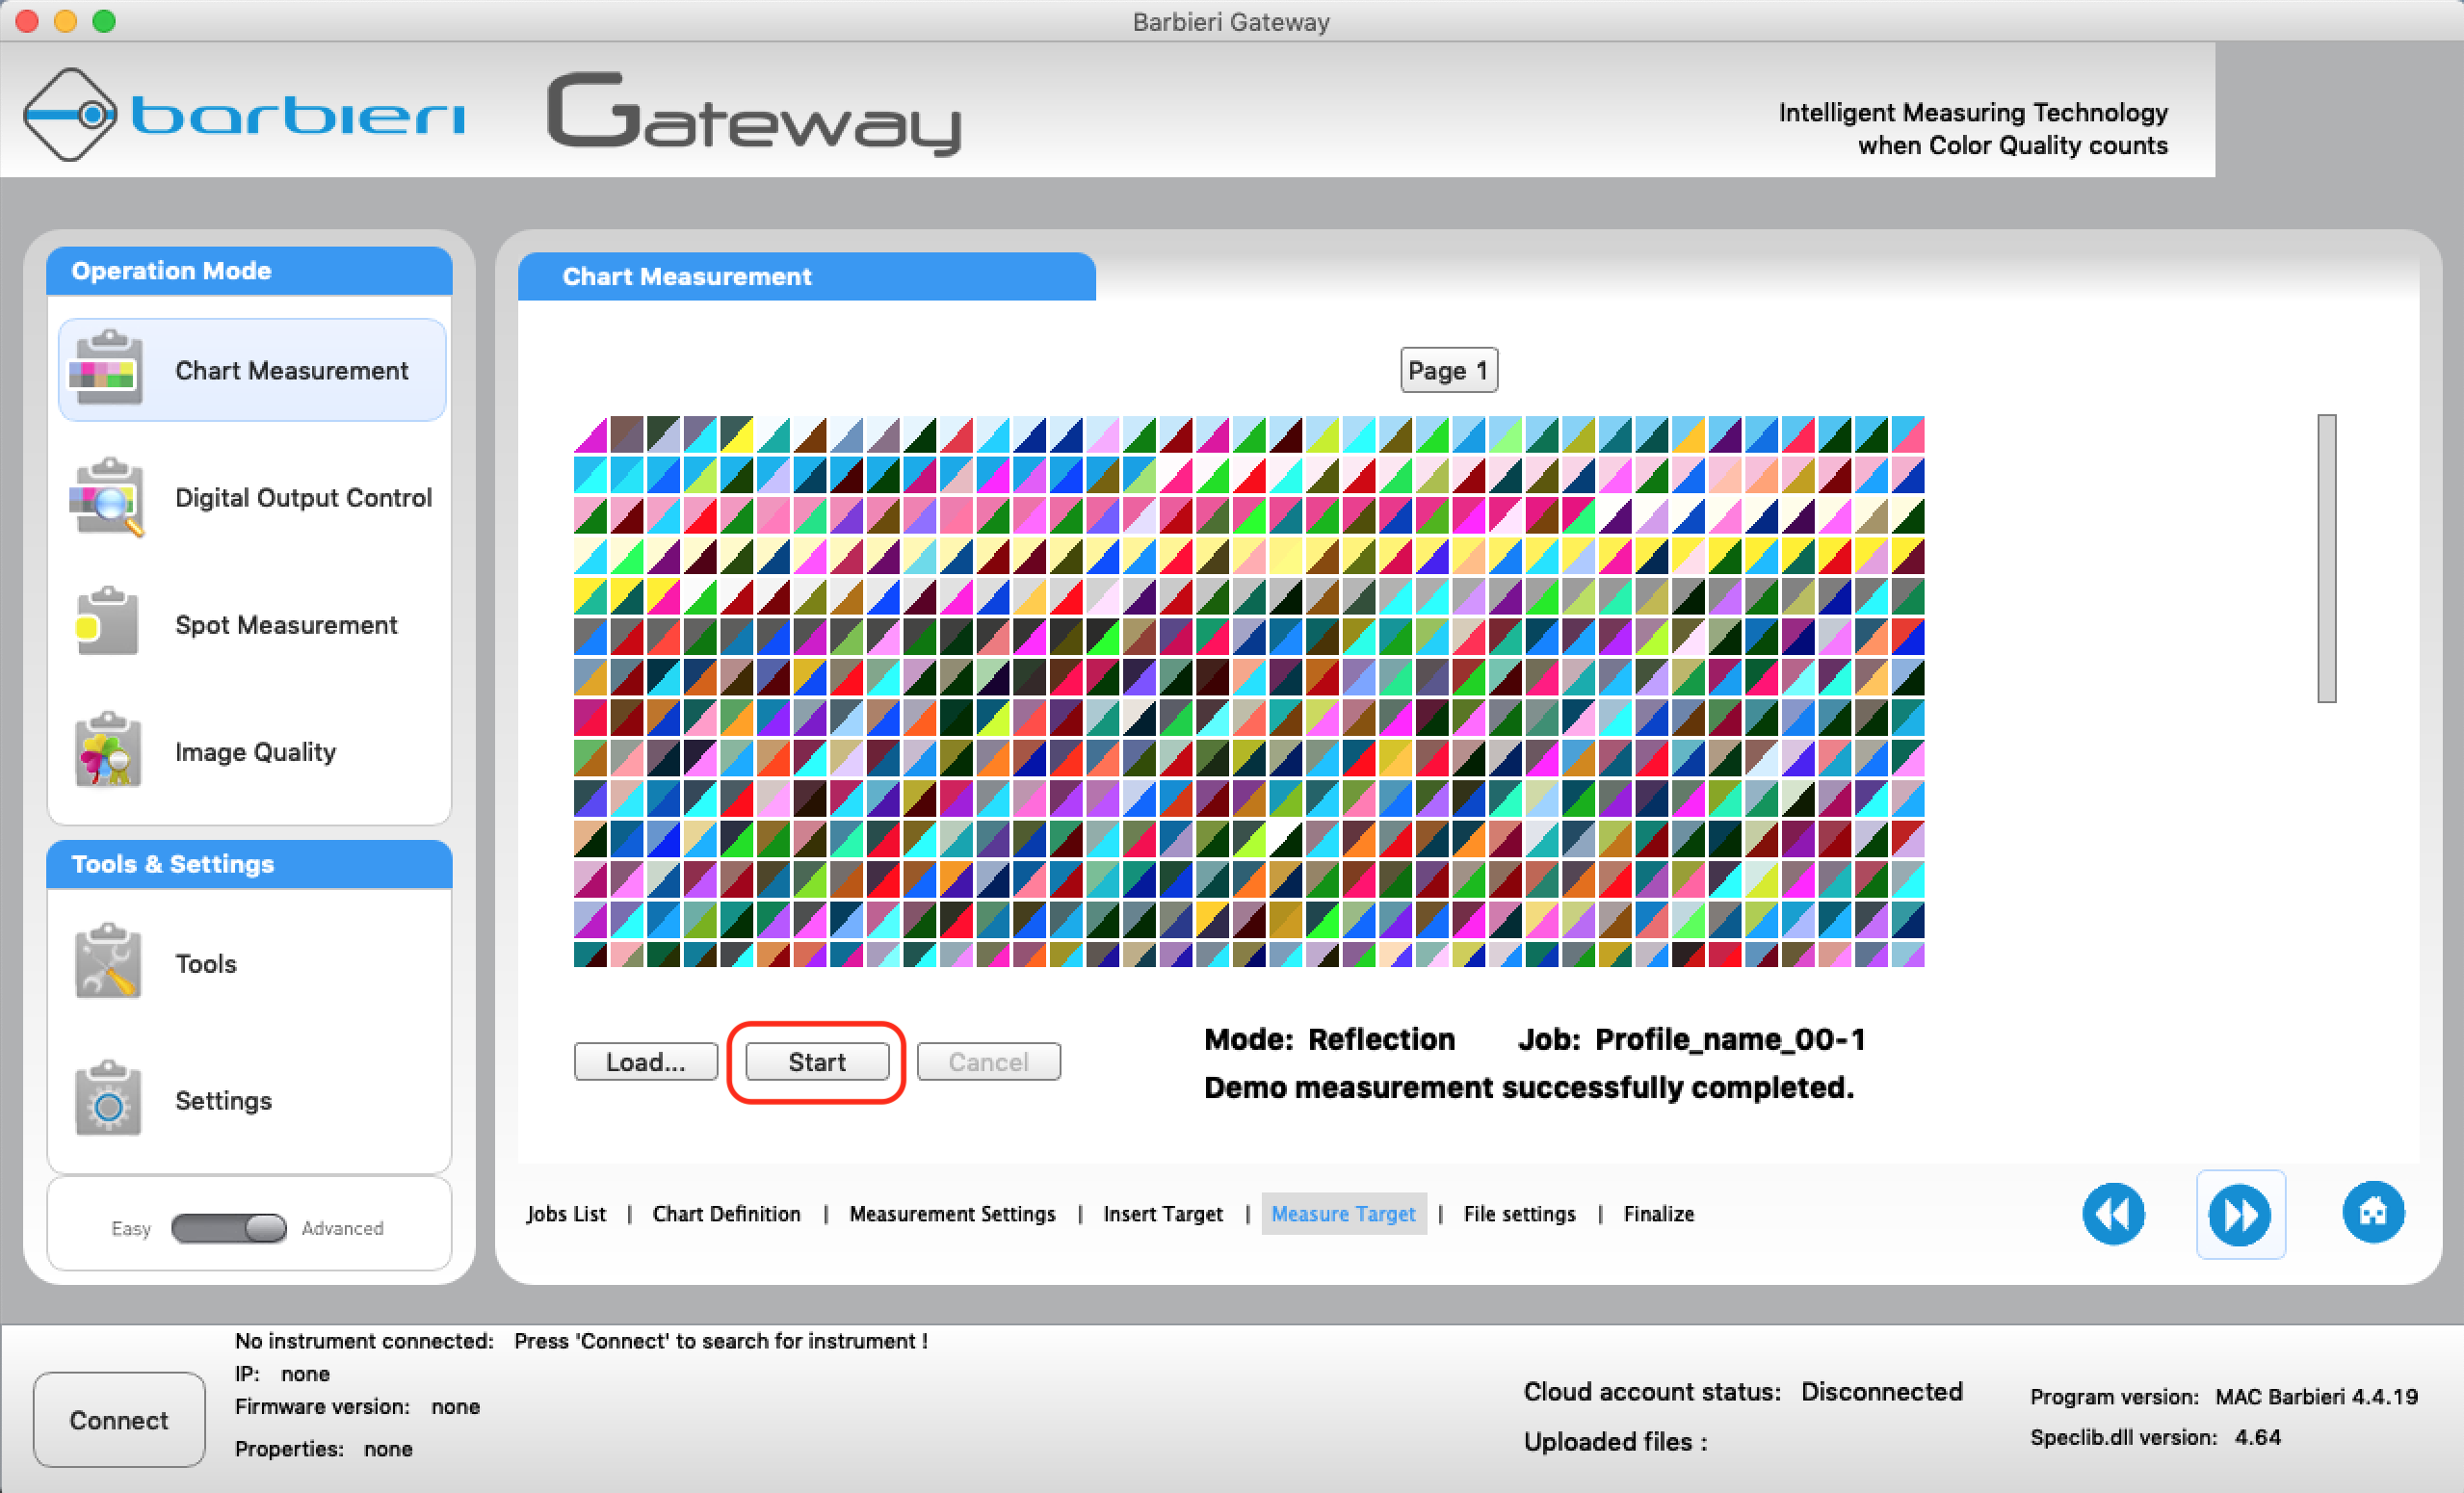
At the end of the measurement, the measured data are stored in the "Measurements" folder
The default path is ../User/.../Documents/Barbieri/Gateway/Chart/Measurements/You can access this folder with the "Browse ..." button.
Import the ".cxf" file into Coraye
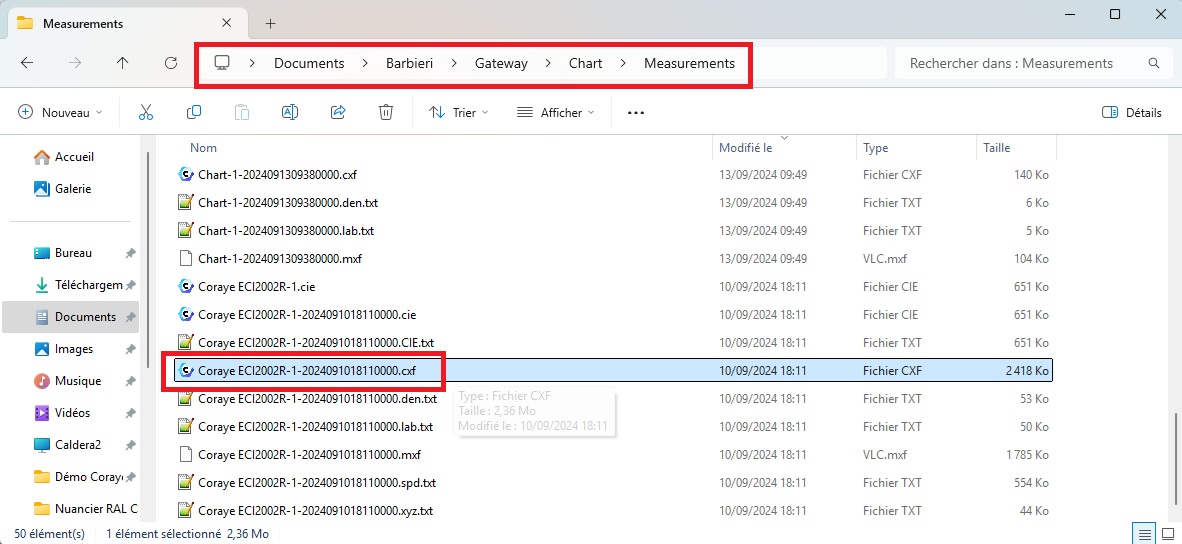
Coraye uses .cxf (Color eXchange Format) files to create an ICC profile from Barbieri's Gateway software
Now click on "Import a reading" in the calibration or characterization procedure and continue to obtain the "cxf" file created by the Gateway software (.cxf).
Once the chart imported into Coraye appears in the left column, click on "Start measurement"

Since the spectrophotometer is not connected, click on "Skip Instrument"
Drag and drop the previously loaded pattern file into the pattern in the middle.
When the green ticks appear on the right of the staff, click on the "Measurement completed" button.

You can find the rest of the procedure in the chapter " Parameters for creating the icc profile " of the tutorial "Creating a profile from a standard test pattern"
For more information, see the chapter: Parameters for creating the icc profile
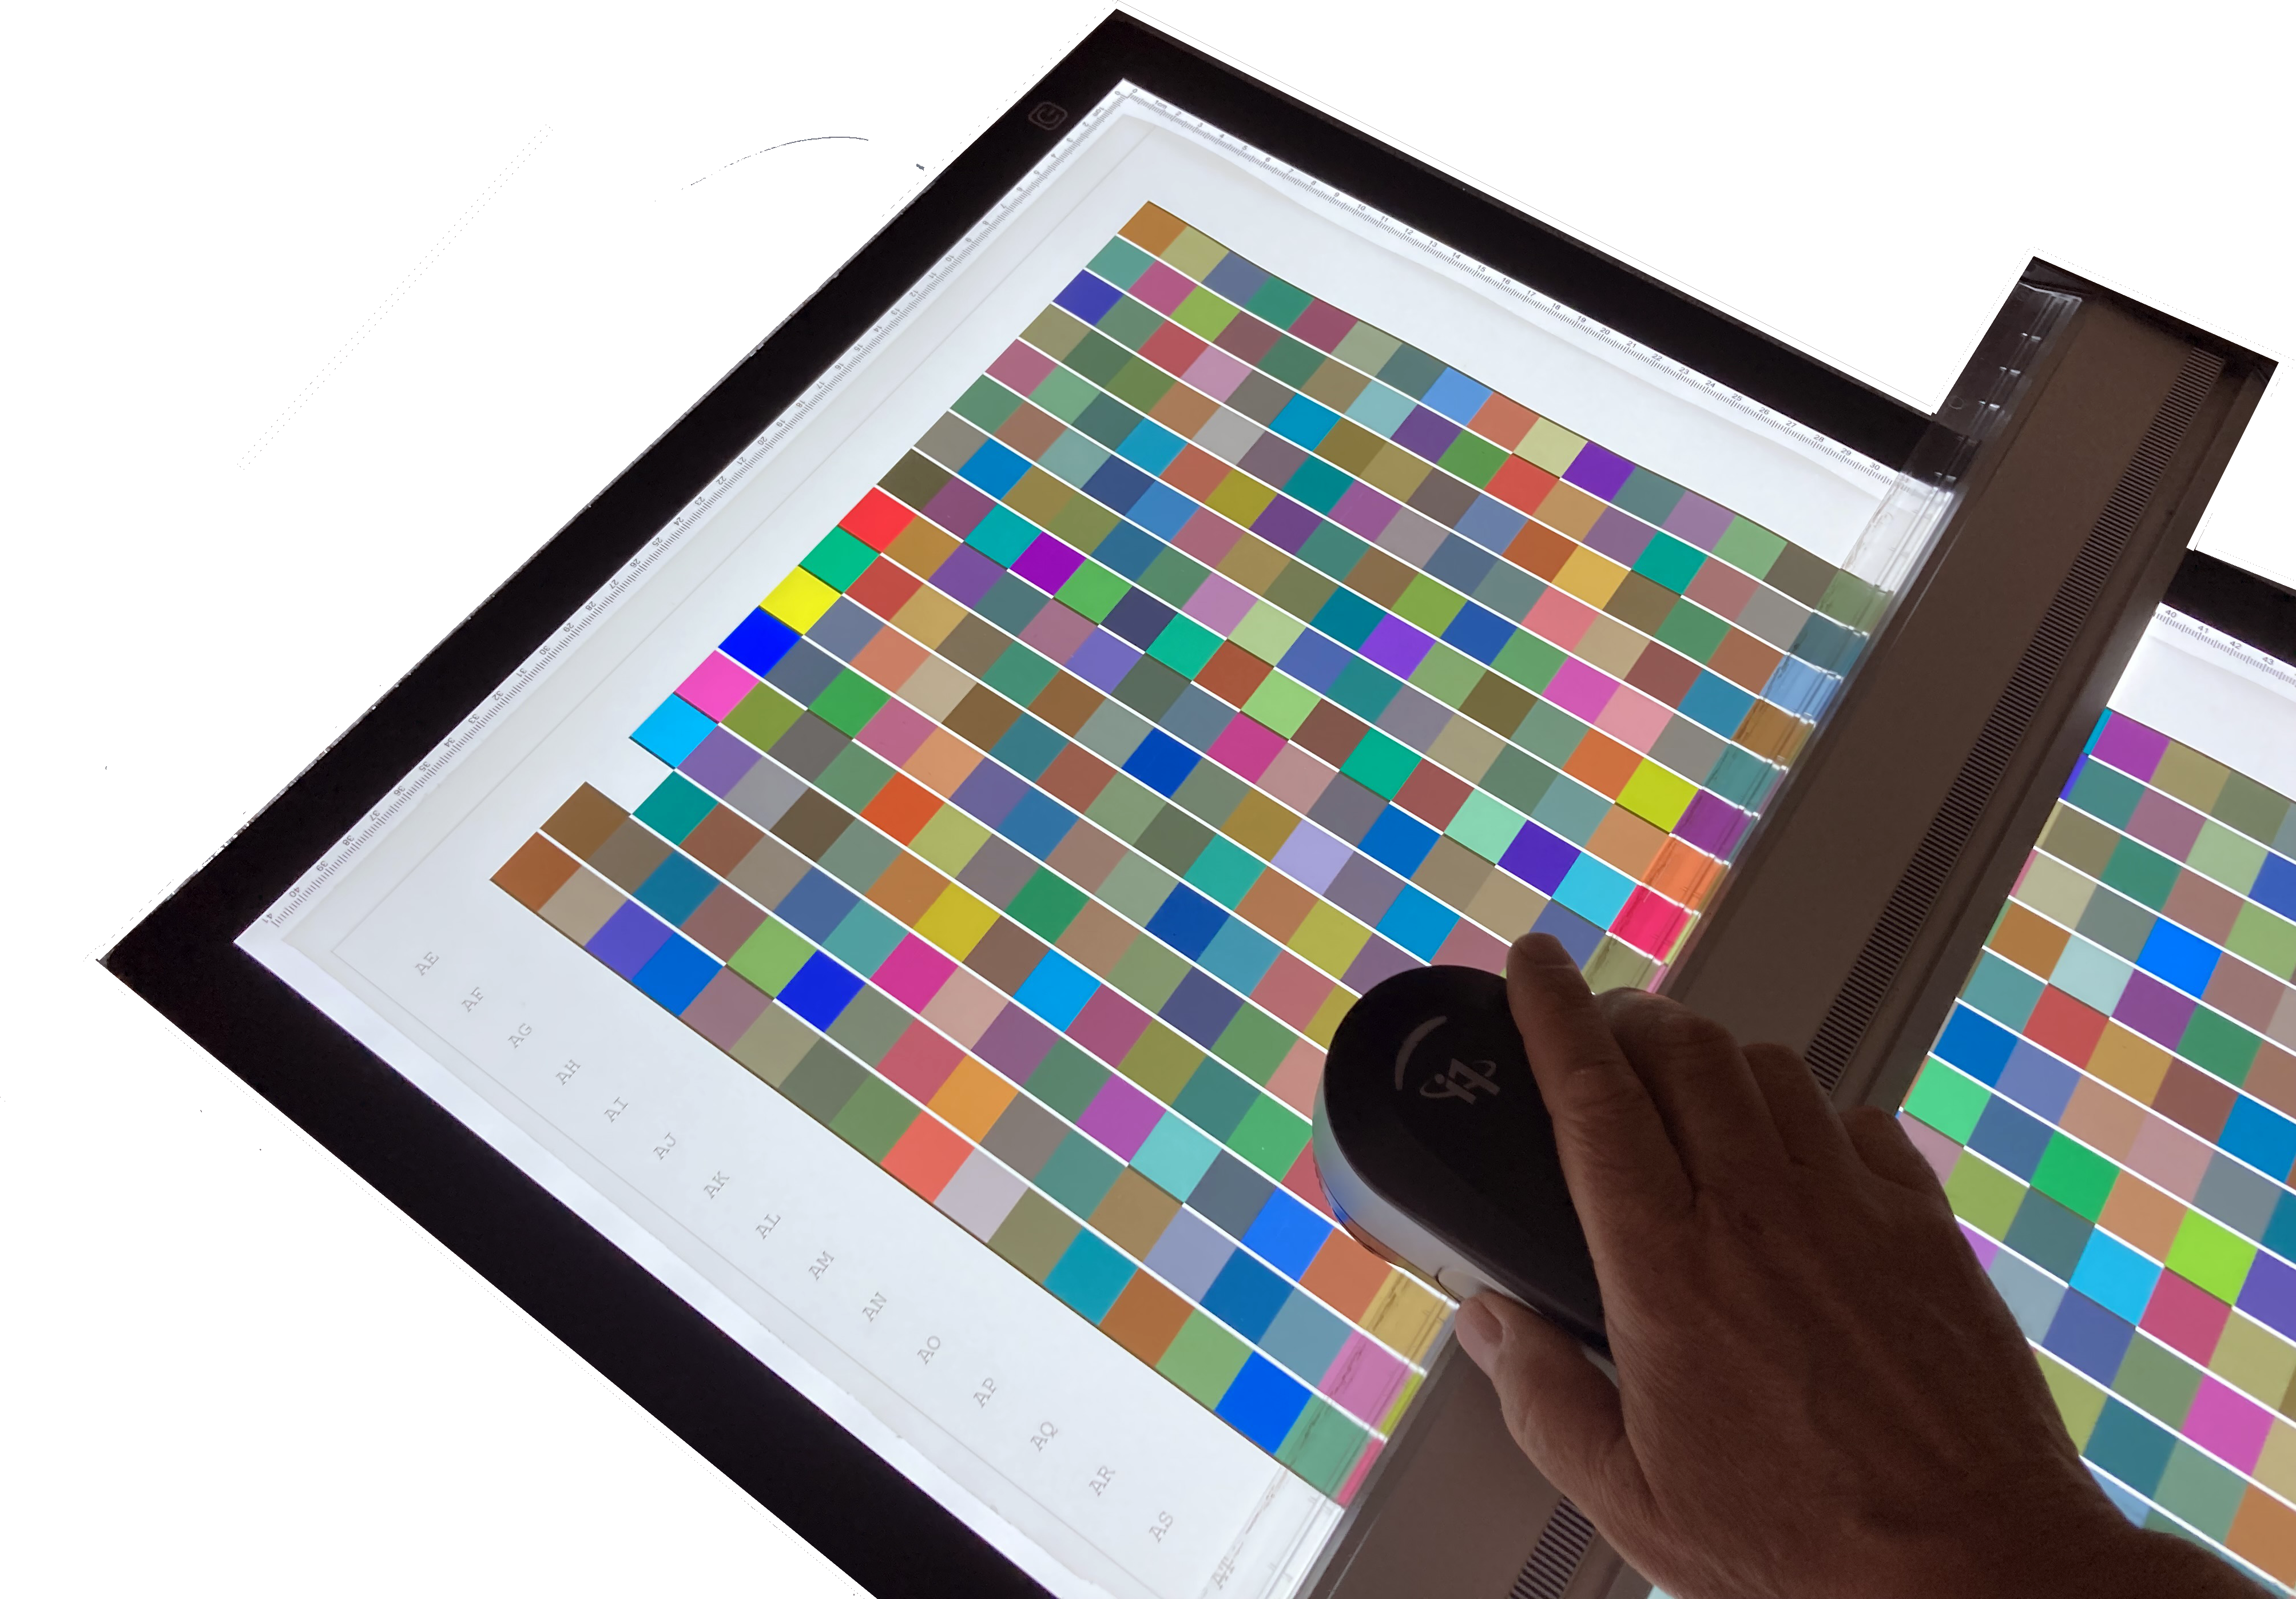
Characterization of a backlit in transparent mode with the I1 Pro 3 + XRite
Here is a more economical, less fragile and more "transportable" alternative solution than the imposing measurement tables offering the reading of scales in transparency mode for the characterization of backlit media for example.
This functionality is available from version 1.31.0 of Coraye
Prerequisites:
- Coraye software RGB Profiler or CMYK Profiler modules
Please note that it is also possible to use this functionality in the Print Control module
- XRite I1 Pro 3 PLUS spectrophotometer
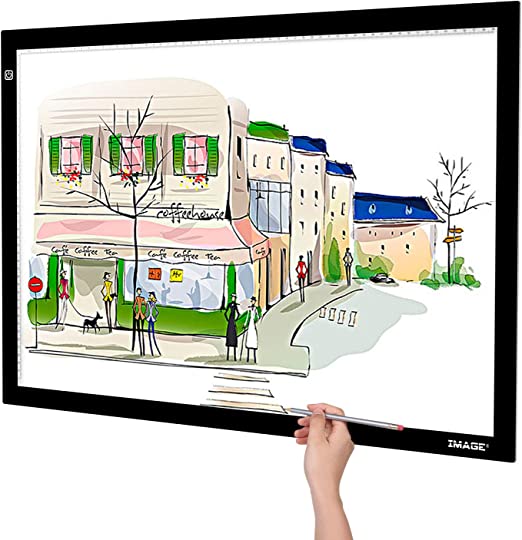
- LED Tracing Light Pad light table in A3 or A2 format
- Printed targets on transparent Backlit type support
Choice of light table:
It is important to choose a homogeneous and sufficiently large light table.
Start of the procedure
In order to avoid rewriting the entire procedure of the RGB Profiler and CMYK Profiler modules, we will assume that you have created and printed the targets on your transparent Backlit support.
We will therefore start this tutorial at the step where we will launch the measurement of the target.
Important: Make sure your spectrophotometer is connected to a USB port directly on your computer and not to a USB hub
The XRite I1 Pro 3 PLUS are powered via the USB port,.
If the power supply from the USB port is not sufficient, the spectro will be recognized, but at the time of calibration the software will go into error.
Note: There is no limitation on the number of patches making up the targets intended to be measured in "transmissive" mode,
IMPORTANT:
To facilitate the measurement of the target in transmissive mode with the I1 Pro 3 +, it is advisable to create sufficiently large patches (20x20 mm) with 4 mm "Auto" separators and a 35 mm stop zone.
If you are using an A3 or A2 light table, you can create targets in 500x600 mm format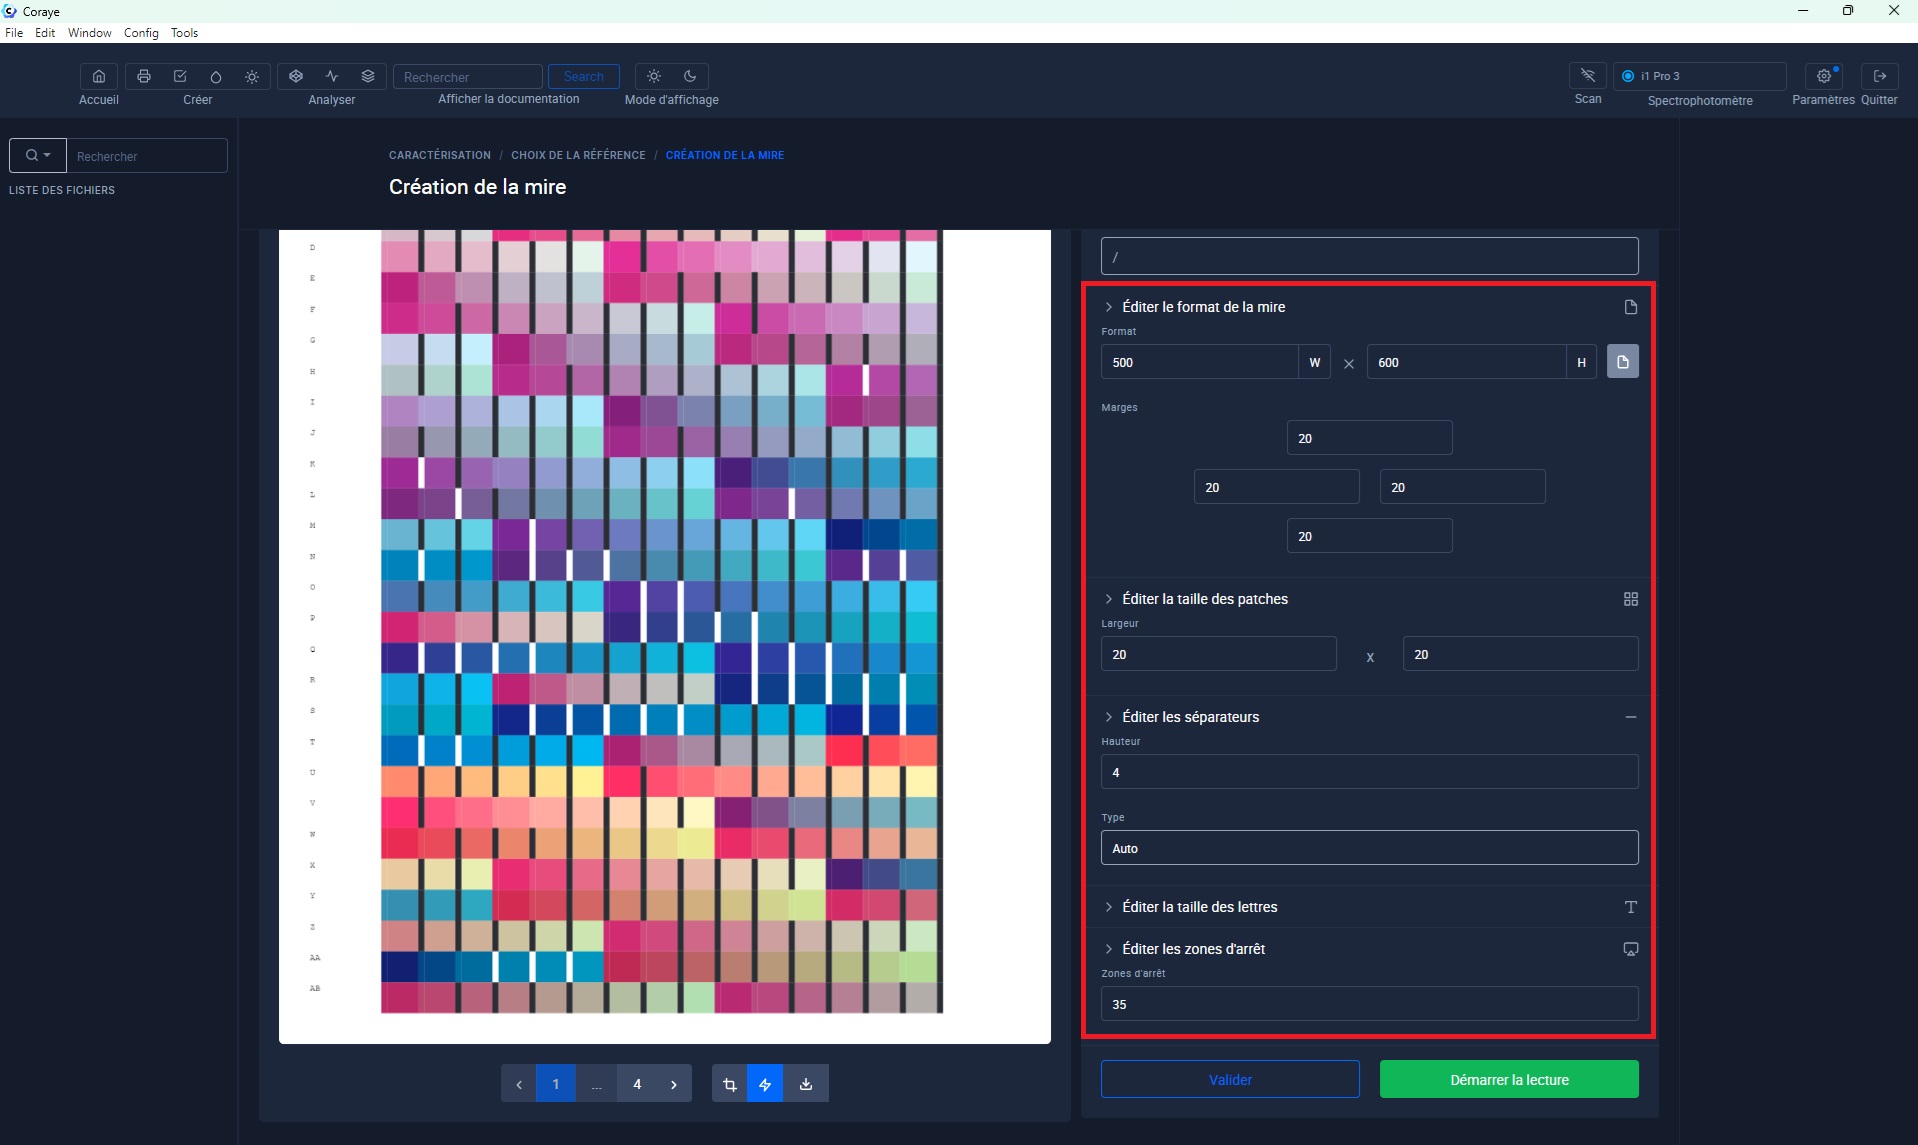
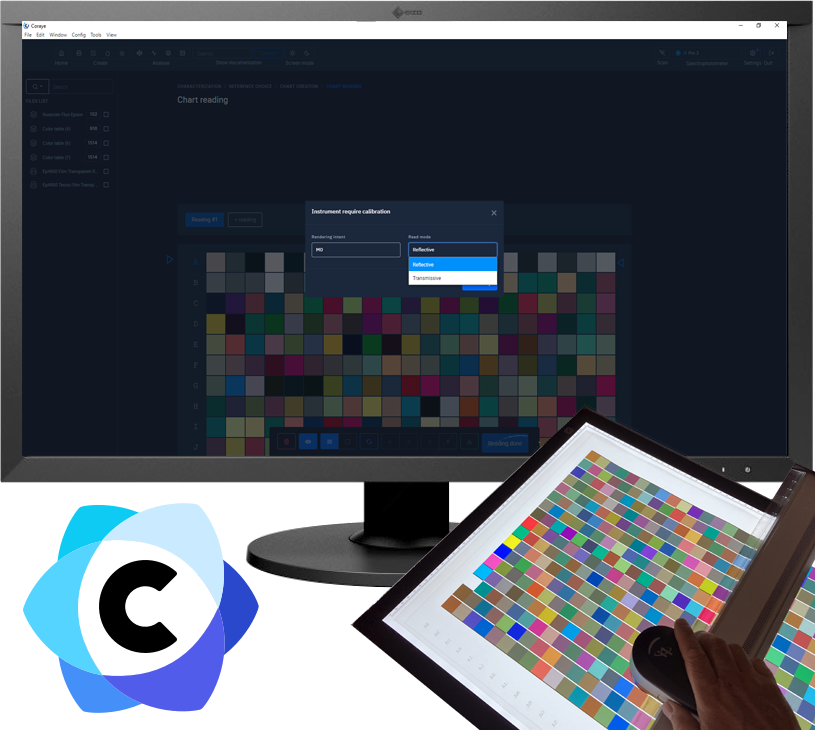
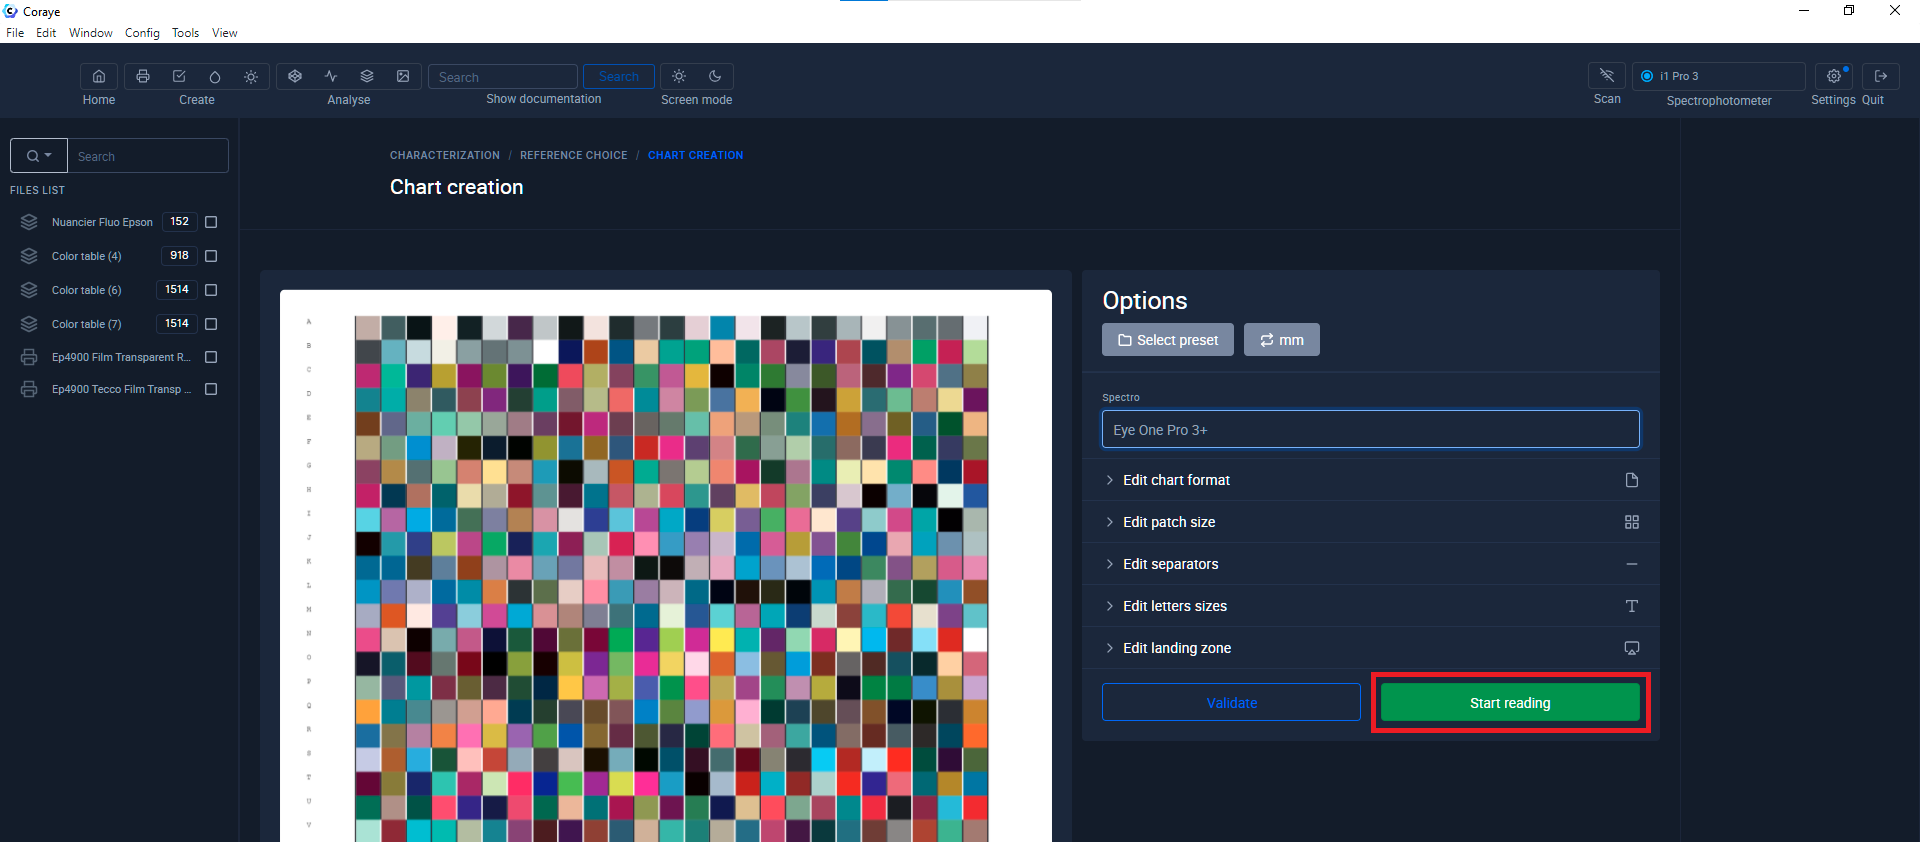
Click the "Start Reading" button
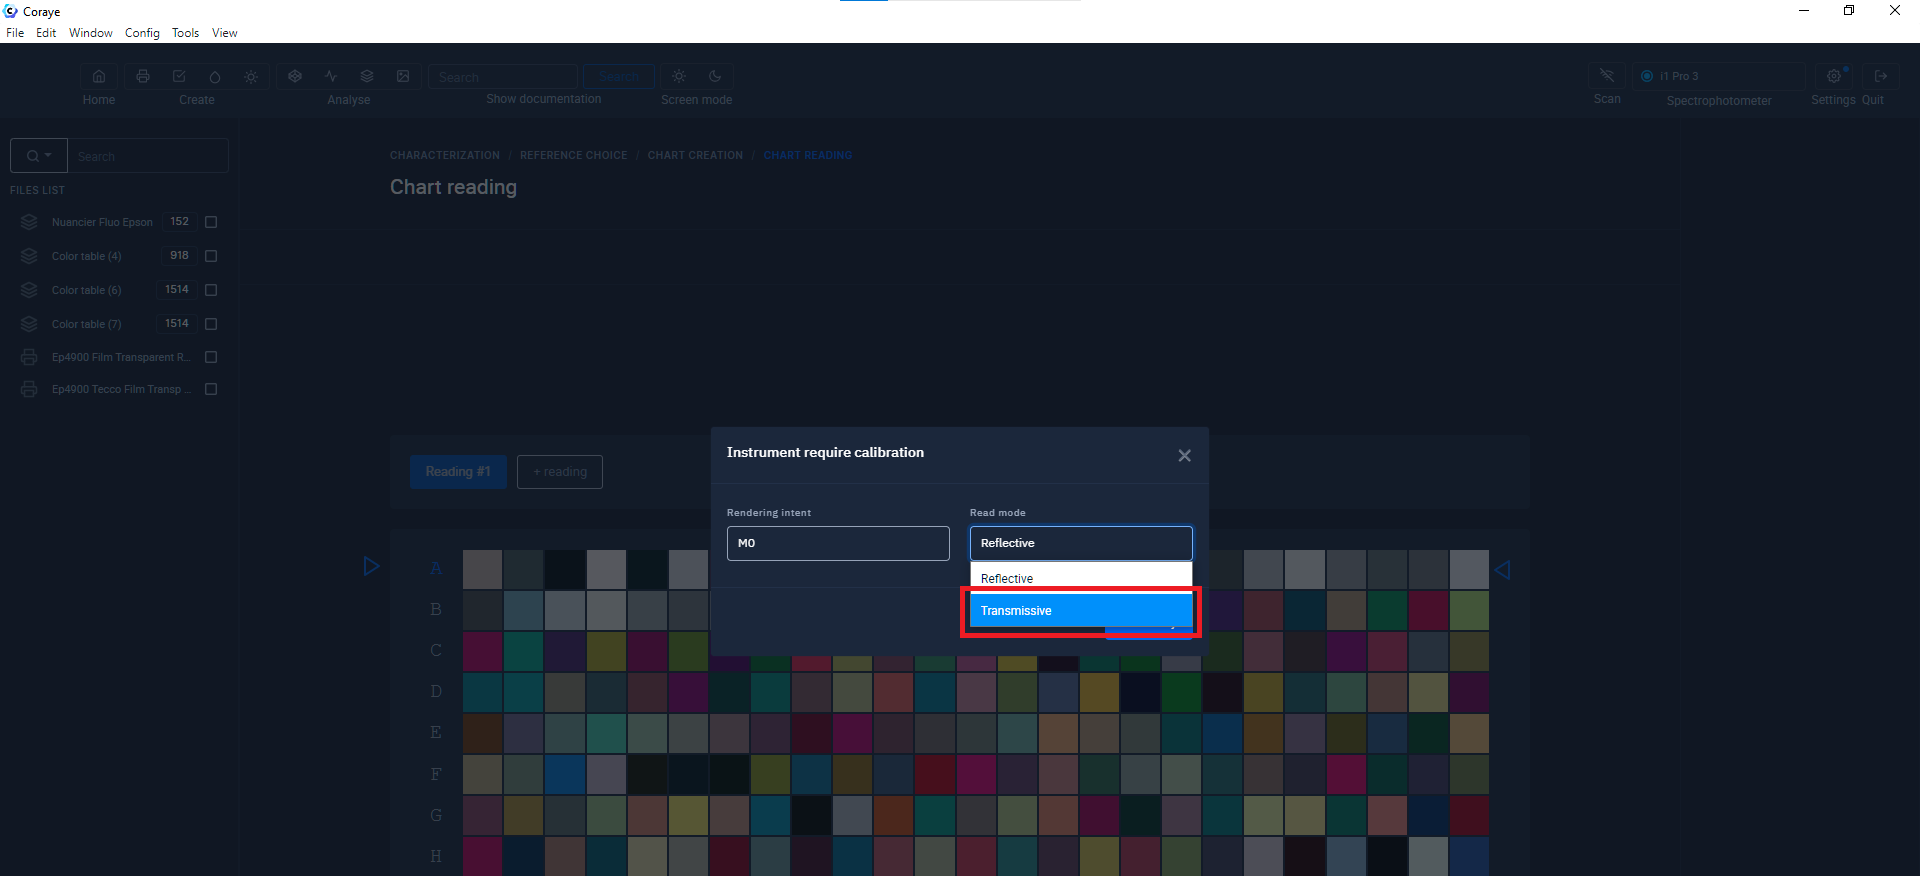
Choice of measurement mode: Transmissive mode"
Calibrating the I1 Pro 3 PLUS spectrophotometer
Before clicking on the "Start calibration" button, position the I1 Pro 3 PLUS on its base.
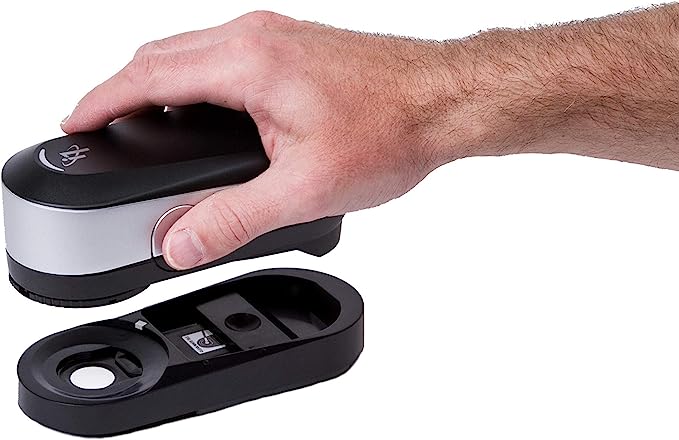
Make sure that the white calibration ceramic is not covered by the protection
Click on the "Start calibration" button
Measuring the illuminant of the light table
This step is important because the value of the light source measured on the table will allow the spectral values to be used as a reference.
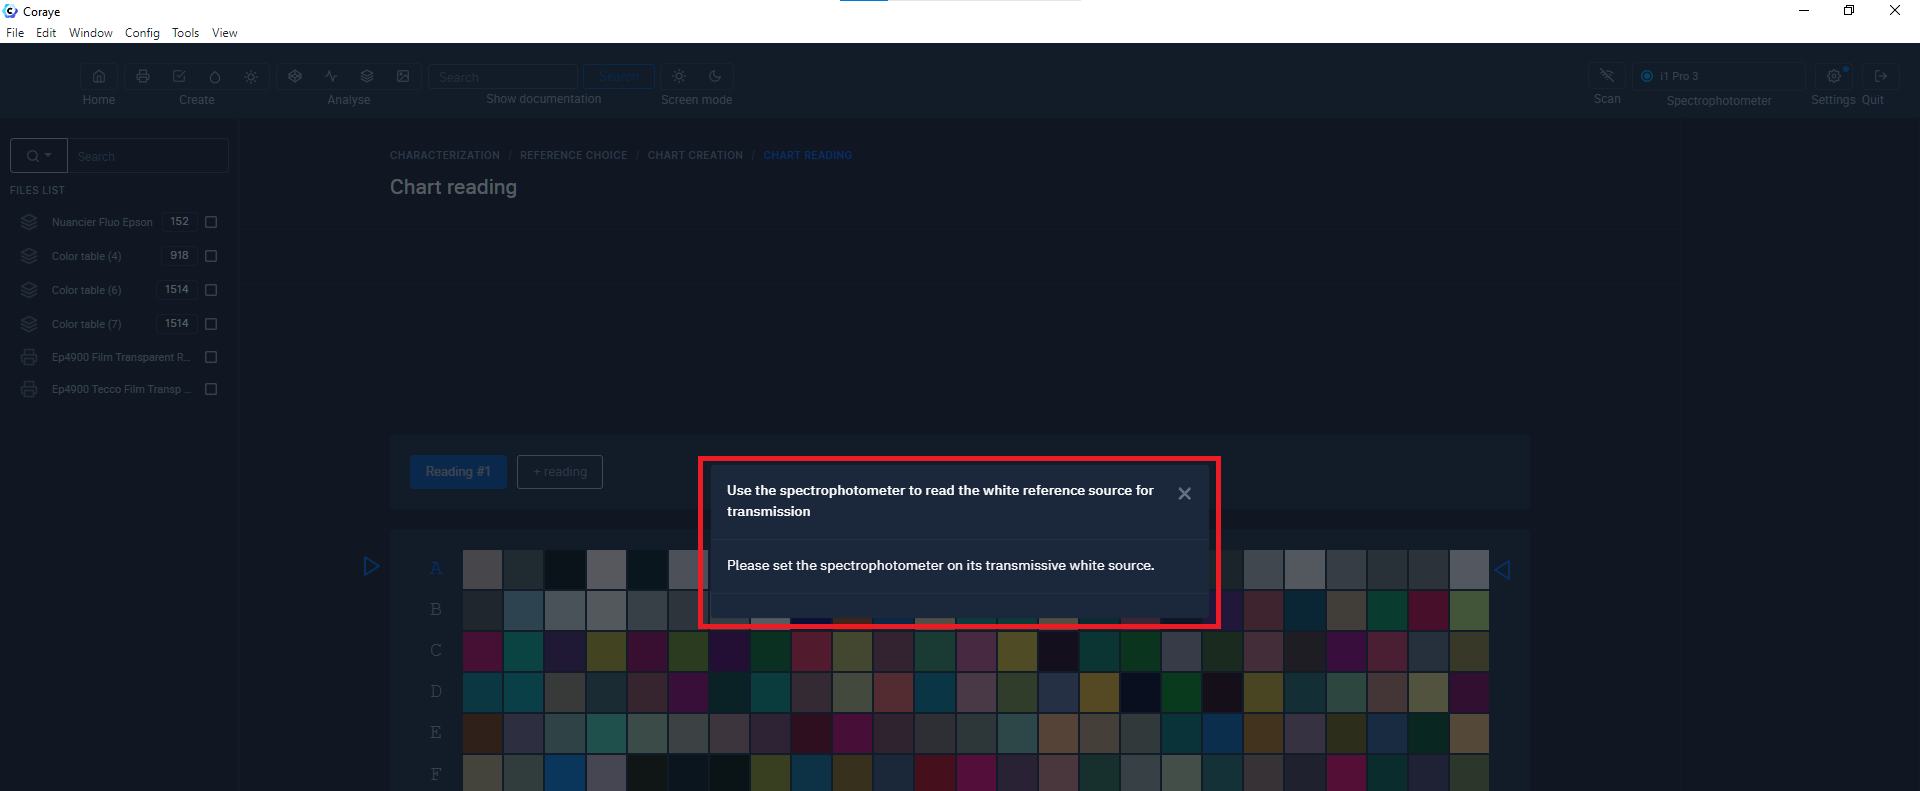
Measure the light table directly with your spectrophotometer.
 Mesure de la lumière de référence
Warning: Do not change the light output of the table after measuring it.
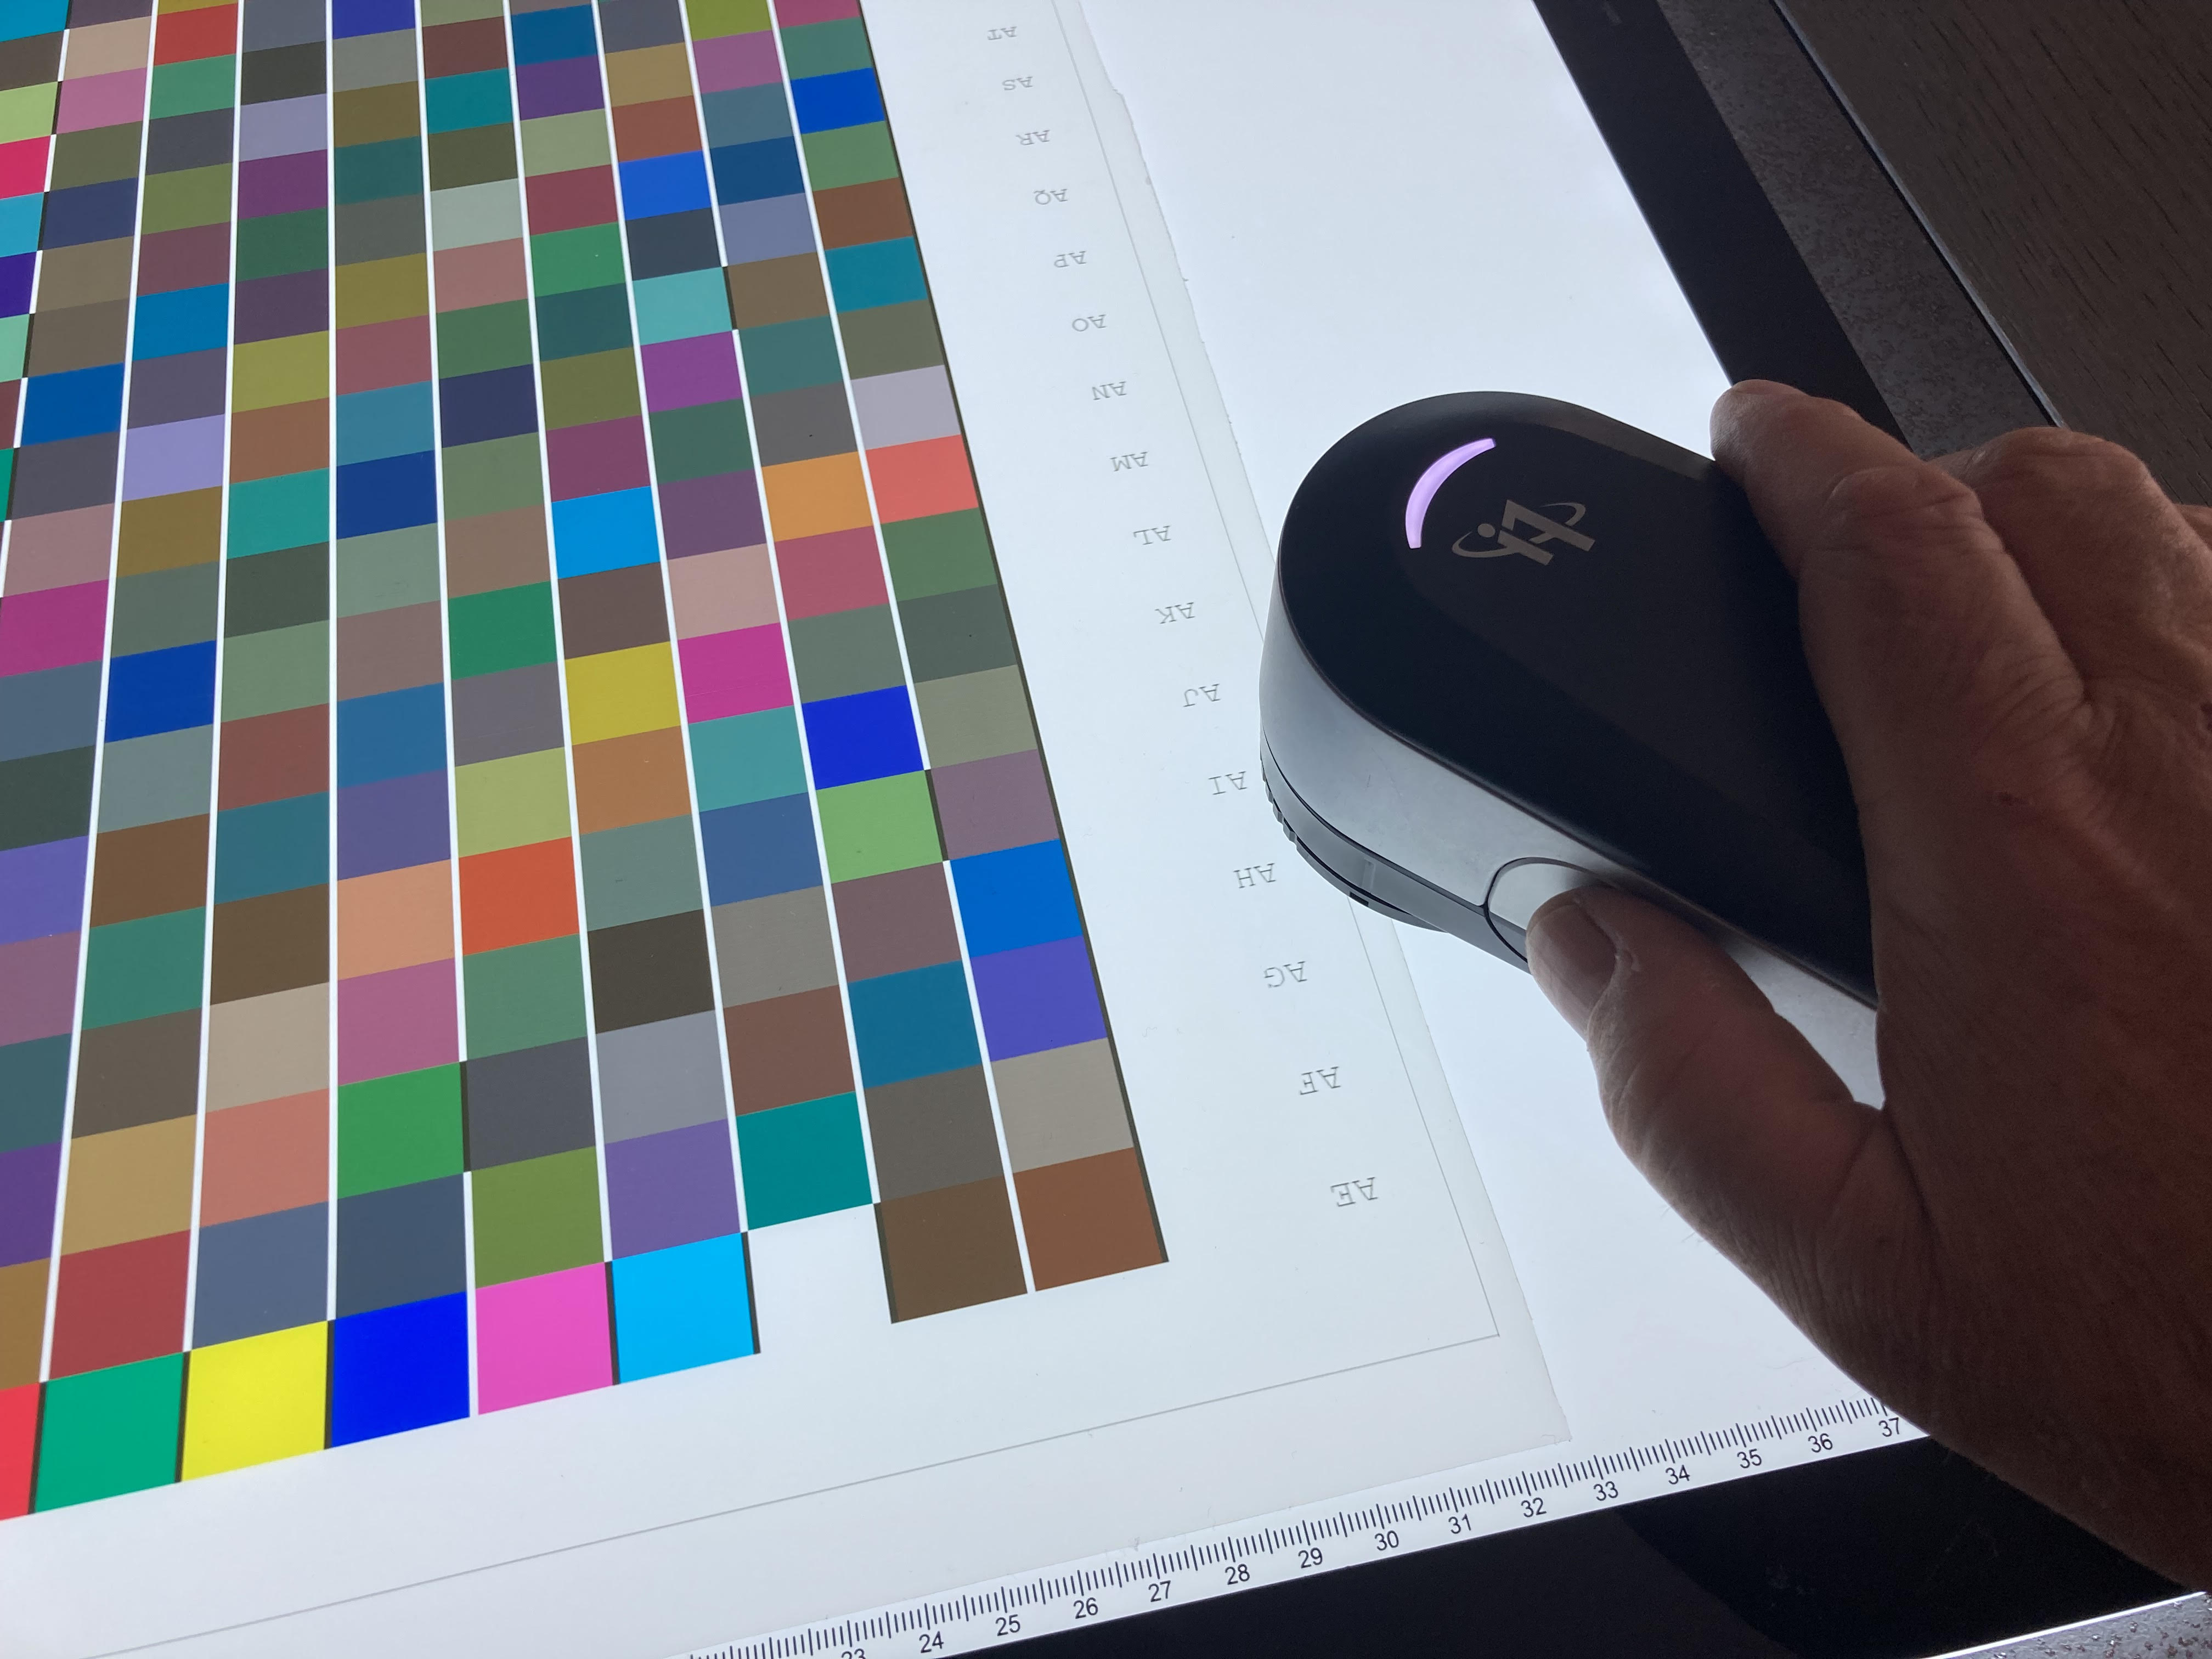
Measuring the target
From now on you can start measuring line by line
Caution! The measurement rate must be slower than for measuring a range measured in reflective mode.
The cadence must be slower than for measuring a target measured in reflective mode.
Calculating the Profile
When the reading of the target is finished, you can resume the normal procedure for creating your ICC profile.